Article

Genome-Wide Characterization of the Phosphofructokinase Gene Family in Arabidopsis thaliana and Functional Analysis of AtPFK2 in Stress Tolerance

Biotechnology Research Institute, Chinese Academy of Agricultural Sciences, Beijing 100081, China
*
Author to whom correspondence should be addressed.
Int. J. Mol. Sci. 2025, 26(14), 6828; https://doi.org/10.3390/ijms26146828
Submission received: 28 April 2025 / Revised: 13 June 2025 / Accepted: 27 June 2025 / Published: 16 July 2025
(This article belongs to the Section Molecular Plant Sciences)

Abstract

The phosphofructokinase (PFK) gene family plays a pivotal role in glycolysis and energy metabolism in plants. This study aimed to systematically characterize the PFK gene family in Arabidopsis thaliana at the genome-wide level and to investigate the function of AtPFK2 (ATP-dependent phosphofructokinase 2) in response to salt and drought stress. Through bioinformatics analysis, 11 AtPFK genes were identified. Phylogenetic analysis revealed that these PFK genes can be classified into two subfamilies: PFK and PFP. Notably, AtPFK2 possesses a unique structure, containing only a single intron, and its promoter is enriched with stress- and hormone-responsive elements, such as ABRE and MBS. T-DNA insertion mutants (pfk2) exhibited slightly shorter roots but slightly higher fresh weight under stress conditions, whereas Arabidopsis lines AtPFK2-overexpressing (OE-PFK2) showed increased stress sensitivity, with inhibited root and leaf growth, leaf wilting, reduced malondialdehyde and chlorophyll content, and enhanced accumulation of proline and soluble sugars. Weighted gene co-expression network analysis (WGCNA) identified 14 stress-related modules, from which six core genes—LBD41, TRP3, PP2-A3, SAUR10, IAA6, and JAZ1—were selected. These genes are involved in glycine metabolism and plant hormone signaling. The results of this study indicate that AtPFK2 mediates stress responses by regulating osmoregulatory substances and hormone signaling pathways, offering new insights into the mechanisms of stress resistance in crops.

1. Introduction

Glycolysis is a fundamental process in cellular respiration and energy metabolism, playing a crucial role under normal physiological conditions and directly contributing to the adaptive regulation of plant responses to abiotic stress. Alterations in the expression of glycolysis-related genes can significantly influence plant tolerance to stress [1,2]. For instance, glycolysis regulates energy supply, the synthesis of osmotic protectants (such as proline and sucrose), and the detoxification of reactive oxygen species (ROS) [3,4,5,6,7]. Within this pathway, phosphofructokinase (PFK) and pyruvate kinase (PK) act as key rate-limiting enzymes, controlling the early and final steps of glycolysis, respectively [8,9,10]. These enzymes ensure cellular energy through the regulation of carbon flux [11]. Notably, the activity of PFK is dynamically regulated under stress conditions, e.g., salt and drought stress can induce the expression of certain plant PFK genes, thereby enhancing carbohydrate accumulation [12,13,14]. Beyond the well-characterized ATP-dependent PFK (EC 2.7.1.11), plants, some prokaryotes, and primitive organisms also possess PPi-dependent PFK (PFP, EC 2.7.1.90), which utilizes pyrophosphate (PPi) as a cofactor [15].
The discovery of these enzymes dates back to 1975, when Latzko and Kelly [16] first identified the chloroplast and cytosolic isoforms of PFK in spinach. Since then, substantial progress has been made in studying various ATP-dependent PFK isoforms in plants [9]. For example, spinach cytosolic PFK can be activated by phosphate, whereas the chloroplast isoform is slightly inhibited by it [17,18,19,20,21]. In 1979, a PPi-dependent PFK was isolated from pineapple leaves, laying the groundwork for PFP research in plants [22,23].
PFK plays a central role in plant growth and development, especially in regulating the allocation and utilization of photosynthetic products. Carbohydrates produced through photosynthesis require precise regulation by PFK to be properly distributed to different tissues and organs, supporting energy and carbon needs for processes like growth, flowering, and fruiting [24]. Moreover, in response to abiotic stress, PFK may enhance plant adaptability through several pathways: (1) osmotic regulation, promoting the conversion of fructose-6-P into osmotic protectants such as sucrose to alleviate cellular dehydration; (2) energy supply, maintaining ATP production when mitochondrial function is compromised; (3) redox balance, providing NADPH through glycolytic bypasses to neutralize ROS [5,25,26,27]. Notably, PFP, by utilizing PPi rather than ATP to catalyze reactions, may provide crucial metabolic flexibility under energy-limited stress conditions [28,29,30].
The whole-genome sequencing of the model plant Arabidopsis thaliana has provided an ideal platform for gene function research [31,32]. In recent years, studies on the PFK gene family in Arabidopsis have included analyses of enzyme activity, subcellular localization, and spatiotemporal expression patterns [8]. It has been found that the in vitro enzyme activity of AtPFK2 and AtPFK5 is significantly lower than that of other isoenzymes [15], and AtPFK5 is regulated by plastid thioredoxin-f-dependent redox regulation. Although the redox sensitivity of AtPFK5 has been established, the precise function of AtPFK2 under stress conditions remains unclear [15]. In this study, the salt treatment concentration and duration were determined based on previous research findings and preliminary experiments conducted with different concentrations. Previous studies have commonly used various concentrations of sodium chloride (NaCl) to simulate salt stress in plants [33].
The Arabidopsis PFK gene family comprises several members, which may exhibit functional redundancy or specificity. Therefore, a thorough analysis of its genomic organization, evolutionary history, and regulatory mechanisms is essential for understanding its biological functions. Traditional experimental methods, such as single-gene cloning and phenotype analysis, are difficult to apply on a genome-wide scale for identifying all members of a gene family systematically [34]. Recently, bioinformatics approaches have emerged as powerful tools for studying gene family evolution, structure, and function [35,36,37]. In this study, bioinformatics techniques were employed to systematically explore the Arabidopsis PFK gene family, identifying all its members and analyzing their gene structures, conserved domains, phylogenetic relationships, and cis-regulatory elements in the promoter region. Combining genetic and physiological experiments, this study focused on investigating the response of AtPFK2 to drought and salt stress, confirming its role in enhancing plant stress tolerance.

2. Results

2.1. Identification of the Phosphofructokinase (PFK) Gene Family in Arabidopsis thaliana

We identified the entire PFKs gene family in the Arabidopsis thaliana genome using BLASTP1.4.0 and HMMER3.1 software, followed by domain analysis to validate the proteins’ identities. A total of 11 PFK proteins containing the PFK domain (PF00365) were found, including AtPFK1-AtPFK7, AtPFPA1, AtPFPA2, AtPFPB1, and AtPFPB2 (Table 1). Bioinformatics analysis revealed substantial diversity in the physicochemical properties of these proteins. The amino acid lengths of these 11 proteins ranged from 444 residues (AtPFK2) to 617 residues (AtPFPA2), corresponding to molecular weights ranging from 49.2 kDa (AtPFK2) to 67.2 kDa (AtPFPA2). The isoelectric point (pI) values varied widely, ranging from 5.44 (AtPFPB2) to 8.46 (AtPFK4), with 7 of the proteins having pI values between 6.0 and 7.0. Stability analysis of the proteins revealed instability indices ranging from 29.2 (AtPFK2) to 42.07 (AtPFPA2), indicating differences in their stability profiles within cellular environments. Hydrophobicity analysis showed that the aliphatic indices ranged from 83.95 for AtPFPB2 to 94.38 for AtPFPA1, while the grand average of hydropathicity (GRAVY) values ranged from −0.27 for AtPFPB2 to −0.076 for AtPFPA1. These differences suggest that the solubility and functional efficiency of the PFK proteins may be modulated by their distinct hydrophilic and hydrophobic characteristics (Table 1). Chromosomal localization analysis revealed that the PFK family members are distributed across chromosomes 1, 2, 4, and 5 in A. thaliana. This pattern of distribution may be linked to functional diversification and evolutionary adaptation within this enzyme family. Subcellular localization predictions indicated that the PFK proteins are primarily localized in the cytoplasm, chloroplasts, and mitochondria (Table 1), reflecting the proteins’ functional versatility in cellular metabolism.

2.2. Phylogenetic Analysis of PFK Proteins in Arabidopsis thaliana

To investigate the evolutionary relationships within the PFK gene family in Arabidopsis thaliana, we constructed a phylogenetic tree using the Neighbor-Joining (NJ) method. We performed a comparative analysis of PFK protein sequences from A. thaliana, Oryza sativa (rice), Vitis vinifera (grape), Glycine max (soybean), Brassica rapa (Chinese cabbage), and Brassica napus (rapeseed) through multiple sequence alignment. This provided the foundation for constructing the phylogenetic tree. The analysis revealed that the A. thaliana PFK proteins can be classified into two subfamilies: PFK and PFP. The PFK subfamily exhibits greater diversity in terms of members and functional variation, whereas the PFP subfamily is relatively conserved with fewer members. Comparative analysis showed that the PFK subfamily varies in size across species. In O. sativa (rice) and V. vinifera (grape), the subfamily contains six members, while in A. thaliana, there are seven members. In contrast, the PFK subfamily is notably expanded in G. max (soybean) with 20 members, B. rapa (Chinese cabbage) with nine members, and B. napus (rapeseed) with 21 members. The PFP subfamily remains relatively consistent in A. thaliana, O. sativa, and V. vinifera, but shows significant expansion in B. napus (10 genes) and G. max (8 genes) (Figure 1, Table 2).
Further examination of the PFK subfamilies revealed that the PFK1 family is the largest, with a total of 18 members (11 in soybean, 2 each in grape and rapeseed, and 1 each in rice, cabbage, and Arabidopsis). The PFK5 family consists of 15 members in total (4 in rapeseed, 3 each in rice and cabbage, 2 each in soybean and grape, and 1 in Arabidopsis). The PFK4 family contains 10 members (6 in soybean, 2 in rapeseed, 1 each in grape and Arabidopsis, and none in cabbage or rice). The PFK7 family has 9 members (6 in rapeseed, 2 in cabbage, 1 in Arabidopsis, and none in soybean, grape, or rice). The PFK2 family has 7 members in total (2 in rapeseed, and 1 each in soybean, grape, rice, cabbage, and Arabidopsis). The PFK3 and PFK6 families are relatively smaller, with 5 members each. PFK3 has 3 members in rapeseed, 1 in Arabidopsis and cabbage, and none in soybean, grape, or rice. PFK6 has 2 members in rapeseed, and 1 each in cabbage, rice, and Arabidopsis, with none in soybean or grape (Figure 1, Table 2). Notably, we found that the PFK2 protein family consists of a single member in most species, except for rapeseed, which contains two PFK2 proteins. This remarkable conservation of PFK2 across species suggests that it has undergone strong purifying selection during evolution, maintaining a relatively stable structure and function. The exceptional conservation of PFK2 highlights its potential as a core metabolic regulator in plants. These findings provide essential insights into the evolutionary history of the Arabidopsis PFK gene family and offer a valuable theoretical framework for understanding its role in plant metabolic regulation.

2.3. Motif and Gene Structure Analysis of the PFK Gene Family in Arabidopsis thaliana

Using the MEME suite, we conducted a conserved motif analysis of the Arabidopsis thaliana PFK protein sequences and identified 10 evolutionarily conserved motifs. These motifs displayed variable distribution patterns across the PFK members (Figure 2A,D). All members of the PFP subfamily contained 6 motifs and lacked motifs 5, 6, 7, and 8. In contrast, the PFK subfamily members, except for AtPFK5, which lacks motifs 7 and 8 and contains 8 motifs, all contained all 10 motifs. Notably, the C-terminal regions of the proteins exhibited higher sequence conservation, with motif 2 consistently localized in this region across most proteins. On the other hand, the N-terminal regions showed relatively lower conservation (Figure 2A,D). To further investigate the functional relevance of these motifs, we compared the 10 identified motifs with known domain databases (Pfam and InterPro). We found that, except for motifs 9 and 10, which did not match any sequences, the remaining motifs corresponded to known domains, including the phosphofructokinase A-type (PFKA) and phosphofructokinase superfamily (PFK_sf) (Table 3). Structural modeling using Phyre2 revealed varying proportions of disordered regions in the motifs, with motifs 3–5 showing the highest proportions. Motifs 7 and 8 also exhibited relatively high disordered regions (Figure S1). These results suggest that these motifs contribute to the protein’s functional regulation and structural flexibility, allowing it to adapt to different environmental conditions and participate in processes such as regulation, molecular interactions, and signal transduction. Further analysis showed that among all Arabidopsis PFK proteins, AtPFK1, AtPFK3, AtPFK4, AtPFK6, and AtPFK7 shared the same domain, PLN2564. AtPFK2 contained a unique PFK domain, while AtPFK5 contained the PLN02884 domain. AtPFPA1 and AtPFPA2 both contained the PLN03028 domain, and AtPFPB1 and AtPFPB2 shared the PLN02551 domain (Figure 2C). These findings indicate that, aside from maintaining core conserved domains, the Arabidopsis PFK proteins have evolved structural variations, reflecting functional specialization within the enzyme family. The subfamily-specific motif architectures likely contribute to biological functional diversity, with different motif combinations playing roles in specialized functions.
A comprehensive analysis of the coding sequence structures across the 11 PFK genes revealed variability in exon number within the coding regions (Figure 2B). Except for AtPFK2, which contains 2 exons, the other 10 Arabidopsis PFK genes consist of 10 to 19 exons and 9 to 18 introns per gene. AtPFPA contained 18 introns, while AtPFK2 possessed only a single intron (Figure 2B). This suggests that AtPFK2, with its minimal exon–intron structure, may serve as a fundamental, conserved stress-responsive regulator, enabling rapid adaptation to environmental fluctuations. The observed structural polymorphism indicates divergent evolutionary trajectories among the Arabidopsis PFK genes. These variations in gene architecture likely reflect functional specialization, with distinct exon–intron organizations facilitating differential regulation in processes such as growth, development, and environmental stress responses. The structural fingerprints identified in this study provide critical insights into the mechanistic basis of functional diversification within the PFK gene family.

2.4. cis-Acting Element Analysis in the Promoter Regions of PFK Genes in Arabidopsis thaliana

Promoter analysis revealed that all AtPFK gene promoters contain multiple stress-responsive elements, but significant differences exist between family members (Figure 3A, Table 4). Notably, the promoter of AtPFK2 is the most distinctive, containing 24 stress/hormone response elements, including 5 ABRE (ABA response elements) and 3 MBS (drought-responsive elements). In contrast, while AtPFPB2 has fewer elements (8 in total) (Figure 3B, Table 4). To further investigate, we performed RT-qPCR analysis, AtPFK2 exhibited significantly higher expression levels than PFPB2 under salt stress, which contain fewer stress-responsive elements. A similar pattern was observed under drought stress (Figure S2), where the induction of AtPFK2 was notably higher than that of other family members. Interestingly, despite the presence of a considerable number of stress-responsive elements in PFPA1, its expression remained lower than that of AtPFK2. These findings not only confirm that the quantity and composition of cis-acting elements directly influence the strength of stress responses but also highlight that PFK family members may form a hierarchical regulatory network in plant responses to environmental stresses. AtPFK2 acts as a core regulatory node responding to multiple stresses, while PFPA1 and others function as secondary responders involved in specific stress pathways. PFPB1/PFPB2, on the other hand, may primarily contribute to the regulation of basic metabolic processes. This cooperative model offers new insights into the metabolic regulatory mechanisms underlying plants’ complex adaptations to environmental changes.

2.5. AtPFK2 Acts as a Negative Regulator of Salt and Drought Stress Tolerance in Arabidopsis thaliana

To further investigate the functional role of AtPFK2, we screened and identified knockout mutants of AtPFK2 (AT5G47810). Potential T-DNA insertion lines were identified from public databases and confirmed by RT-qPCR. We successfully identified the PFK2 knockout mutant (line: SALK_088087C), which contains a T-DNA insertion in the exon (Figure S3A,B). To investigate the role of AtPFK2 in Arabidopsis thaliana’s response to adverse conditions, we first subjected the pfk2 mutant (T-DNA) to salt and drought stress treatments. When grown on 1/2 MS medium supplemented with 100 mM NaCl, the roots of the pfk2 mutant (T-DNA) were shorter than those of the wild-type (WT) plants (Figure S3C). However, the root systems were better developed, and the fresh weight increased. Similarly, when grown on 1/2 MS medium containing 300 mM mannitol, the roots of the pfk2 mutant (T-DNA) were slightly shorter than those of the wild-type plants, but the root systems remained well developed, and the fresh weight also increased (Figure S3D,E).
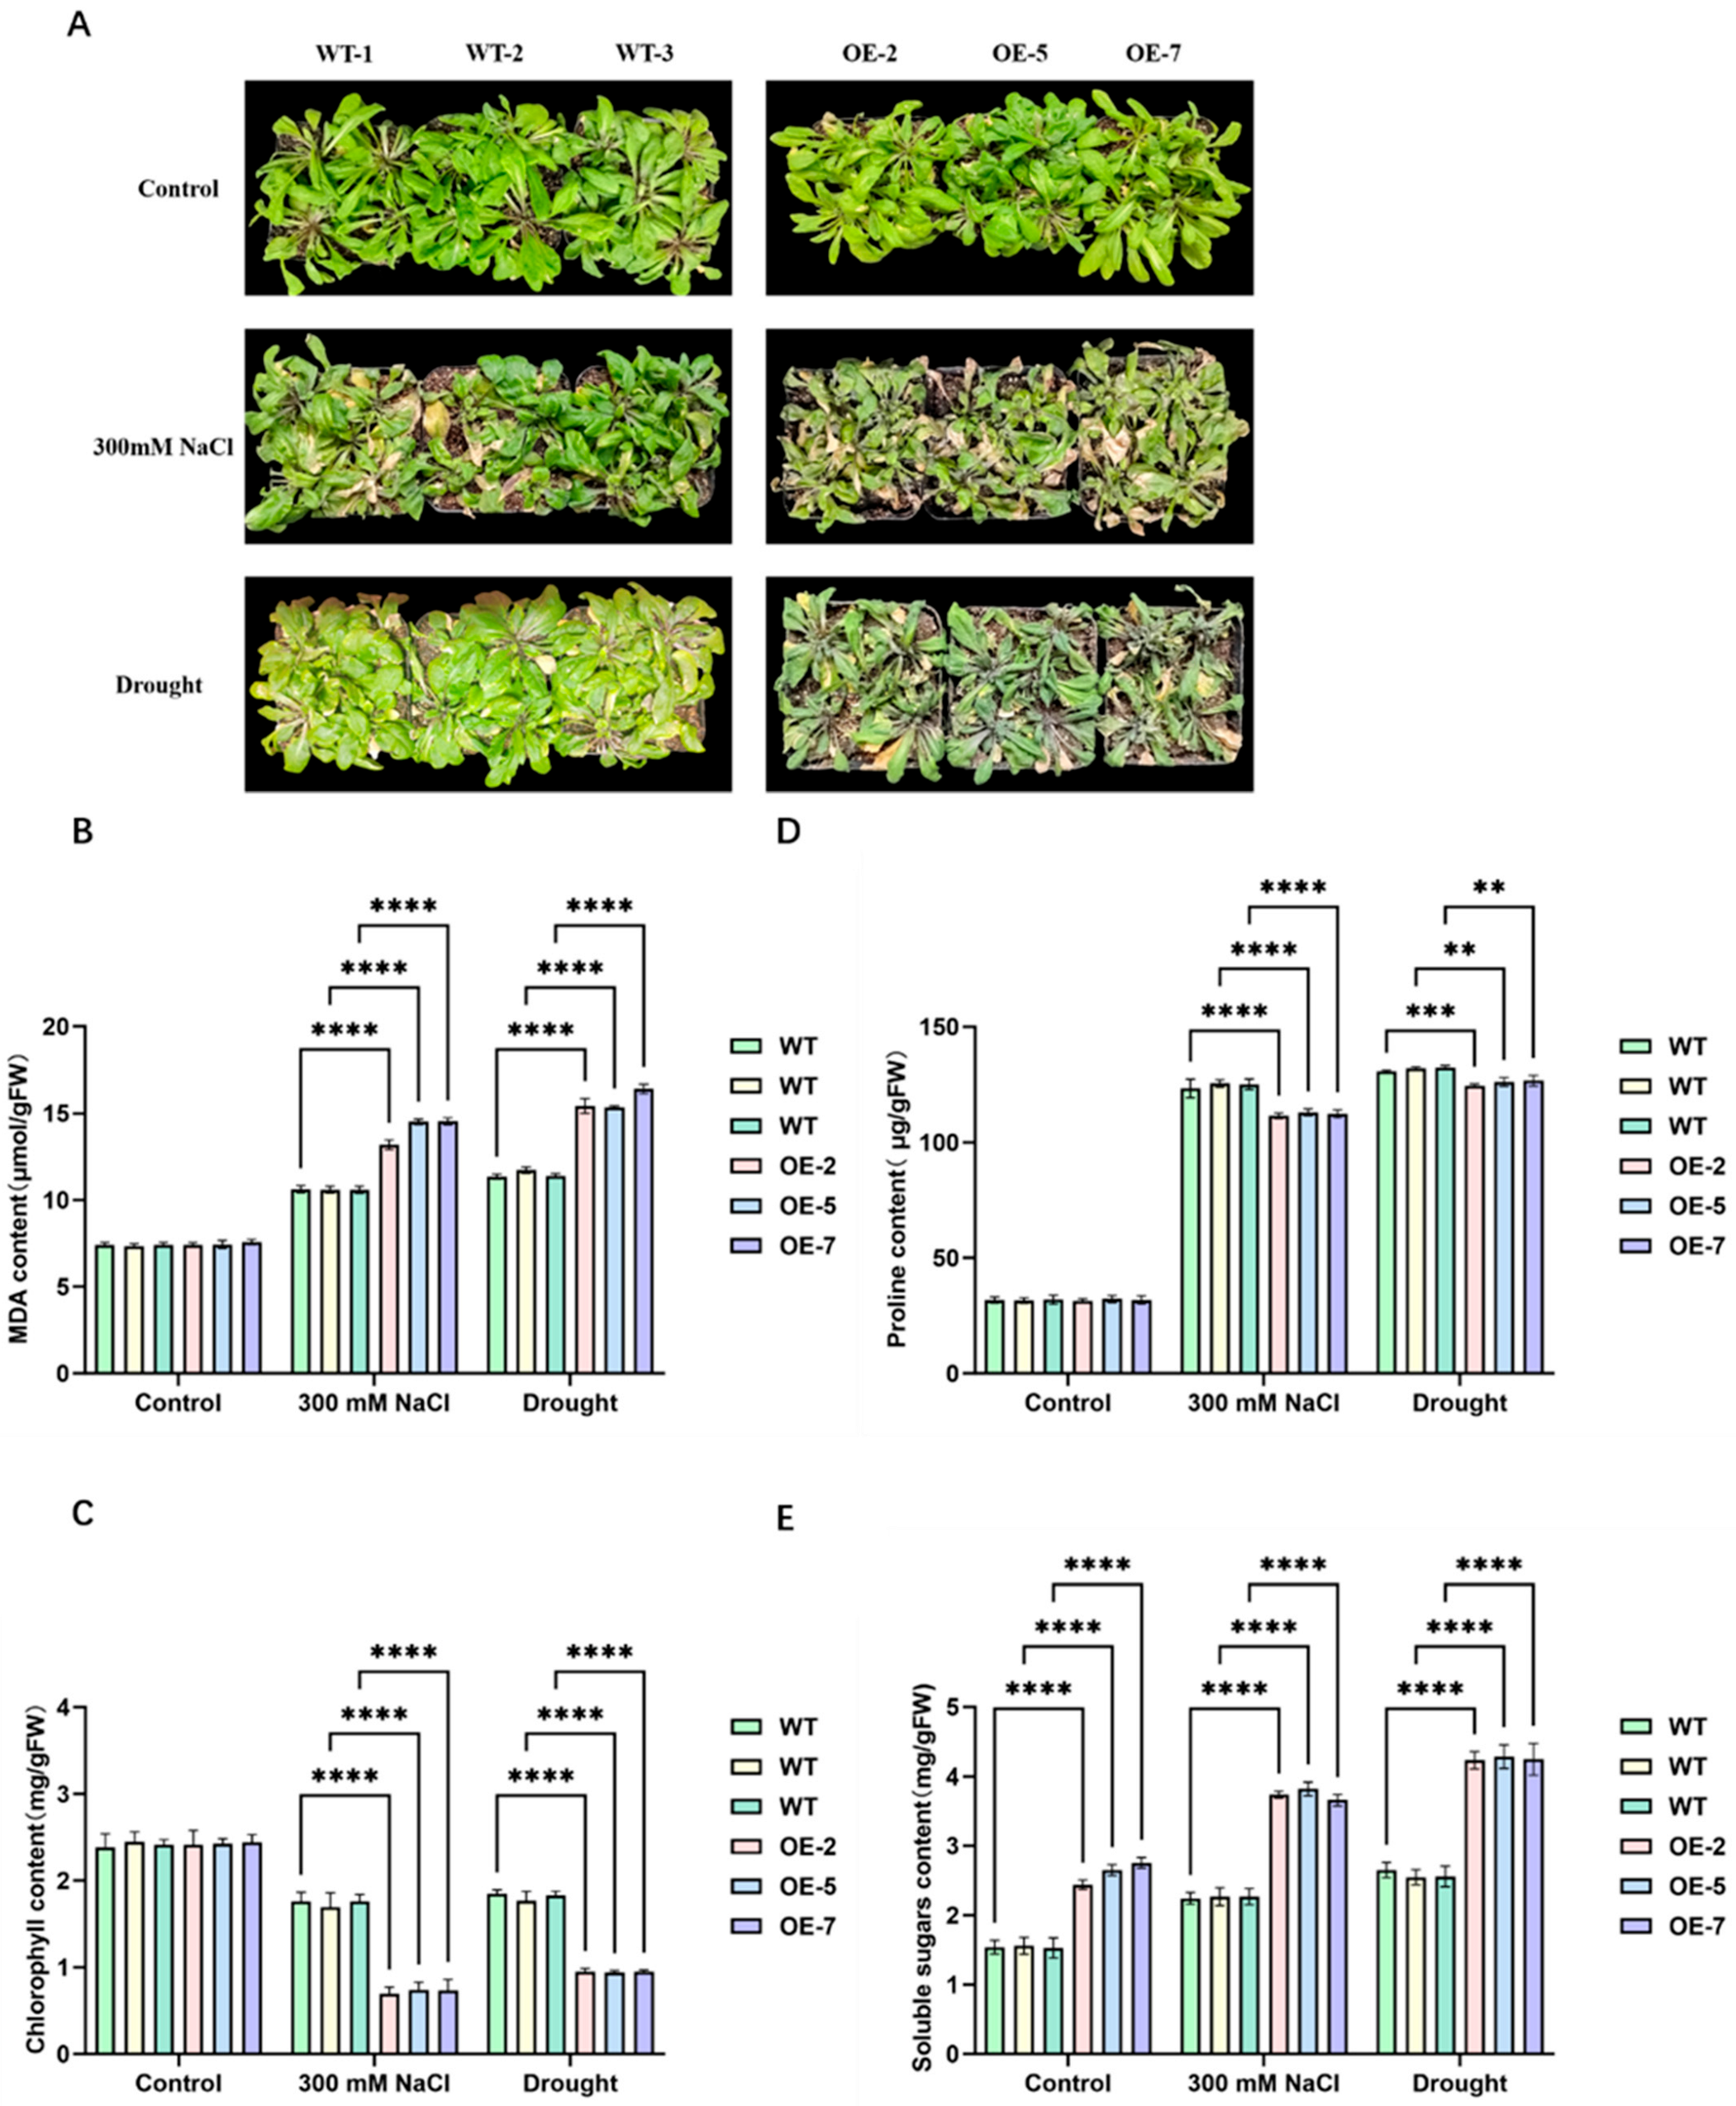
To further explore the role of AtPFK2 in stress tolerance, we generated ten independent transgenic Arabidopsis lines overexpressing AtPFK2. From these, three representative overexpressing lines (OE-2, OE-5, and OE-7), which showed elevated transcript levels (Figure S4), were selected for detailed functional analysis. Three-week-old plants of both the AtPFK2-overexpressing (OE) and wild-type (WT) lines were subjected to either 300 mM NaCl irrigation or dehydration for seven days. Under normal watering conditions, there were no visible phenotypic differences between the OE and WT lines. However, after stress treatment, the differences became apparent. Wild-type plants exhibited moderate leaf wilting and partial chlorosis in the rosette leaves, whereas AtPFK2-overexpressing (OE) lines showed more severe wilting and extensive chlorosis (Figure 4A), suggesting that overexpression of AtPFK2 increased stress sensitivity. Physiological analyses revealed that, compared to WT plants, the OE lines had significantly lower chlorophyll and proline contents under both salt and drought stresses (Figure 4C,D). In contrast, malondialdehyde and soluble sugar levels were elevated in the OE lines (Figure 4B,E). These findings indicate that AtPFK2 overexpression compromises stress tolerance in Arabidopsis, making the transgenic plants more susceptible to both NaCl and drought stresses. This discovery not only enhances our understanding of AtPFK2’s role in stress adaptation and metabolic regulation but also provides a theoretical framework for the potential genetic improvement of crop stress tolerance through targeted manipulation of PFK2-mediated pathways.

2.6. Transcriptomic Analysis of AtPFK2 in Response to Salt and Drought Stresses and the Protein–Protein Interaction Network of Core Genes

To explore the regulatory mechanisms of AtPFK2 in stress adaptation, we performed RNA-Seq analysis on wild-type (WT), AtPFK2-overexpression (OE), and pfk2 mutant (T-DNA) plants after 72 h of salt or drought treatment. This analysis aimed to identify differentially expressed genes (DEGs). Under salt stress, WT plants showed significant changes in 4304 genes (2557 upregulated and 1747 downregulated), while under drought stress, 3050 genes were affected (1534 upregulated and 1516 downregulated) (Figure S5A,B). In contrast, the gene expression differences between the wild-type (WT), AtPFK2-overexpression (OE), and pfk2 mutant (T-DNA) plants were smaller.
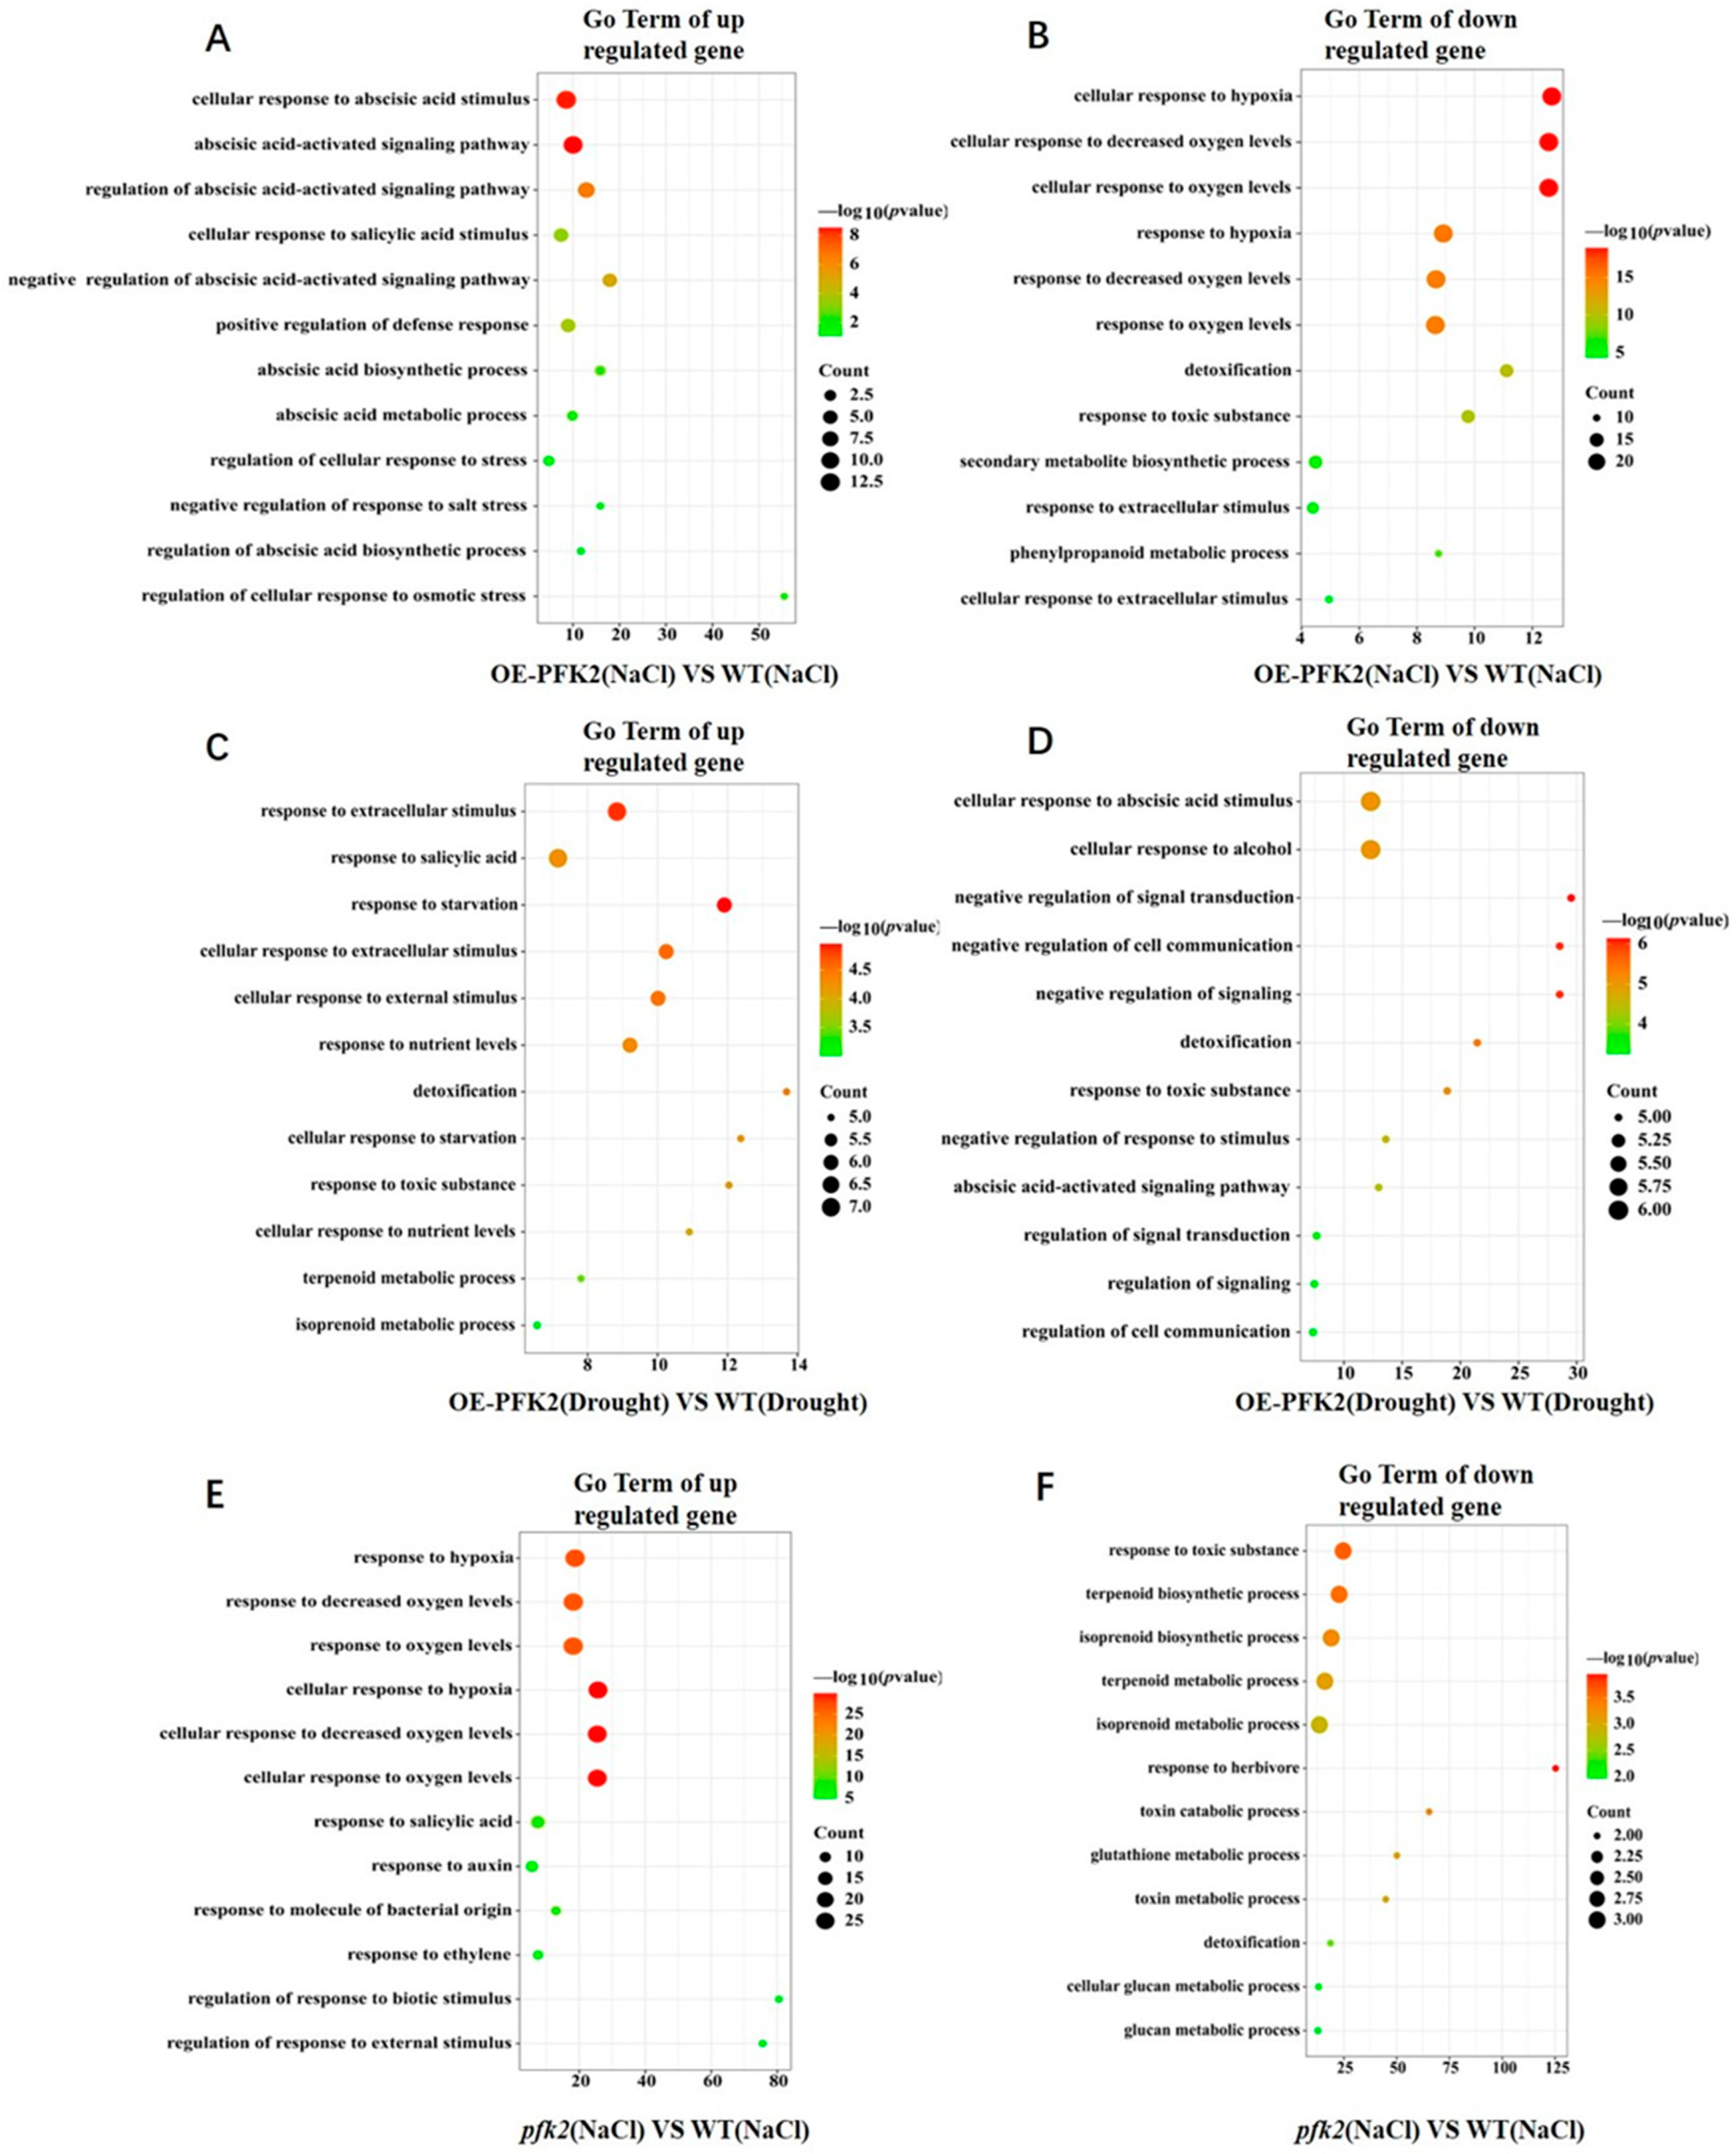
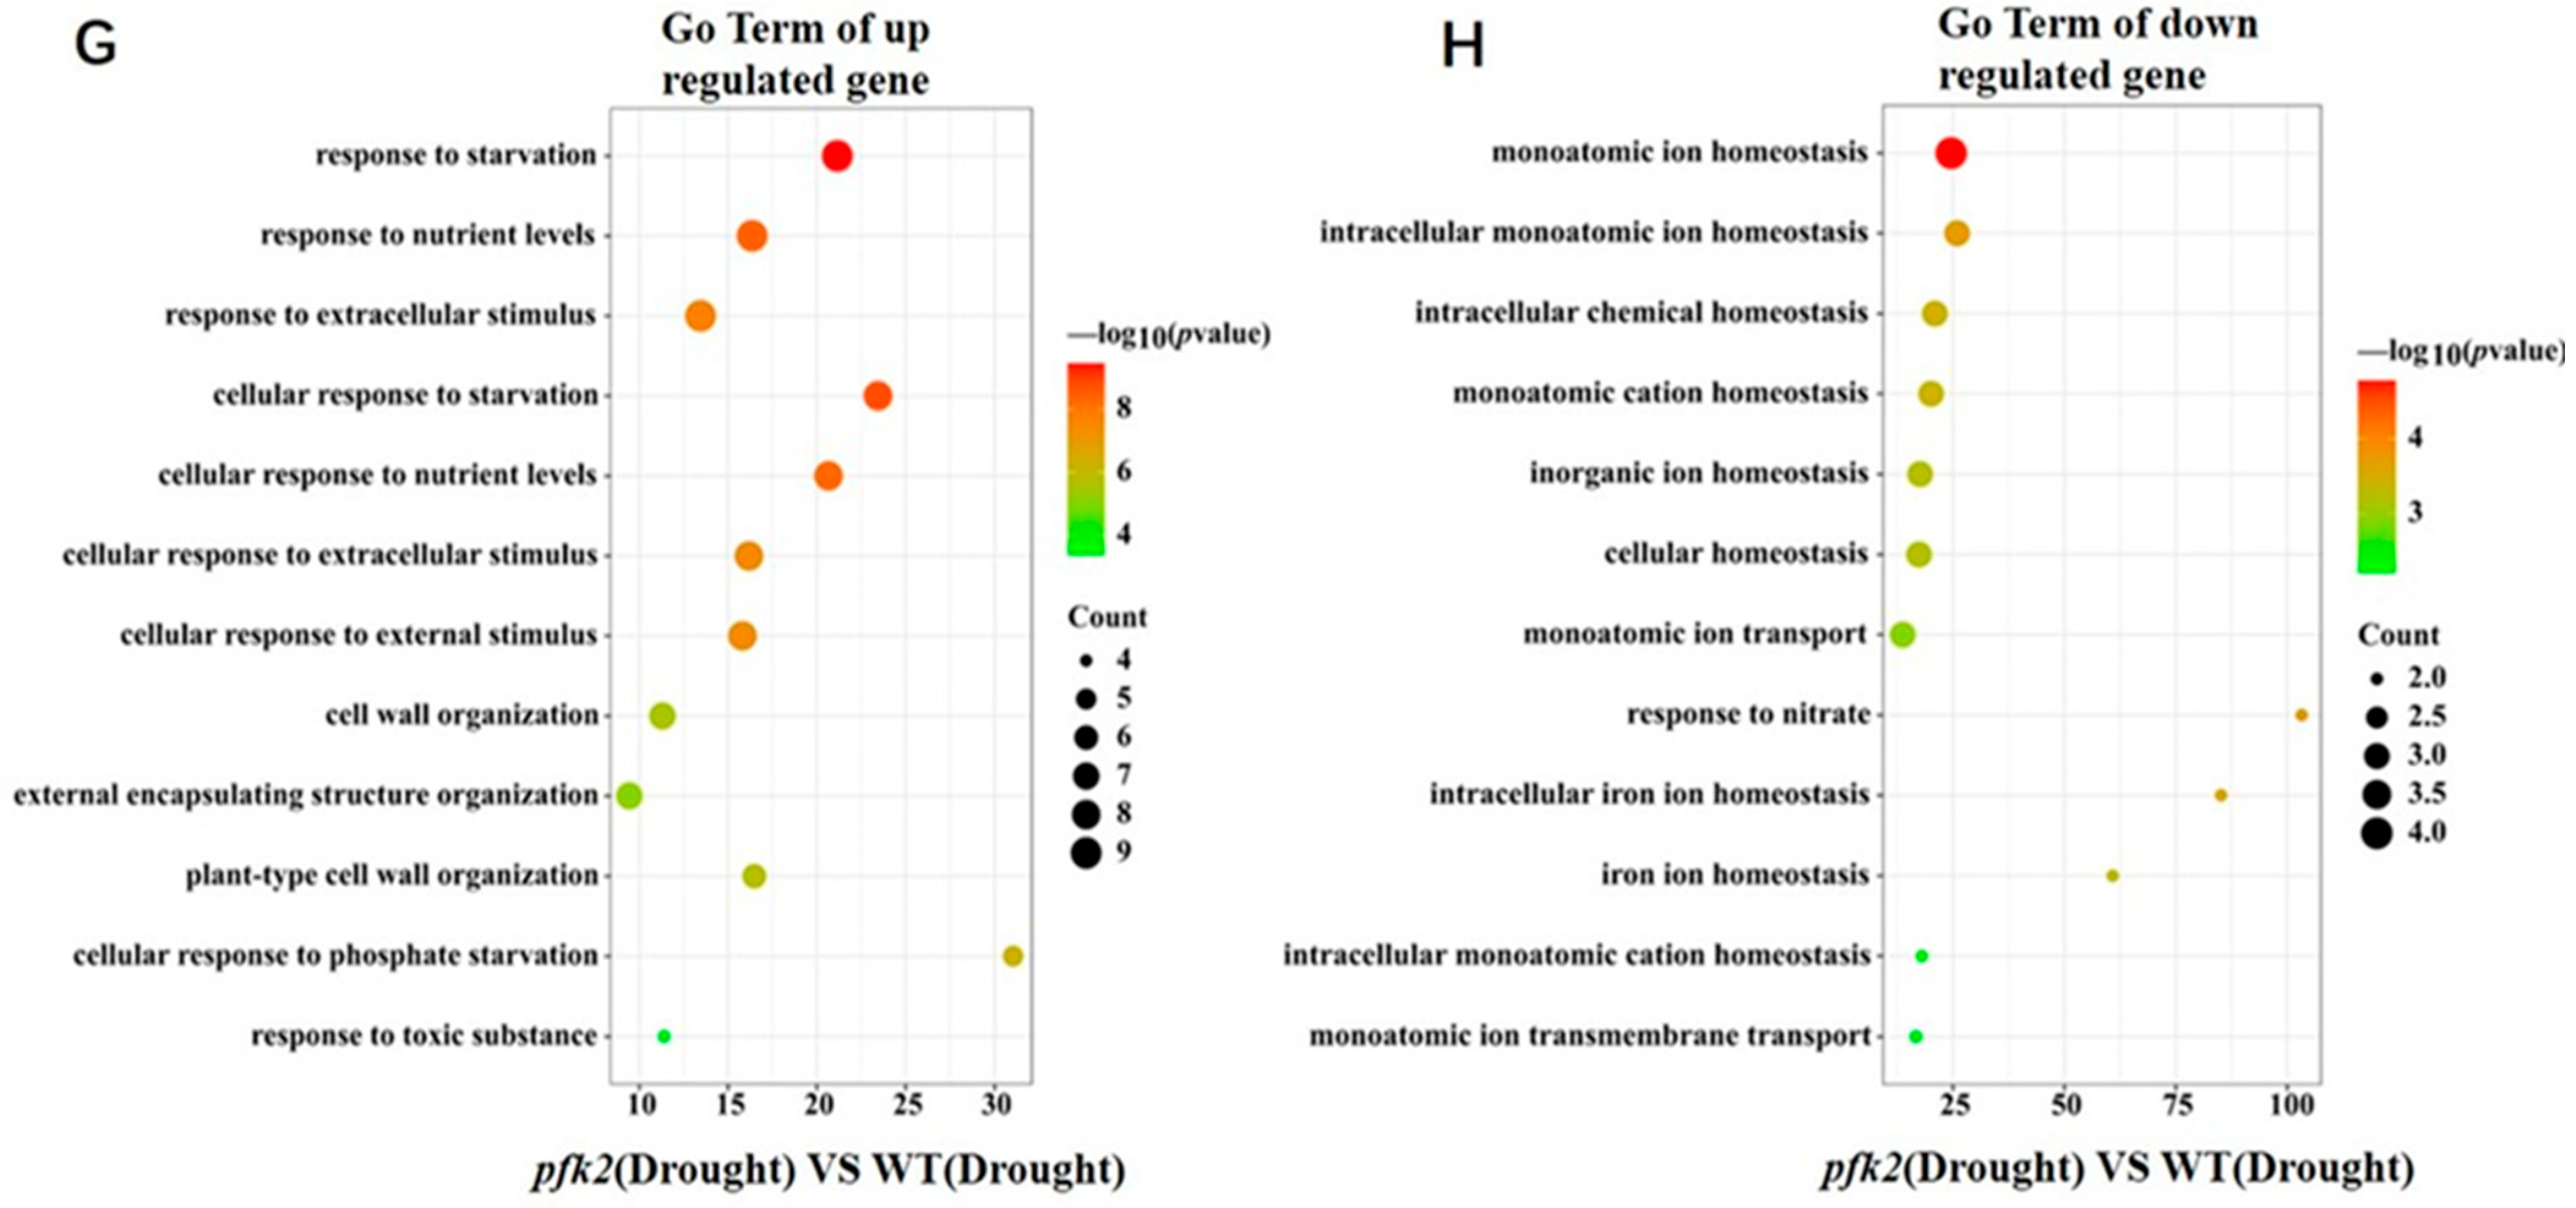
Specifically, under salt stress, 304 genes were downregulated and 176 genes were upregulated in the AtPFK2-overexpression (OE) plants, while the pfk2 mutant (T-DNA) plants showed 31 downregulated and 175 upregulated genes compared to the wild-type (WT) (Figure S5C,E). Gene Ontology (GO) analysis revealed that compared to the wild-type (WT), ABA pathway components were significantly upregulated in AtPFK2 overexpression (OE), while genes involved in salicylic acid signaling were also activated (Figure 5A). Interestingly, downregulated genes were primarily associated with oxidative stress, toxin response, and various metabolic pathways (Figure 5B). Moreover, under salt stress, the majority of DEGs in wild-type (WT) plants compared to the pfk2 mutant (T-DNA) were enriched in oxidative stress pathways, while salicylic acid and auxin signaling pathways were activated (Figure 5E). The downregulated genes were mainly related to toxic responses and secondary metabolite biosynthesis pathways (Figure 5F). Under drought stress, AtPFK2-overexpression (OE) plants exhibited 58 downregulated and 86 upregulated genes, while the pfk2 mutant (T-DNA) plants had 21 downregulated and 75 upregulated genes compared to the wild-type (WT) (Figure S5D,F). Drought stress triggered distinct transcriptional responses. In AtPFK2-overexpression (OE) plants, extracellular stimulus perception and salicylic acid pathway genes were preferentially activated (Figure 5C), while ABA-related genes and those involved in ethanol response, negative regulation of cell signaling, and toxin response were suppressed (Figure 5D). In the pfk2 mutant (T-DNA) plants, the upregulated genes were mostly enriched in responses to nutrient levels, extracellular stimulus perception, and hunger levels (Figure 5G), while genes related to intracellular monovalent ion homeostasis, cation homeostasis, and chemical homeostasis were suppressed (Figure 5H). These findings suggest that AtPFK2 orchestrates stress adaptation through pathway-specific modulation: (1) under salt stress, it primarily activates ABA-dependent signaling and toxic responses, while attenuating other stress responses; (2) during drought stress, AtPFK2 shifts its focus toward extracellular stimulus perception and the regulation of cellular ion homeostasis. This differential regulatory strategy positions AtPFK2 as a metabolic integrator, tailoring stress responses based on environmental challenges. These mechanistic insights advance our understanding of how central metabolic enzymes participate in stress signaling networks.
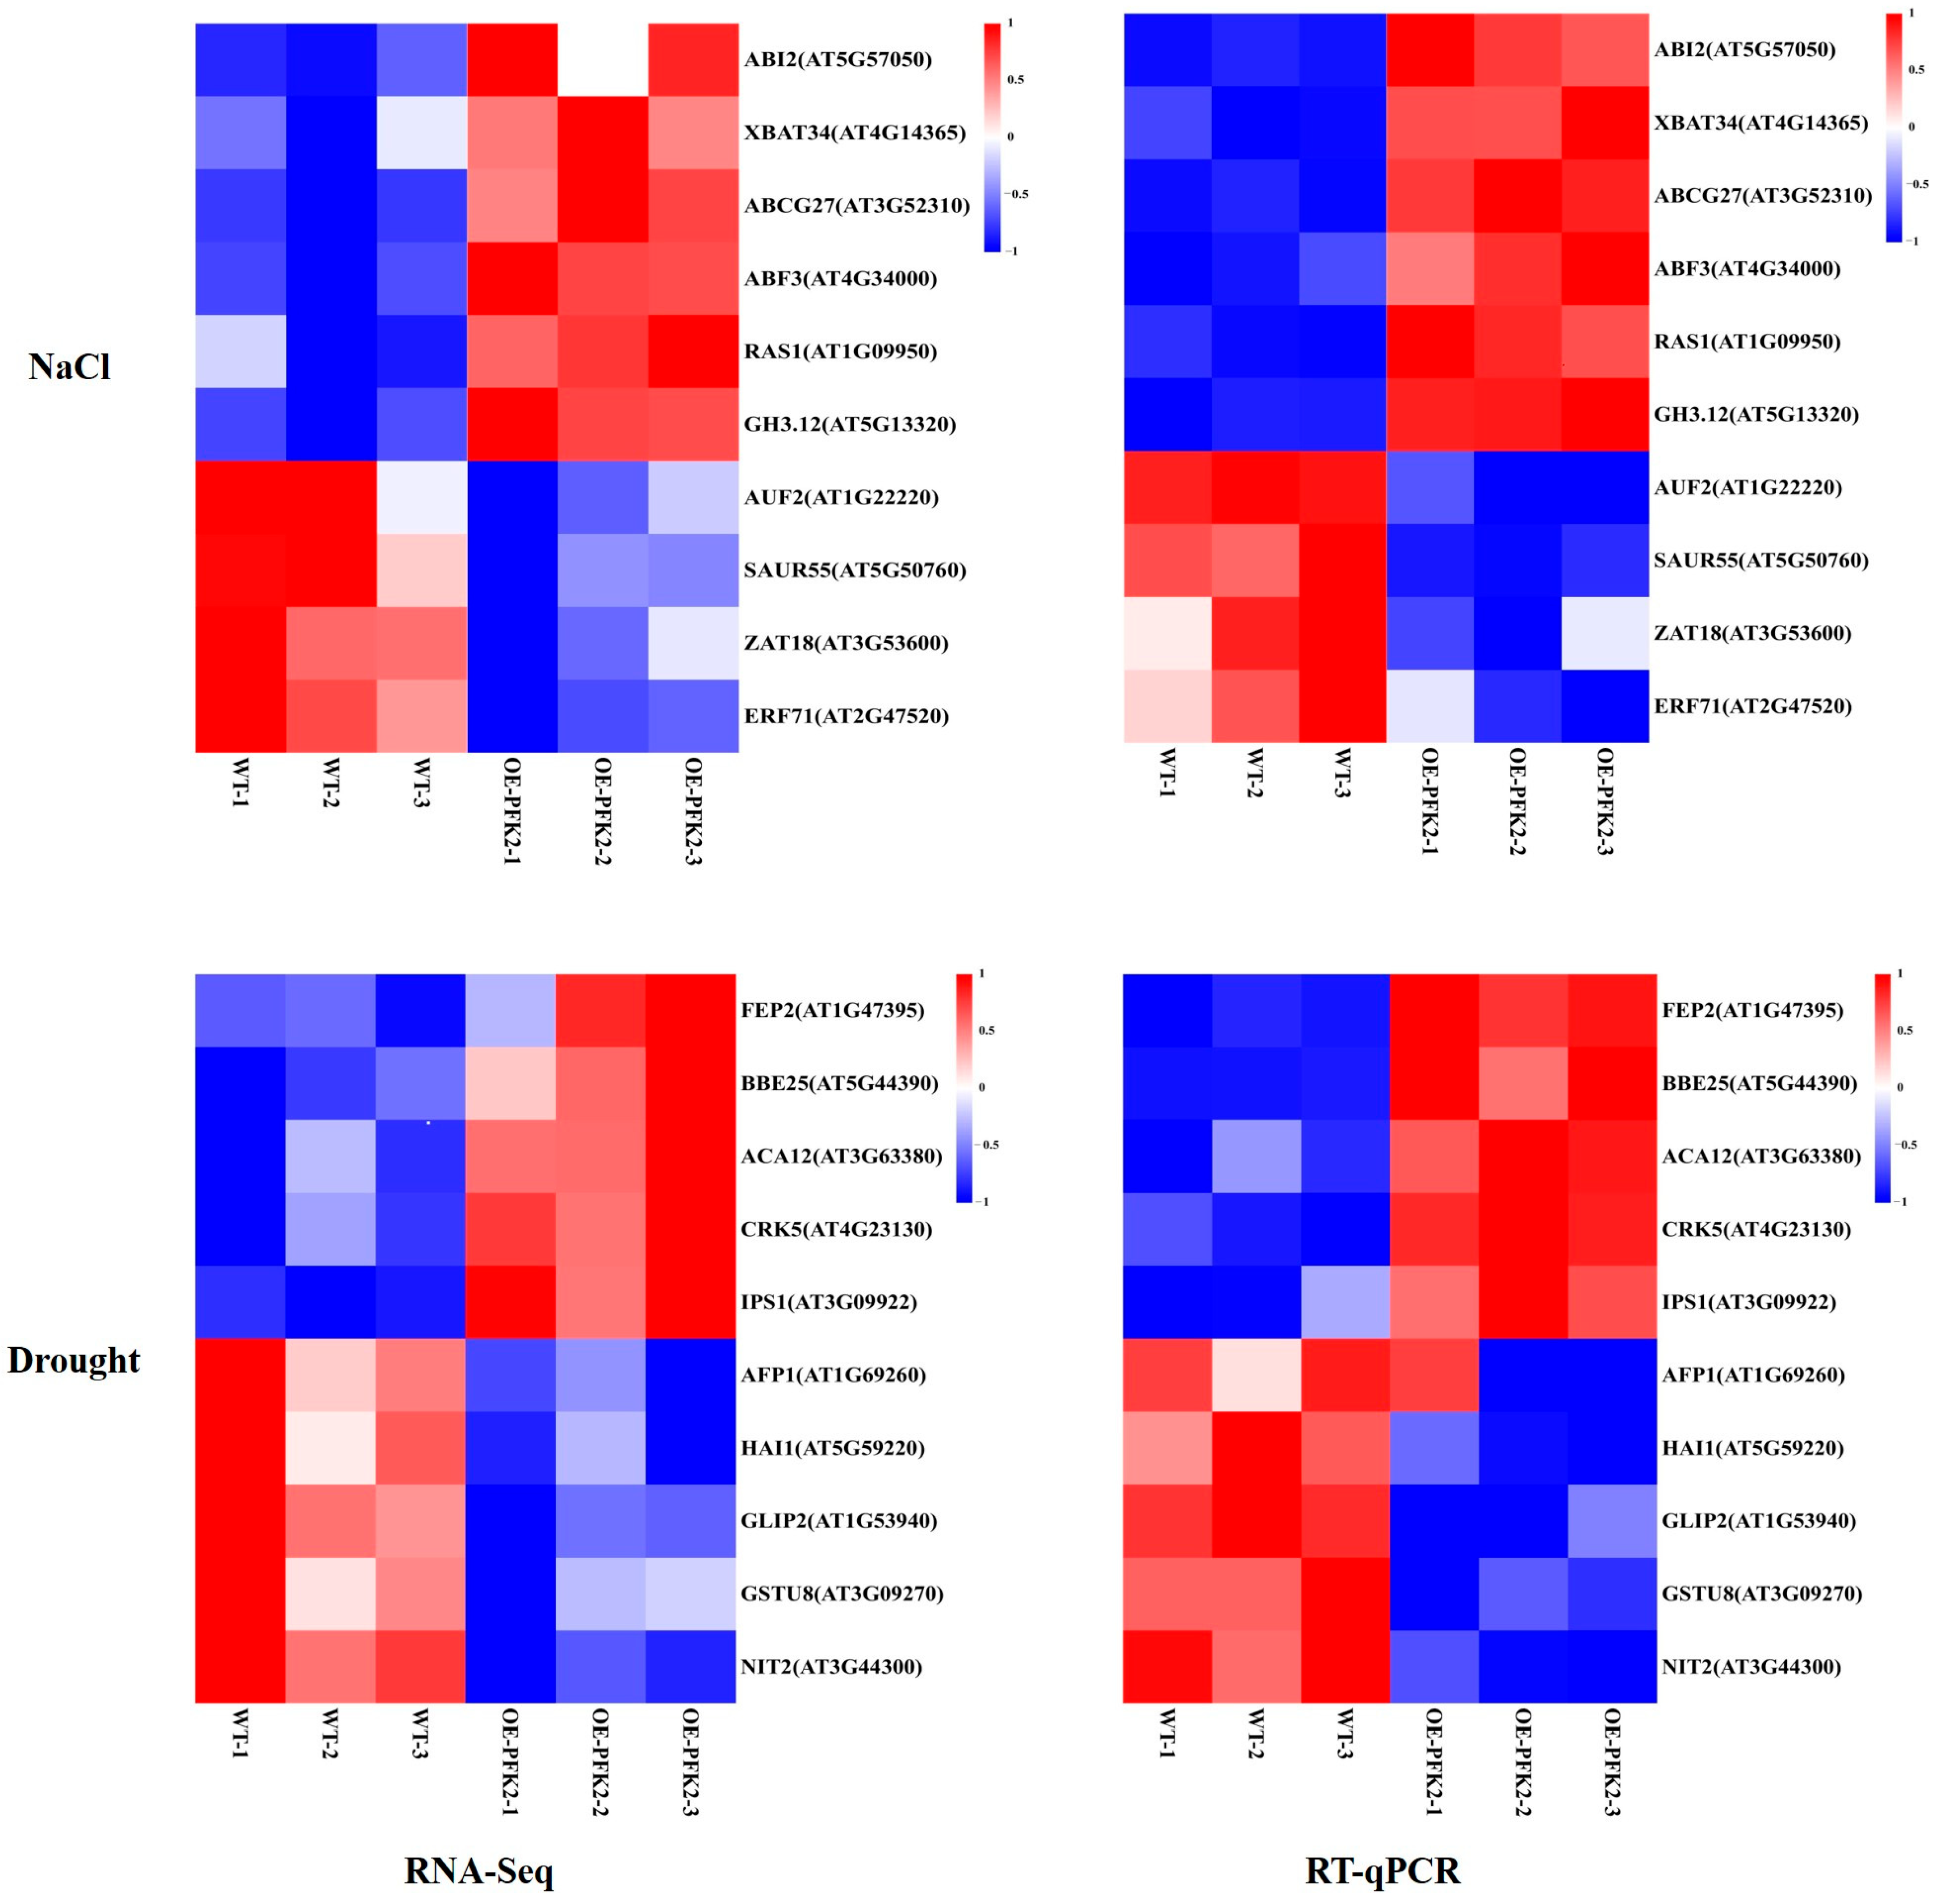
To validate the RNA-Seq findings on Arabidopsis responses to salt and drought stress, we performed quantitative real-time PCR (RT-qPCR) analysis on 20 differentially expressed genes (DEGs) that represent various functional categories (Figure 6). Under salt stress conditions, four ABA pathway-related genes (ABCG27, RAS1, ABF3, and ABI2) showed significant upregulation in the AtPFK2-overexpression (OE) lines compared to wild-type (WT) control plants. Simultaneously, genes related to salicylic acid signaling (XBAT34) and regulation of cellular responses to stress (GH3.12, excluding AUF2 and SAUR55) were coordinately induced. However, two salt-responsive transcription factors (ERF71 and ZAT18) were markedly downregulated. Drought stress elicited distinct expression patterns, two salicylic acid-responsive components (BBE25 and CRK5) were highly upregulated in the AtPFK2-overexpression (OE) lines. Additionally, three extracellular stimulus sensors (ACA12, IPS1, and FEP2) were also upregulated, whereas five genes involved in toxin response, signaling regulation, and ABA signaling (GSTU8, NIT2, GLIP2, AFP1, and HAI1) were significantly suppressed. These RT-qPCR results are consistent with the RNA-Seq data, supporting the conclusion that AtPFK2 modulates a complex transcriptional network that affects (1) ABA-dependent signaling, (2) developmental reprogramming, and (3) extracellular signaling. The PCR analysis further confirms that overexpression of AtPFK2 compromises stress tolerance through the dysregulation of these critical physiological processes, highlighting its role as a metabolic regulator in plant–environment interactions.
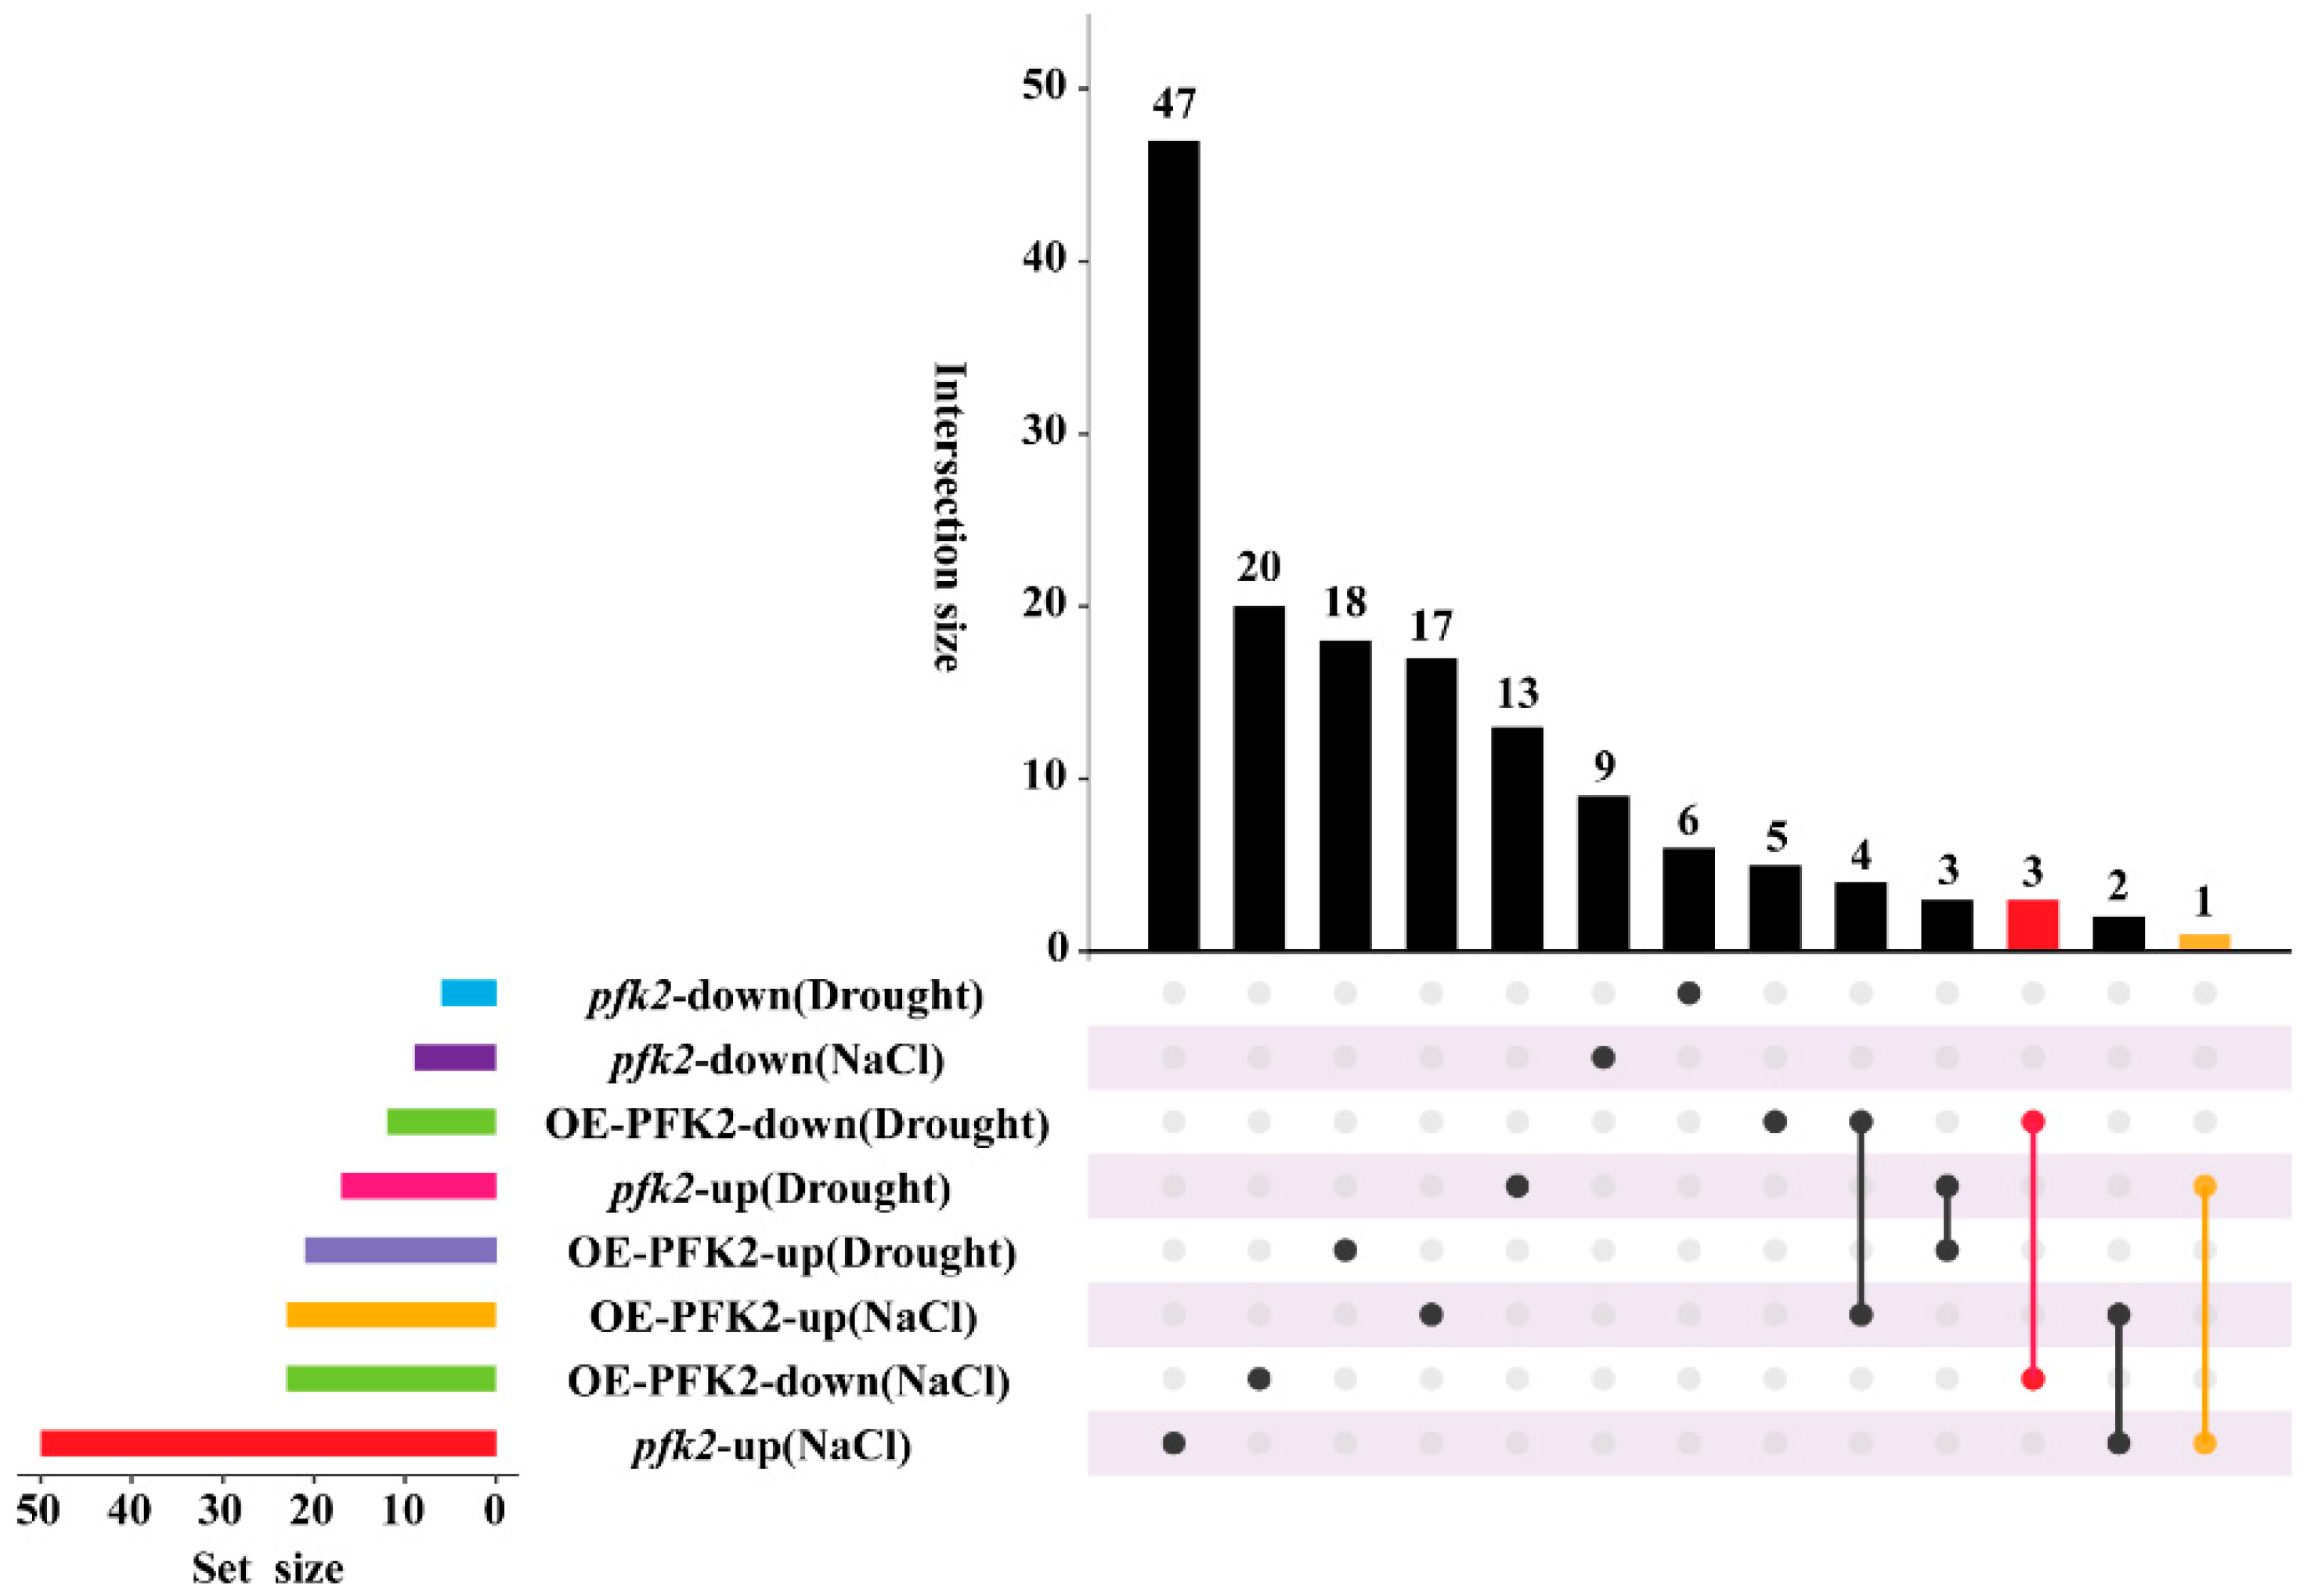
We also classified differentially expressed genes (DEGs) across eight comparative groups and identified distinct transcriptional reprogramming patterns under salt and drought stress conditions. In the AtPFK2-overexpression (OE) lines under NaCl stress, 17 upregulated DEGs were primarily enriched in ABA signaling pathways, while 20 downregulated DEGs were mainly related to oxidative stress responses. In contrast, 18 DEGs upregulated exclusively under drought stress were associated with extracellular stimulus perception and salicylic acid signaling pathways, and five DEGs were downregulated in both ABA signaling and alcohol response pathways (Figure 5A,D and Figure 7). KEGG pathway analysis revealed five significantly enriched metabolic and signaling pathways: “phytohormone signal transduction,” “glutathione metabolism,” “carbon metabolism,” “plant mapk signaling,” and “phenylpropanoid biosynthesis” (Figure S6A). In the pfk2 mutant (T-DNA) under NaCl stress, 47 DEGs were upregulated, and 9 DEGs were downregulated, primarily enriched in oxidative stress responses and secondary metabolite biosynthesis pathways (Figure 5E,F and Figure 7). Under drought stress, 13 DEGs were upregulated, and 6 DEGs were downregulated in the mutant, with enrichment in extracellular stimulus and cellular ion homeostasis pathways (Figure 5G,H and Figure 7). In the AtPFK2-overexpression (OE) plants, three overlapping DEGs were downregulated under both salt and drought conditions, linked to responses to oxidative stress and ABA signaling pathways (Figure 5B,D and Figure 7). In contrast, in the mutant plants, one overlapping DEG was upregulated under both salt and drought conditions, associated with extracellular stimulus and hypoxia responses (Figure 5E,G and Figure 7). KEGG pathway analysis of the mutant plants identified several enriched pathways, including “plant–pathogen interaction,” “plant hormone signal transduction,” “secondary metabolite biosynthesis,” “glutathione metabolism,” “phenylpropanoid biosynthesis,” “carbon metabolism,” and “steroid biosynthesis” (Figure S6B).
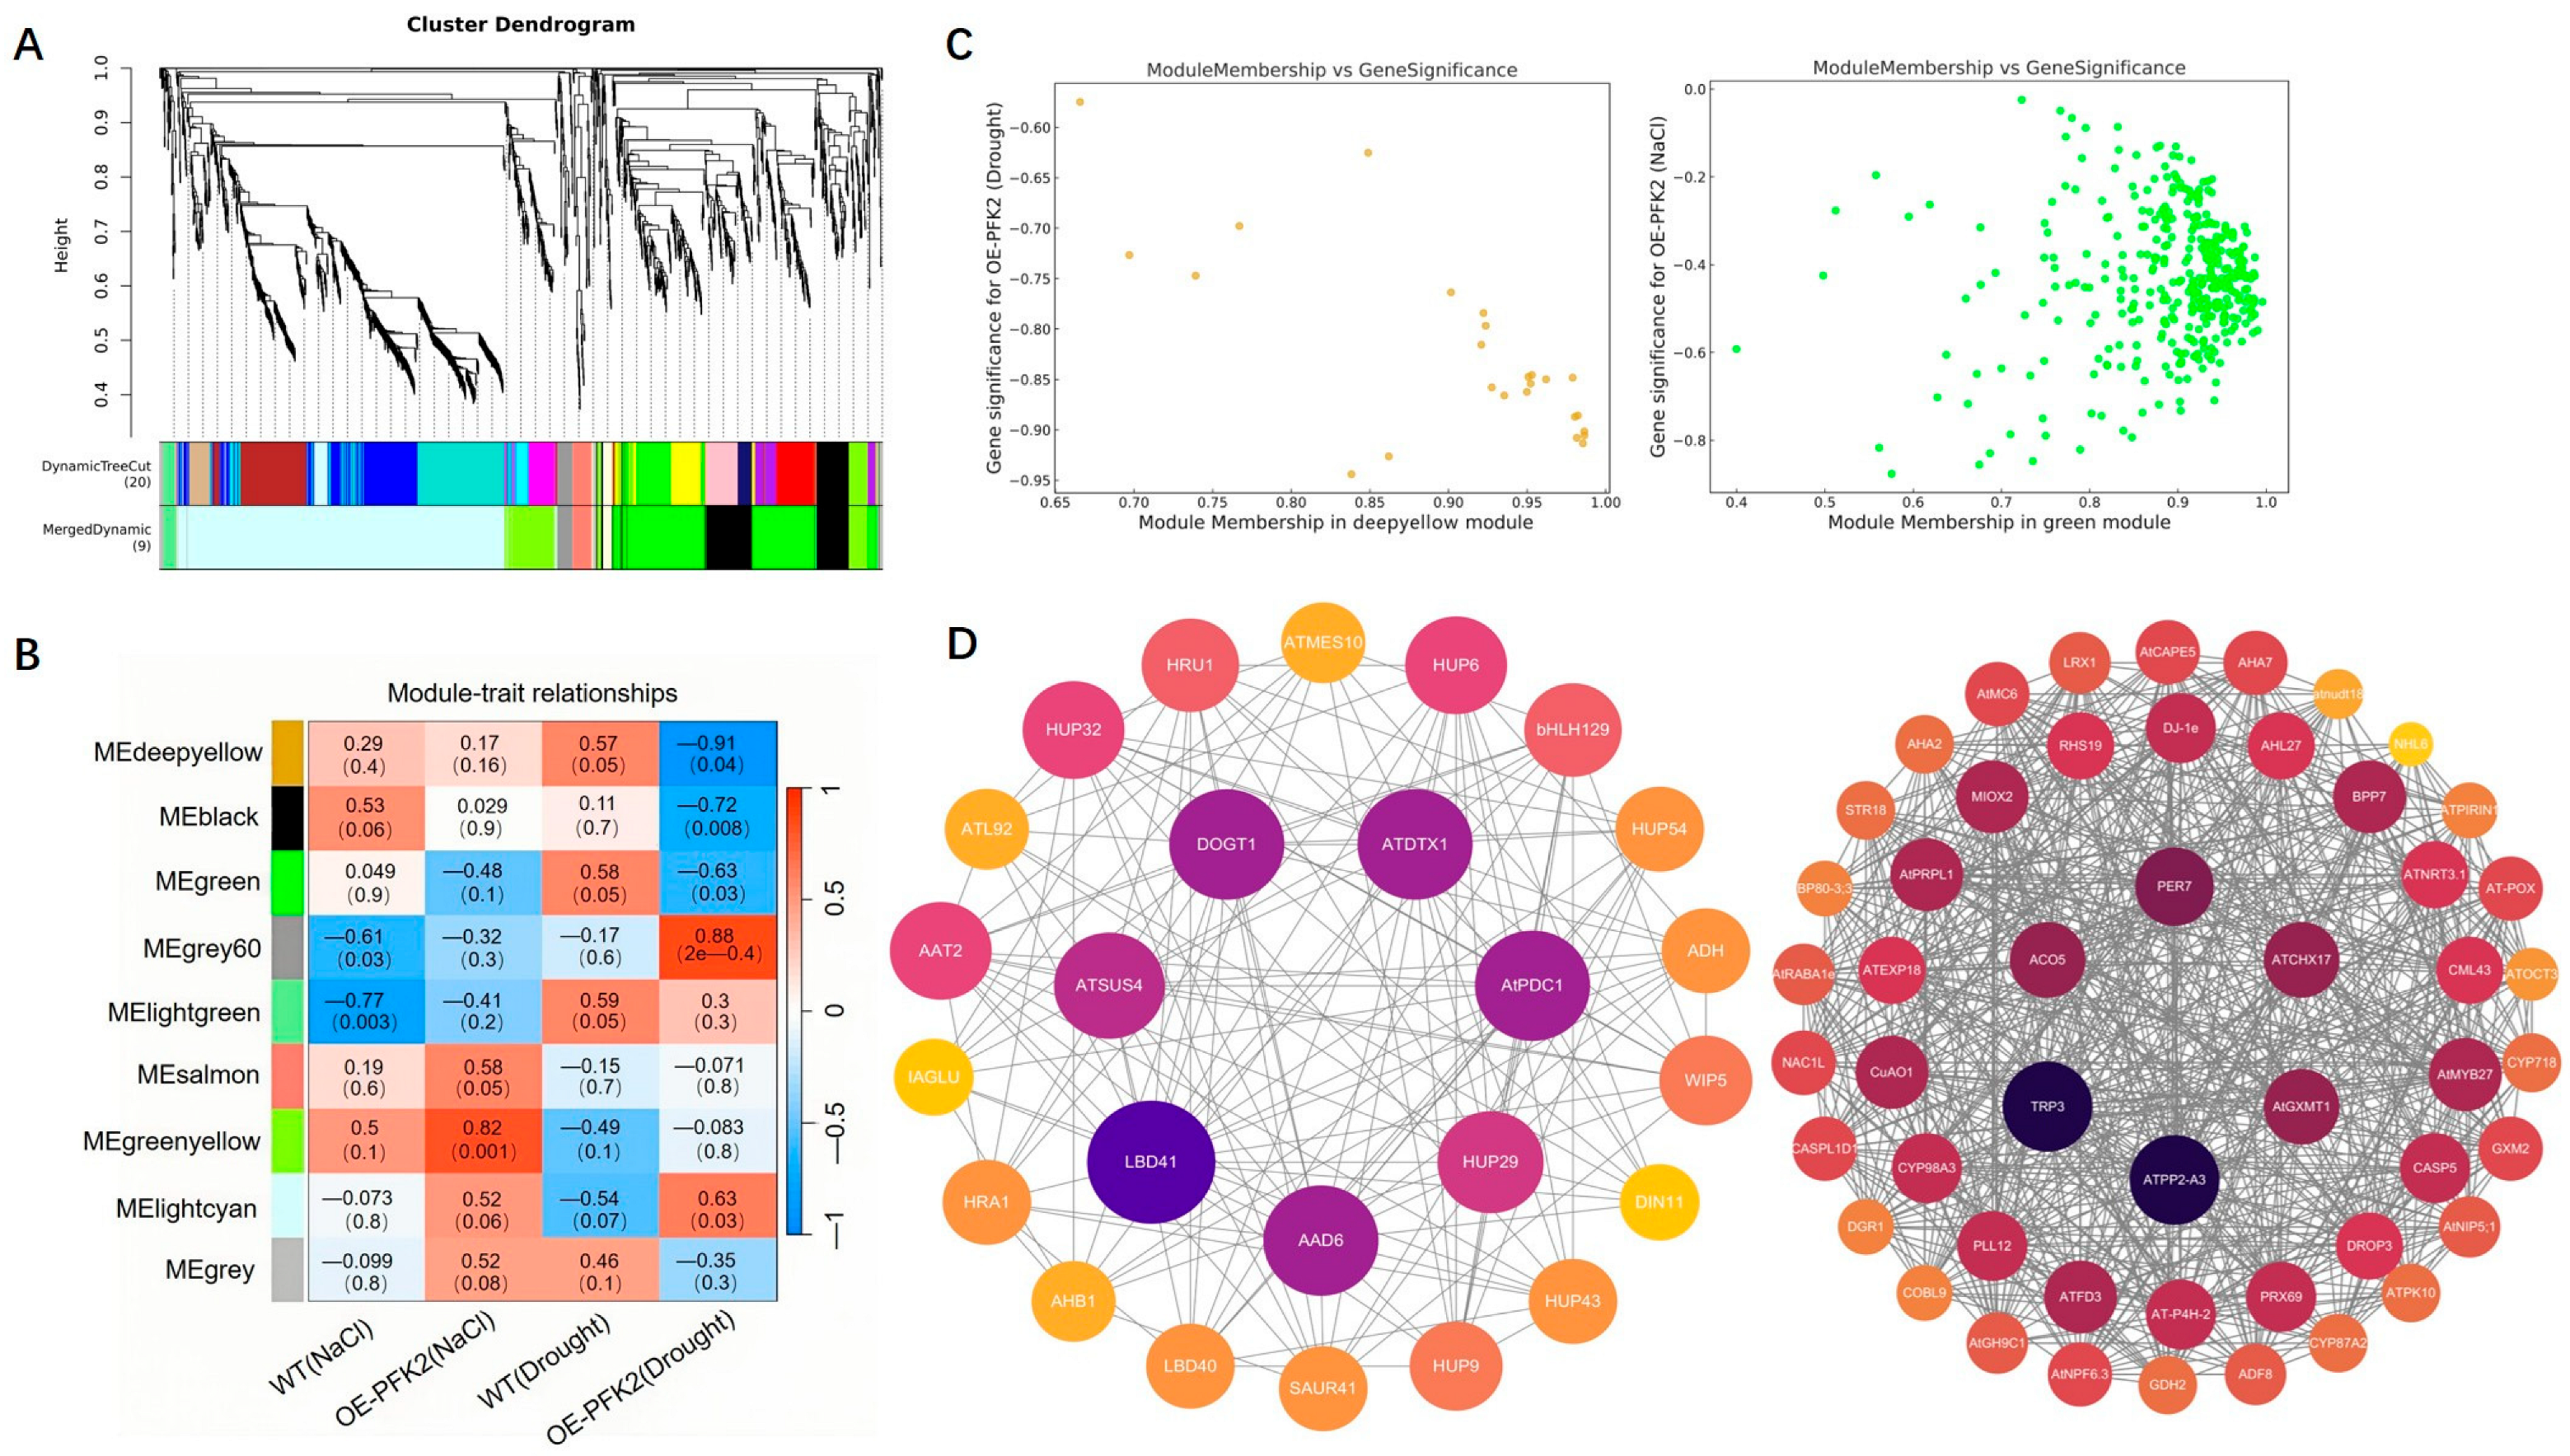
To better understand the regulatory network of AtPFK2 under salt and drought stress, we performed weighted gene co-expression network analysis (WGCNA) using expression datasets from four samples with three biological replicates. A total of 9 co-expression modules were identified in the AtPFK2-overexpression (OE) lines, and 5 modules were identified in the pfk2 mutant (T-DNA) lines (similarity threshold > 0.25, gene expression threshold > 1), with each module labeled by a different color (Figure 8A and Figure 9A). Correlations between the modules and samples revealed that the deep yellow and green modules were negatively correlated with the AtPFK2-overexpression (OE) lines under drought and salt stress, respectively (r = −0.91, p = 4 × 10⁻⁵ and r = −0.48, p = 0.1) (Figure 8B). Conversely, the black and turquoise modules were positively correlated with the pfk2 mutant (T-DNA) lines under drought and salt stress, respectively (r = 0.79, p = 0.002 and r = 0.46, p = 0.1), indicating their pivotal role in stress responses. Gene Ontology (GO) annotation of differentially expressed genes (DEGs) in the deep yellow and green modules revealed that the top 30 most enriched GO terms were associated with oxidative stress, hydrogen peroxide decomposition, cell wall modification, toxin catabolism, and nitrate transmembrane transport (Figure S7A,C). In contrast, the DEGs in the black and turquoise modules were enriched in terms related to auxin and brassinosteroid responses, temperature stress, salt stress, defense responses, and oxidative stress (Figure S7B,D). Scatter plots of gene significance (GS) and module membership (MM) for the deep yellow, green, black, and turquoise modules showed a high correlation between the two metrics, indicating that these modules are strongly linked to stress responses in both the AtPFK2-overexpression (OE) transgenic and pfk2 mutant (T-DNA) lines (Figure 8C and Figure 9C). We further visualized gene interactions within the target modules using Cytoscape (3.10.3)software and identified the top 1, 2, or 3 genes with the highest degree as hub genes. In the deep yellow module, the hub gene was LBD41 (AT3G02550), while in the green module, the hub genes were TRP3 (AT3G54640) and PP2-A3 (AT2G26820) (Figure 8D). The hub genes identified in the black module were SAUR10 (AT2G18010) and IAA6 (AT1G52830), and in the turquoise module, the hub gene was JAZ1 (AT1G19180) (Figure 9D). Functional annotation of these six hub genes revealed their involvement in glycine, serine, and threonine metabolism, as well as plant hormone signal transduction (Table 5). These findings suggest that LBD41, TRP3, PP2-A3, SAUR10, IAA6, and JAZ1 may play critical roles in Arabidopsis’s response to salt and drought stress.

3. Discussion

Gene family investigations are crucial for understanding the mechanisms underlying plant growth, development, and responses to environmental stress [38]. As a central component of carbohydrate metabolism, the Arabidopsis thaliana PFK gene family has become a key focus in current research. However, the functional characterization and regulatory mechanisms of this family remain incompletely understood, necessitating further investigation. In this study, we utilized an integrated bioinformatic approaches to systematically analyze the PFK gene family in Arabidopsis thaliana. Phylogenetic analysis of Arabidopsis PFK proteins, in comparison with orthologs from five other plant species, revealed that Arabidopsis PFK proteins are divided into two distinct evolutionary branches (Figure 1). However, the expansion of the PFK family in Arabidopsis is relatively limited compared to species like Brassica rapa, Brassica napus, and Glycine max, which possess 9, 21, and 20 members in their PFK subfamilies, respectively. In contrast, Arabidopsis has only 7 members in its PFK subfamily. This reduced expansion could reflect unique evolutionary pressures, such as ecological competition or environmental shifts, leading to the loss of certain PFK family members in Arabidopsis. Unlike soybean and rice, where whole-genome duplication (WGD) events significantly contributed to gene family [39,40,41], Arabidopsis appears to have undergone fewer such large-scale genomic duplications. The remaining PFK genes in Arabidopsis have likely undergone functional specialization, addressing specific physiological needs, tissue-specific demands, developmental stage transitions [42], and environmental stress responses. Certain PFK isoforms, for instance, are preferentially expressed during seed germination to support energy-intensive growth [43], while others enhance glycolytic flux under stress conditions, providing metabolic flexibility [44,45,46,47]. This functional diversification, achieved through evolutionary refinement rather than gene family expansion, has likely conferred a competitive advantage within Arabidopsis’s ecological niche.
Our analysis of gene architecture, protein motifs, domain organization, and phylogenetic relationships revealed significant structural diversity within the Arabidopsis PFK family (Figure 2B). At the protein level, we identified ten conserved motifs (Figure 2D), with the AtPFK2 isoforms containing characteristic PFK domains essential for maintaining catalytic stability and allosteric regulation (Figure 2C) [48,49,50]. In contrast, PFP proteins possess distinct catalytic domains reflecting alternative enzymatic mechanisms [47,48,49]. Notably, we observed several disordered regions within these motifs, suggesting that they play crucial roles in maintaining the protein’s flexibility, enabling it to adapt with the environmental changes. Interestingly, motifs 9 and 10 did not match any known domains, which may indicate novel, yet-to-be-annotated functional regions, or portions of the protein that lack a clear function. While these auxiliary domains are not directly involved in catalysis, they are important for regulating tertiary structure and enhancing substrate binding affinity [51]. This structural variability underpins functional specialization within the PFK family, where differences in gene architecture and protein domain organization contribute to the regulation of various metabolic processes in plants.
This study reveals that the promoter regions of the Arabidopsis PFK gene family are enriched with cis-acting elements associated with methyl jasmonate (MeJA) and abscisic acid (ABA) (Figure 3A), offering new insights into the regulatory mechanisms of PFK genes in plant development and stress responses. Among the 11 PFK genes, AtPFK2 stands out for its particularly rich collection of stress- and hormone-responsive elements (Figure 3B), especially those related to ABA and MeJA. This suggests that AtPFK2 may serve as a potential regulatory node for the integration of metabolic and stress signaling pathways. While the enrichment of ABA-responsive elements (ABRE) in the AtPFK2 promoter holds theoretical significance, its actual functionality may be influenced by additional factors. Specifically, ABA-regulated sugar metabolic pathways may rely on the synergistic action of multiple genes [52,53,54,55], and the overexpression of a single AtPFK2 gene alone is insufficient to activate the overall response. Likewise, the presence of MeJA-responsive elements did not directly correlate with enhanced defense phenotypes, suggesting that the function of AtPFK2 may be regulated by post-translational modifications or protein interaction networks [56,57]. Future studies should focus on exploring the regulation of AtPFK2’s protein activity, such as phosphorylation modifications, or its interactions with other metabolic enzymes to elucidate its true role under stress conditions. The results of this study demonstrate that overexpression of AtPFK2 (phosphofructokinase 2) significantly impacts the metabolic balance and stress responses in plants. The observed decrease in proline and chlorophyll content may be attributed to an enhanced glycolytic flux, which directs carbon metabolism toward the synthesis of soluble sugars [58,59]. Additionally, the accumulation of soluble sugars could suppress the expression of genes involved in chlorophyll biosynthesis through feedback mechanisms [60] or induce oxidative damage to chlorophyll and thylakoid membranes via MDA-mediated damage [61], thereby impairing photosynthetic efficiency. The elevated MDA content further supports the accumulation of reactive oxygen species (ROS), which may be linked to electron transport chain leakage resulting from the increased glycolytic flux [62]. Importantly, AtPFK2-overexpressing plants exhibited higher expression levels of starch and sucrose metabolism-related genes, including BAMs, AMYs, SPSs, and SUSs, under salt and drought stress, consistent with the increased levels of soluble sugars (Figure S8). The upregulation of these genes likely enhances sugar breakdown and transport, thus providing additional energy and osmotic regulators to help the plant adapt to stress [63]. Previous studies have shown that soluble sugars, such as sucrose and trehalose, play a dual role in plant stress responses, serving as both osmotic protectants and ROS scavengers [64]. Consequently, AtPFK2 may enhance the plant’s ability to withstand abiotic stress by modulating the sugar metabolism network. However, the accumulation of MDA also suggests a potential risk of oxidative damage, indicating that AtPFK2-mediated metabolic reprogramming may act as a double-edged sword. Future studies should focus on optimizing the interplay between sugar metabolism and the antioxidant system to enhance plant stress tolerance while minimizing oxidative damage.
Plants adapt to stress conditions through the precise regulation of gene expression, which is a vital survival strategy [65,66]. Previous studies have indicated that certain PFK genes in Arabidopsis play crucial roles in responding to abiotic stresses, contributing to stress tolerance [67]. This study uncovers the complex regulatory role of AtPFK2 in plant responses to abiotic stress. Our findings suggest that AtPFK2 acts as a crucial regulatory node in sugar metabolism, modulating the plant’s stress adaptability by influencing the distribution of carbon flux. The observed metabolic disruptions and heightened stress sensitivity in AtPFK2-overexpression lines are consistent with previous studies that have reported an antagonistic relationship between sugar signaling and stress responses [68]. Notably, AtPFK2 exhibits differential regulatory patterns in response to various stress types, which may be attributed to the activation of distinct signaling pathways under salt and drought stress conditions [69,70]. Gene expression analysis revealed that AtPFK2 overexpression resulted in the downregulation of several stress-responsive genes, in line with reports suggesting that sugar signaling can suppress the expression of stress-related genes [71,72]. Conversely, the upregulation of specific genes in the mutant lines implies that plants may compensate for the loss of AtPFK2 by activating alternative metabolic pathways, a phenomenon that highlights the plasticity of metabolic networks [73,74]. Noteworthy is the opposite regulation of certain genes under salt and drought stress, which may reflect the plant’s specific recognition mechanisms for distinct stress types [75]. These findings offer new perspectives on the interplay between plant metabolic reprogramming and stress adaptation. AtPFK2-mediated regulation of sugar metabolism likely balances the allocation of resources between growth and defense by influencing energy supply and signaling pathways. Future studies should further investigate the interactions between AtPFK2 and other stress signaling pathways, as well as its conservation across different plant species.
According to the WGCNA analysis, the salt and drought stress samples from the AtPFK2-overexpression lines show a strong negative correlation with the candidate core genes. Many of the genes with low expression in these samples are related to transporters, stress responses, transcription factors, and hormone signaling. In contrast, the salt and drought stress samples from the pfk2 mutant exhibit a strong positive correlation with the candidate core genes, with many of the highly expressed genes also being involved in transporter functions, stress responses, transcription regulation, and hormone signaling. These categories of genes—transporters, stress-related genes, transcription factors, and hormone response genes—work synergistically to enhance plant stress resistance, aiding in the maintenance of growth, development, and survival under adverse environmental conditions [76,77,78,79]. KEGG enrichment analysis further supports this finding. The differentially expressed genes in the deep yellow and green modules are primarily enriched in pathways related to phenylpropanoid biosynthesis, plant hormone signaling, and amino acid metabolism. Meanwhile, the genes in the black and cyan modules are predominantly enriched in plant hormone signaling and plant–pathogen interactions (Figure S9). Notably, Vanholme et al. [80] observed that mutations in two key enzymes-4CL1 and CCR1-in the phenylpropanoid pathway, which is involved in lignin biosynthesis, led to impaired lignin production. This disruption resulted in a 40% increase in water loss under drought conditions and reduced drought tolerance. Pauwels et al. [81] found that the absence of JA-induced activation of antioxidant genes, such as GSTU24, caused a threefold increase in MDA content under salt stress. Additionally, Pieterse et al. [82] demonstrated that pathogen-induced salicylic acid signaling activates PR genes via NPR1, enhancing PAL activity and promoting lignin synthesis, which in turn improves drought tolerance. In conclusion, the differential gene enrichment observed under salt and drought stress treatments is consistent with previous studies. AtPFK2 plays a critical role in enhancing Arabidopsis’ stress tolerance, potentially by integrating energy metabolism and stress response pathways, thereby improving plant adaptation to both salt and drought stress.

4. Materials and Methods

4.1. Genome-Wide Identification and Sequence Analysis

Genome Data Acquisition: The reference genome and gene annotation files for Arabidopsis thaliana were downloaded from the Phytozome13 database (https://phytozome.jgi.doe.gov/ (accessed on 5 March 2025)) and the Ensembl Plants database (https://plants.ensembl.org/).
PFK Gene Identification: The PFK genes in Arabidopsis thaliana, soybean (Glycine max), rice (Oryza sativa), grape (Vitis vinifera), rapeseed (Brassica napus), and Chinese cabbage (Brassica rapa) were identified using a Hidden Markov Model (HMM) search. The PFK domain (PF00365) HMM profile was retrieved from the Pfam database (https://pfam.xfam.org/).
Domain Verification: Protein domains of AtPFK were validated using the SMART (http://smart.embl-heidelberg.de/ (accessed on 5 March 2025)) and CDD (https://www.ncbi.nlm.nih.gov/Structure/cdd/wrpsb.cgi (accessed on 5 March 2025)) online tools.

4.2. Prediction of Physiochemical Properties and Subcellular Localization

The biophysical and chemical properties of AtPFK proteins, including molecular weight, theoretical isoelectric point (pI), amino acid composition, atomic composition, extinction coefficient, estimated half-life, instability index, and aliphatic index, were analyzed using the Expasy ProtParam tool (https://web.expasy.org/protparam/ (accessed on 5 March 2025)). Subcellular localization of AtPFK proteins was predicted using the WoLF PSORT(v0.2) tool (https://wolfpsort.hgc.jp/ (accessed on 5 March 2025)).

4.3. Phylogenetic Analysis

The phylogenetic tree was constructed using the Neighbor-Joining (NJ) method in MEGA7 [83], with 1000 bootstrap replicates to assess the reliability of the phylogenetic relationships. The PFK genes from Arabidopsis thaliana were aligned with those from other species, including soybean, rice, grape, rapeseed, and Chinese cabbage. The phylogenetic relationships of these genes were used to classify them into distinct evolutionary groups.

4.4. Conserved Motif, Gene Structure, and cis-Element Analysis

The conserved motifs in the PFK proteins were predicted using the MEME Suite (https://meme-suite.org/meme/), setting the maximum number of motifs to 10, and visualized using TBtools (v2.310). Known domains were compared using Pfam, and motifs were modeled and analyzed with Phyre2.2 [84]. The intron–exon structure of PFK genes was examined using the Gene Structure Display Server 2.0 (http://gsds.gao-lab.org/index.php, (accessed on 5 March 2025)). The phylogenetic tree, conserved motifs, and exon–intron structures were visualized using TBtools (v2.310) [85] and Evolview (v2) [86]. The 2000 bp upstream DNA sequence of the ATG transcription start site of the PFK genes from the Arabidopsis genome was retrieved and analyzed for cis-elements using the PlantCARE website (http://bioinformatics.psb.ugent.be/webtools/plantcare/html/, (accessed on 5 March 2025)) [87]. cis-element quantities were statistically analyzed and visualized using TBtools (v2.310), and a heatmap was generated for further analysis.

4.5. Construction of AtPFK2-Overexpression Vector and Genetic Transformation in Arabidopsis

The full-length coding sequence of AtPFK2 (TAIR ID:AT5G47810) was cloned into the pCAMBIA3301 vector, and PCR primers were designed based on the open reading frame (ORF) of the NCBI reference sequence NM_124155.3. The recombinant construct was transformed into Agrobacterium tumefaciens strain GV3101 (psoup) for transformation of Arabidopsis thaliana plants (wild type) [88]. The Arabidopsis seeds used were of the Columbia (Col-0) ecotype, stored in our laboratory. Homozygous T3 transgenic lines were selected using Basta (25 mg/L) (Coolaber, Beijing, Chian) for confirmation.

4.6. RNA-Seq and qRT-PCR Analysis

Wild-type (WT) and AtPFK2-overexpressing (OE) transgenic Arabidopsis seedlings were vertically grown on 1/2 MS (Murashige and Skoog) medium for 14 days, then transferred to soil for another 8 days. The plants were treated with 300 mM NaCl and water-withholding treatments for 7 days. Samples were collected on day 3 of treatment and stored at −80 °C for RNA extraction. Wild-type (WT) Arabidopsis seedlings were collected after 6 h of NaCl and drought treatment for RT-qPCR analysis of PFK and PFPs genes. Total RNA was extracted using the RNAprep Pure Plant Kit (TIANGEN, Beijing, China). RNA-Seq libraries were prepared using the TruSeqTM RNA Sample Prep Kit (Illumina, San Diego, CA, USA), and sequencing was performed on an Illumina platform. Sequences were aligned using HISAT2, transcript assembly was conducted with StringTie (v2.2.3), and differential expression analysis was performed using DESeq2. Transcriptional profiles of the AtPFK2 gene were analyzed using heatmaps, bubble plots, and upset plots. Quantitative real-time PCR (qRT-PCR) was conducted using the Bio-Rad CFX Connect system (Bio-Rad, Hercules, CA, USA)with the Arabidopsis Actin gene as the reference. Each sample was analyzed in three technical replicates and three biological replicates.

4.7. Weighted Gene Co-Expression Network Analysis (WGCNA)

After constructing the weighted gene co-expression network analysis (WGCNA) and screening for differentially expressed genes (DEGs), we built a co-expression network of the DEGs using R software (4.4.2) and the WGCNA (v1.71) package, based on the gene expression profile matrix. To ensure a scale-free network distribution, the weight parameter power of the adjacency matrix was optimized. Power values were tested in the range of 1–30, and the correlation coefficients and average connectivity for networks corresponding to each power value were calculated. A higher correlation coefficient (with a maximum of 1) indicates that the network is closer to a scale-free distribution, while maintaining adequate gene connectivity. Therefore, we selected a power value that resulted in a sufficiently high correlation coefficient while preserving strong gene connectivity. Ultimately, we chose power = 30 to construct the neighbor connectivity matrix between genes and applied the topological overlap matrix similarity algorithm to transform this matrix into a topological overlap matrix. Based on the selected power of 30, a weighted co-expression network model was established, grouping 1627 genes and 1495 genes into 9 and 5 modules, respectively. The grey module (Grey) represents genes that cannot be assigned to any module and holds no significant reference value. These modules were then correlated with sample traits, and the correlation between each module and sample traits was calculated. After identifying significantly correlated modules, we performed GO and KEGG annotation and enrichment analyses on the genes within these modules. Finally, candidate core genes were visualized using Cytoscape 3.10.3 software, and the degree of each gene was calculated using the Centiscape 2.2 plugin to visualize the co-expression network. Node size was proportional to the degree, and genes with the highest degree were selected as hub genes.

4.8. Abiotic Stress Tolerance Assays

The wild-type (Arabidopsis thaliana Col-0) and mutant (pfk2-TDNA) lines were used in this experiment. Seeds were first sterilized with 70% ethanol for 1 min, followed by treatment with a 5% sodium hypochlorite solution for 10 min, and then washed five times with sterile water to remove any residual disinfectant. The sterilized seeds were evenly sown on 1/2 Murashige & Skoog (MS) medium (containing 3% sucrose and 0.8% agar, pH 5.8). The plates were cold-stratified at 4 °C in the dark for 2 days, then transferred to a growth chamber with a 16 h light/8 h dark cycle at 22 °C. After 7 days of cultivation, the seedlings were subjected to salt and simulated drought stress treatments. The mutant (pfk2-TDNA) lines were vertically placed on 1/2 MS medium plates containing different concentrations of NaCl (100 mM) and mannitol (300 mM), and after 7 days, the primary root lengths of the seedlings were measured using a ruler. At least four seedlings were measured per treatment, and the average root length was recorded. After 14 days of cultivation, the above-ground parts and root systems of the seedlings were collected, and surface moisture was removed using filter paper before weighing with an analytical balance to record the fresh weight. At least four seedlings were measured per treatment, and the average weight was recorded. For wild-type (WT) and AtPFK2-overexpressing (OE-PFK2) Arabidopsis seedlings, after vertical growth on 1/2 MS medium for 14 days, they were transplanted into soil and grown under greenhouse conditions at 22 °C with a 12 h light/12 h dark cycle for 8 days. Subsequently, the salt treatment group was irrigated with 2 L of a 300 mM NaCl solution per pot, and the control group was irrigated with the same volume of water. The drought treatment and control groups were subjected to water withholding, and the salt and drought stress treatments were maintained for one week. After treatment, the seedlings were photographed for records.

4.9. Determination of Proline, MDA, Chlorophyll, and Soluble Sugar Contents

To assess the effects of salt and drought treatments, seeds of wild-type (WT) and AtPFK2-overexpressing (OE) plants were grown on 1/2 MS medium for 14 days, then transplanted into soil for an additional 8 days of growth. The plants were then divided into two groups and treated under normal conditions with water, 300 mM NaCl, or water withholding for 1 week. Prolin, malondialdehyde (MDA), chlorophyll, and soluble sugar contents were measured using Proline (Pro) Content Assay Kit (Solar bio, BC0290, Beijing, China), Malondialdehyde (MDA) Content Assay Kit (Solar bio, BC0020), Plant Chlorophyll Content Assay Kit (Solar bio, BC0990), and Plant Soluble Sugar Content Assay Kit (Solar bio, BC0030), respectively [89].

4.10. Statistical Analysis

Statistical significance was determined using Student’s t-test. A p-value of <0.05 was considered statistically significant. All experiments were performed with at least three biological replicates and three technical replicates.

5. Conclusions

In this study, 11 PFK genes in Arabidopsis were identified and classified into two subfamilies: PFK and PFP. The AtPFK2 gene, belonging to the PFK subfamily, possesses a simple gene structure with a single intron. A significant number of stress- and hormone-responsive cis-elements were identified in its promoter region, suggesting that AtPFK2 plays a critical role in regulating development and stress responses in Arabidopsis. Physiological analyses revealed that the AtPFK2 protein mitigates the effects of salt and drought stress. Additionally, co-expression network analysis through WGCNA uncovered co-expression modules with other proteins, with nine and five modules associated with the regulation of salt and drought stress, respectively. These findings provide a valuable foundation for further investigations into the biological functions of PFK proteins in plant growth, development, and stress adaptation.

Supplementary Materials

The following supporting information can be downloaded at: https://www.mdpi.com/article/10.3390/ijms26146828/s1.

Author Contributions

R.Z. and S.L. conceived and designed the experiments; S.L. and Y.T. conducted the experiments analyzed the data; S.L., J.G. and Y.W. wrote this manuscript; R.Z. reviewed this manuscript. All authors have read and agreed to the published version of the manuscript.

Funding

This work was supported by Biological Breeding-National Science and Technology Major Project (No. 2023ZD0404001) and the National Natural Science Foundation (No. 2022YFD1200304-3).

Institutional Review Board Statement

Not applicable.

Informed Consent Statement

Not applicable.

Data Availability Statement

The raw transcriptome data generated in this study have not yet been submitted to the NCBI Sequence Read Archive. While data sharing is essential for validating and ensuring the reproducibility of results, the data have not been made publicly available as they are still undergoing further analysis. We acknowledge the importance of data sharing and will provide the data upon request for further validation or other research purposes.

Conflicts of Interest

The authors declare no conflicts of interest.

References

  1. Arunachalam, E.; Keber, F.C.; Law, R.C.; Kumar, C.K.; Shen, Y.; Park, J.O.; Wühr, M.; Needleman, D.J. Robustness of mitochondrial biogenesis and respiration explain aerobic glycolysis. bioRxiv 2024. [Google Scholar]
  2. Khanna, M. Plant Metabolism during Water Deficit Stress: A Review. Agric. Rev. 2024, 45, 448–455. [Google Scholar] [CrossRef]
  3. Krasensky, J.; Jonak, C. Drought, salt, and temperature stress-induced metabolic rearrange-ments and regulatory networks. J. Exp. Bot. 2012, 63, 1593. [Google Scholar] [CrossRef] [PubMed]
  4. Baena-González, E.; Sheen, J. Convergent energy and stress signaling. Trends Plant Sci. 2008, 13, 474–482. [Google Scholar] [CrossRef]
  5. Dumont, S.; Rivoal, J. Consequences of oxidative stress on plant glycolytic and respiratory metabolism. Front. Plant Sci. 2019, 10, 166. [Google Scholar] [CrossRef]
  6. Hasanuzzaman, M.; Bhuyan, M.H.M.B.; Parvin, K.; Bhuiyan, T.F.; Fujita, M. Regulation of ROS metabolism in plants under environmental stress: A review of recent experimental evidence. Int. J. Mol. Sci. 2020, 21, 8695. [Google Scholar] [CrossRef]
  7. Gupta, B.; Huang, B. Mechanism of salinity tolerance in plants: Physiological, biochemical, and molecular characterization. Int. J. Genom. 2014, 2014, 701596. [Google Scholar] [CrossRef]
  8. Aoki, M.; Kaku, K.; Inoue, H.; Matsutani, A.; Kaneko, T. Tolbutamide inhibits cAMP-dependent phosphorylation of liver 6-phosphofructo-2-kinase/fructose-2, 6-bisphosphatase. Diabetes 1992, 41, 334–338. [Google Scholar] [CrossRef]
  9. Rasal, K.D.; Iquebal, M.A.; Dixit, S.; Vasam, M.; Sundaray, J.K. Revealing alteration in the hepatic glucose metabolism of genetically improved carp, jayanti rohu labeo rohita fed a high carbohydrate diet using transcriptome sequencing. Int. J. Mol. Sci. 2020, 21, 8180. [Google Scholar] [CrossRef]
  10. Kleszcz, R.; Paluszczak, J.; Belka, M.; Krajka-Kuniak, V. PRI-724 and IWP-O1 wnt signaling pathway inhibitors modulate the expression of glycolytic enzymes in tongue cancer cell lines. Curr. Issues Mol. Biol. 2023, 45, 9579–9592. [Google Scholar] [CrossRef]
  11. Ferreira, J.C.; Villanueva, A.J.; Fadl, S.; Adem, K.A.; Cinviz, Z.N.; Nedyalkova, L.; Cardoso, T.H.S.; Andrade, M.E.; Saksena, N.K.; Sensoy, O. Residues in the fructose-binding pocket are required for ketohexokinase-A activity. J. Biol. Chem. 2024, 300, 16. [Google Scholar] [CrossRef] [PubMed]
  12. Zhang, L.L.; Zhu, H.; Chen, C.Y.; Shang, N.N.; Sheng, L.X.; Yu, J.Q. The function of an apple ATP-dependent Phosphofructokinase gene MdPFK5 in regulating salt stress. Physiol. Plant. 2024, 176, e13931. [Google Scholar] [CrossRef] [PubMed]
  13. Du, Y.; Zhao, Q.; Chen, L.; Yao, X.; Zhang, W.; Zhang, B.; Xie, F. Effect of Drought Stress on Sugar Metabolism in Leaves and Roots of Soybean Seedlings. Plant. Physiol. Biochem. 2020, 146, 1–12. [Google Scholar] [CrossRef] [PubMed]
  14. Xu, W.; Cui, K.; Xu, A.; Nie, L.; Huang, J.; Peng, S. Drought Stress Condition Increases Root to Shoot Ratio via Alteration of Carbohydrate Partitioning and Enzymatic Activity in Rice Seedlings. Acta Physiol. Plant. 2015, 37, 1–11. [Google Scholar] [CrossRef]
  15. Mustroph, A.; Sonnewald, U.; Biemelt, S. Characterisation of the ATP-dependent phosphofructokinase gene family from Arab. thaliana. FEBS Lett. 2007, 581, 2401–2410. [Google Scholar] [CrossRef]
  16. Kelly, G.J.; Latzko, E. Evidence for phosphofructokinase in chloroplasts. Nature 1975, 256, 429–430. [Google Scholar] [CrossRef]
  17. Kelly, G.J.; Latzko, E. Chloroplast phosphofructokinase: I. Proof of phosphofructokinase activity in chloroplasts. Plant Physiol. 1977, 60, 290–294. [Google Scholar] [CrossRef]
  18. Kelly, G.J.; Latzko, E. Chloroplast phosphofructokinase: II. Partial purification, kinetic and regulatory properties. Plant Physiol. 1977, 60, 295–299. [Google Scholar] [CrossRef]
  19. Hausler, R.E.; Holtum, J.A.M.; Latzko, E. Cytosolic ATP-dependent Phosphofructokinase from Spinach. Plant Physiol. 1987, 84, 205–207. [Google Scholar] [CrossRef]
  20. Hausler, R.E.; Holtum, J.A.M.; Latzko, E. Cytosolic phosphofructokinase from spinach leaves: I. Purification, characteristics, and regulation. Plant Physiol. 1989, 90, 1498–1505. [Google Scholar] [CrossRef]
  21. Hausler, R.E.; Holtum, J.A.M.; Latzko, E. Cytosolic Phosphofructokinase from Spinach Leaves: II. Affinity for Mg2+ and Nucleoside Phosphates. Plant Physiol. 1989, 90, 1506–1512. [Google Scholar] [CrossRef] [PubMed]
  22. Carnal, W.; Black, C.C. Pyrophosphate-dependent 6-phosphofructokinase, a new glycolytic enzyme in pineapple leaves. Biochem. Biophys. Res. Commun. 1979, 86, 20–26. [Google Scholar] [CrossRef] [PubMed]
  23. Takeshige, K.; Tazawa, M. Determination of the inorganic pyrophosphate level and its subcellular localization in Chara corallina. J. Biol. Chem. 1989, 264, 3262. [Google Scholar] [CrossRef]
  24. Lyu, J.; Jin, N.; Meng, X.; Jin, L.; Wang, S.Y.; Xiao, X.M.; Liu, Z.C.; Tang, Z.Q.; Yu, J.H. Exogenous silicon alleviates the adverse effects of cinnamic acid-induced autotoxicity stress on cucumber seedling growth. Front. Plant Sci. 2022, 13, 968514. [Google Scholar] [CrossRef]
  25. Zhao, J.F.; Yu, A.L.; Du, Y.W.; Wang, G.H.; Zhao, G.Y.; Wang, X.D.; Zhang, W.Z.; Cheng, K.; Liu, X.; Wang, Z.H.; et al. Foxtail millet (Setaria italica (L.) P. Beauv) CIPKs are responsive to ABA and abiotic stresses. PLoS ONE 2019, 14, e0225091. [Google Scholar] [CrossRef]
  26. Winkler, C.; Delvos, B.; Martin, W.; Henze, K. Purification, microsequencing and cloning of spinach ATP-dependent phosphofructokinase link sequence and function for the plant enzyme. FEBS J. 2007, 274, 429–438. [Google Scholar] [CrossRef]
  27. Lin, W.X.; Wu, L.K.; Lin, S.; Zhang, A.J.; Zhou, M.M.; Lin, R.; Wang, H.B.; Chen, J.; Zhang, Z.X.; Lin, R.Y. Metaproteomic analysis of ratoon sugarcane rhizospheric soil. BMC Microbiol. 2013, 13, 1–13. [Google Scholar] [CrossRef]
  28. Enomoto, T.; Ohyama, H.; Kodama, M. Purification and characterization of pyrophosphate: D-fructose 6-phosphate 1-phosphotransferase from rice seedlings. Biosci. Biotechnol. Biochem. 1992, 56, 251–255. [Google Scholar] [CrossRef]
  29. Mertens, E. Pyrophosphate-dependent phosphofructokinase, an anaerobic glycolytic enzyme? FEBS Lett. 1991, 285, 1–5. [Google Scholar] [CrossRef]
  30. Mertens, E.; Larondelle, Y.; Hers, H.G. Induction of pyrophosphate: Fructose 6-phosphate 1-phosphotransferase by anoxia in rice seedlings. Plant Physiol. 1990, 93, 584–587. [Google Scholar] [CrossRef]
  31. Klepikova, A.V.; Kasianov, A.S.; Gerasimov, E.S.; Logacheva, M.D.; Penin, A.A. A high resolution map of the Arabidopsis thaliana developmental transcriptome based on RNA-seq profiling. Plant J. 2016, 88, 1058–1070. [Google Scholar] [CrossRef] [PubMed]
  32. Jiang, L.H.; Dong, C.; Liu, T.F.; Shi, Y.; Wang, H.D.; Tao, Z.; Liang, Y.; Lian, J.Z. Improved functional expression of cytochrome P450s in Saccharomyces cerevisiae through screening a cDNA library from Arab. thaliana. Front. Bioeng. Biotechnol. 2021, 9, 764851. [Google Scholar]
  33. Nabi, R.B.S.; Tayade, R.; Deshmukh, R.; Hussain, A.; Shahid, M.; Adhikari, A.; AbuQamar, F.S.; Yun, B.W. The stress-induced gene AtDUF569 positively regulates salt stress responses in Arabidopsis thaliana. BMC Plant Biol. 2025, 25, 1–15. [Google Scholar] [CrossRef] [PubMed]
  34. Long, G.S.; Hussen, M.; Dench, J. Stéphane Aris-Brosou. Identifying genetic determinants of complex phenotypes from whole genome sequence data. bioRxiv 2019. [Google Scholar]
  35. Eisen, M.B.; Spellman, P.T.; Brown, P.O.; Botstein, D. Cluster analysis and display of genome-wide expression patterns. Proc. Natl. Acad. Sci. USA 1998, 95, 14863–14868. [Google Scholar] [CrossRef]
  36. Jaina, M.; Sara, C.; Lowri, W.; Matloob, Q.; Gustavoa, S.; Sonnhammer, E.L.L.; Tosatto, S.C.E.; Paladin, L.; Raj, S.; Richardson, L.; et al. Pfam: The protein families database in 2021. Nucleic. Acids. Res. 2021, 49, D412–D419. [Google Scholar]
  37. Lamesch, P.; Berardini, T.Z.; Li, D.; Swarbreck, D.; Huala, E. The Arabidopsis information resource (TAIR): Improved gene annotation and new tools. Nucleic Acids Res. 2012, 40, D1202–D1210. [Google Scholar] [CrossRef]
  38. He, S.C.; Xu, L.; Wu, W.H.; Zhang, J.J.; Hao, Z.D.; Lu, L.; Shi, J.S.; Chen, J.H. The identification and expression analysis of the liriodendron chinense F-box gene family. Plants 2024, 13, 171. [Google Scholar] [CrossRef]
  39. Zhu, Y.; Wu, N.N.; Song, W.L.; Yin, G.J.; Qin, Y.J.; Yan, Y.M.; Hu, Y.K. Soybean (Glycine max) expansin gene superfamily origins: Segmental and tandem duplication events followed by divergent selection among subfamilies. BMC Plant Biol. 2014, 14, 93. [Google Scholar] [CrossRef]
  40. Zhang, F.F.; Liu, Y.X.; Liu, F.; Yang, J.; Sohail, A.; Lu, C.K.; Xu, P. Genome-wide characterization and analysis of rice DUF247 gene family. BMC Genom. 2024, 25, 613. [Google Scholar] [CrossRef]
  41. Roulin, A.; Auer, P.L.; Libault, M.; Schlueter, J.; Farmer, A.; May, G.; Stacey, G.; Doerge, R.W.; Jackson, S.A. The fate of duplicated genes in a polyploid plant genome. Plant J. 2013, 73, 143–153. [Google Scholar] [CrossRef] [PubMed]
  42. Jiang, L.W.; Wang, P.G.; Jia, H.C.; Wu, T.T.; Yuan, S.; Jiang, B.J.; Sun, S.; Zhang, Y.X.; Wang, L.W.; Han, T.F. Haplotype Analysis of GmSGF14 Gene Family Reveals Its Roles in Photoperiodic Flowering and Regional Adaptation of Soybean. Int. J. Mol. Sci. 2023, 24, 9436. [Google Scholar] [CrossRef]
  43. Fan, C.M.; Xu, W.; Wang, Y.W.; Hu, R.B.; Zhang, X.M.; Chen, J.X.; Fu, Y.F.; Zhang, T. Genome-wide expression analysis of soybean MADS genes showing potential function in the seed development. PLoS ONE 2013, 8, e62288. [Google Scholar] [CrossRef] [PubMed]
  44. Zhang, Y.; Zagnitko, O.; Rodionova, I.; Osterman, A.; Godzik, A. The FGGY carbohydrate kinase family: Insights into the evolution of functional specificities. PLOS Comput. Biol. 2011, 7, 1–13. [Google Scholar] [CrossRef]
  45. Huang, X.L.; Tian, T.; Chen, J.Z.; Wang, D.; Tong, B.L.; Liu, J.M. Transcriptome analysis of Cinnamomum migao seed germination in medicinal plants of southwest China. BMC Plant Biol. 2021, 21, 270. [Google Scholar] [CrossRef]
  46. Wang, H.T.; Zhou, X.S.; Liu, C.C.; Li, W.X.; Guo, W.Z. Suppression of GhGLU19 encoding β-1,3-glucanase promotes seed germination in cotton. BMC Plant Biol. 2022, 22, 1–15. [Google Scholar] [CrossRef]
  47. Lourkisti, R.; Antoine, S.; Pailly, O.; Luro, F.; Gibon, Y.; Oustric, J.; Berti, L. GABA shunt pathway is stimulated in response to early defoliation-induced carbohydrate limitation in mandarin fruits. Heliyon 2023, 9, e15573. [Google Scholar] [CrossRef]
  48. Lynch, E.M.; Hansen, H.; Salay, L.; Cooper, M.; Timr, S.; Kollman, J.M.; Kollman, J.M. Structural basis for allosteric regulation of human phosphofructokinase-1. Nat. Commun. 2024, 15, 7323. [Google Scholar] [CrossRef]
  49. Strater, N.; Marek, S.; Kuettner, E.B.; Kloos, M.; Keim, A.; Bruser, A.; Kirchberger, J.; Schoneberg, T. Molecular architecture and structural basis of allosteric regulation of eukaryotic phosphofructokinases. Faseb J. 2011, 25, 89–98. [Google Scholar] [CrossRef]
  50. Siebers, B.; Hensel, R. Pyrophosphate-dependent phosphofructokinase from Thermoproteus tenax. Methods Enzymol. 2001, 331, 54–62. [Google Scholar]
  51. Dunker, A.K.; Lawson, J.D.; Brown, C.J.; Williams, R.M.; Romero, P.; Oh, J.S.; Oldfield, C.J.; Campen, A.M.; Ratliff, C.M.; Hipps, K.W.; et al. Intrinsically disordered protein. J. Mol. Graph. Model. 2001, 19, 26–59. [Google Scholar] [CrossRef] [PubMed]
  52. Kempa, S.; Krasensky, J.; Santo, S.D.; Kopka, J.; Jonak, C. A central role of abscisic acid in stress-regulated carbohydrate metabolism. PLoS ONE 2008, 3, e3935. [Google Scholar] [CrossRef] [PubMed]
  53. Ruan, L. Sucrose Metabolism: Gateway to Diverse Carbon Useand Sugar Signaling. Annu. Rev. Plant Biol. 2014, 65, 33–67. [Google Scholar] [CrossRef]
  54. Rook, F.; Hadingham, S.A.; Li, Y.H.; Bevan, M.W. Sugar and aba response pathways and the control of gene expression. Plant Cell Environ. 2006, 29, 426–434. [Google Scholar] [CrossRef]
  55. Zhang, Y.; Zhu, J.; Khan, M.; Wang, Y.; Xiao, W.; Fang, T.; Qu, J.; Xiao, P.; Li, C.L.; Liu, J.H. Transcription factors ABF4 and ABR1 synergistically regulate amylase-mediated starch catabolism in drought tolerance. Plant Physiol. 2023, 191, 591–609. [Google Scholar] [CrossRef]
  56. Lee, J.M.; Hammarén, H.M.; Savitski, M.M.; Baek, S.H. Control of protein stability by post-translational modifications. Nat. Commun. 2023, 14, 201. [Google Scholar] [CrossRef]
  57. Hu, Y.Q.; Xu, W.X.; Chen, L. Post-translational modifications and the reprogramming of tumor metabolism. Discov. Oncol. 2025, 16, 929. [Google Scholar] [CrossRef]
  58. Jansson, S. The light-harvesting chlorophyll a/b-binding proteins. Biochim. Et. Biophys. Acta 1994, 1184, 1–19. [Google Scholar] [CrossRef]
  59. Verslues, P.E.; Sharma, S. Proline metabolism and its implications for plant-environment interaction. Arab. Book 2010, 8, e0140. [Google Scholar] [CrossRef]
  60. Herbers, K.; Meuwly, P.; Jean-Pierre Métraux Sonnewald, U. Salicylic acid-independent induction of pathogenesis-related protein transcripts by sugars is dependent on leaf developmental stage. FEBS Lett. 1996, 397, 239–244. [Google Scholar] [CrossRef]
  61. Sakaki, T.; Kondo, N.; Sugahara, K. Breakdown of photosynthetic pigments and lipids in spinach leaves with ozone fumigation: Role of active oxygens. Physiol. Plant. 2010, 59, 28–34. [Google Scholar] [CrossRef]
  62. Mittler, R.; Vanderauwera, S.; Gollery, M.; Breusegem, F.V. Reactive oxygen gene network of plants. Trends Plant Sci. 2004, 9, 490–498. [Google Scholar] [CrossRef] [PubMed]
  63. Thalmann, M.; Pazmino, D.; Seung, D.; Horrer, D.; Nigro, A.; Meier, T.; Ling, K.K.; Pfeifhofer, H.W.; Zeeman, S.C.; Santelia, D. Regulation of leaf starch degradation by abscisic acid is important for osmotic stress tolerance in plants. Plant Cell 2016, 28, 1860. [Google Scholar] [CrossRef] [PubMed]
  64. Wim, V.D.E.; El-Esawe, S.K. Sucrose signaling pathways leading to fructan and anthocyanin accumulation: A dual function in abiotic and biotic stress responses? Environ. Exp. Bot. 2014, 108, 4–13. [Google Scholar]
  65. Petrillo, E.; Herz, M.A.G.; Barta, A.; Kalyna, M.; Kornblihtt, A.R. Let there be light: Regulation of gene expression in plants. RNA Biol. 2014, 11, 1215–1220. [Google Scholar] [CrossRef]
  66. Karam, M.A.; Abd-Elgawad, M.E.; Ali, R.M. Differential gene expression of salt-stressed Peganum harmala L. Genet. Eng. Biotechnol. J. 2016, 14, 319–326. [Google Scholar] [CrossRef]
  67. Mustroph, A.; Stock, J.; Hess, N.; Aldous, S.; Grimm, B. Characterization of the phosphofructokinase gene family in rice and its expression under oxygen deficiency stress. Front. Plant Sci. 2013, 4, 125. [Google Scholar] [CrossRef]
  68. Rognoni, S.; Teng, S.; Arru, L.; Smeekens, S.C.M.; Perata, P. Sugar effects on early seedling development in Arabidopsis. Plant Growth Regul. 2007, 52, 217–228. [Google Scholar] [CrossRef]
  69. Gong, M.; Chen, B.O.; Li, Z.G.; Guo, L.H. Heat-shock-induced cross adaptation to heat, chilling, drought and salt stress in maize seedlings and involvement of H2O2. J. Plant Physiol. 2001, 158, 1125–1130. [Google Scholar] [CrossRef]
  70. Yang, L.; Ji, W.; Zhu, Y.; Gao, P.; Li, Y.; Cai, H.; Bai, X.; Guo, D. GsCBRLK, a calcium/calmodulin-binding receptor-like kinase, is a positive regulator of plant tolerance to salt and ABA stress. J. Exp. Bot. 2010, 61, 2519–2533. [Google Scholar] [CrossRef]
  71. Yu, S.; Cao, L.; Zhou, C.M.; Zhang, T.Q.; Lian, H.; Sun, Y.; Wu, J.Q.; Huang, J.; Wang, G.D.; Wang, J.W. Sugar is an endogenous cue for juvenile-to-adult phase transition in plants. eLife 2013, 2, e00269. [Google Scholar] [CrossRef] [PubMed]
  72. Jeroen, L.; Johannes, H.; Sjef, S. Sugar signals and the control of plant growth and development. J. Exp. Bot. 2014, 65, 799–807. [Google Scholar]
  73. Obata, T.; Fernie, A. The use of metabolomics to dissect plant responses to abiotic stresses. Cell. Mol. Life Sci. 2012, 69, 3225–3243. [Google Scholar] [CrossRef]
  74. Fernie, A.R.; Stitt, M. On the discordance of metabolomics with proteomics and transcriptomics: Coping with increasing complexity in logic, chemistry, and network interactions. Plant Physiol. 2012, 158, 1139–1145. [Google Scholar] [CrossRef]
  75. Liu, X.; Hou, X. Antagonistic regulation of ABA and GA in metabolism and signaling pathways. Front. Plant Sci. 2018, 9, 251. [Google Scholar] [CrossRef]
  76. Zhu, J.K. Plant salt tolerance. Trends Plant Sci. 2001, 6, 66–71. [Google Scholar] [CrossRef]
  77. Zulfiqar, F.; Akram, N.A.; Ashraf, M. Osmoprotection in plants under abiotic stresses: New insights into a classical phenomenon. Planta 2020, 251, 3. [Google Scholar] [CrossRef]
  78. El-Esawi, M. Regulation of genes and transcriptional factors involved in plant responses to abiotic stress. In Plant Life Under Changing Environment; Academic Press: Cambridge, MA, USA, 2020; pp. 825–833. [Google Scholar]
  79. Zhu, J.K. Salt and drought stress signal transduction in plants. Annu. Rev. Plant Biol. 2002, 53, 247–273. [Google Scholar] [CrossRef]
  80. Vanholme, R.; Storme, V.; Vanholme, B.; Sundin, L.; Christensen, J.H.; Goeminne, G.; Halpin, C.; Rohde, A.; Morreel, K.; Boerjan, W. A systems biology view of responses to lignin biosynthesis perturbations in Arabidopsis. Plant Cell 2012, 24, 3506–3529. [Google Scholar] [CrossRef]
  81. Pauwels, L. Jasmonate signalling in Arabidopsis thaliana. Ph.D. Thesis, Ghent University, Gent, Belgium, 2009. [Google Scholar]
  82. Pieterse, C.M.; Leon-Reyes, A.; Van der Ent, S.; Van Wees, S.C. Networking by small-molecule hormones in plant immunity. Nat. Chem. Biol. 2009, 5, 308–316. [Google Scholar] [CrossRef]
  83. Sudhir, K.; Glen, S.; Koichiro, T. MEGA7: Molecular evolutionary genetics analysis version 7.0 for bigger datasets. Mol. Biol. Evol. 2016, 33, 1870–1874. [Google Scholar]
  84. Powell, H.R.; Islam, S.A.; David, A.; Sternberg, M.J.E. Phyre2.2: A Community Resource for Template-based Protein Structure Prediction. J. Mol. Biol. 2025, 437, 168960. [Google Scholar] [CrossRef] [PubMed]
  85. Ma, Y.; Song, J.F.; Sheng, S.A.; Wang, D.J.; Wang, T.T.; Wang, N.; Chen, A.R.; Wang, L.X.; Peng, Y.X.; Ma, Y.H.; et al. Genome-wide characterization of Solanum tuberosum UGT gene family and functional analysis of StUGT178 in salt tolerance. BMC Genom. 2024, 25, 1206. [Google Scholar] [CrossRef] [PubMed]
  86. Subramanian, B.; Gao, S.H.; Lercher, M.J.; Hu, S.N.; Chen, W.H. Evolview v3: A webserver for visualization, annotation, and management of phylogenetic trees. Nucleic Acids Res. Issue 2019, 47, W270–W275. [Google Scholar] [CrossRef]
  87. Lesco, M.; Dehais, P.; Thijs, G.; Marchal, K.; Moreau, Y.; Van de Peer, Y.; Rouzé, P.; Rombauts, S. PlantCARE, a database of plant cis-acting regulatory elements and a portal to tools for in silico analysis of promoter sequences. Nucleic Acids Res. 2002, 30, 325–327. [Google Scholar] [CrossRef]
  88. Clough, S.J.; Bent, A.F. Floral dip: A simplified method for Agrobacterium-mediated transformation of Arabidopsis thaliana. Plant J. 1999, 16, 735–743. [Google Scholar] [CrossRef]
  89. Kim, J.H.; Cho, A.Y.; Lim, S.D.; Jang, C.S. Mutation of a RING E3 ligase, OsDIRH2, enhances drought tolerance in rice with low stomata density. Physiol. Plant. 2024, 176, 1–16. [Google Scholar] [CrossRef]
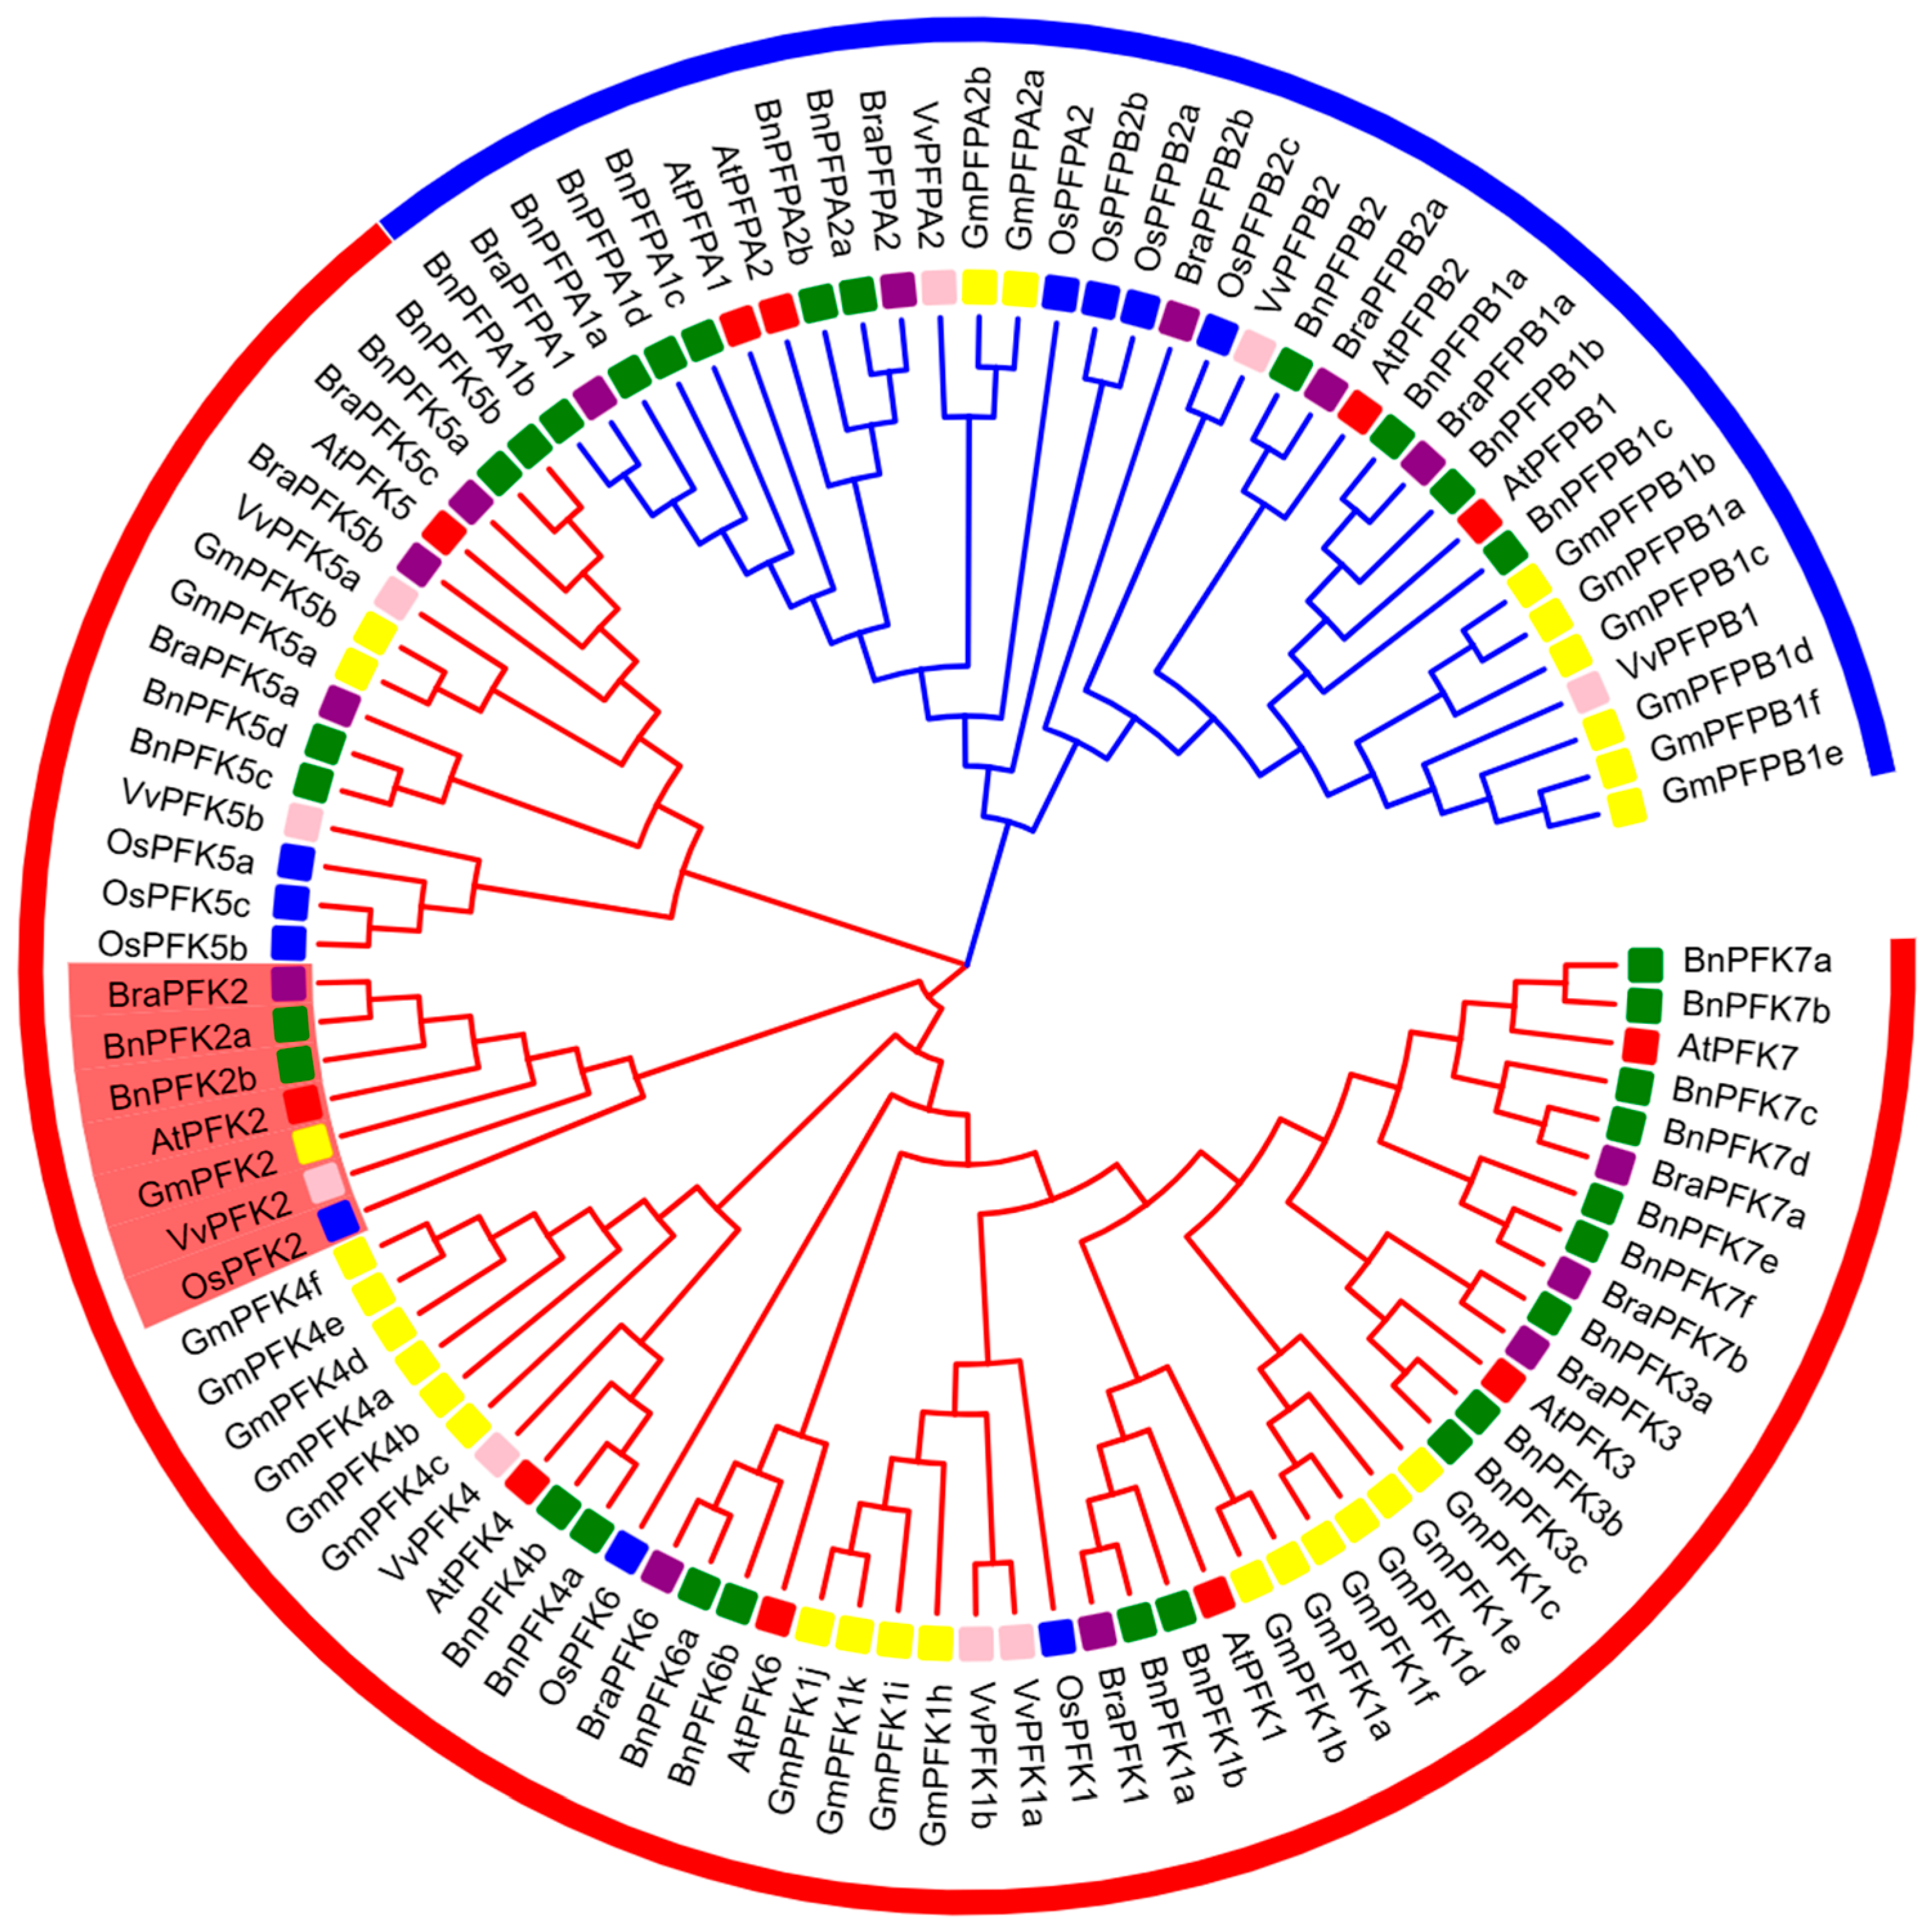
Figure 1. Phylogenetic relationships of the PFK proteins family in Arabidopsis thaliana. The phylogenetic tree was constructed using the Neighbor-Joining (NJ) method in MEGA11 software, with 1000 bootstrap replicates to assess support. In this tree, the PFK2 protein sequences from Arabidopsis thaliana were compared with PFK proteins from rice, grape, soybean, Chinese cabbage, and rapeseed. The outer rings, colored differently, represent the various species: red squares indicate Arabidopsis, blue squares represent rice, pink squares denote grape, yellow squares correspond to soybean, purple squares signify Chinese cabbage, and green squares represent rapeseed. This tree clearly illustrates the evolutionary relationships and functional divergence of the PFK protein family in Arabidopsis thaliana across different species.
Ijms 26 06828 g001
Figure 2. Features of the PFK genes in Arabidopsis thaliana. (A) A Neighbor-Joining (NJ) phylogenetic tree was constructed using MEGA11 software based on the full-length sequences of Arabidopsis thaliana PFK proteins. The tree’s reliability was assessed using 1000 bootstrap replicates. (B) Schematic representation of the gene structure of Arabidopsis thaliana PFK genes. Different colors correspond to various domains. Introns are shown as grey lines, exons as yellow rectangles, and untranslated regions (UTRs) as green rectangles. The scale bar represents 1 kb. (C) The domains of Arabidopsis thaliana PFK proteins. (D) Distribution of conserved motifs across Arabidopsis thaliana PFK proteins. Different colored boxes represent motifs 1–10, with a scale bar provided at the bottom.
Ijms 26 06828 g002
Figure 3. cis-acting elements in the promoters of Arabidopsis thaliana PFK genes. (A) Putative stress- and hormone-related cis-acting elements in the promoter regions of Arabidopsis thaliana PFK genes. These cis-acting elements were identified within the 2000-bp upstream promoter regions using the PlantCARE database. (B) Heatmap showing the distribution of putative stress-and hormone-related cis-acting elements. The names of the cis-acting elements are listed at the bottom of the figure, with numbers in the squares indicating the quantity of each element. Grey squares represent the absence of the element (quantity = 0).
Ijms 26 06828 g003
Figure 4. Functional analysis of the AtPFK2 gene in Arabidopsis thaliana grown in soil under salt and drought stress. (A) Phenotypic comparison of wild-type (WT) and AtPFK2-overexpressing (OE) seedlings grown in normal soil (without NaCl) and salt-stressed soil (300 mM NaCl). Phenotypic observations were made 21 days after transplanting 13-day-old seedlings. (BE) Levels of chlorophyll, malondialdehyde (MDA), proline, and soluble sugars in leaves. Data are expressed as the mean ± SD of three biological replicates. Asterisks indicate significant differences as determined by two-way ANOVA (** p < 0.01, *** p < 0.001, **** p < 0.0001).
Ijms 26 06828 g004
Figure 5. GO Enrichment analysis of core differentially expressed genes (DEGs) in wild-type (WT), AtPFK2-overexpression (OE), and pfk2 mutant (T-DNA) lines under salt and drought stress. (AH) show the twelve most significantly enriched biological processes for upregulated and downregulated genes. In these figures, the vertical axis represents various biological processes, and the horizontal axis displays the enrichment factor. The size of the dots corresponds to the number of enriched genes, while the color of the dots indicates the enrichment significance, represented by −log10(p-value).
Ijms 26 06828 g005aIjms 26 06828 g005b
Figure 6. RT-qPCR validation of key genes in wild-type (WT) and AtPFK2-overexpression (OE) lines. The gene names and IDs are labeled on the right. The left panel displays the RNA-Seq results under salt and drought stress, while the right panel shows the RT-qPCR results under the same conditions. Both wild-type (WT) and AtPFK2-overexpression (OE) lines were analyzed in triplicate, with Actin used as the reference gene.
Ijms 26 06828 g006
Figure 7. Analysis of upset plots for differentially expressed genes across different groups. In the main bar chart, different colors represent the number of samples in multiple combined groups, while the side bar chart displays the number of samples in each individual group. In the dot plot, each point on the horizontal axis corresponds to a gene set for each treatment, and the vertical axis represents the intersection of each gene set with others.
Ijms 26 06828 g007
Figure 8. WGCNA analysis of AtPFK2-overexpression lines under salt and drought stress. (A) The gene dendrogram for the entire transcriptome profile was constructed using average linkage hierarchical clustering, where each branch represents a gene. The module assignments from the dynamic tree cut are shown in the module colors beneath the dendrogram. (B) Correlation between module feature genes and different genotypes. The color of each module corresponds to the color in panel (A). Genotypes for each module are displayed at the bottom of the module names. The correlation coefficient and p-value are shown in each cell. (C) Scatter plot of gene significance versus module membership for the deep yellow and green modules. (D) Co-expression network of the deep yellow and green module members. Each node represents a gene or protein, and the connections between nodes indicate their interactions. The strength or number of connections may reflect the intensity or type of interactions. The color of each node may represent different categories or groups, and the size of the node may indicate the importance or activity of a gene or protein, or the number of interactions with other genes/proteins.
Ijms 26 06828 g008
Figure 9. WGCNA analysis of the pfk2 mutant lines under salt and drought stress. (A) The gene dendrogram for the entire transcriptome profile was constructed using average linkage hierarchical clustering, where each branch represents a gene. The module assignments from the dynamic tree cut are shown in the module colors below the dendrogram. (B) Correlation between module feature genes and different genotypes. The color of each module corresponds to the color in panel (A). The gene numbers for each module are displayed at the bottom of the module names. The correlation coefficient and p-value are shown in each cell. (C) Scatter plot of gene significance versus module membership for the black and cyan modules. (D) Co-expression network of the black and cyan module members. Each node represents a gene or protein, and the connections between nodes indicate their interactions. The strength or quantity of the connections may reflect the intensity or type of interactions. The color of each node may represent different categories or groups, and the size of the node may indicate the importance or activity of a gene or protein, or the number of interactions with other genes/proteins.
Ijms 26 06828 g009
Table 1. Prediction of physicochemical properties and subcellular localization of AtPFK proteins.
Gene NameGene IDChromosome LocalizationNumber of Amino AcidMolecular WeightTheoretical pIInstability IndexAliphatic IndexGrand Average of Hydropathicity
AtPFK1AT4G29220Chr447351,991.327.2236.2186.55−0.20
AtPFK2AT5G47810Chr544449,182.146.6329.2087.61−0.19
AtPFK3AT4G26270Chr448953,666.376.6140.4289.04−0.19
AtPFK4AT5G61580Chr553058,467.088.4634.9790.64−0.17
AtPFK5AT2G22480Chr253758,614.756.8139.4690.04−0.14
AtPFK6AT4G32840Chr446250,787.976.6133.1787.97−0.17
AtPFK7AT5G56630Chr548553,482.036.8740.2485.96−0.28
AtPFPA1AT1G20950Chr161467,119.186.5340.6294.38−0.08
AtPFPA2AT1G76550Chr161767,558.526.8142.0791.99−0.12
AtPFPB1AT1G12000Chr156661,459.465.8037.1788.07−0.18
AtPFPB2AT4G04040Chr456962,741.615.4436.7783.95−0.27
Table 2. The gene names, corresponding gene IDs, and UniProt IDs of the PFK and PFP gene families in different species.
SpeciesAccession (Ensembl Plants)NameAccession (UniProt)
Arabidopsis thalianaAT4g29220AtPFK1Q9M0F9
Arabidopsis thalianaAT5g47810AtPFK2Q9FIK0
Arabidopsis thalianaAT4g26270AtPFK3Q94AA4
Arabidopsis thalianaAT5g61580AtPFK4Q9FKG3
Arabidopsis thalianaAT2g22480AtPFK5Q8VYN6
Arabidopsis thalianaAT4g32840AtPFK6Q9M076
Arabidopsis thalianaAT5g56630AtPFK7Q9C5J7
Arabidopsis thalianaAT1g20950AtPFPA1Q9SYP2
Arabidopsis thalianaAT1g76550AtPFPA2Q9C9K3
Arabidopsis thalianaAT1g12000AtPFPB1Q8W4M5
Arabidopsis thalianaAT4g04040AtPFPB2F4JGR5
Oryza sativaOs01g0191700OsPFK1Q0JPZ1
Oryza sativaOs09g0479800OsPFK2Q652D3
Oryza sativaOs10g0405600OsPFK5aA0A8J8YCT6
Oryza sativaOs08g0439000OsPFK5bQ0J5F5
Oryza sativaOs09g0415800OsPFK5cA0A0P0XM93
Oryza sativaOs05g0524400OsPFK6Q65X97
Oryza sativaOs06g0326400OsPFPA2B9FT08
Oryza sativaOs09g0298100OsPFPB2aA0A0P0XL64
Oryza sativaOs08g0345700OsPFPB2bQ84QT9
Oryza sativaOs06g0247500OsPFPB2cA3BA88
Glycine maxGLYMA_06G088600GmPFK1aI1K9I0
Glycine maxGLYMA_06G088600GmPFK1bK7KU09
Glycine maxGLYMA_08G031700GmPFK1cI1KPV0
Glycine maxGLYMA_07G126400GmPFK1dI1KJS2
Glycine maxGLYMA_07G126400GmPFK1eI1KJS3
Glycine maxGLYMA_07G126400GmPFK1fI1KJS5
Glycine maxGLYMA_08G199800GmPFK1hI1KV07
Glycine maxGLYMA_13G353400GmPFK1gI1M5F6
Glycine maxGLYMA_13G353400GmPFK1iA0A0R0H5D7
Glycine maxGLYMA_15G020900GmPFK1kI1MCW1
Glycine maxGLYMA_15G020900GmPFK1JI1MCW0
Glycine maxGLYMA_07G269500GmPFK2I1KNN0
Glycine maxGLYMA_10G194300GmPFK4aA0A0R0HVU7
Glycine maxGLYMA_10G194300GmPFK4bA0A0R0HVV2
Glycine maxGLYMA_10G194300GmPFK4cI1LCJ1
Glycine maxGLYMA_10G194300GmPFK4dA0A0R0I3J4
Glycine maxGLYMA_10G194300GmPFK4eA0A0R0I3C2
Glycine maxGLYMA_10G194300GmPFK4fK7LKD1
Glycine maxGLYMA_08G280700GmPFK5aI1KX93
Glycine maxGLYMA_18G145500GmPFK5bI1N1M0
Glycine maxGLYMA_20G007400GmPFPA2aI1ND14
Glycine maxGLYMA_07G160500GmPFPA2bI1KKN7
Glycine maxGLYMA_09G007900GmPFPB1aI1KZW7
Glycine maxGLYMA_15G112300GmPFPB1bI1MFL2
Glycine maxGLYMA_15G112300GmPFPB1cA0A0R0FZ92
Glycine maxGLYMA_17G010100GmPFPB1dK7MJC5
Glycine maxGLYMA_07G263800GmPFPB1eI1KNH4
Glycine maxGLYMA_07G263800GmPFPB1fI1KNH5
Brassica napusGSBRNA2T00091362001BnPFK1aA0A078IGT7
Brassica napusGSBRNA2T00123079001BnPFK1bNO
Brassica napusGSBRNA2T00001926001BnPFK2aA0A078FZE1
Brassica napusGSBRNA2T00128839001BnPFK2bA0A816MMS9
Brassica napusGSBRNA2T00082589001BnPFK3aA0A078JTU5
Brassica napusGSBRNA2T00149578001BnPFK3bA0A816RM02
Brassica napusGSBRNA2T00157466001BnPFK3cA0A816RM02
Brassica napusGSBRNA2T00113526001BnPFK4aA0A816W200
Brassica napusGSBRNA2T00021520001BnPFK4bA0A078GCL9
Brassica napusGSBRNA2T00127444001BnPFK5aA0A816UWW4
Brassica napusGSBRNA2T00078189001BnPFK5bA0A078FKS0
Brassica napusGSBRNA2T00007196001BnPFK5cA0A078IRE3
Brassica napusGSBRNA2T00150980001BnPFK5dA0A817AB30
Brassica napusGSBRNA2T00121159001BnPFK6aNO
Brassica napusGSBRNA2T00130627001BnPFK6bA0A816R9K6
Brassica napusGSBRNA2T00073694001BnPFK7aA0A078HTA9
Brassica napusGSBRNA2T00012921001BnPFK7bA0A078G2H5
Brassica napusGSBRNA2T00052829001BnPFK7cA0A078H5N0
Brassica napusGSBRNA2T00053002001BnPFK7dA0A078H7L8
Brassica napusGSBRNA2T00060751001BnPFK7eA0A078FF53
Brassica napusGSBRNA2T00148613001BnPFK7fA0A816V1T9
Brassica napusGSBRNA2T00058643001BnPFPA1aA0A078JNQ8
Brassica napusGSBRNA2T00059752001BnPFPA1bA0A078JHX5
Brassica napusGSBRNA2T00102813001BnPFPA1cNO
Brassica napusGSBRNA2T00055023001BnPFPA1dA0A078H4Z3
Brassica napusGSBRNA2T00146592001BnPFPA2aA0A816ZCQ6
Brassica napusGSBRNA2T00147797001BnPFPA2bNO
Brassica napusGSBRNA2T00105468001BnPFPB1aNO
Brassica napusGSBRNA2T00044584001BnPFPB1bA0A078GX24
Brassica napusGSBRNA2T00057050001BnPFPB1cA0A078HAW1
Brassica napusGSBRNA2T00157791001BnPFPB2NO
Brassica rapaBra011089BraPFK1M4D3N5
Brassica rapaBra024914BraPFK2M4E808
Brassica rapaBra026452BraPFK3A0A398AM83
Brassica rapaBra010637BraPFK5aM4D2D7
Brassica rapaBra030394BraPFK5bM4ENM4
Brassica rapaBra038519BraPFK5cM4FBQ3
Brassica rapaBra011387BraPFK6M4D4I3
Brassica rapaBra002801BraPFK7aM4CF19
Brassica rapaBra006864BraPFK7bM4CRM3
Brassica rapaBra025858BraPFPA1A0A397Z4U1
Brassica rapaBra015734BraPFPA2M4DGV8
Brassica rapaBra019733BraPFPB1M4DT90
Brassica rapaBra029482BraPFPB2aM4EL15
Brassica rapaBra016799BraPFPB2bM4DJX1
Vitis viniferaVitvi11g00237VvPFK1aA0A438DRZ9
Vitis viniferaVitvi04g00040VvPFK1bD7STJ8
Vitis viniferaVitvi10g00212VvPFK2A0A438D403
Vitis viniferaVitvi16g00381VvPFK4D7U799
Vitis viniferaVitvi07g01462VvPFK5aNO
Vitis viniferaVitvi14g01938VvPFK5bA0A438D7F2
Vitis viniferaVitvi18g00037VvPFPA2F6I6W5
Vitis viniferaVitvi10g00129VvPFPB1D7TR81
Vitis viniferaVitvi12g00427VvPFPB2D7TED0
Table 3. The alignment of various motifs in the Arabidopsis thaliana PFK gene family.
SequenceMotifE-ValueEntry AccessionDescription
RRAGPRQKVYFEPDEVKACIVTCGGLCPGLNTVI12.70 × 10−17IPR035966Phosphofructokinase superfamily
RRAGPRQKVYFEPDEVKACIVTCGGLCPGLNTVI11.28 × 10−15IPR035966Phosphofructokinase superfamily
RRAGPRQKVYFEPDEVKACIVTCGGLCPGLNTVI15.70 × 10−26IPR050929Phosphofructokinase type A
RRAGPRQKVYFEPDEVKACIVTCGGLCPGLNTVI26.40 × 10−18IPR050929Phosphofructokinase type A
RRAGPRQKVYFEPDEVKACIVTCGGLCPGLNTVI26.54 × 10−12IPR035966Phosphofructokinase superfamily
RRAGPRQKVYFEPDEVKACIVTCGGLCPGLNTVI36.90 × 10−16IPR050929Phosphofructokinase type A
RRAGPRQKVYFEPDEVKACIVTCGGLCPGLNTVI38.37 × 10−10IPR035966Phosphofructokinase superfamily
RRAGPRQKVYFEPDEVKACIVTCGGLCPGLNTVI32.00 × 10−6--
GGDGTQKGAAAIFEEIRRRKLKVAVVGIPKTIDNDI41.70 × 10−13--
GGDGTQKGAAAIFEEIRRRKLKVAVVGIPKTIDNDI41.10 × 10−14IPR050929Phosphofructokinase type A
GGDGTQKGAAAIFEEIRRRKLKVAVVGIPKTIDNDI43.79 × 10−13IPR035966Phosphofructokinase superfamily
GLVNGRHTYIPFNRITEKQNKVVITDRMWARLLSSTNQPSF52.60 × 10−12IPR050929Phosphofructokinase type A
KVVNDIHKRGGTILGTSRGGHDTSKIVDSIQDRGINQVYII62.20 × 10−11--
KVVNDIHKRGGTILGTSRGGHDTSKIVDSIQDRGINQVYII63.90 × 10−16IPR050929Phosphofructokinase type A
KVVNDIHKRGGTILGTSRGGHDTSKIVDSIQDRGINQVYII61.70 × 10−8IPR035966Phosphofructokinase superfamily
KVVNDIHKRGGTILGTSRGGHDTSKIVDSIQDRGINQVYII6---
SPFYLEGKGGLFEFIEKRLKENGHMVIVIAEGAGQDLVAKSME74.19 × 10−5IPR035966Phosphofructokinase superfamily
SPFYLEGKGGLFEFIEKRLKENGHMVIVIAEGAGQDLVAKSME73.30 × 10−6IPR035966Phosphofructokinase superfamily
SPFYLEGKGGLFEFIEKRLKENGHMVIVIAEGAGQDLVAKSME76.60 × 10−15IPR050929Phosphofructokinase type A
VPHLSDYLPDLPTYPNPLQDNPAYSVVKQYFVDADDTVPQKIVVHKDSPR85.60 × 10−14IPR050929Phosphofructokinase type A
Table 4. Analysis of cis-acting elements in the −2000 bp promoter region of the AtPFK gene family in Arabidopsis thaliana.
GeneIDcis-ElementsStarting PositionTermination Position
AtPFK1AT4G29220LTR−1828−1822
AtPFK1AT4G29220CGTCA-motif−1690−1685
AtPFK1AT4G29220TGACG-motif−1690−1685
AtPFK1AT4G29220TATC-box−1270−1263
AtPFK1AT4G29220 Box 4 −636−630
AtPFK1AT4G29220 Box 4 −576−570
AtPFK1AT4G29220TCA-element−476−467
AtPFK1AT4G29220TCA-element−207−198
AtPFK1AT4G29220ABRE−139−134
AtPFK1AT4G29220G-box−139−133
AtPFK1AT4G29220LTR−22−16
AtPFK2AT5G47810LTR−1896−1890
AtPFK2AT5G47810LTR−1854−1848
AtPFK2AT5G47810TCA-element−1811−1802
AtPFK2AT5G47810CGTCA-motif−1473−1468
AtPFK2AT5G47810TGACG-motif−1473−1468
AtPFK2AT5G47810CGTCA-motif−1470−1465
AtPFK2AT5G47810TGACG-motif−1470−1465
AtPFK2AT5G47810CGTCA-motif−970−965
AtPFK2AT5G47810TGACG-motif−970−965
AtPFK2AT5G47810MBS−949−943
AtPFK2AT5G47810CGTCA-motif−922−917
AtPFK2AT5G47810TGACG-motif−922−917
AtPFK2AT5G47810P-box−659−652
AtPFK2AT5G47810ABRE−262−257
AtPFK2AT5G47810G-Box−262−256
AtPFK2AT5G47810LTR−235−229
AtPFK2AT5G47810CGTCA-motif−85−85
AtPFK2AT5G47810TGACG-motif−85−80
AtPFK2AT5G47810G-box−84−78
AtPFK2AT5G47810ABRE−83−78
AtPFK2AT5G47810G-box−56−46
AtPFK2AT5G47810ABRE−55−46
AtPFK2AT5G47810ABRE−53−48
AtPFK2AT5G47810G-box−53−47
AtPFK3AT4G26270ABRE−1887−1882
AtPFK3AT4G26270G-Box−1887−1881
AtPFK3AT4G26270CGTCA-motif−1860−1855
AtPFK3AT4G26270TGACG-motif−1860−1855
AtPFK3AT4G26270ABRE−1165−1160
AtPFK3AT4G26270G-Box−1165−1159
AtPFK3AT4G26270P-box−1093−1086
AtPFK3AT4G26270LTR−486−480
AtPFK3AT4G26270ABRE−470−463
AtPFK3AT4G26270 Box 4 −464−458
AtPFK3AT4G26270MBS−423−417
AtPFK3AT4G26270TGA-element−321−315
AtPFK4AT5G61580CGTCA-motif−1818−1813
AtPFK4AT5G61580TGACG-motif−1818−1813
AtPFK4AT5G61580 Box 4 −1546−1540
AtPFK4AT5G61580CGTCA-motif−1476−1471
AtPFK4AT5G61580TGACG-motif−1476−1471
AtPFK4AT5G61580LTR−1320−1314
AtPFK4AT5G61580LTR−1191−1185
AtPFK4AT5G61580TCA-element−609−600
AtPFK4AT5G61580MBS−581−575
AtPFK4AT5G61580CGTCA-motif−190−185
AtPFK4AT5G61580TGACG-motif−190−185
AtPFK4AT5G61580TCA-element−173−164
AtPFK5AT2G22480MBS−1594−1588
AtPFK5AT2G22480GARE-motif−1357−1350
AtPFK5AT2G22480LTR−979−973
AtPFK5AT2G22480ABRE−921−916
AtPFK5AT2G22480G-box−921−915
AtPFK5AT2G22480MBS−657−651
AtPFK5AT2G22480ABRE−593−588
AtPFK5AT2G22480G-box−593−587
AtPFK5AT2G22480MBS−538−532
AtPFK5AT2G22480TGA-element−94−88
AtPFK6AT4G32840 Box 4 −1399−1393
AtPFK6AT4G32840MBS−1220−1214
AtPFK6AT4G32840 Box 4 −854−848
AtPFK6AT4G32840LTR−659−653
AtPFK6AT4G32840 Box 4 −265−259
AtPFK6AT4G32840P-box−198−191
AtPFK6AT4G32840LTR−164−158
AtPFK6AT4G32840TGA-element−123−117
AtPFK6AT4G32840TGA-box−28−20
AtPFK6AT4G32840CGTCA-motif−25−20
AtPFK6AT4G32840TGACG-motif−25−20
AtPFK7AT5G56630GARE-motif−1788−1781
AtPFK7AT5G56630MRE−1744−1737
AtPFK7AT5G56630TC-rich repeats−1500−1491
AtPFK7AT5G56630 Box 4 −1474−1468
AtPFK7AT5G56630 Box 4 −1095−1089
AtPFK7AT5G56630LTR−955−949
AtPFK7AT5G56630TGA-element−908−902
AtPFK7AT5G56630TGA-element−771−765
AtPFK7AT5G56630 Box 4 −427−421
AtPFK7AT5G56630CGTCA-motif−321−316
AtPFK7AT5G56630TGACG-motif−321−316
AtPFK7AT5G56630TCA-element−110−101
AtPFPα1AT1G20950TATC-box−1487−1480
AtPFPα1AT1G20950G-box−1454−1448
AtPFPα1AT1G20950MBS−1430−1424
AtPFPα1AT1G20950GARE-motif−1283−1276
AtPFPα1AT1G20950LTR−1195−1189
AtPFPα1AT1G20950MRE−1026−1019
AtPFPα1AT1G20950G-box−552−546
AtPFPα1AT1G20950ATC-motif−438−430
AtPFPα1AT1G20950AuxRE−371−360
AtPFPα1AT1G20950G-box−272−264
AtPFPα1AT1G20950G-Box−270−264
AtPFPα1AT1G20950ABRE−269−264
AtPFPα1AT1G20950GARE-motif−201−194
AtPFPα2AT1G76550CGTCA-motif−1477−1472
AtPFPα2AT1G76550TGACG-motif−1477−1472
AtPFPα2AT1G76550MBS−1415−1409
AtPFPα2AT1G76550CGTCA-motif−1387−1382
AtPFPα2AT1G76550TGACG-motif−1387−1382
AtPFPα2AT1G76550ABRE−1198−1193
AtPFPα2AT1G76550P-box−1066−1059
AtPFPα2AT1G76550MBS−870−864
AtPFPα2AT1G76550ABRE−834−827
AtPFPα2AT1G76550GARE-motif−828−821
AtPFPα2AT1G76550TCA-element−769−760
AtPFPα2AT1G76550TCA-element−575−566
AtPFPα2AT1G76550LTR−253−247
AtPFPα2AT1G76550CGTCA-motif−80−75
AtPFPα2AT1G76550TGACG-motif−80−75
AtPFPβ1AT1G12000TC-rich repeats−1613−1604
AtPFPβ1AT1G12000MRE−1369−1362
AtPFPβ1AT1G12000TC-rich repeats−1111−1102
AtPFPβ1AT1G12000TC-rich repeats−1075−1066
AtPFPβ1AT1G12000Box 4 −973−967
AtPFPβ1AT1G12000LTR−925−919
AtPFPβ1AT1G12000Box 4 −818−812
AtPFPβ1AT1G12000Box 4 −421−415
AtPFPβ1AT1G12000GARE-motif−387−380
AtPFPβ1AT1G12000CGTCA-motif−75−70
AtPFPβ1AT1G12000TGACG-motif−75−70
AtPFPβ2AT4G04040P-box−1752−1745
AtPFPβ2AT4G04040CGTCA-motif−1295−1290
AtPFPβ2AT4G04040TGACG-motif−1295−1290
AtPFPβ2AT4G04040CGTCA-motif−1262−1257
AtPFPβ2AT4G04040TGACG-motif−1262−1257
AtPFPβ2AT4G04040P-box−1016−1009
AtPFPβ2AT4G04040TGA-element−599−593
AtPFPβ2AT4G04040TGA-element−566−560
Table 5. Functional annotation of Hub genes in the key modules.
ModuleNameGene IDTFs FamilyKEGG PathwayUniprot Annotation
DeepyellowLBD41AT3G02550LBDNOLOB domain-containing protein 41
GreenTRP3AT3G54640NOGlycine, serine and threonine metabolismIndole-3-glycerol-phosphate lyase
GreenPP2-A3AT2G26820IARNOImmune-associated nucleotide-binding protein 1
BlackSAUR10AT2G18010NOPlant hormone signal transductionProtein SMALL AUXIN UP-REGULATED RNA 10
BlackIAA6AT1G52830Aux/IAAPlant hormone signal transductionAuxin-responsive protein IAA6
TurquoiseJAZ1AT1G19180JAZPlant hormone signal transductionJasmonate ZIM domain-containing protein 1
Disclaimer/Publisher’s Note: The statements, opinions and data contained in all publications are solely those of the individual author(s) and contributor(s) and not of MDPI and/or the editor(s). MDPI and/or the editor(s) disclaim responsibility for any injury to people or property resulting from any ideas, methods, instructions or products referred to in the content.