

Causal Inference and Shared Molecular Pathways in Crohn’s Disease, Celiac Disease, and Ankylosing Spondylitis: Integrative Mendelian Randomization and Transcriptomic Analysis
Abstract
1. Introduction
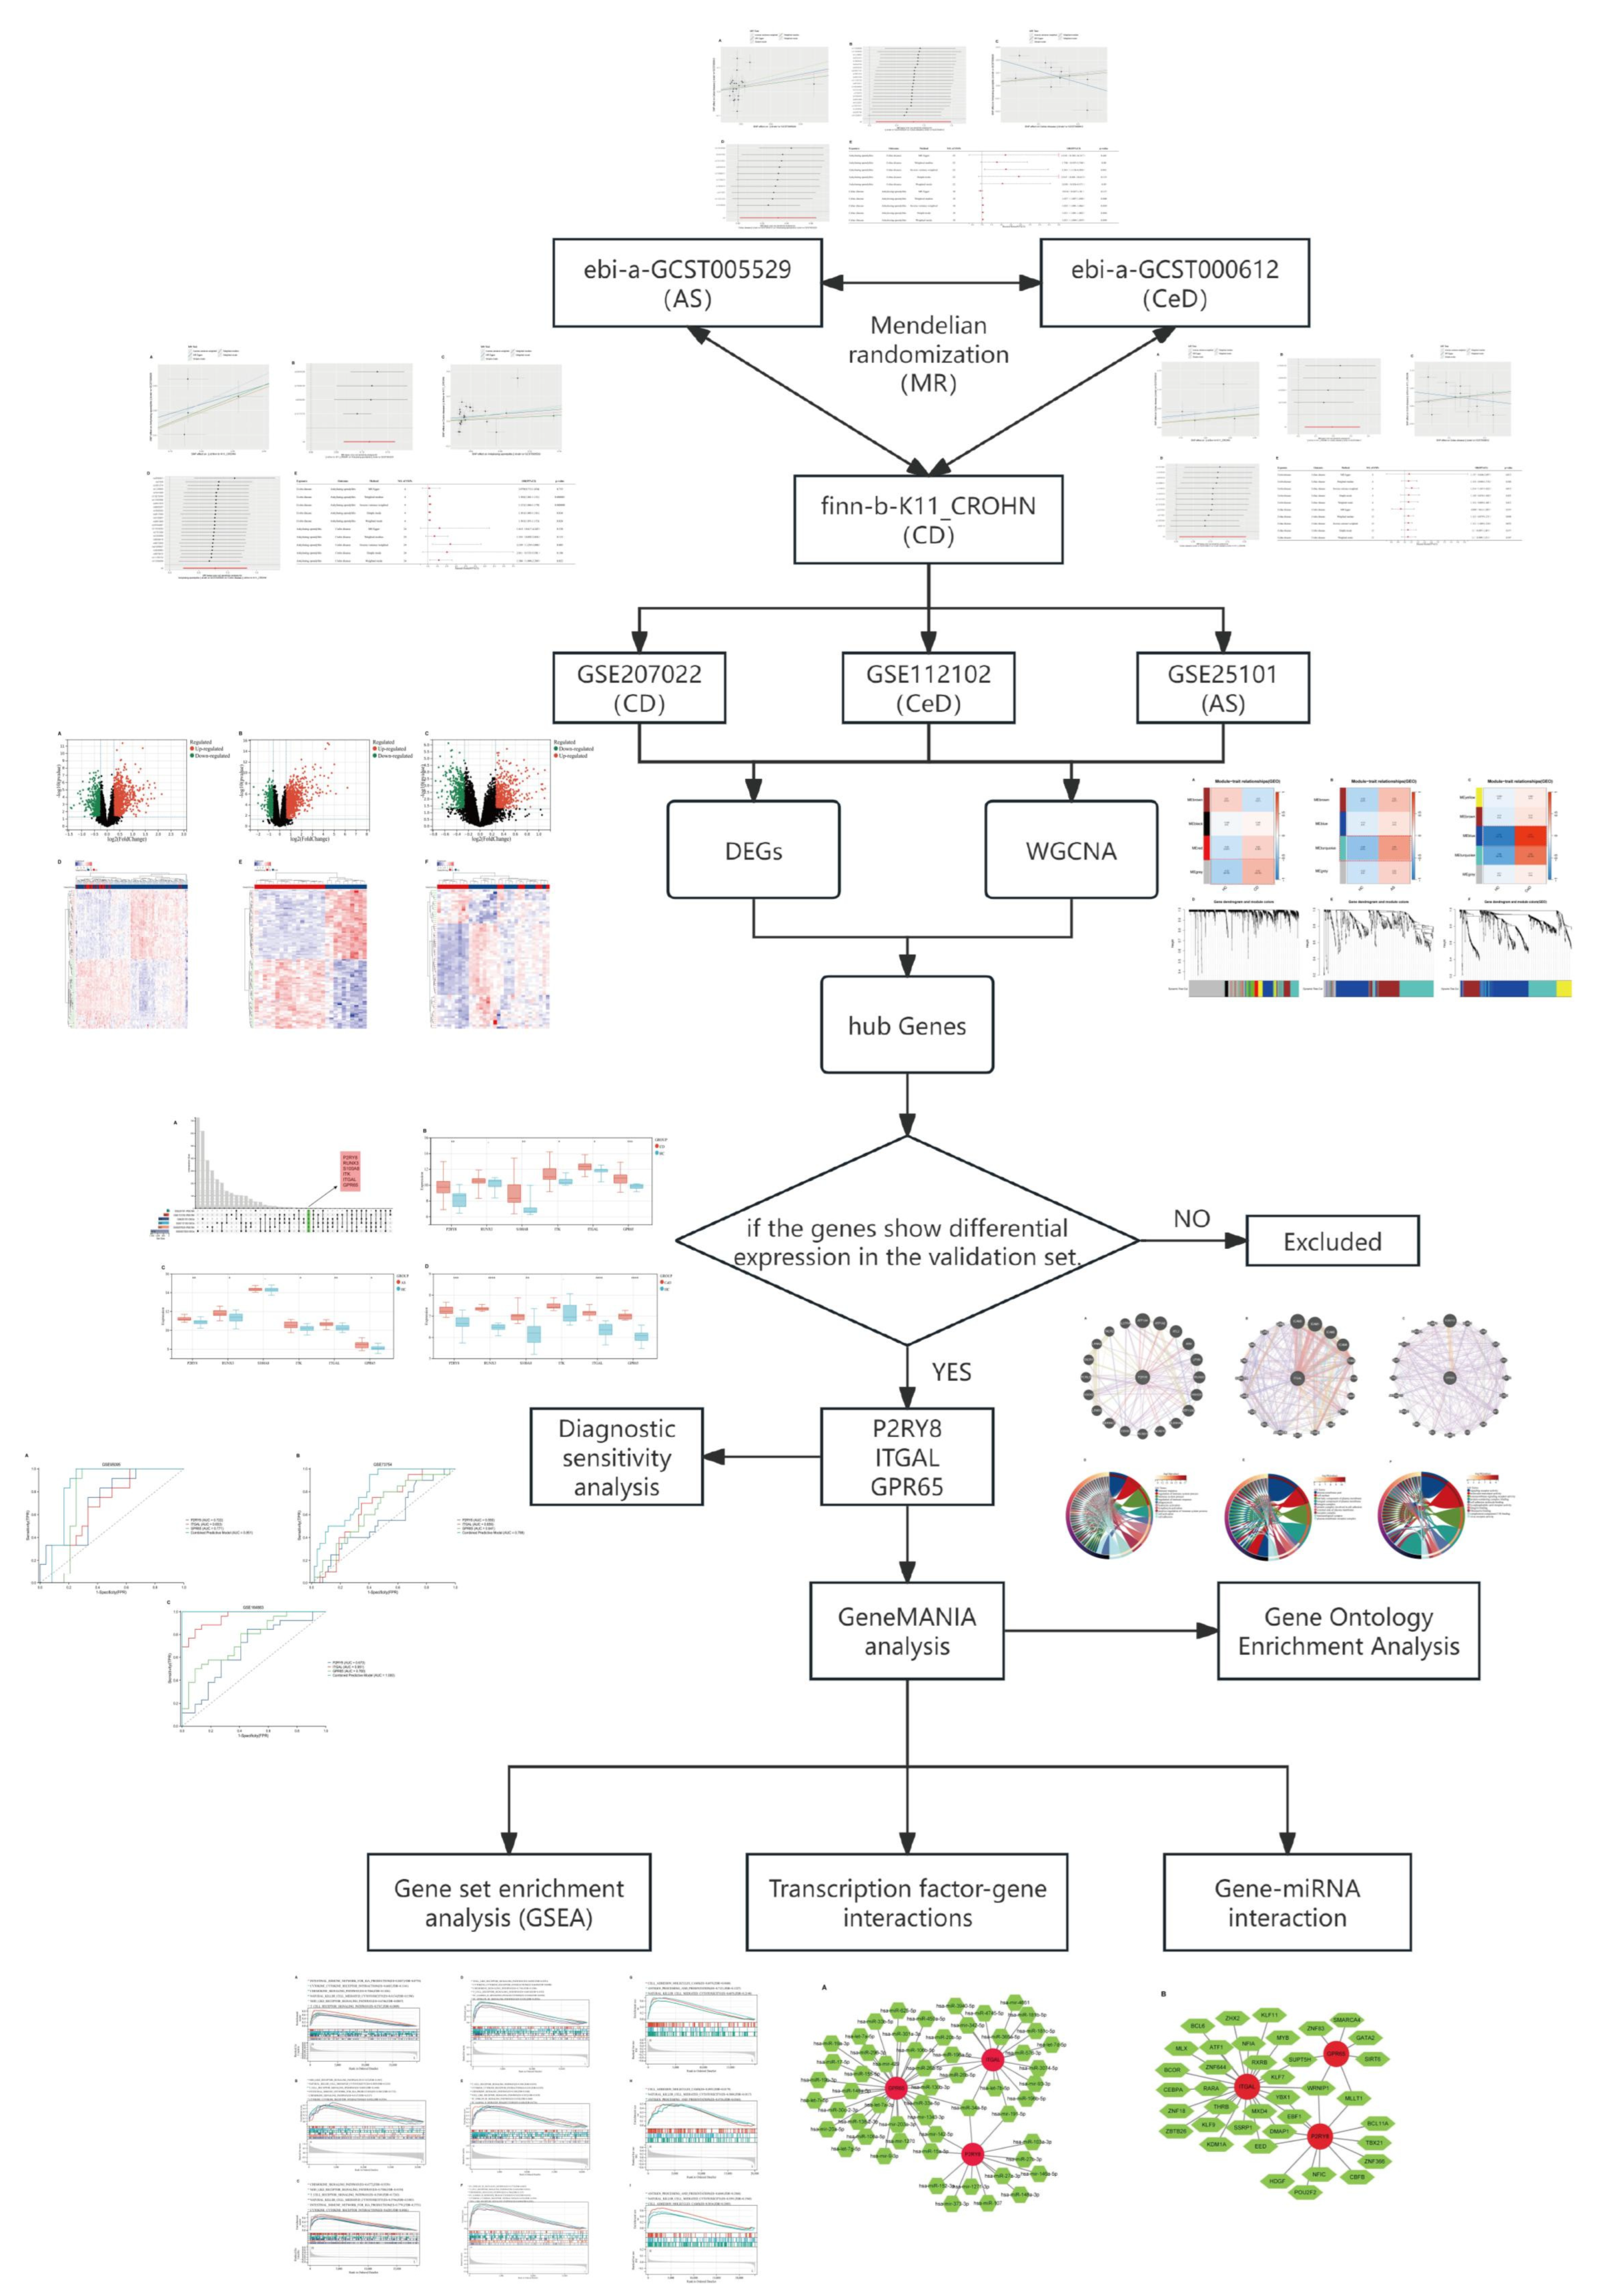
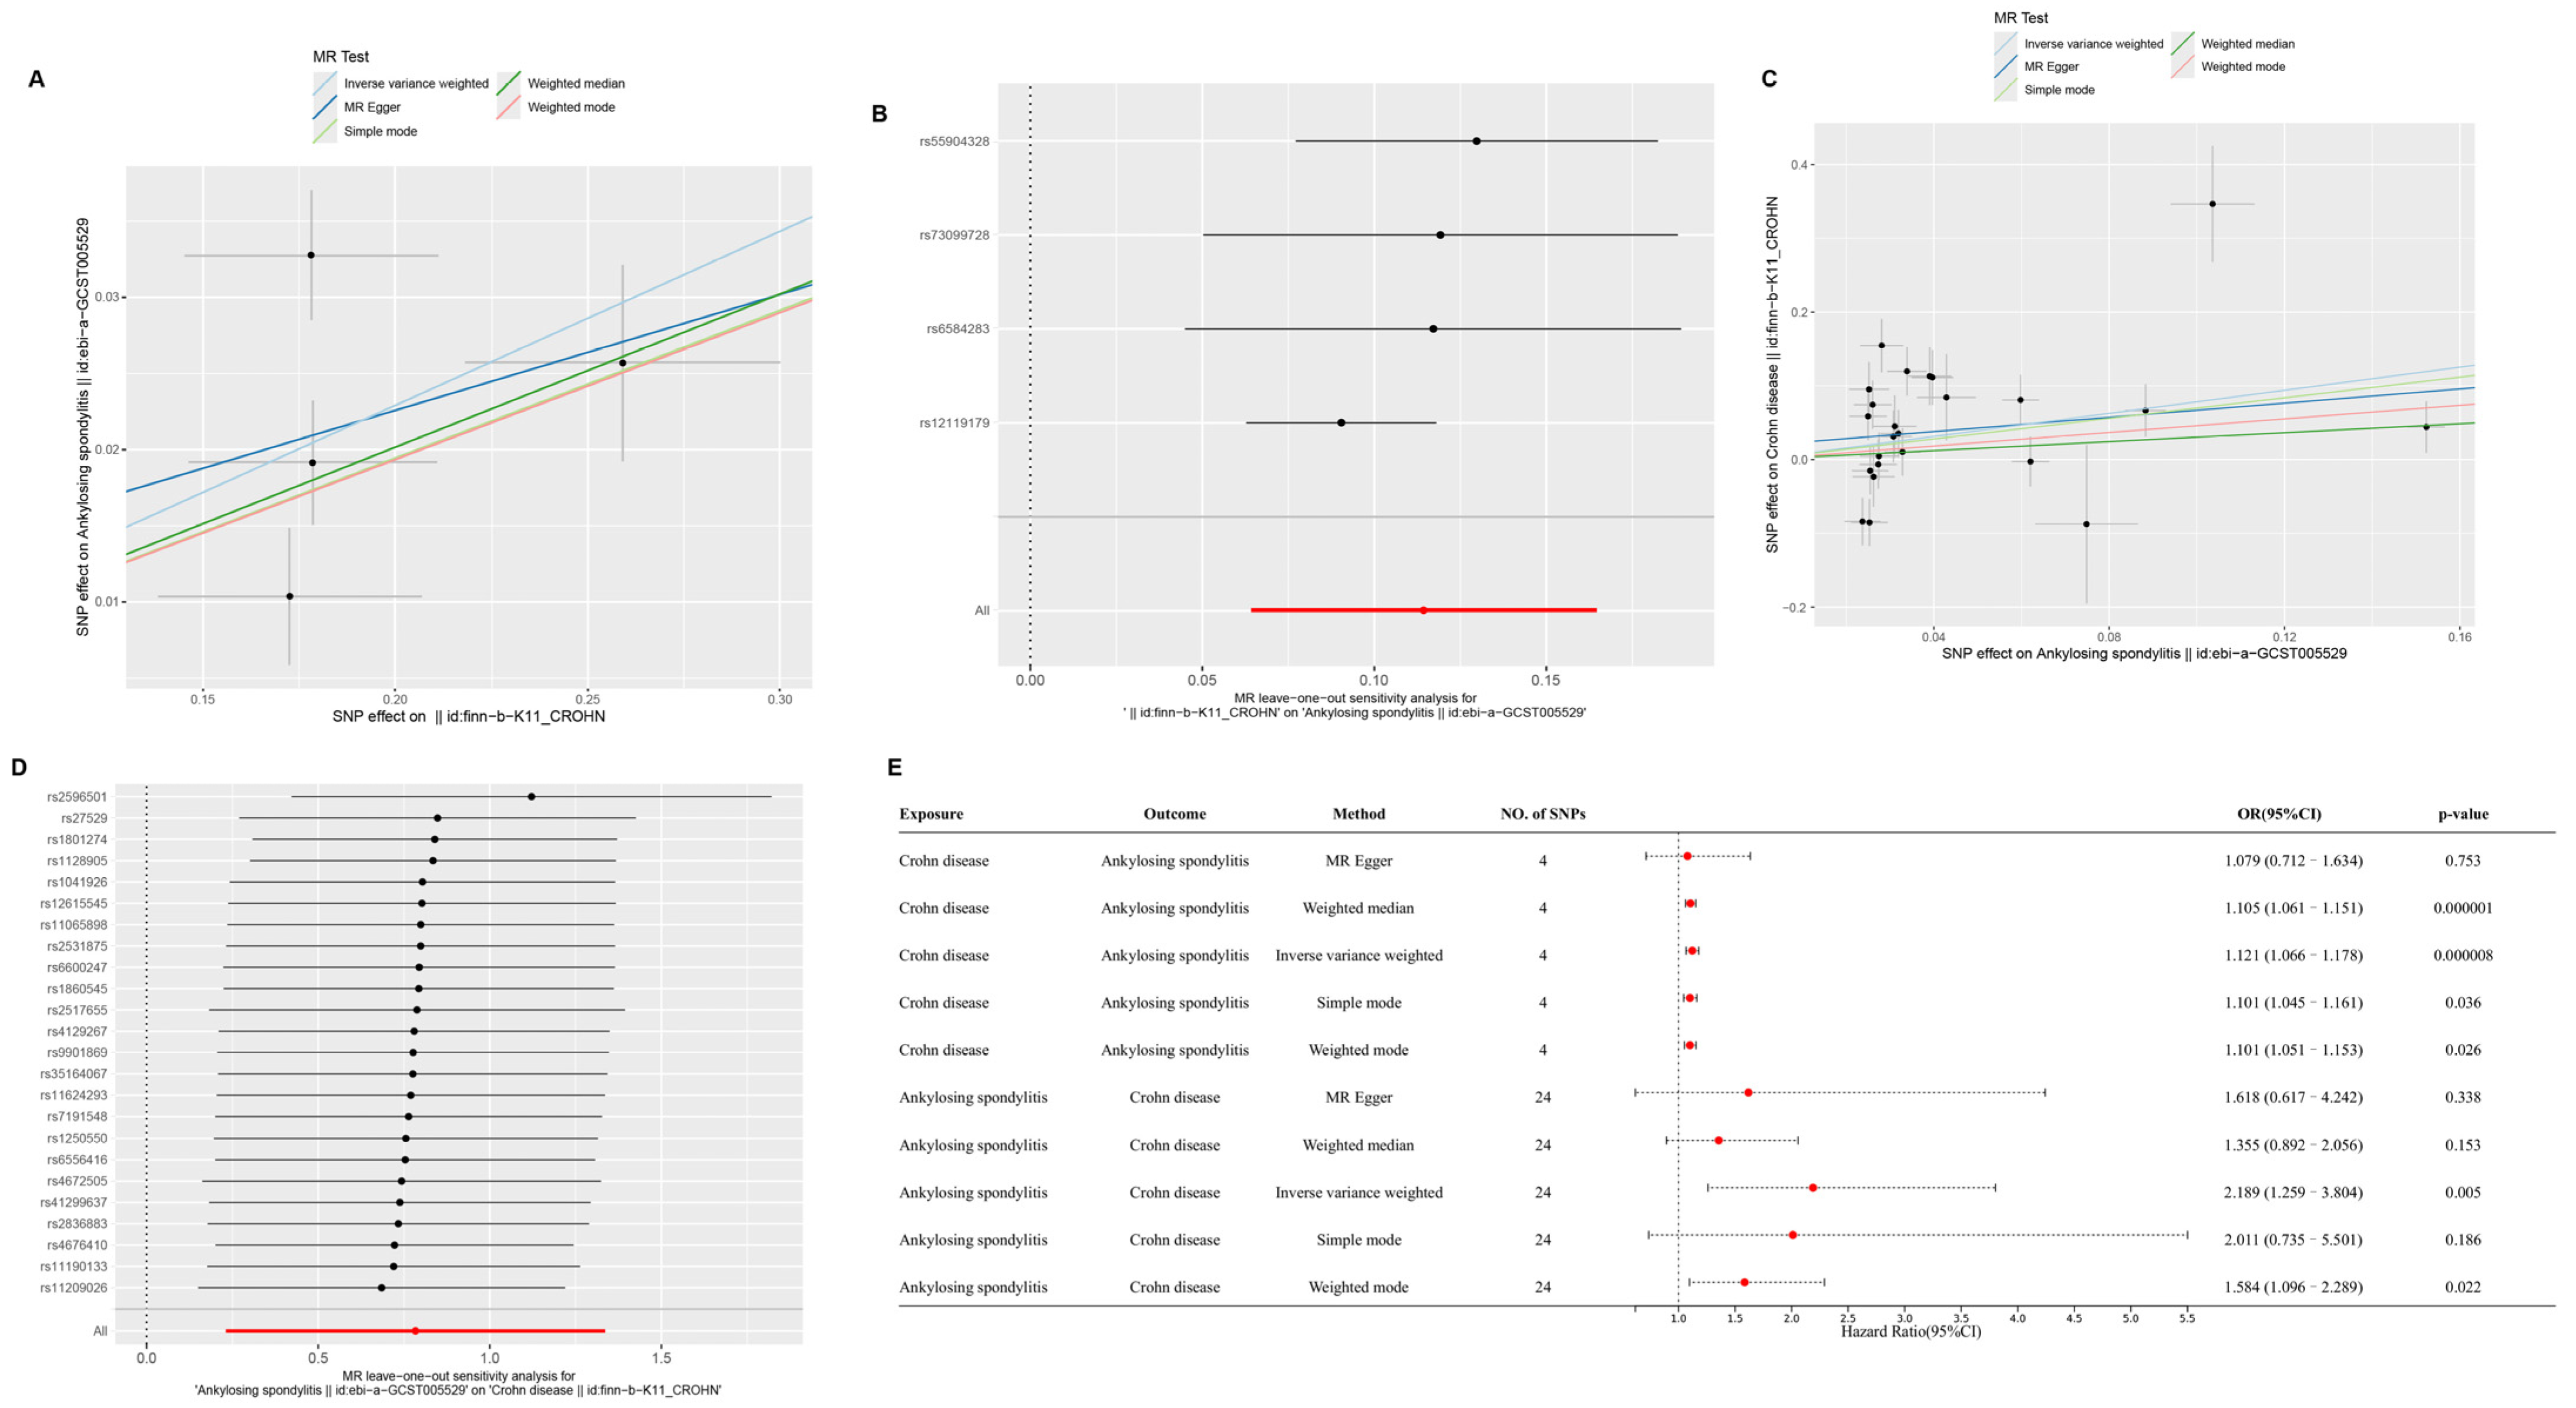
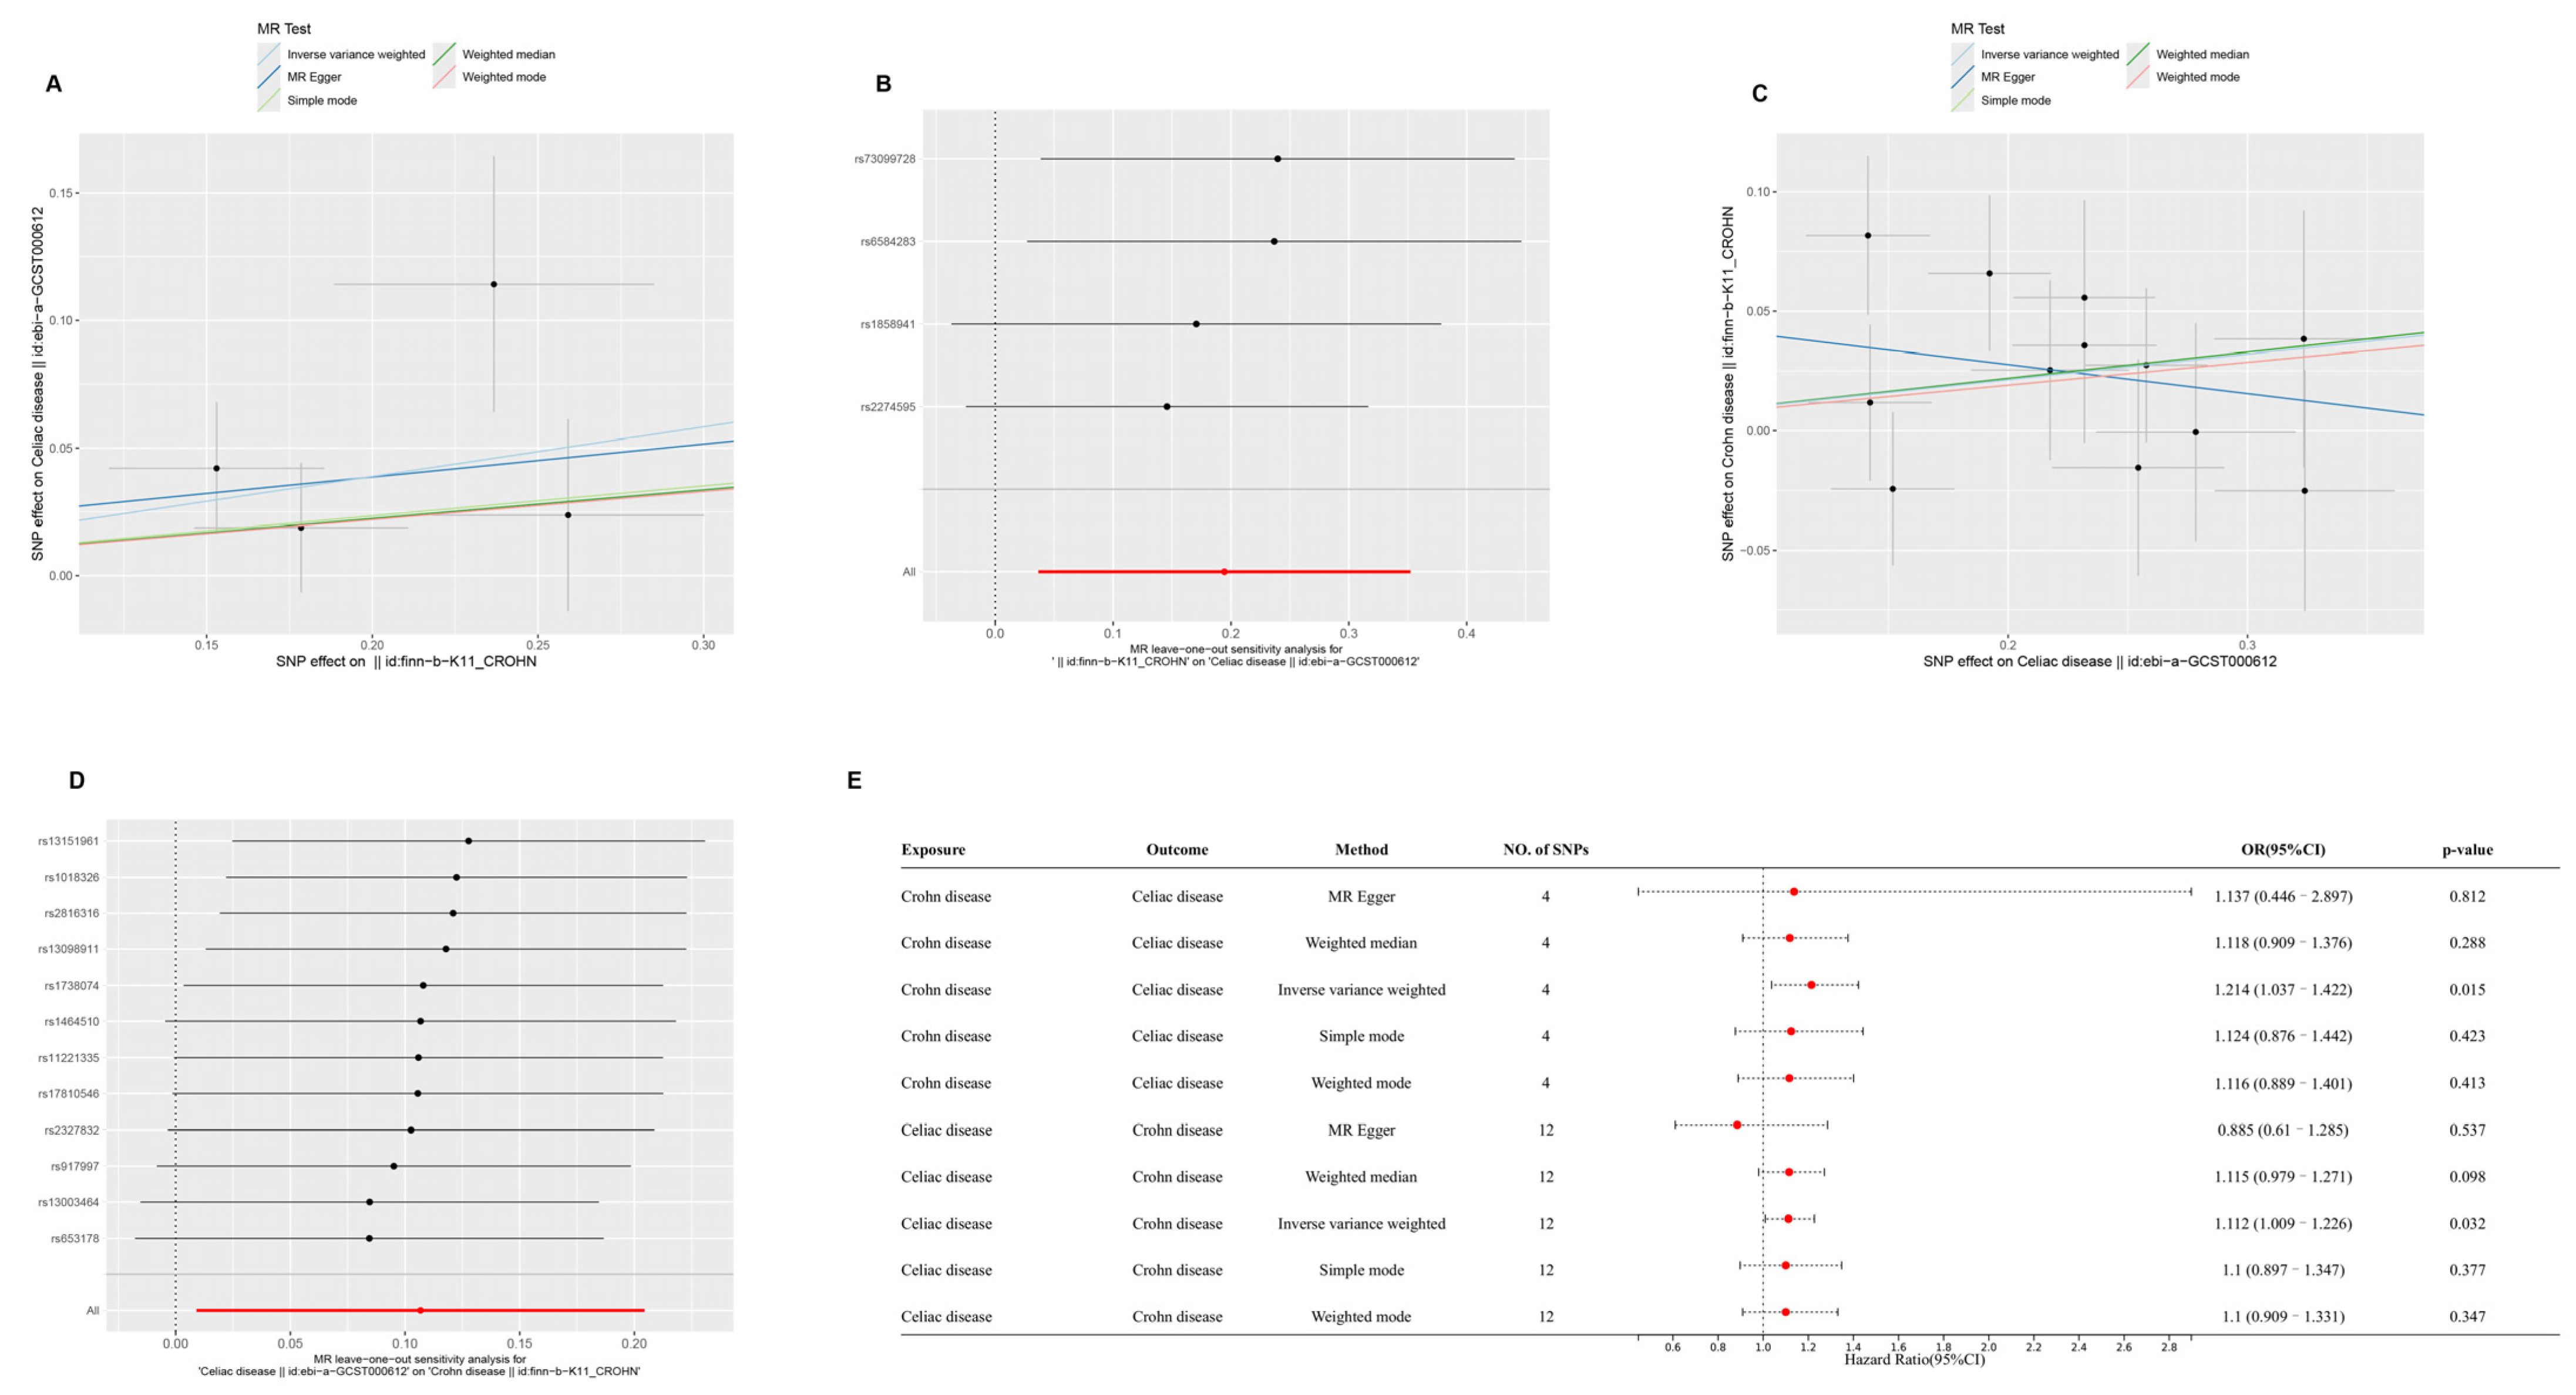
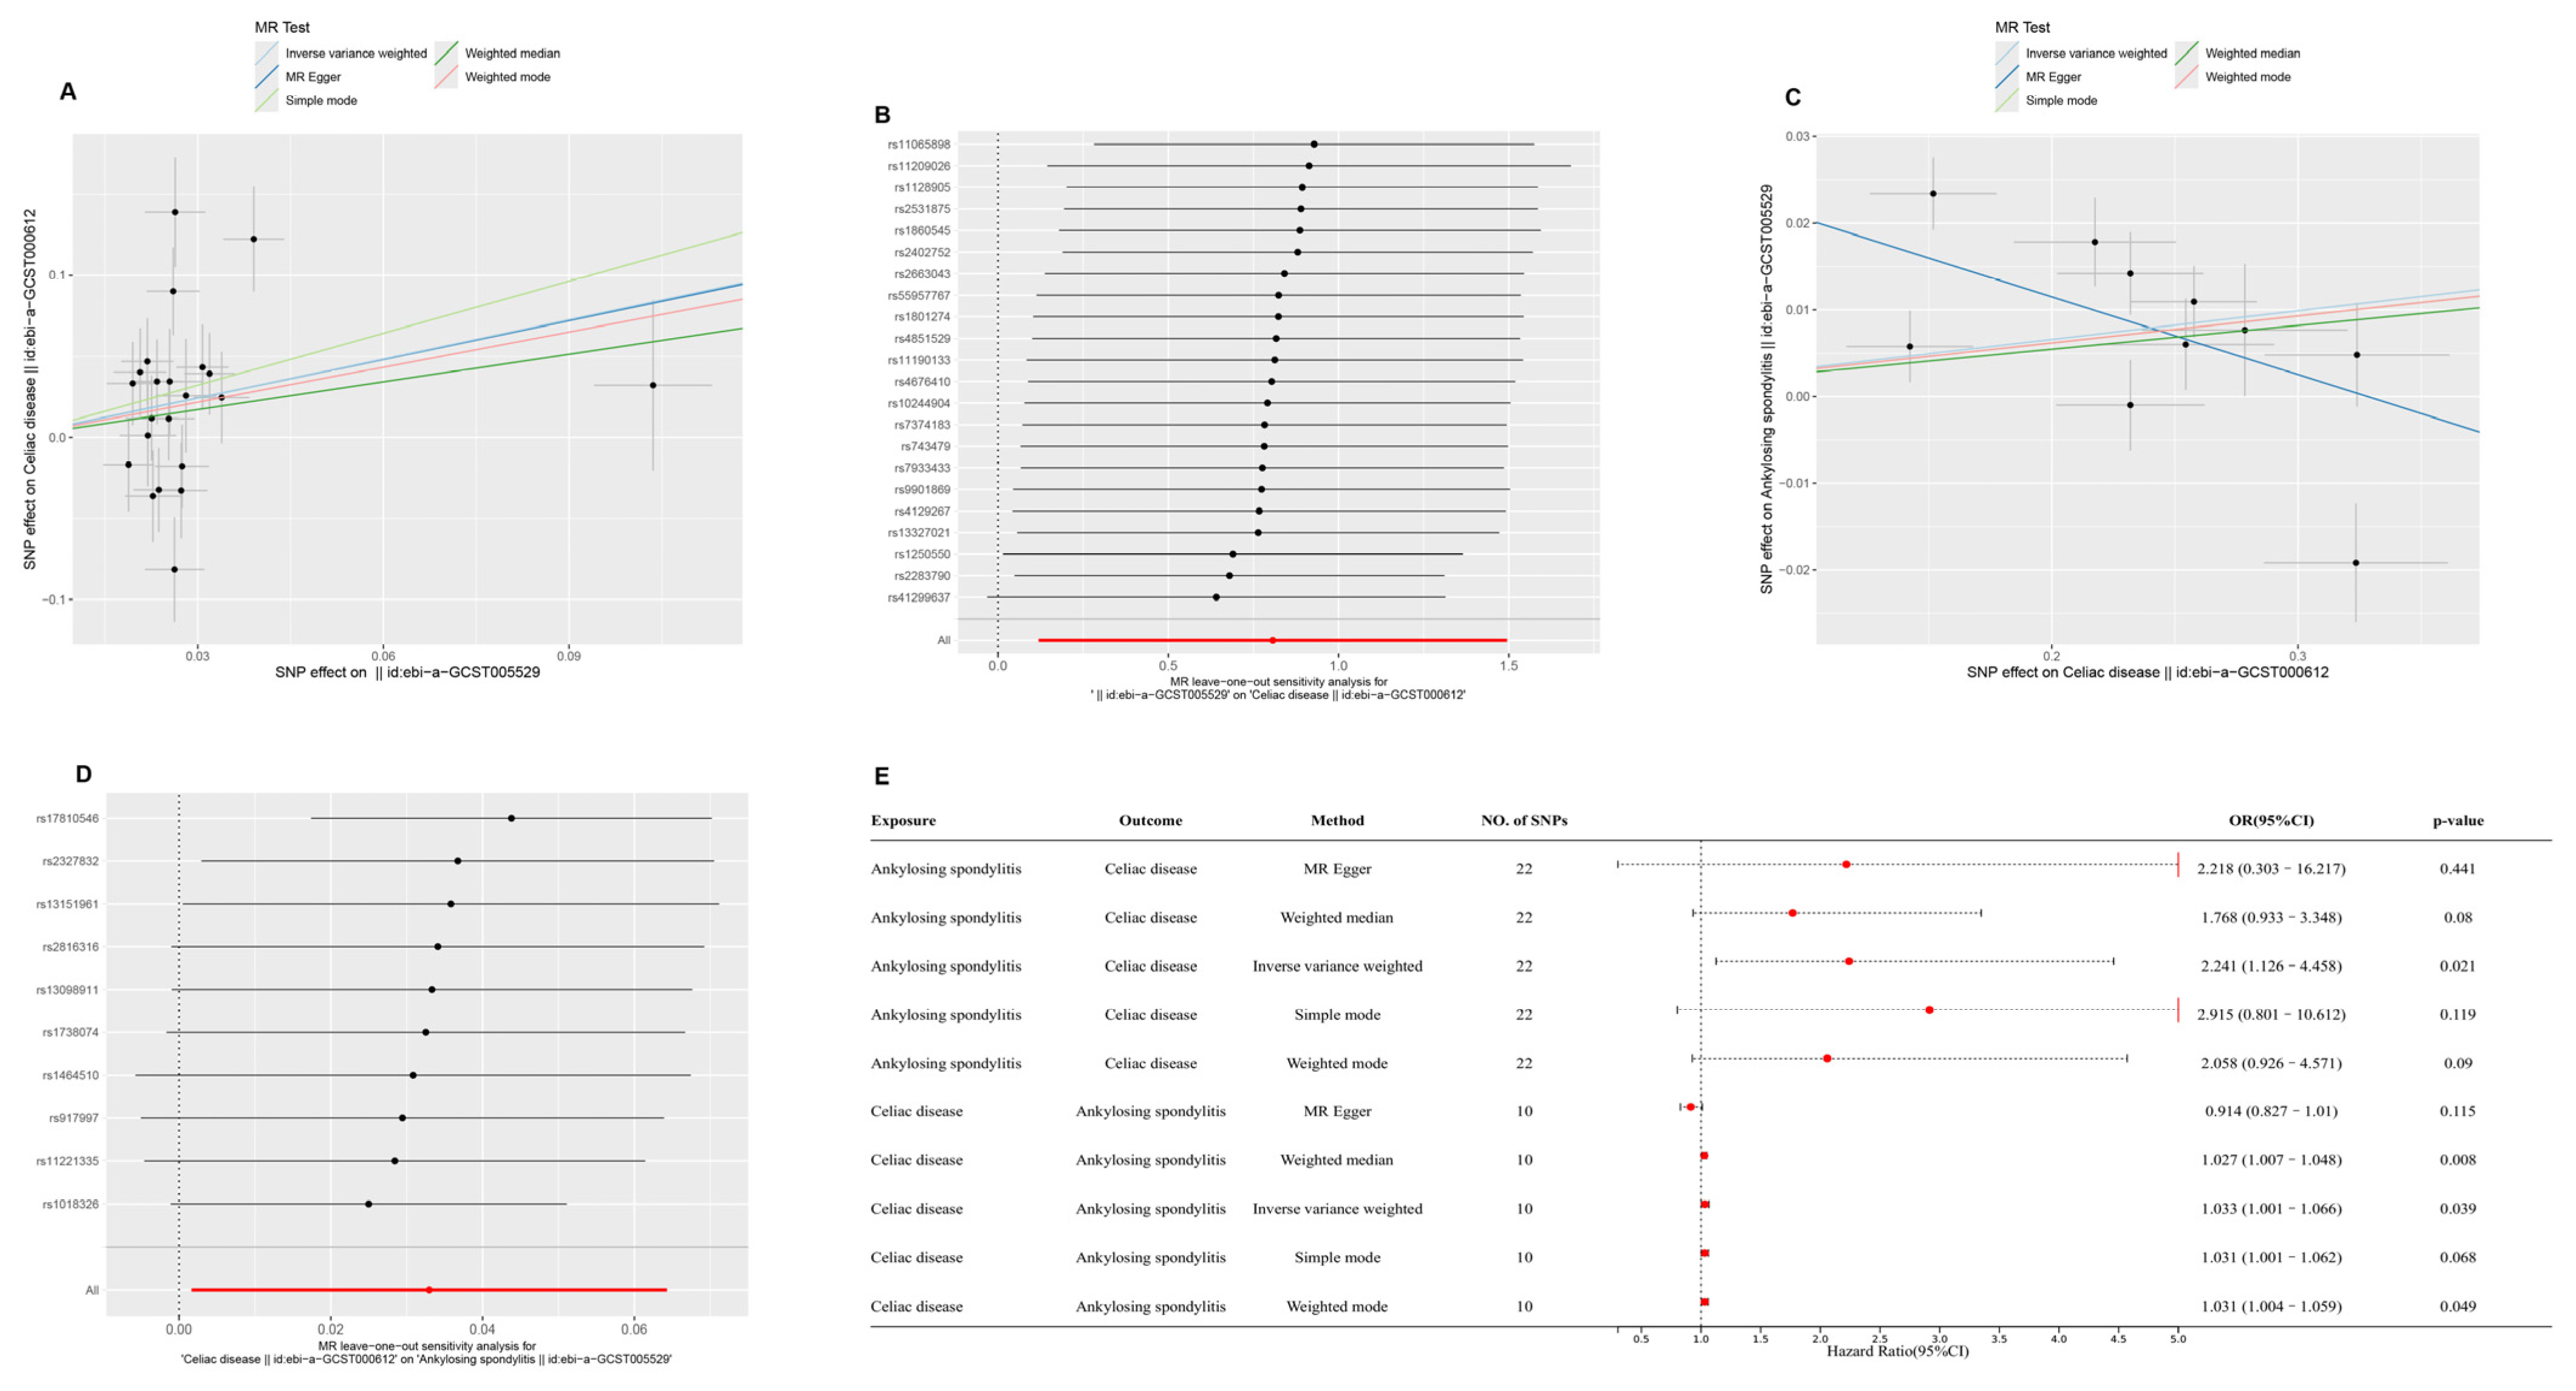
2. Results
2.1. Causal Relationships Among CD, AS, and CeD Based on MR
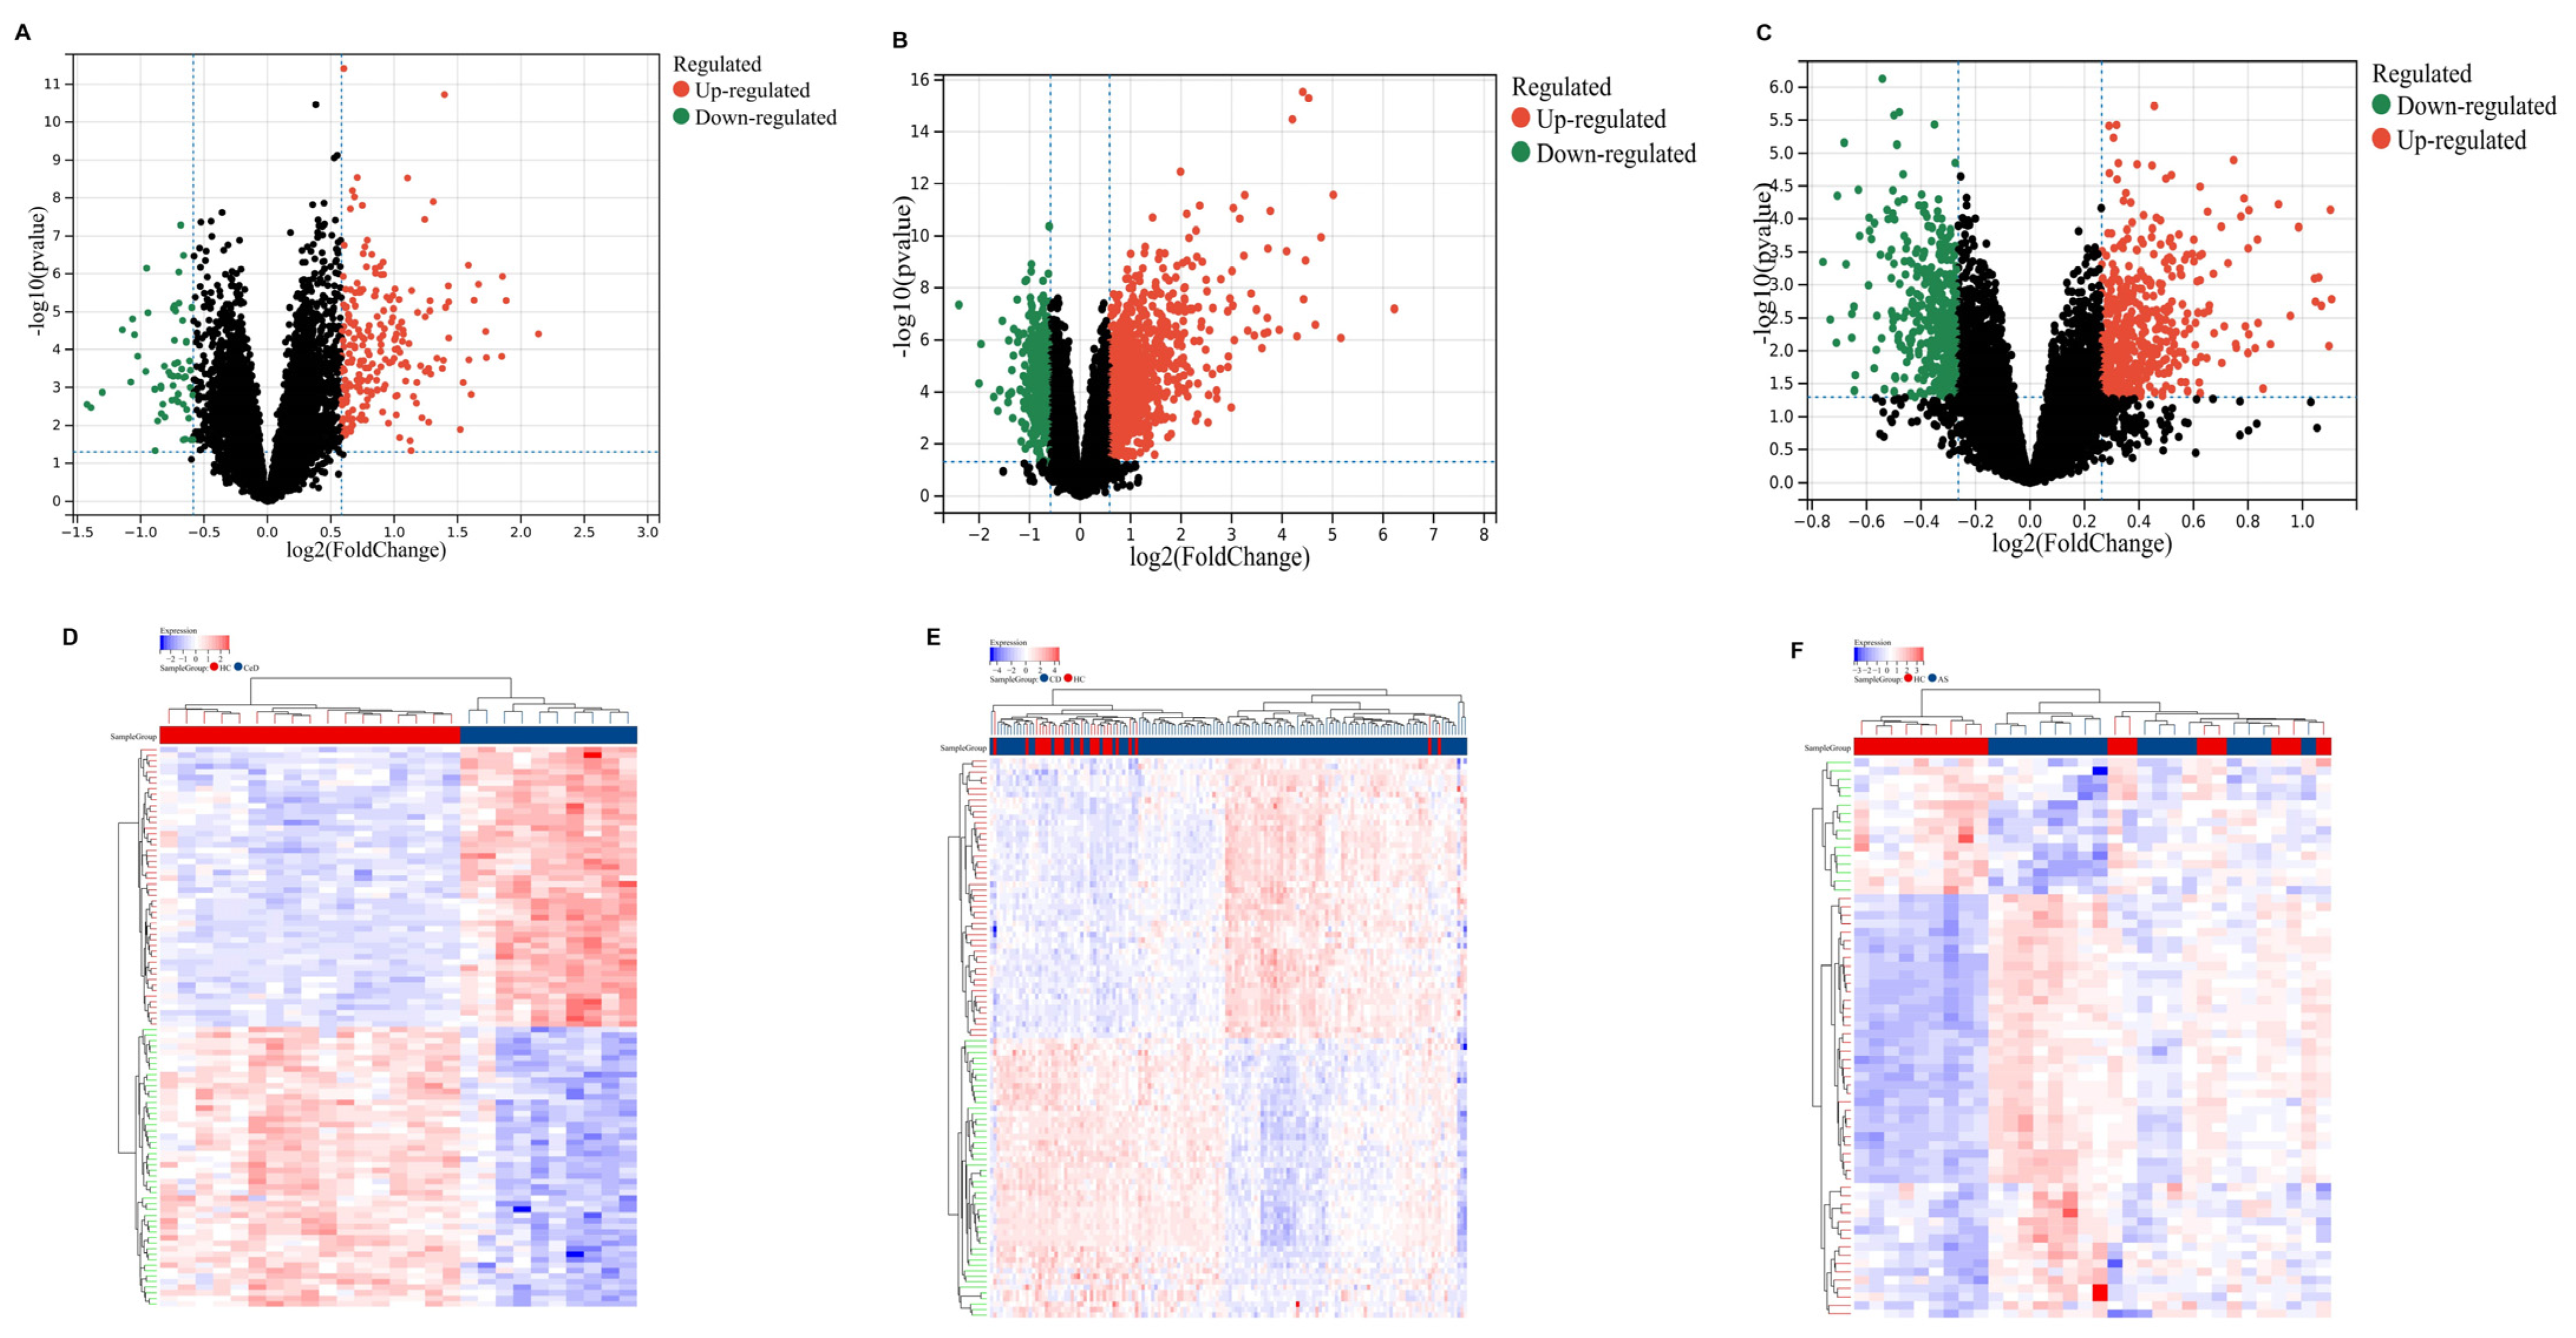
2.2. Identification of DEGs
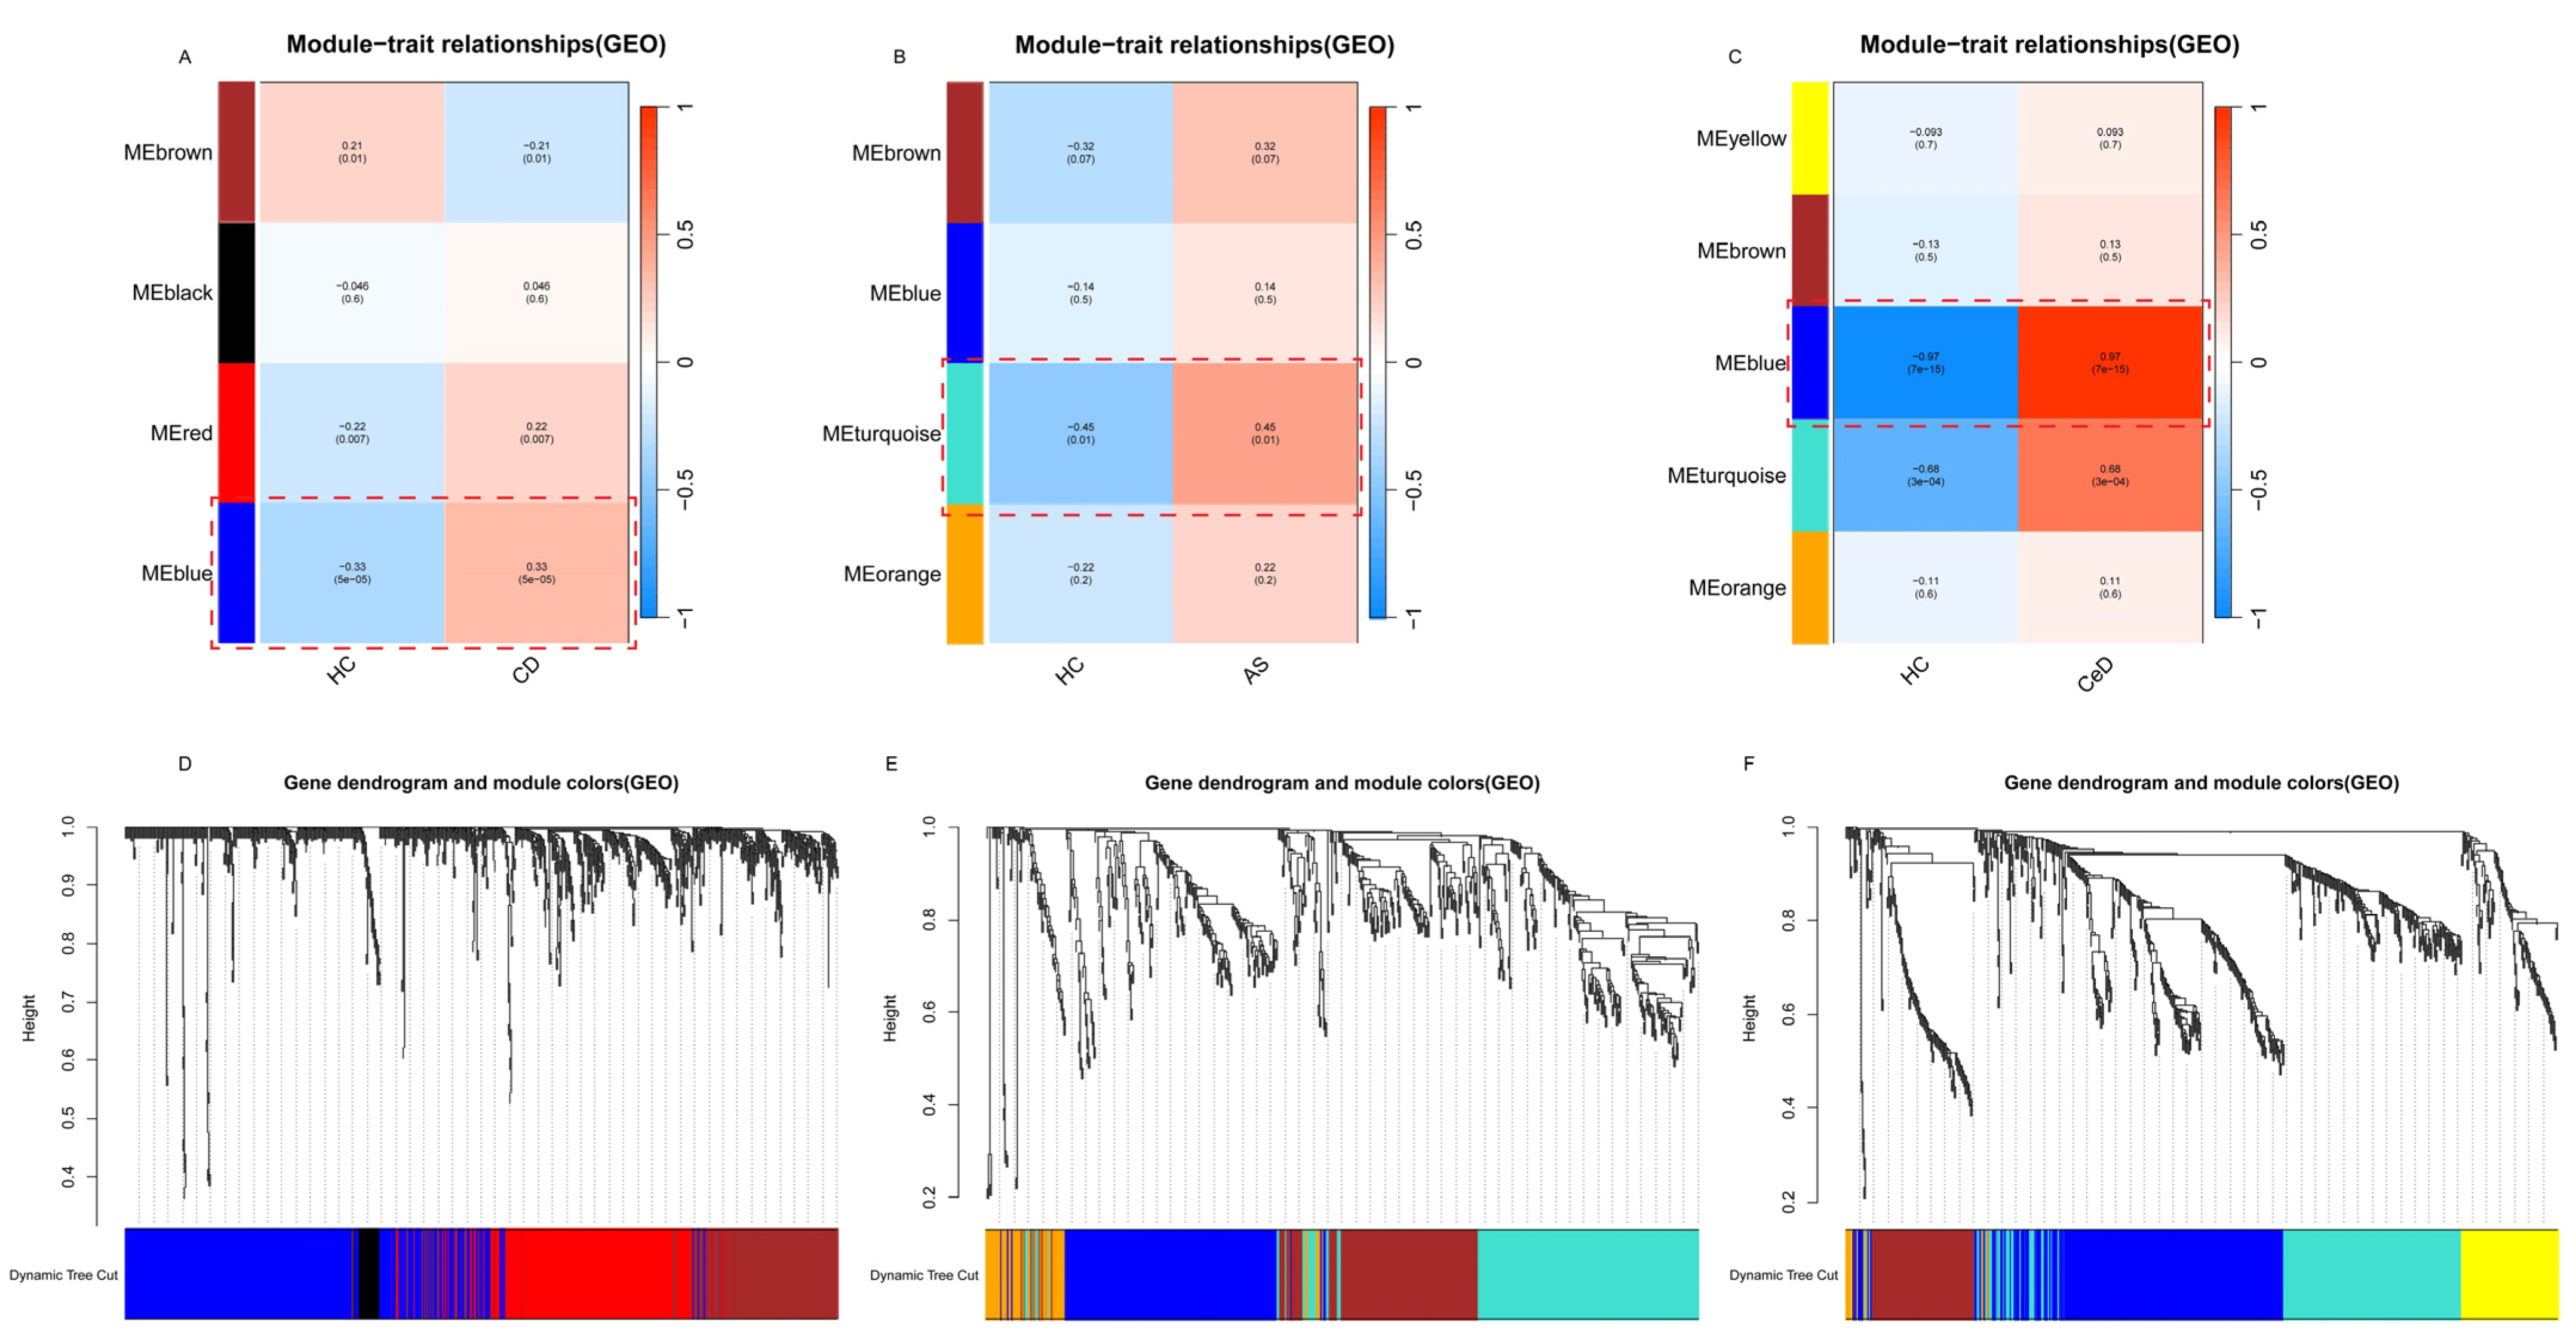
2.3. WGCNA
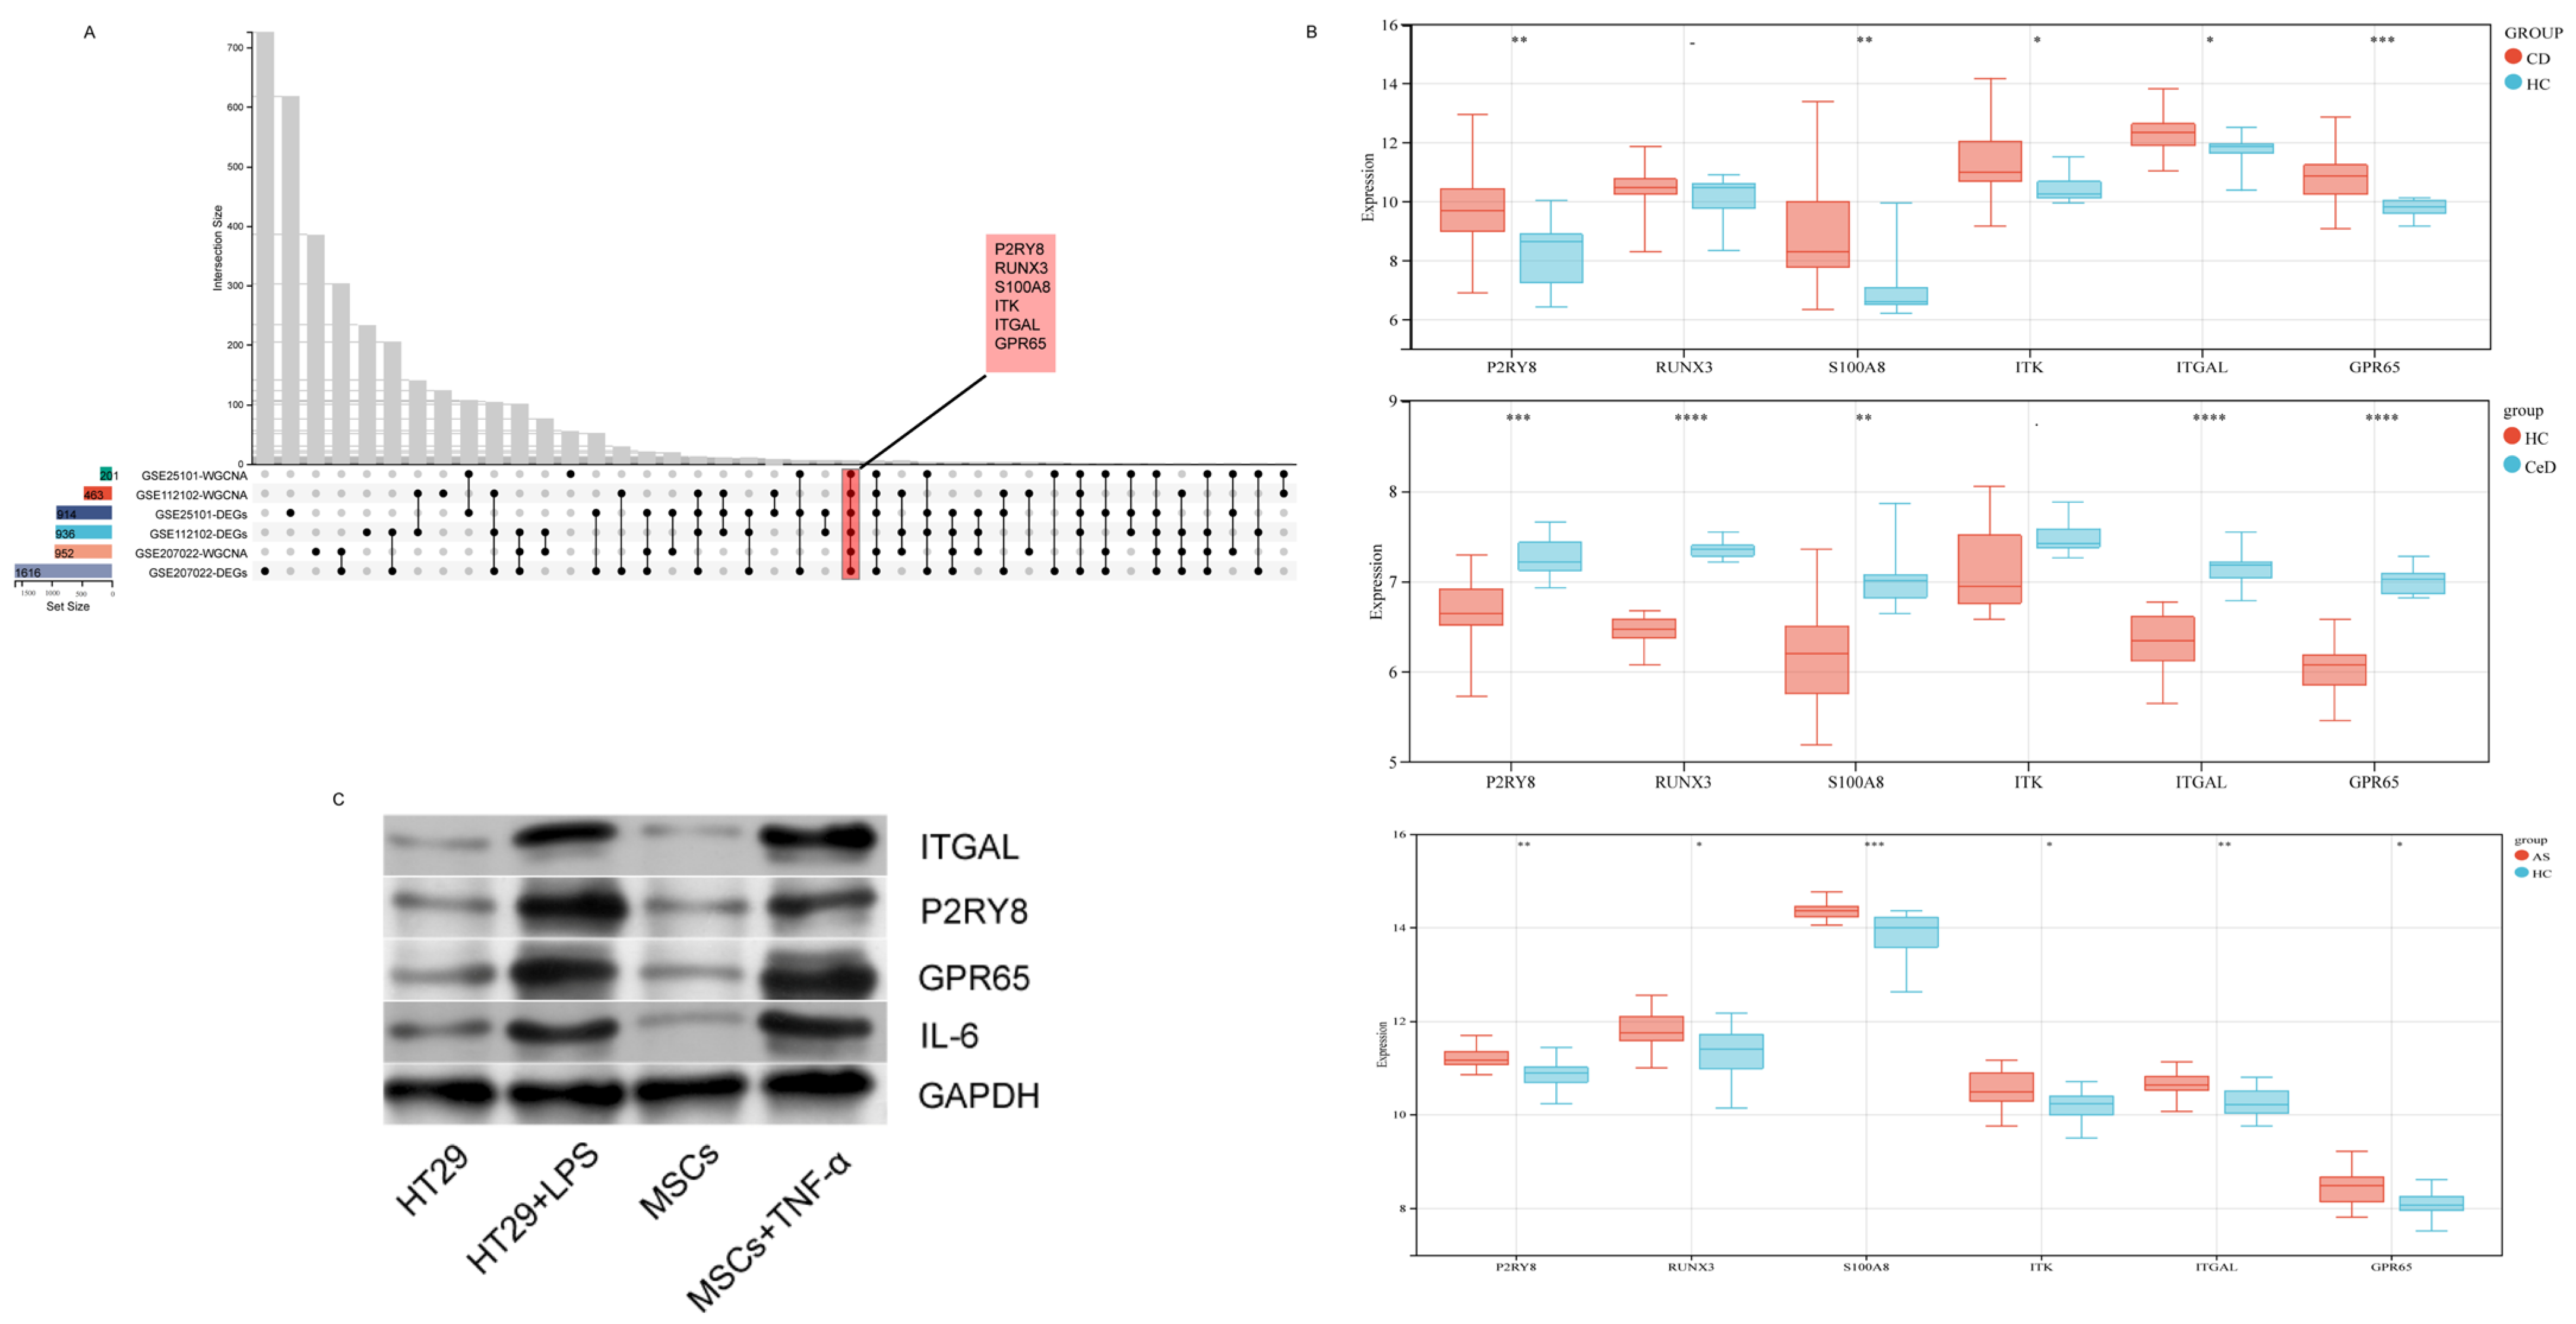
2.4. Selection and Validation of Hub Genes
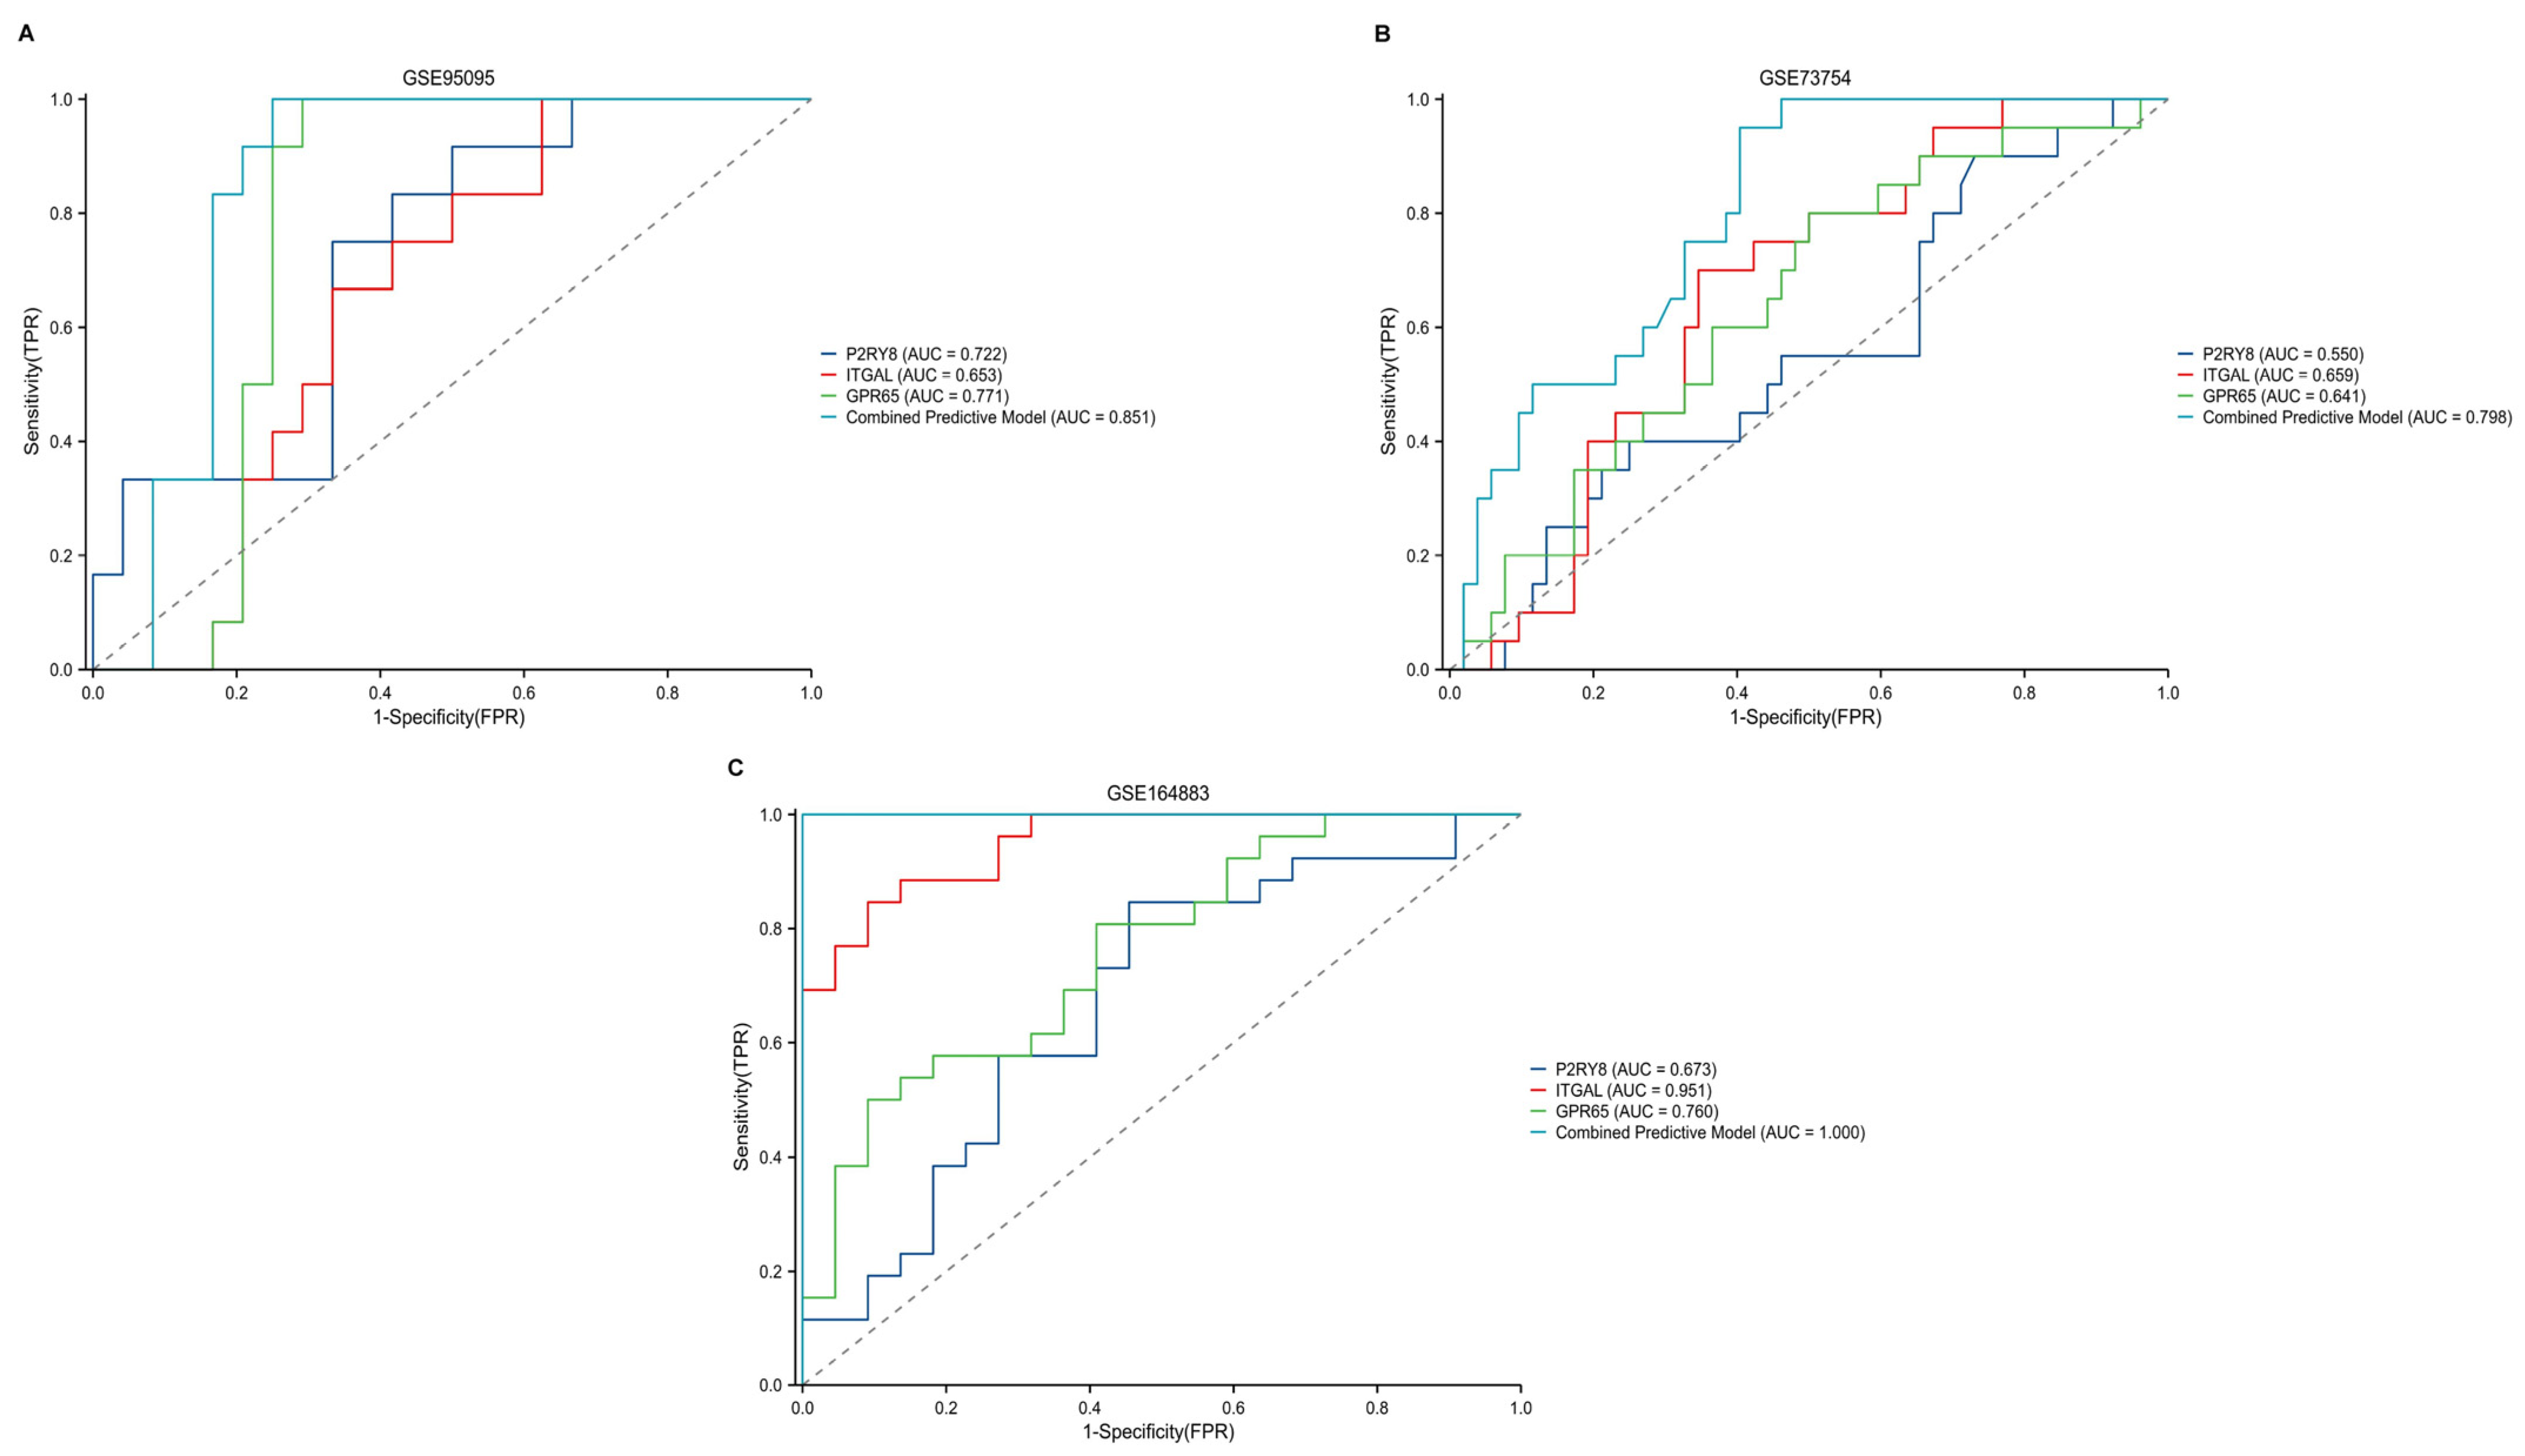
2.5. Diagnostic Performance of Key Genes in CD, CeD, and AS
2.6. Analysis of Hub Genes
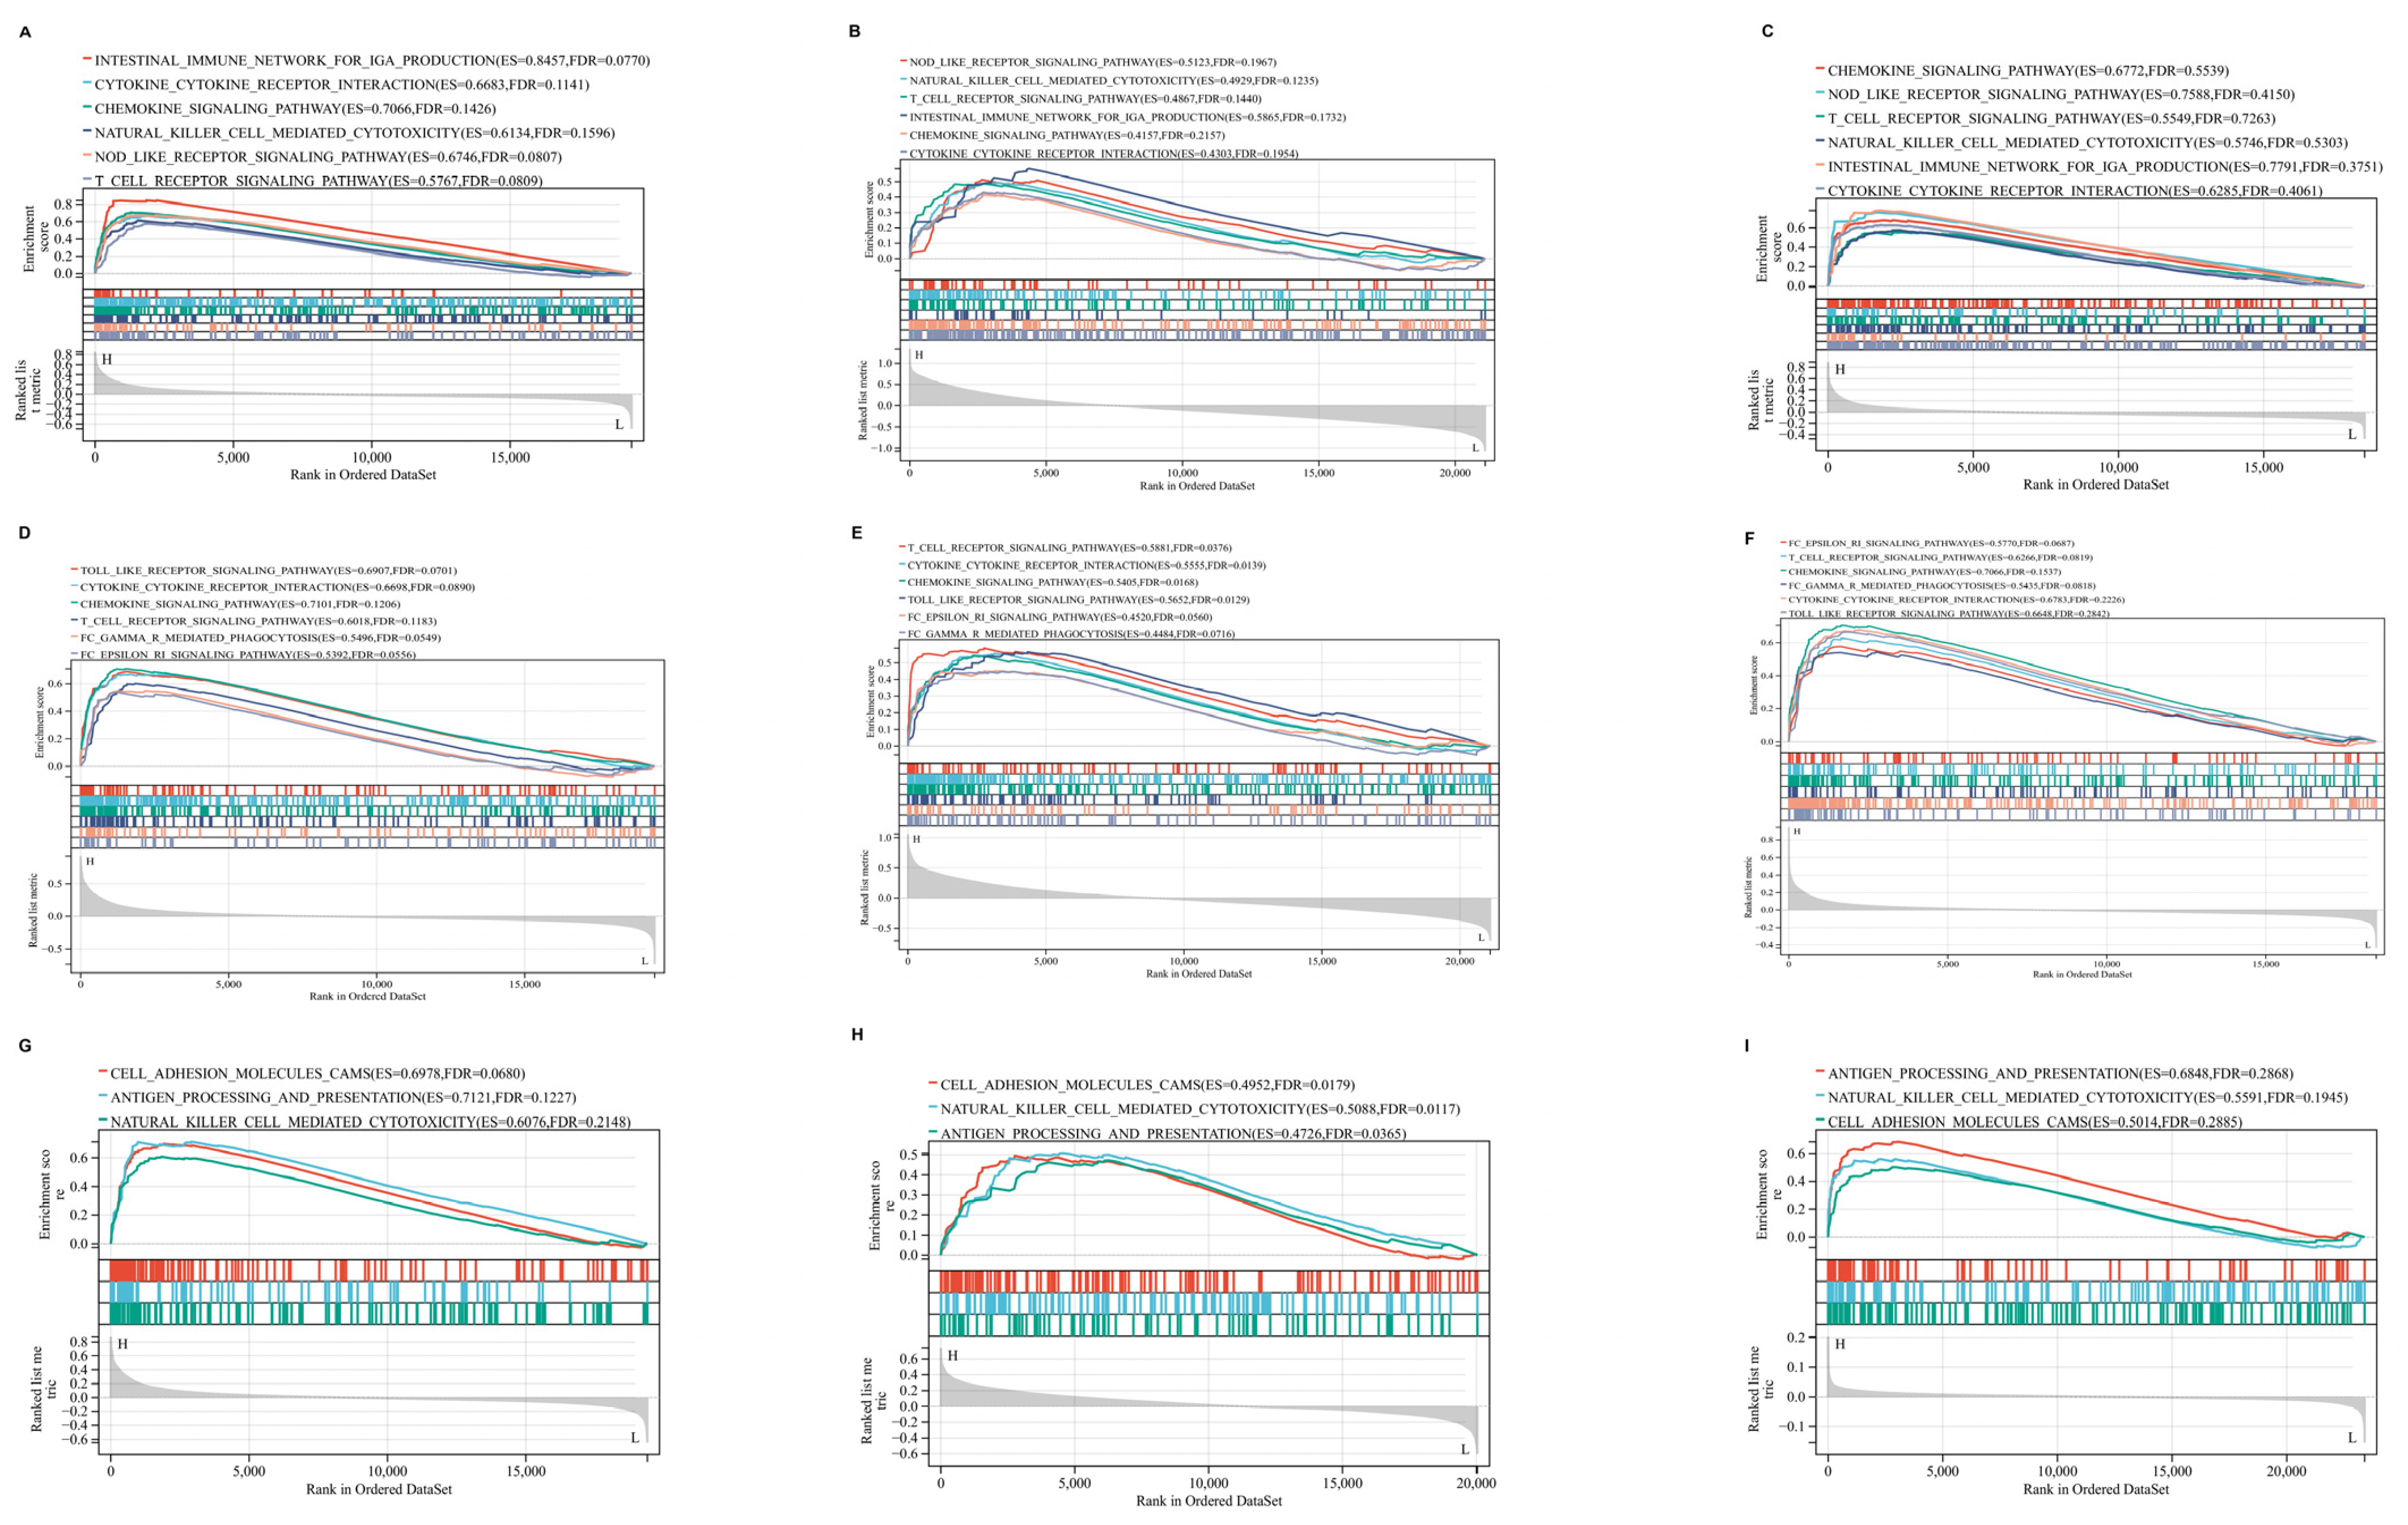
2.7. GSEA Results of Hub Genes
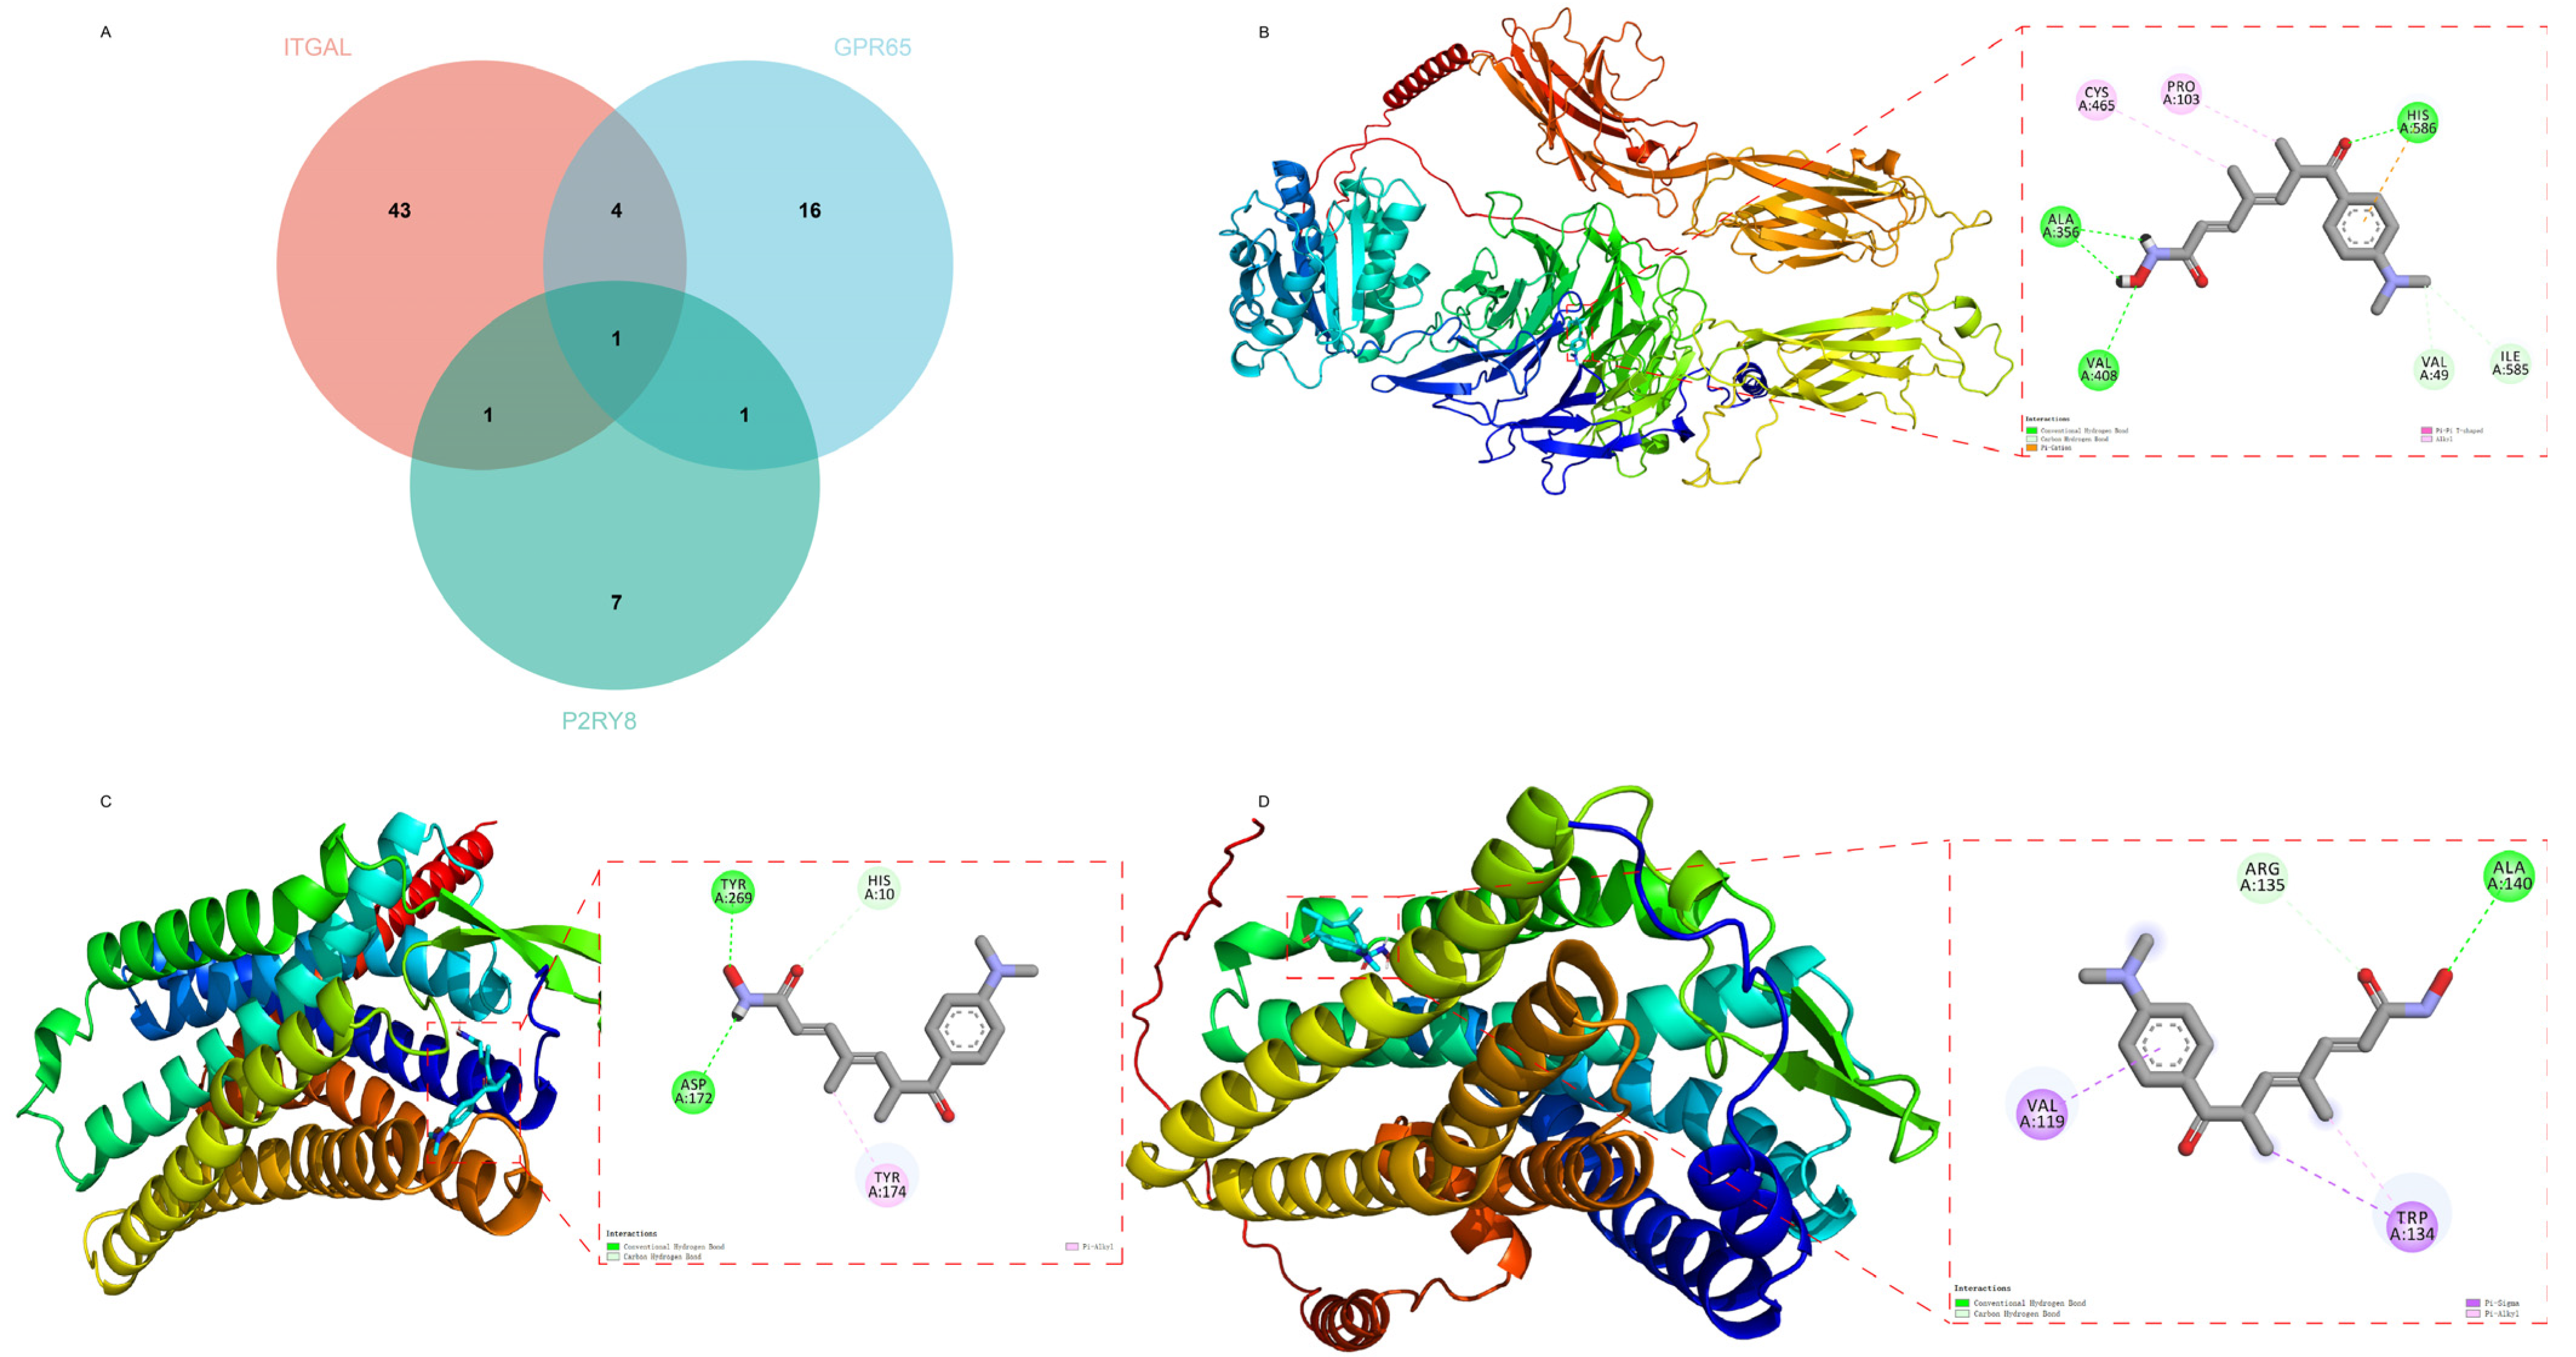
2.8. Drug Prediction and Molecular Docking
3. Discussion
4. Materials and Methods
4.1. Data Source
4.2. Selection of IVs
4.3. MR Analyses
4.4. Sensitivity Analyses
4.5. Differentially Expressed Genes
4.6. Construction of Co-Expression Networks Using WGCNA
4.7. Confirmation of Hub Gene Expression
4.8. Cell Culture
4.9. Western Blot
4.10. GeneMANIA Analysis
4.11. Protein Structure Prediction Using AlphaFold
4.12. Receiver Operating Characteristic Curves
4.13. Gene Set Enrichment Analysis (GSEA)
4.14. Transcription Factor–Gene Interactions
4.15. Gene–miRNA Interactions
4.16. Molecular Docking
5. Conclusions
Supplementary Materials
Author Contributions
Funding
Institutional Review Board Statement
Informed Consent Statement
Data Availability Statement
Conflicts of Interest
Abbreviations
| CeD | Celiac disease |
| CD | Crohn’s disease |
| IBD | Inflammatory bowel disease |
| AS | Ankylosing spondylitis |
| MR | Mendelian randomization |
References
- Dolinger, M.; Torres, J.; Vermeire, S. Crohn’s disease. Lancet 2024, 403, 1177–1191. [Google Scholar] [CrossRef]
- Rieder, F.; Zimmermann, E.M.; Remzi, F.H.; Sandborn, W.J. Crohn’s disease complicated by strictures: A systematic review. Gut 2013, 62, 1072–1084. [Google Scholar] [CrossRef] [PubMed]
- Singh, A.; Midha, V.; Kochhar, G.S.; Shen, B.; Sood, A. Management of Perianal Fistulizing Crohn’s Disease. Inflamm. Bowel Dis. 2023, 30, 1579–1603. [Google Scholar] [CrossRef] [PubMed]
- Wilkins, T.; Jarvis, K.; Patel, J. Diagnosis and management of Crohn’s disease. Am. Fam. Physician 2011, 84, 1365–1375. [Google Scholar] [PubMed]
- Mauro, D.; Thomas, R.; Guggino, G.; Lories, R.; Brown, M.A.; Ciccia, F. Ankylosing spondylitis: An autoimmune or autoinflammatory disease? Nat. Rev. Rheumatol. 2021, 17, 387–404. [Google Scholar] [CrossRef]
- Bowness, P. HLA-B27. Annu. Rev. Immunol. 2015, 33, 29–48. [Google Scholar] [CrossRef]
- Yu, T.; Zhang, J.; Zhu, W.; Wang, X.; Bai, Y.; Feng, B.; Zhuang, Q.; Han, C.; Wang, S.; Hu, Q.; et al. Chondrogenesis mediates progression of ankylosing spondylitis through heterotopic ossification. Bone Res. 2021, 9, 19. [Google Scholar] [CrossRef]
- Zhao, J.; Huang, C.; Huang, H.; Pan, J.-K.; Zeng, L.-F.; Luo, M.-H.; Liang, G.-H.; Yang, W.-Y.; Liu, J. Prevalence of ankylosing spondylitis in a Chinese population: A systematic review and meta-analysis. Rheumatol. Int. 2020, 40, 859–872. [Google Scholar] [CrossRef]
- Lebwohl, B.; Sanders, D.S.; Green, P.H.R. Coeliac disease. Lancet 2018, 391, 70–81. [Google Scholar] [CrossRef]
- Lebwohl, B.; Rubio-Tapia, A. Epidemiology, Presentation, and Diagnosis of Celiac Disease. Gastroenterology 2021, 160, 63–75. [Google Scholar] [CrossRef]
- Pinto-Sanchez, M.I.; Silvester, J.A.; Lebwohl, B.; Leffler, D.A.; Anderson, R.P.; Therrien, A.; Kelly, C.P.; Verdu, E.F. Society for the Study of Celiac Disease position statement on gaps and opportunities in coeliac disease. Nat. Rev. Gastroenterol. Hepatol. 2021, 18, 875–884. [Google Scholar] [CrossRef] [PubMed]
- Xie, Z.; Yu, W.; Zheng, G.; Li, J.; Cen, S.; Ye, G.; Li, Z.; Liu, W.; Li, M.; Lin, J.; et al. TNF-α-mediated m6A modification of ELMO1 triggers directional migration of mesenchymal stem cell in ankylosing spondylitis. Nat. Commun. 2021, 12, 5373. [Google Scholar] [CrossRef]
- Baeten, D.; Sieper, J.; Braun, J.; Baraliakos, X.; Dougados, M.; Emery, P.; Deodhar, A.; Porter, B.; Martin, R.; Andersson, M.; et al. Secukinumab, an Interleukin-17A Inhibitor, in Ankylosing Spondylitis. N. Engl. J. Med. 2015, 373, 2534–2548. [Google Scholar] [CrossRef] [PubMed]
- Rashid, T.; Wilson, C.; Ebringer, A. The Link between Ankylosing Spondylitis, Crohn’s Disease, Klebsiella, and Starch Consumption. J. Immunol. Res. 2013, 2013, 872632. [Google Scholar] [CrossRef] [PubMed]
- Kivelä, L.; Caminero, A.; Leffler, D.A.; Pinto-Sanchez, M.I.; Tye-Din, J.A.; Lindfors, K. Current and emerging therapies for coeliac disease. Nat. Rev. Gastroenterol. Hepatol. 2020, 18, 181–195. [Google Scholar] [CrossRef]
- de Lusignan, S.; Alexander, H.; Broderick, C.; Dennis, J.; McGovern, A.; Feeney, C.; Flohr, C. Atopic dermatitis and risk of autoimmune conditions: Population-based cohort study. J. Allergy Clin. Immunol. 2022, 150, 709–713. [Google Scholar] [CrossRef]
- Fragoulis, G.E.; Liava, C.; Daoussis, D.; Akriviadis, E.; Garyfallos, A.; Dimitroulas, T. Inflammatory bowel diseases and spondyloarthropathies: From pathogenesis to treatment. World J. Gastroenterol. 2019, 25, 2162–2176. [Google Scholar] [CrossRef]
- Kinashi, Y.; Hase, K. Partners in Leaky Gut Syndrome: Intestinal Dysbiosis and Autoimmunity. Front. Immunol. 2021, 12, 673708. [Google Scholar] [CrossRef]
- Levy, M.; Kolodziejczyk, A.A.; Thaiss, C.A.; Elinav, E. Dysbiosis and the immune system. Nat. Rev. Immunol. 2017, 17, 219–232. [Google Scholar] [CrossRef]
- Schnell, A.; Huang, L.; Singer, M.; Singaraju, A.; Barilla, R.M.; Regan, B.M.; Bollhagen, A.; Thakore, P.I.; Dionne, D.; Delorey, T.M.; et al. Stem-like intestinal Th17 cells give rise to pathogenic effector T cells during autoimmunity. Cell 2021, 184, 6281–6298.e23. [Google Scholar] [CrossRef]
- Jacobse, J.; Brown, R.E.; Li, J.; Pilat, J.M.; Pham, L.; Short, S.P.; Peek, C.T.; Rolong, A.; Washington, M.K.; Martinez-Barricarte, R.; et al. Interleukin-23 receptor signaling impairs the stability and function of colonic regulatory T cells. Cell Rep. 2023, 42, 112128. [Google Scholar] [CrossRef] [PubMed]
- Babaie, F.; Hosseinzadeh, R.; Ebrazeh, M.; Seyfizadeh, N.; Aslani, S.; Salimi, S.; Hemmatzadeh, M.; Azizi, G.; Jadidi-Niaragh, F.; Mohammadi, H. The roles of ERAP1 and ERAP2 in autoimmunity and cancer immunity: New insights and perspective. Mol. Immunol. 2020, 121, 7–19. [Google Scholar] [CrossRef] [PubMed]
- Yao, K.; Xie, Y.; Wang, J.; Lin, Y.; Chen, X.; Zhou, T. Gut microbiota: A newly identified environmental factor in systemic lupus erythematosus. Front. Immunol. 2023, 14, 1202850. [Google Scholar] [CrossRef]
- Ebringer, A.; Rashid, T.; Tiwana, H.; Wilson, C. A possible link between Crohn’s disease and ankylosing spondylitis via Klebsiella infections. Clin. Rheumatol. 2006, 26, 289–297. [Google Scholar] [CrossRef]
- Raffelsberger, N.; Hetland, M.A.K.; Svendsen, K.; Småbrekke, L.; Löhr, I.H.; Andreassen, L.L.E.; Brisse, S.; Holt, K.E.; Sundsfjord, A.; Samuelsen, Ø.; et al. Gastrointestinal carriage of Klebsiella pneumoniae in a general adult population: A cross-sectional study of risk factors and bacterial genomic diversity. Gut Microbes 2021, 13, 1939599. [Google Scholar] [CrossRef]
- Trindade, B.C.; Chen, G.Y. NOD1 and NOD2 in inflammatory and infectious diseases. Immunol. Rev. 2020, 297, 139–161. [Google Scholar] [CrossRef] [PubMed]
- Maguire, C.; Wang, C.; Ramasamy, A.; Fonken, C.; Morse, B.; Lopez, N.; Wylie, D.; Melamed, E. Molecular mimicry as a mechanism of viral immune evasion and autoimmunity. Nat. Commun. 2024, 15, 9403. [Google Scholar] [CrossRef]
- Honda, T.; Egawa, G.; Kabashima, K. Antigen presentation and adaptive immune responses in skin. Int. Immunol. 2019, 31, 423–429. [Google Scholar] [CrossRef]
- Zhang, L.; Zhang, Y.-J.; Chen, J.; Huang, X.-L.; Fang, G.-S.; Yang, L.-J.; Duan, Y.; Wang, J. The association of HLA-B27 and Klebsiella pneumoniae in ankylosing spondylitis: A systematic review. Microb. Pathog. 2018, 117, 49–54. [Google Scholar] [CrossRef]
- Shamji, M.F.; Bafaquh, M.; Tsai, E. The pathogenesis of ankylosing spondylitis. Neurosurg. Focus 2008, 24, E3. [Google Scholar] [CrossRef]
- Gianfrani, C.; Siciliano, R.A.; Facchiano, A.M.; Camarca, A.; Mazzeo, M.F.; Costantini, S.; Salvati, V.M.; Maurano, F.; Mazzarella, G.; Iaquinto, G.; et al. Transamidation of Wheat Flour Inhibits the Response to Gliadin of Intestinal T Cells in Celiac Disease. Gastroenterology 2007, 133, 780–789. [Google Scholar] [CrossRef] [PubMed]
- Neurath, M.F. Targeting immune cell circuits and trafficking in inflammatory bowel disease. Nat. Immunol. 2019, 20, 970–979. [Google Scholar] [CrossRef] [PubMed]
- Bascuñán, K.A.; Vespa, M.C.; Araya, M. Celiac disease: Understanding the gluten-free diet. Eur. J. Nutr. 2017, 56, 449–459. [Google Scholar] [CrossRef] [PubMed]
- Yohannes, D.A.; Freitag, T.L.; de Kauwe, A.; Kaukinen, K.; Kurppa, K.; Wacklin, P.; Mäki, M.; Arstila, T.P.; Anderson, R.P.; Greco, D.; et al. Deep sequencing of blood and gut T-cell receptor β-chains reveals gluten-induced immune signatures in celiac disease. Sci. Rep. 2017, 7, 17977. [Google Scholar] [CrossRef]
- Yu, Z.; Hong, X.; Zhang, X.; Zheng, F.; Liu, F.; Xu, H.; Zhu, C.; Cai, W.; Liu, D.; Yin, L.; et al. Global Proteomic Analyses Reveals Abnormal Immune Regulation in Patients with New Onset Ankylosing Spondylitis. Front. Immunol. 2022, 13, 838891. [Google Scholar] [CrossRef]
- Muppidi, J.R.; Lu, E.; Cyster, J.G. The G protein–coupled receptor P2RY8 and follicular dendritic cells promote germinal center confinement of B cells, whereas S1PR3 can contribute to their dissemination. J. Exp. Med. 2015, 212, 2213–2222. [Google Scholar] [CrossRef]
- He, Y.; Gallman, A.E.; Xie, C.; Shen, Q.; Ma, J.; Wolfreys, F.D.; Sandy, M.; Arsov, T.; Wu, X.; Qin, Y.; et al. P2RY8 variants in lupus patients uncover a role for the receptor in immunological tolerance. J. Exp. Med. 2021, 219, e20211004. [Google Scholar] [CrossRef] [PubMed]
- Lu, E.; Cyster, J.G. G-protein coupled receptors and ligands that organize humoral immune responses. Immunol. Rev. 2019, 289, 158–172. [Google Scholar] [CrossRef]
- Zhang, R.; Zhu, G.; Li, Z.; Meng, Z.; Huang, H.; Ding, C.; Wang, Y.; Chen, C.; Li, Y.; Liu, H.; et al. ITGAL expression in non-small-cell lung cancer tissue and its association with immune infiltrates. Front. Immunol. 2024, 15, 1382231. [Google Scholar] [CrossRef]
- Glawe, J.D.; Patrick, D.R.; Huang, M.; Sharp, C.D.; Barlow, S.C.; Kevil, C.G. Genetic Deficiency of Itgb2 or ItgaL Prevents Autoimmune Diabetes Through Distinctly Different Mechanisms in NOD/LtJ Mice. Diabetes 2009, 58, 1292–1301. [Google Scholar] [CrossRef]
- Joshi, H.; Morley, S.C. Efficient T Cell Migration and Activation Require L-Plastin. Front. Immunol. 2022, 13, 916137. [Google Scholar] [CrossRef] [PubMed]
- Chen, X.; Jaiswal, A.; Costliow, Z.; Herbst, P.; Creasey, E.A.; Oshiro-Rapley, N.; Daly, M.J.; Carey, K.L.; Graham, D.B.; Xavier, R.J. pH sensing controls tissue inflammation by modulating cellular metabolism and endo-lysosomal function of immune cells. Nat. Immunol. 2022, 23, 1063–1075. [Google Scholar] [CrossRef] [PubMed]
- Li, G.; Lin, J.; Gao, X.; Su, H.; Lin, R.; Gao, H.; Feng, Z.; Wu, H.; Feng, B.; Zuo, K.; et al. Intestinal epithelial pH-sensing receptor GPR65 maintains mucosal homeostasis via regulating antimicrobial defense and restrains gut inflammation in inflammatory bowel disease. Gut Microbes 2023, 15, 2257269. [Google Scholar] [CrossRef]
- Lin, R.; Wu, W.; Chen, H.; Gao, H.; Wu, X.; Li, G.; He, Q.; Lu, H.; Sun, M.; Liu, Z. GPR65 promotes intestinal mucosal Th1 and Th17 cell differentiation and gut inflammation through downregulating NUAK2. Clin. Transl. Med. 2022, 12, e771. [Google Scholar] [CrossRef] [PubMed]
- Chen, M.; Li, Y.; Zhang, M.; Ge, S.; Feng, T.; Chen, R.; Shen, J.; Li, R.; Wang, Z.; Xie, Y.; et al. Histone deacetylase inhibition enhances extracellular vesicles from muscle to promote osteogenesis via miR-873-3p. Signal Transduct. Target. Ther. 2024, 9, 256. [Google Scholar] [CrossRef]
- Yang, Z.; Su, W.; Zhang, Q.; Niu, L.; Feng, B.; Zhang, Y.; Huang, F.; He, J.; Zhou, Q.; Zhou, X.; et al. Lactylation of HDAC1 Confers Resistance to Ferroptosis in Colorectal Cancer. Adv. Sci. 2025, 12, e2408845. [Google Scholar] [CrossRef]
- Li, N.; Zhao, L.; Geng, X.; Liu, J.; Zhang, X.; Hu, Y.; Qi, J.; Chen, H.; Qiu, J.; Zhang, X.; et al. Stimulation by exosomes from hypoxia-preconditioned hair follicle mesenchymal stem cells facilitates mitophagy by inhibiting the PI3K/AKT/mTOR signaling pathway to alleviate ulcerative colitis. Theranostics 2024, 14, 4278–4296. [Google Scholar] [CrossRef]
- Wang, S.; Guo, S.; Guo, J.; Du, Q.; Wu, C.; Wu, Y.; Zhang, Y. Cell death pathways: Molecular mechanisms and therapeutic targets for cancer. Medcomm 2024, 5, e693. [Google Scholar] [CrossRef]
- Xu, M.; Chen, J.; Gao, L.; Cai, S.; Dong, H. Microplastic exposure induces HSP90α secretion and aggravates asthmatic airway remodeling via PI3K-Akt-mTOR pathway. Ecotoxicol. Environ. Saf. 2025, 291, 117828. [Google Scholar] [CrossRef]
- Nie, L.; Zhao, K.; Xu, C.; Zhang, W.; Huang, X.; Han, Y. Identification of Potential Genes in Rheumatoid Arthritis-Associated Interstitial Lung Disease Using RNA-seq and In Vitro Analyses. Cell Biochem. Funct. 2024, 43, e70033. [Google Scholar] [CrossRef]
- Chen, Z.; Jiang, P.; Su, D.; Zhao, Y.; Zhang, M. Therapeutic inhibition of the JAK-STAT pathway in the treatment of inflammatory bowel disease. Cytokine Growth Factor Rev. 2024, 79, 1–15. [Google Scholar] [CrossRef] [PubMed]
- Zhou, X.; Xu, T.; Li, C.; He, Y.; Hu, Y.; Gong, H.; Li, J.; Jiang, H.; Wen, L.; Fu, Y.; et al. Potentiating anti-tumor immunity by re-engaging immune synapse molecules. Cell Rep. Med. 2025, 6, 101975. [Google Scholar] [CrossRef] [PubMed]
- Zhong, D.; Jin, K.; Wang, R.; Chen, B.; Zhang, J.; Ren, C.; Chen, X.; Lu, J.; Zhou, M. Microalgae-Based Hydrogel for Inflammatory Bowel Disease and Its Associated Anxiety and Depression. Adv. Mater. 2024, 36, e2312275. [Google Scholar] [CrossRef]
- Birney, E. Mendelian Randomization. Cold Spring Harb. Perspect. Med. 2021, 12, a041302. [Google Scholar] [CrossRef]
- Sekula, P.; Fabiola Del Greco, M.; Pattaro, C.; Köttgen, A. Mendelian Randomization as an Approach to Assess Causality Using Observational Data. J. Am. Soc. Nephrol. 2016, 27, 3253–3265. [Google Scholar] [CrossRef] [PubMed]
- Pak, M.A.; Markhieva, K.A.; Novikova, M.S.; Petrov, D.S.; Vorobyev, I.S.; Maksimova, E.S.; Kondrashov, F.A.; Ivankov, D.N.; Budisa, N. Using AlphaFold to predict the impact of single mutations on protein stability and function. PLoS ONE 2023, 18, e0282689. [Google Scholar] [CrossRef]
- Liu, Y.; Wang, Y.; Zhang, R.; Wang, S.; Li, J.; An, Z.; Song, J.; Wu, W. Transcriptomics profile of human bronchial epithelial cells exposed to ambient fine particles and influenza virus (H3N2). Sci. Rep. 2023, 13, 19259. [Google Scholar] [CrossRef]

Disclaimer/Publisher’s Note: The statements, opinions and data contained in all publications are solely those of the individual author(s) and contributor(s) and not of MDPI and/or the editor(s). MDPI and/or the editor(s) disclaim responsibility for any injury to people or property resulting from any ideas, methods, instructions or products referred to in the content. |
© 2025 by the authors. Licensee MDPI, Basel, Switzerland. This article is an open access article distributed under the terms and conditions of the Creative Commons Attribution (CC BY) license (https://creativecommons.org/licenses/by/4.0/).
Share and Cite
Li, Y.; Xu, S.; Zhang, M.; Yang, X.; Wei, Z. Causal Inference and Shared Molecular Pathways in Crohn’s Disease, Celiac Disease, and Ankylosing Spondylitis: Integrative Mendelian Randomization and Transcriptomic Analysis. Int. J. Mol. Sci. 2025, 26, 6451. https://doi.org/10.3390/ijms26136451
Li Y, Xu S, Zhang M, Yang X, Wei Z. Causal Inference and Shared Molecular Pathways in Crohn’s Disease, Celiac Disease, and Ankylosing Spondylitis: Integrative Mendelian Randomization and Transcriptomic Analysis. International Journal of Molecular Sciences. 2025; 26(13):6451. https://doi.org/10.3390/ijms26136451
Chicago/Turabian StyleLi, Ya, Shihao Xu, Mingzhu Zhang, Xin Yang, and Zhengqiang Wei. 2025. "Causal Inference and Shared Molecular Pathways in Crohn’s Disease, Celiac Disease, and Ankylosing Spondylitis: Integrative Mendelian Randomization and Transcriptomic Analysis" International Journal of Molecular Sciences 26, no. 13: 6451. https://doi.org/10.3390/ijms26136451
APA StyleLi, Y., Xu, S., Zhang, M., Yang, X., & Wei, Z. (2025). Causal Inference and Shared Molecular Pathways in Crohn’s Disease, Celiac Disease, and Ankylosing Spondylitis: Integrative Mendelian Randomization and Transcriptomic Analysis. International Journal of Molecular Sciences, 26(13), 6451. https://doi.org/10.3390/ijms26136451