
Mn-Doped Carbon Dots as Contrast Agents for Magnetic Resonance and Fluorescence Imaging

 , , ,
, , ,  , ,
, ,  ,
, 
Abstract
1. Introduction
2. Results and Discussion
2.1. Characterization of the Mn-Doped Carbon Dots
2.2. Photoluminescence Properties of the Prepared CDs
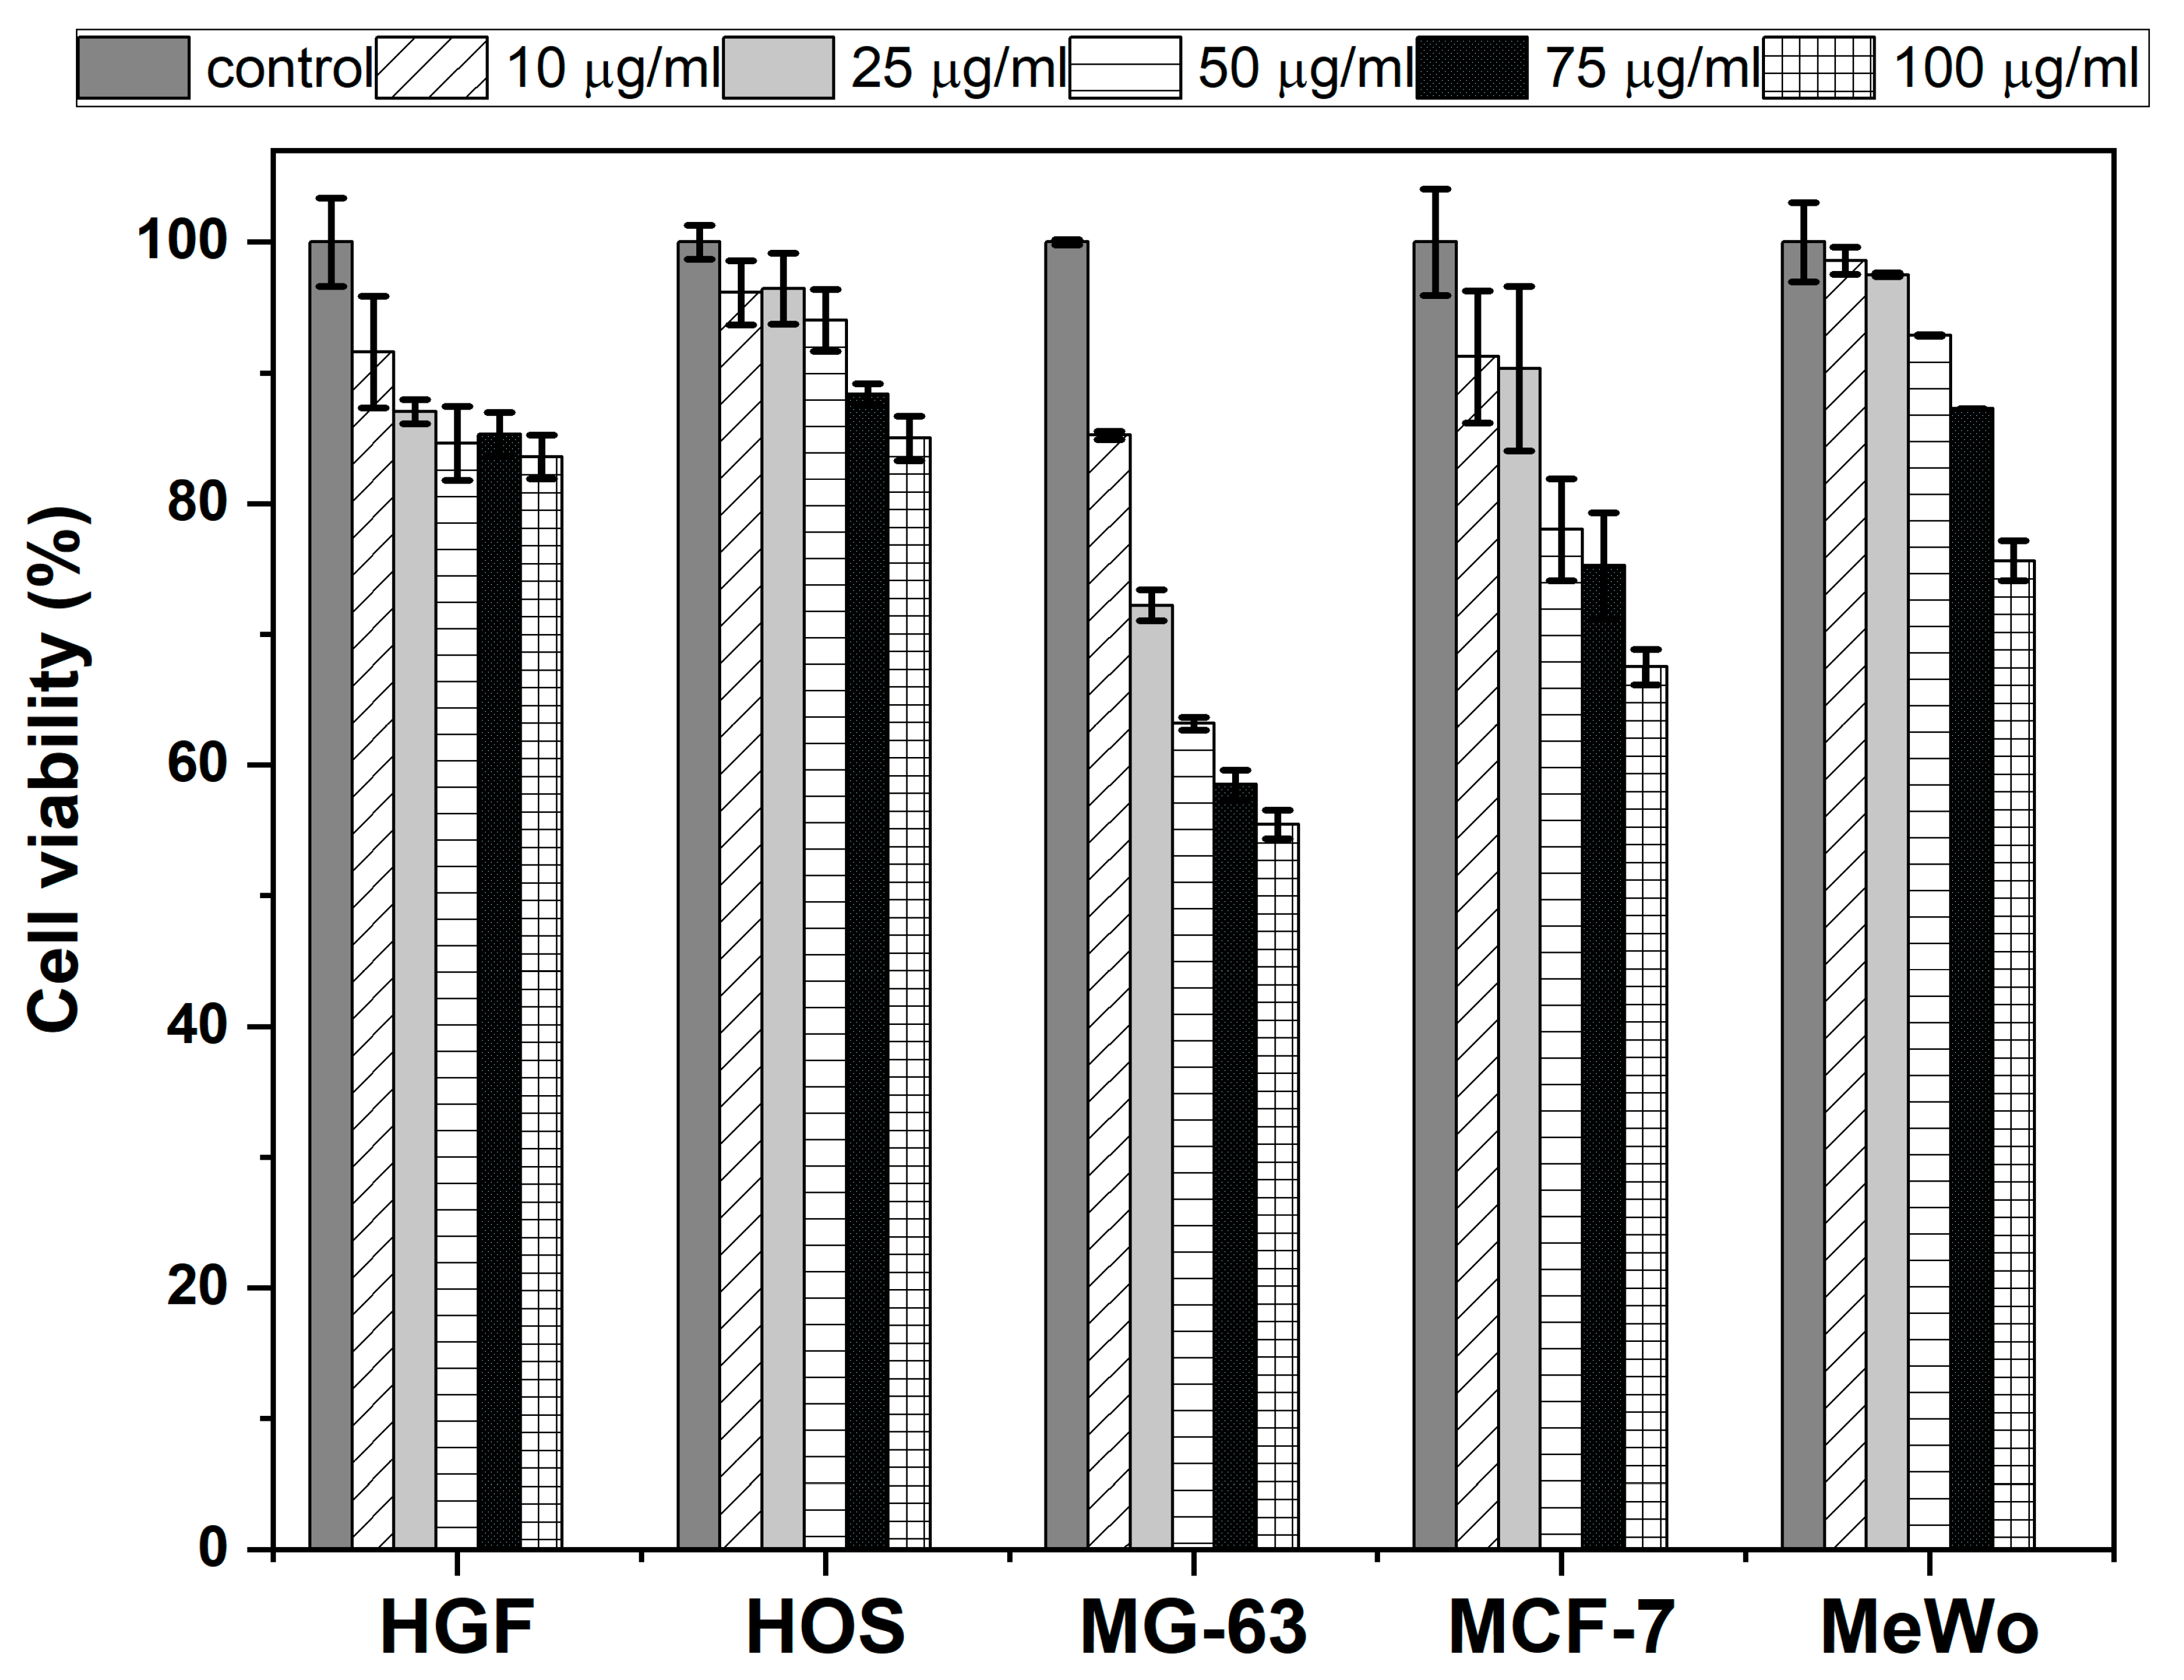
2.3. Biocompatibility and Cytotoxicity
2.4. Fluorescence and Magnetic Resonance Imaging Applications of the Mn(II)-CNDs
3. Materials and Methods
3.1. Materials
3.2. Synthesis of the Mn-Doped Carbon Dots
3.3. Characterization Techniques
3.4. Cell Viability Assay
3.5. In Vitro Fluorescence Imaging
3.6. In Vitro Magnetic Resonance Imaging (MRI) Assays
4. Conclusions
Supplementary Materials
Author Contributions
Funding
Institutional Review Board Statement
Informed Consent Statement
Data Availability Statement
Acknowledgments
Conflicts of Interest
References
- Ozyurt, D.; Al Kobaisi, M.; Hocking, R.K.; Fox, B. Properties, synthesis, and applications of carbon dots: A review. Carbon. Trends 2023, 12, 100276. [Google Scholar] [CrossRef]
- Etefa, H.F.; Dejene, F.B. Applications of Green Carbon Dots in Personalized Diagnostics for Precision Medicine. Int. J. Mol. Sci. 2025, 26, 2846. [Google Scholar] [CrossRef] [PubMed]
- Bhattacharya, T.; Shin, G.H.; Kim, J.T. Carbon Dots: Opportunities and Challenges in Cancer Therapy. Pharmaceutics 2023, 15, 1019. [Google Scholar] [CrossRef] [PubMed]
- Pandey, V.K.; Tripathi, A.; Taufeeq, A.; Hussain Dar, A.; Samrot, A.V.; Rustagi, S.; Malik, S.; Bhattacharya, T.; Kovacs, B.; Shaikh, A.M. Significance and applications of carbon dots in anti cancerous nanodrug conjugate development: A review. Appl. Surf. Sci. Adv. 2024, 19, 100550. [Google Scholar] [CrossRef]
- Liu, J.; Li, R.; Yang, B. Carbon Dots: A New Type of Carbon-Based Nanomaterial with Wide Applications. ACS Cent. Sci. 2020, 6, 2179–2195. [Google Scholar] [CrossRef]
- Tian, X.; Zeng, A.; Liu, Z.; Zheng, C.; Wei, Y.; Yang, P.; Zhang, M.; Yang, F.; Xie, F. Carbon Quantum Dots: In vitro and in ivo Studies on Biocompatibility and Biointeractions for Optical Imaging. Int. J. Nanomed. 2020, 15, 6519–6529. [Google Scholar] [CrossRef]
- Ansari, L.; Hallaj, S.; Hallaj, T.; Amjadi, M. Doped-carbon dots: Recent advances in their biosensing, bioimaging and therapy applications. Colloids Surf. B Biointerfaces 2021, 203, 111743. [Google Scholar] [CrossRef]
- Li, Q.X.; Shen, D.; Xing, D. Carbon quantum dots as ROS-generator and -scavenger: A comprehensive review. Dyes Pigm. 2023, 208, 110784. [Google Scholar] [CrossRef]
- Osorio, H.M.; Castillo-Solís, F.; Barragán, S.Y.; Rodríguez-Pólit, C.; Gonzalez-Pastor, R. Graphene Quantum Dots from Natural Carbon Sources for Drug and Gene Delivery in Cancer Treatment. Int. J. Mol. Sci. 2024, 25, 10539. [Google Scholar] [CrossRef]
- Zhang, Q.; Wang, R.; Feng, B.; Zhong, X.; Ostrikov, K. Photoluminescence mechanism of carbon dots: Triggering high-color-purity red fluorescence emission through edge amino protonation. Nat. Commun. 2021, 12, 6856. [Google Scholar] [CrossRef]
- Wang, B.; Lu, S. The light of carbon dots: From mechanism to applications. Matter 2022, 5, 110–149. [Google Scholar] [CrossRef]
- Jiang, Y.; Zhao, T.; Xu, W.; Peng, Z. Red/NIR C-dots: A perspective from carbon precursors, photoluminescence tuning and bioapplications. Carbon 2024, 219, 118838. [Google Scholar] [CrossRef]
- Gallareta-Olivares, G.; Rivas-Sanchez, A.; Cruz-Cruz, A.; Hussain, S.M.; González-González, R.B.; Cárdenas-Alcaide, M.F.; Iqbal, H.M.N.; Parra-Saldívar, R. Metal-doped carbon dots as robust nanomaterials for the monitoring and degradation of water pollutants. Chemosphere 2023, 312, 137190. [Google Scholar] [CrossRef] [PubMed]
- Stan, C.S.; Coroabă, A.; Ursu, E.L.; Secula, M.S.; Simionescu, B.C. Fe(III) doped carbon nanodots with intense green photoluminescence and dispersion medium dependent emission. Sci. Rep. 2019, 9, 18893. [Google Scholar] [CrossRef]
- Shi, Y.; Xia, Y.; Zhou, M.; Wang, Y.; Bao, J.; Zhang, Y.; Cheng, J. Facile synthesis of Gd/Ru-doped fluorescent carbon dots for fluorescent/MR bimodal imaging and tumor therapy. J. Nanobiotechnol. 2024, 22, 88. [Google Scholar] [CrossRef]
- Lakshmi Devi, A.; Sreelakshmi, M.; Suneesh, P.V.; Satheesh Babu, T.G. Copper and nickel doped carbon dots for rapid and sensitive fluorescent turn-off detection of bilirubin. Sci. Rep. 2025, 15, 1262. [Google Scholar] [CrossRef]
- Rub Pakkath, S.A.; Shashank Shankar, C.; Praneetha, S.; Arumugam, V.M.; Yogesh, K.; Periyasamy, L.; Muthukamalam, S.; Sudha, R.S.; Kirankumar, S. Transition Metal Ion (Mn2+, Fe2+, Co2+, and Ni2+)-Doped Carbon Dots Synthesized via Microwave-Assisted Pyrolysis: A Potential Nanoprobe for Magneto-fluorescent Dual-Modality Bioimaging. ACS Biomater. Sci. Eng. 2018, 4, 2582–2596. [Google Scholar] [CrossRef]
- Molaei, M.J. Gadolinium-doped fluorescent carbon quantum dots as MRI contrast agents and fluorescent probes. Sci. Rep. 2022, 12, 17681. [Google Scholar] [CrossRef]
- Ali, V.; Kefayati, H.; Shafiee Ardestani, M.; Pourahmad, A. Synthesis and evaluation of new magneto-fluorescent carbon dot based on manganese citrate for MRI imaging. Magn. Reson. Mater. Phys. 2024, 37, 139–148. [Google Scholar] [CrossRef]
- Tsai, T.-H.; Lo, W.; Wang, H.-Y.; Tsai, T.-L. Carbon Dot Micelles Synthesized from Leek Seeds in Applications for Cobalt (II) Sensing, Metal Ion Removal, and Cancer Therapy. J. Funct. Biomater. 2024, 15, 347. [Google Scholar] [CrossRef]
- Xia, J.; Kawamura, Y.; Suehiro, T.; Chen, Y.; Sato, K. Carbon dots have antitumor action as monotherapy or combination therapy. Drug Discov. Ther. 2019, 13, 114–117. [Google Scholar] [CrossRef] [PubMed]
- Mogharbel, A.T.; Abu-Melha, S.; Hameed, A.; Attar, R.M.S.; Alrefaei, A.F.; Almahri, A.; El-Metwaly, N. Anticancer and microbicide action of carbon quantum dots derived from microcrystalline cellulose: Hydrothermal versus infrared assisted techniques. Arab. J. Chem. 2023, 16, 104419. [Google Scholar] [CrossRef]
- Wang, M.; Lan, S.; Zhang, W.; Jin, Q.; Du, H.; Sun, X.; He, L.; Meng, X.; Su, L.; Liu, G. Anti-Cancer Potency of Copper-Doped Carbon Quantum Dots Against Breast Cancer Progression. Int. J. Nanomed. 2024, 19, 1985–2004. [Google Scholar] [CrossRef]
- Tiron, A.; Stan, C.S.; Luta, G.; Uritu, C.M.; Vacarean-Trandafir, I.-C.; Stanciu, G.D.; Coroaba, A.; Tiron, C.E. Manganese-Doped N-Hydroxyphthalimide-Derived Carbon Dots—Theranostics Applications in Experimental Breast Cancer Models. Pharmaceutics 2021, 13, 1982. [Google Scholar] [CrossRef] [PubMed]
- Damato, A.N. Diphenylhydantoin: Pharmacological and clinical use, Progress. Prog. CardiovasC Dis. 1969, 12, 1–15. [Google Scholar] [CrossRef]
- Puszyńska-Tuszkanow, M.; Daszkiewicz, M.; Maciejewska, G.; Adach, A.; Cieslak-Golonka, M. Interaction of hydantoins with transition metal ions: Synthesis, structural, spectroscopic, thermal and magnetic properties of [M(H2O)4(phenytoinate)2] M = Ni(II), Co(II). Struct. Chem. 2010, 21, 315–321. [Google Scholar] [CrossRef]
- ISO 10993–5:2009; Biological Evaluation of Medical Devices—Part 5: Tests for In Vitro Cytotoxicity. International Organization for Standardization: Geneva, Switzerland, 2009; English version. Available online: https://www.iso.org/standard/36406.html (accessed on 1 July 2024).
- Dragoi, B.; Uritu, C.M.; Agrigoroaie, L.; Lutic, D.; Hulea, V.; Postole, G.; Coroaba, A.; Carasevici, E. MnAl-Layered Double Hydroxide Nanosheets Infused with Fluorouracil for Cancer Diagnosis and Therapy. ACS Appl. Nano Mater. 2021, 4, 2061–2075. [Google Scholar] [CrossRef]
- Homer, J.; Beevers, M.S. Driven-equilibrium single-pulse observation of T1 relaxation. A reevaluation of a rapid “new” method for determining NMR spin-lattice relaxation times. J. Magn. Reason. 1985, 63, 287–297. [Google Scholar] [CrossRef]
- Deawati, Y.; Onggo, D.; Mulyani, I.; Iwan Hastiawan, I.; Utami, R.A.; Kurnia, D. Synthesis of [Mn(Salen)Cl] Complex Compound and Superoxide Dismutase Activity Determination through Non-Enzymatic Method. KEM 2018, 811, 22–27. [Google Scholar] [CrossRef]
- Stepanidenko, E.A.; Vedernikova, A.A.; Badrieva, Z.F.; Brui, E.A.; Ondar, S.O.; Miruschenko, M.D.; Volina, O.V.; Koroleva, A.V.; Zhizhin, E.V.; Ushakova, E.V. Manganese-Doped Carbon Dots as a Promising Nanoprobe for Luminescent and Magnetic Resonance Imaging. Photonics 2023, 10, 757. [Google Scholar] [CrossRef]
- Korin, E.; Froumin, N.; Cohen, S. Surface Analysis of Nanocomplexes by X-ray Photoelectron Spectroscopy (XPS). ACS Biomater. Sci. Eng. 2017, 3, 882–889. [Google Scholar] [CrossRef] [PubMed]
- Mourdikoudis, S.; Pallares, R.M.; Thanh, N.T.K. Characterization techniques for nanoparticles: Comparison and complementarity upon studying nanoparticle properties. Nanoscale 2018, 10, 12871–12934. [Google Scholar] [CrossRef] [PubMed]
- Feng, J.; Gao, H.; Zheng, L.; Chen, Z.; Zeng, S.; Jiang, C.; Dong, H.; Liu, L.; Zhang, S.; Zhang, X. A Mn-N3 single-atom catalyst embedded in graphitic carbon nitride for efficient CO2 electroreduction. Nat. Commun. 2020, 11, 4341. [Google Scholar] [CrossRef]
- Tariq, M.; Shivalkar, S.; Hasan, H.; Sahoo, A.K.; Sk, M.P. Manganese Doping in Biomass Derived Carbon Dots Amplifies White Light-Induced Antibacterial Activity. ACS Omega 2023, 8, 49460–49466. [Google Scholar] [CrossRef]
- Li, J.; Chen, M.; Cullen, D.A.; Hwang, S.; Wang, M.; Li, B.; Liu, K.; Karakalos, S.; Lucero, M.; Zhang, H.; et al. Atomically dispersed manganese catalysts for oxygen reduction in proton-exchange membrane fuel cells. Nat. Catal. 2018, 1, 935–945. [Google Scholar] [CrossRef]
- Ferreyra, D.D.; Sartori, D.R.; Ezquerra Riega, S.D.; Rodríguez, H.B.; Gonzalez, M.C. Tuning the nitrogen content of carbon dots in carbon nitride nanoflakes. Carbon 2020, 167, 230–243. [Google Scholar] [CrossRef]
- Eroglu, Z.; Ozer, M.S.; Metin, Ö. Nitrogen-Based Imperfections in Graphitic Carbon Nitride—New Trend for Enhancing Photocatalytic Activity? ChemCatChem 2024, 16, e202301560. [Google Scholar] [CrossRef]
- Li, H.; Xia, Y.; Hu, T.; Deng, Q.; Du, N.; Hou, W. Enhanced charge carrier separation of manganese(ii)-doped graphitic carbon nitride: Formation of N–Mn bonds through redox reactions. J. Mater. Chem. A. 2018, 6, 6238–6243. [Google Scholar] [CrossRef]
- Tian, B.; Liu, S.; Feng, L.; Liu, S.; Gai, S.; Dai, Y.; Xie, L.; Liu, B.; Yang, P.; Zhao, Y. Renal-clearable nickel doped carbon dots with boosted photothermal conversion efficiency for multimodal imaging-guided cancer therapy in the second near-infrared biowindow. Adv. Funct. Mat. 2021, 31, 2100549. [Google Scholar] [CrossRef]
- Wang, S.; Morelos-Gómez, A.; Lei, Z.; Terrones, M.; Takeuchi, K.; Sugimoto, W.; Endo, M.; Kaneko, K. Correlation in structure and properties of highly-porous graphene monoliths studied with a thermal treatment method. Carbon 2016, 96, 174–183. [Google Scholar] [CrossRef]
- González-González, R.B.; González, L.T.; Madou, M.; Leyva-Porras, C.; Martinez-Chapa, S.O.; Mendoza, A. Synthesis, Purification, and Characterization of Carbon Dots from Non-Activated and Activated Pyrolytic Carbon Black. Nanomater 2022, 12, 298. [Google Scholar] [CrossRef] [PubMed]
- Ding, H.; Li, X.-H.; Xiao-Bo Chen, X.-B.; Wei, J.-S.; Li, X.-B.; Xiong, H.-M. Surface states of carbon dots and their influences on luminescence. J. Appl. Phys. 2020, 127, 231101. [Google Scholar] [CrossRef]
- Ehrat, F.; Bhattacharyya, S.; Schneider, J.; Löf, A.; Wyrwich, R.; Rogach, A.L.; Stolarczyk, J.K.; Urban, A.S.; Feldmann, J. Tracking the Source of Carbon Dot Photoluminescence: Aromatic Domains versus Molecular Fluorophores. Nano Lett. 2017, 17, 7710. [Google Scholar] [CrossRef]
- Mohandoss, S.; Palanisamy, S.; Priya, V.V.; Mohan, S.K.; Shim, J.-J.; Yelithao, K.; You, S.G.; Lee, Y.R. Excitation-dependent multiple luminescence emission of nitrogen and sulfur co-doped carbon dots for cysteine sensing, bioimaging, and photoluminescent ink applications. Microchem. J. 2021, 167, 106280. [Google Scholar] [CrossRef]
- Jiang Y, Han Q, Peng J, Lv Y, Ruan Y, Weng X, Milcovich G, Tailored hydrothermal platforms for fluorescent Q-dots with theranostic application. Spectrochim. Acta Part A Mol. Biomol. Spectrosc. 2025, 331, 125773.
- Gomez-Blanco, N.; Prato, M. Microwave-assisted one-step synthesis of water-soluble manganese-carbon nanodot clusters. Commun. Chem. 2023, 6, 174–181. [Google Scholar] [CrossRef]
- Sun, S.; Guan, Q.; Liu, Y.; Wei, B.; Yang, Y.; Yu, Z. Highly luminescence manganese doped carbon dots. Chin. Chem. Lett. 2019, 30, 1051–1054. [Google Scholar] [CrossRef]
- Zhang, T.; Zhu, J.; Zhai, Y.; Wang, H.; Bai, H.; Dong, B.; Wang, H.; Song, H. A novel mechanism for red emission carbon dots: Hydrogen bond dominated molecular states emission. Nanoscale 2017, 9, 13042. [Google Scholar] [CrossRef]
- Bhavikatti, S.K.; Zainuddin, S.L.A.; Ramli, R.B.; Nadaf, S.J.; Dandge, P.B.; Khalate, M.; Karobari, M.I. Green-synthesized carbon dots from ginger: Multifunctional agents against oral pathogens with biocompatibility in human gingival fibroblast cells. Curr. Plant Biol. 2024, 40, 100392. [Google Scholar] [CrossRef]
- Nugroho D, Thinthasit A, Khoris I M, Siriputthaiwan P, Benchawattananon R, Chanthai S, L-histidine doped CDs from Zingiber Montanum using hydrothermal method to enhance its antimicrobial activity and imply for latent fingerprint detection. Arabian J. Chem. 2024, 17, 105602.
- Marković, Z.M.; Budimir, M.D.; Danko, M.; Milivojević, D.D.; Kubat, P.; Zmejkoski, D.Z.; Pavlović, V.B.; Mojsin, M.M.; Stevanović, M.J.; Todorović Marković, B.M. Structural, optical, and bioimaging characterization of carbon quantum dots solvothermally synthesized from o-phenylenediamine. Beilstein J. Nanotechnol. 2023, 14, 165–174. [Google Scholar] [CrossRef] [PubMed]
- Zmejkoski, D.Z.; Zdravković, N.M.; Mitić, D.D.; Marković, Z.M.; Budimir Filimonović, M.D.; Milivojević, D.D.; Todorović Marković, B.M. Graphene Quantum Dots in Bacterial Cellulose Hydrogels for Visible Light-Activated Antibiofilm and Angiogenesis in Infection Management. Int. J. Mol. Sci. 2025, 26, 1053. [Google Scholar] [CrossRef] [PubMed]
- Al-anbaky, Q.; Al-karakooly, Z.; Kilaparty, S.P.; Agrawal, M.; Albkuri, Y.M.; RanguMagar, A.B.; Ghosh, A.; Ali, N. Cytotoxicity of Manganese (III) Complex in Human Breast Adenocarcinoma Cell Line Is Mediated by the Generation of Reactive Oxygen Species Followed by Mitochondrial Damage. Int. J. Toxicol. 2016, 35, 672–682. [Google Scholar] [CrossRef]
- Isnaini, I.; Permatasari, N.; Mintaroem, K.; Prihardina, B.; Widodo, M.A. Oxidants-Antioxidants Profile in the Breast Cancer Cell Line MCF-7. Asian Pac. J. Cancer Prev. 2018, 29, 3175–3178. [Google Scholar] [CrossRef] [PubMed]
- Choromańska, A.; Saczko, J.; Kulbacka, J.; Kamińska, I.; Skołucka, N.; Majkowski, M. Comparison of the influence of photodynamic reaction on the Me45 and MEWO cell lines in vitro. Contemp. Oncol. 2012, 16, 240–243. [Google Scholar] [CrossRef] [PubMed]
- Becuwe, P.; Ennen, M.; Klotz, R.; Barbieux, C.; Grandemange, S. Manganese superoxide dismutase in breast cancer: From molecular mechanisms of gene regulation to biological and clinical significance. Free. Radic. Biol. Med. 2014, 77, 139–151. [Google Scholar] [CrossRef]
- Martin, R.C.; Ahn, J.; Nowell, S.A.; Hein, D.W.; Doll, M.A.; Martini, B.D.; Ambrosone, C.B. Association between manganese superoxide dismutase promoter gene polymorphism and breast cancer survival. Breast Cancer Res. 2006, 8, R45. [Google Scholar] [CrossRef]
- Ali, S.F.; Duhart, H.M.; Newport, G.D.; Lipe, W.; Slikker, W. Manganese-induced reactive oxygen species: Comparison between Mn+2 and Mn+3. Neurodegeneration 1995, 4, 329–334. [Google Scholar] [CrossRef]
- Tao Y, Ou Y, Yin H, Chen Y, Zhong S, Gao Y, Zhao Z, He B, Huang Q, Deng Q, Deng Q, et al: Establishment and characterization of human osteosarcoma cells resistant to pyropheophorbide-α methyl ester-mediated photodynamic therapy. Int. J. Oncol. 2017, 51, 1427–1438. [CrossRef]
- Geraldes, C.F.G.C. Manganese Oxide Nanoparticles for MRI-Based Multimodal Imaging and Theranostics. Molecules 2024, 29, 5591. [Google Scholar] [CrossRef]
- Van Roosbroeck, R.; Van Roy, W.; Stakenborg, T.; Trekker, J.; D’Hollander, A.; Dresselaers, T.; Himmelreich, U.; Lammertyn, J.; Lagae, L. Synthetic Antiferromagnetic Nanoparticles as Potential Contrast Agents in MRI. ACS Nano 2014, 8, 2269–2278. [Google Scholar] [CrossRef] [PubMed]
- Son, T.; Kim, M.; Choi, M.; Nam, S.H.; Yoo, A.; Lee, H.; Han, E.H.; Hong, K.S.; Park, H.S. Advancing fluorescence imaging: Enhanced control of cyanine dye-doped silica nanoparticles. J. Nanobiotechnol. 2025, 22, 347–361. [Google Scholar] [CrossRef]
- Doan, V.H.M.; Nguyen, V.T.; Mondal, S.; Vo, T.M.T.; Ly, C.D.; Vu, D.D.; Ataklti, G.Y.; Park, S.; Choi, J.; Oh, J. Fluorescence/photoacoustic imaging-guided nanomaterials for highly efficient cancer theragnostic agent. Sci. Rep. 2021, 11, 15943. [Google Scholar] [CrossRef]
- Walsh, E.G.; Mills, D.R.; Lim, S.; Sana, B.; Brilliant, K.E.; Park, W.K.C. MRI contrast demonstration of antigen-specific targeting with an iron-based ferritin construct. J. Nanopart Res. 2013, 15, 1409. [Google Scholar] [CrossRef]
- Hamzaini, N.N.; Ghazali, S.A.; Yusoff, A.N.; Zaki, F.M.; Sulaiman, W.N.A.W.; Dwihapsari, Y. FeCl3 and GdCl3 solutions as superfast relaxation modifiers for agarose gel: A quantitative analysis. Magn. Reson. Mater. Phys. Biol. Med. 2025, 38, 141–160. [Google Scholar] [CrossRef]
- Caspani, S.; Magalhães, R.; Araújo, J.P.; Sousa, C.T. Magnetic Nanomaterials as Contrast Agents for MRI. Materials 2020, 13, 2586. [Google Scholar] [CrossRef] [PubMed]
- Rohrer, M.; Bauer, H.; Mintorovitch, J.; Requardt, M.; Weinmann, H.-J. Comparison of magnetic properties of MRI contrast media solutions at different magnetic field strengths. Investig. Radiol. 2005, 40, 715–724. [Google Scholar] [CrossRef]
- Zuo, H.; Chen, W.; Li, B.; Xu, K.; Cooper, H.; Gu, Z.; Xu, Z.P. MnAl Layered Double Hydroxide Nanoparticles as a DualFunctional Platform for Magnetic Resonance Imaging and siRNA Delivery. Chem. Eur. J. 2017, 23, 14299. [Google Scholar] [CrossRef]
- Chen, Y.; Ye, D.; Wu, M.; Chen, H.; Zhang, L.; Shi, J.; Wang, L. Break-up of Two-Dimensional MnO2 Nanosheets Promotes Ultrasensitive pH-Triggered Theranostics of Cancer. Adv. Mater. 2014, 26, 7019–7026. [Google Scholar] [CrossRef]
- Huang, G.; Zhang, K.-L.; Chen, S.; Li, S.-H.; Wang, L.-L.; Wang, L.-P.; Liu, R.; Gao, J.; Yang, H.-H. Manganese-iron layered double hydroxide: A theranostic nanoplatform with pH-responsive MRI contrast enhancement and drug release. J. Mater. Chem. B 2017, 5, 3629–3633. [Google Scholar] [CrossRef]
- Na, H.B.; Lee, J.H.; An, K.; Park, Y.I.; Park, M.; Lee, I.S.; Nam, D.-H.; Kim, S.T.; Kim, S.-H.; Kim, S.-W.; et al. Development of a T1 Contrast Agent for Magnetic Resonance Imaging Using MnO Nanoparticles. Angew. Chem. 2007, 46, 5397–5401. [Google Scholar] [CrossRef] [PubMed]
- Chen, Y.; Yin, Q.; Ji, X.; Zhang, S.; Chen, H.; Zheng, Y.; Sun, Y.; Qu, H.; Wang, Z.; Li, Y.; et al. Manganese oxide-based multifunctionalized mesoporous silica nanoparticles for pH-responsive MRI, ultrasonography and circumvention of MDR in cancer cells. Biomaterials 2012, 33, 7126–7137. [Google Scholar] [CrossRef] [PubMed]
- Li, B.; Gu, Z.; Kurniawan, N.; Chen, W.; Xu, Z.P. Manganese-Based Layered Double Hydroxide Nanoparticles as a T1-MRI Contrast Agent with Utrasensitive pH Response and High Relaxivity. Adv. Mater. 2017, 29, 1700373. [Google Scholar]
- Banerjee, A.; Blasiak, B.; Pasquier, E.; Tomanek, B.; Trudel, S. Synthesis, characterization, and evaluation of PEGylated first-row transition metal ferrite nanoparticles as T2 contrast agents for high-field MRI. RSC Adv. 2017, 7, 38125–38134. [Google Scholar] [CrossRef]


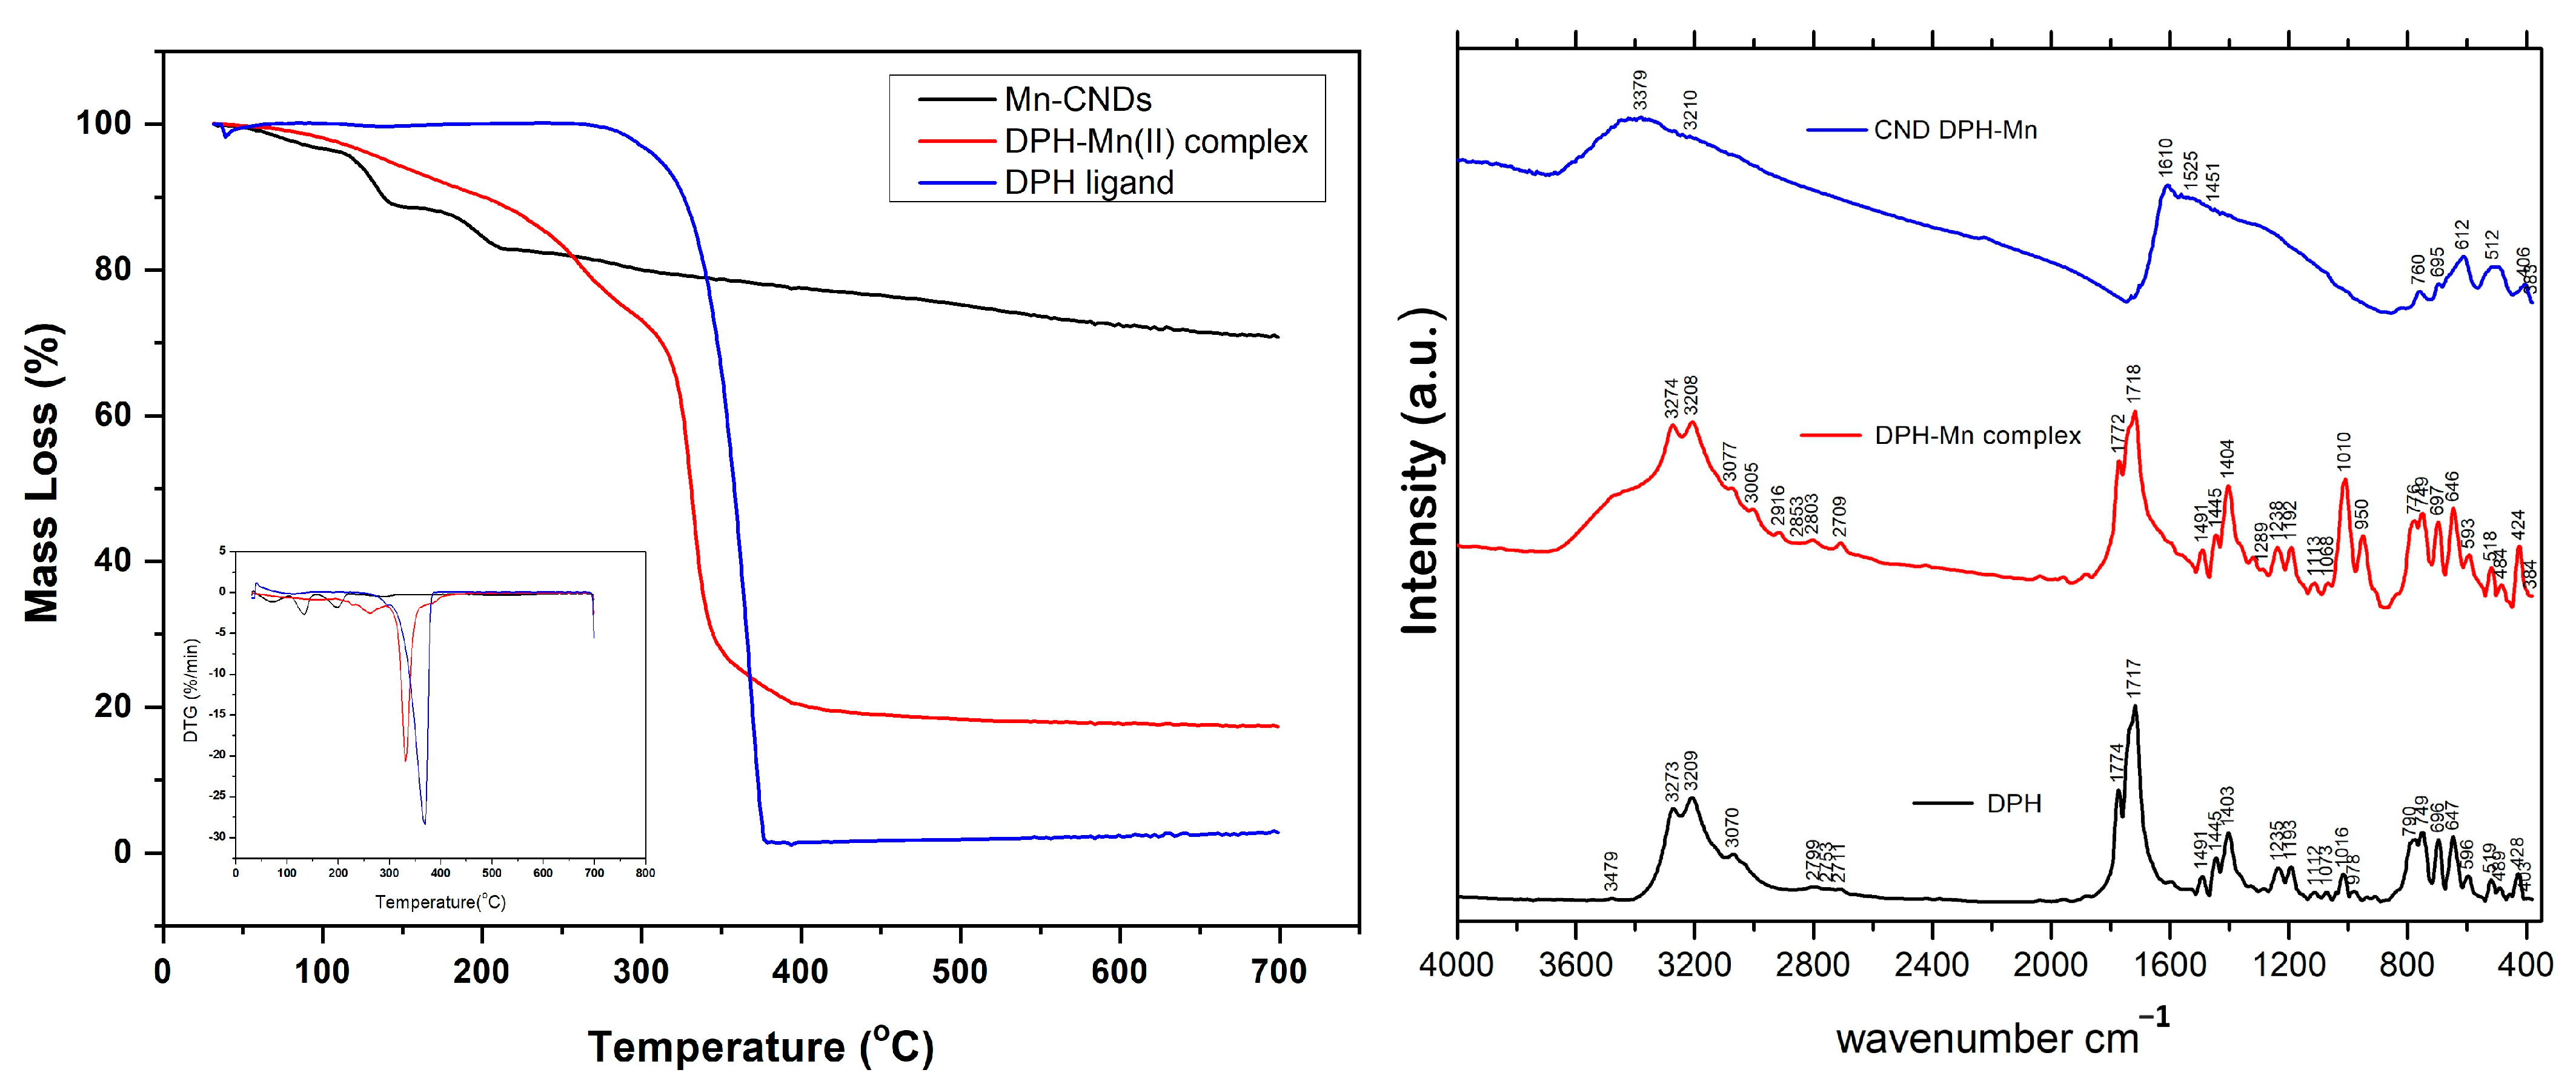
| Description | Recorded Peaks (cm−1) | ||
|---|---|---|---|
| DPH | Mn(II)-DPH | Mn(II)-CNDs | |
| N-H stretch | 3479 | - | - |
| OH stretch | 3273 | 3274 | included in 3279/3210 broad peak |
| C-H stretch | 3070 | - | included in 3279/3210 broad peak |
| C=C/C-C stretch | 2799/2711/1235 | 2709/2703 | included in 3279/3210 broad peak |
| C=O asym. stretch | 1774 | 1772 | included in 1610 broad peak |
| C=O sym. stretch | 1717 | 1718 | included in 1610 broad peak |
| Amide band | - | - | included in 1610, 1529 broad peaks |
| C-N-H deformation | 1491 | 1491 | 1451 |
| Aromatic ring stretch | 1445 | 1445 | included in broad peak of 1610 |
| N-H def. | 1403 | 1404 | - |
| N-C=O def. | 749/696 | 749/697 | 760/695 |
| C-N-C def. | 647 | 646 | 612 |
| C-C=O def. | 519 | 518 | 512 |
| Element | EDX | XPS | FAAS | ||||
|---|---|---|---|---|---|---|---|
| DPH-CNDs | Mn(II)-CNDs | Mn(II)-CNDs Normalized Without Cl | DPH-CNDs | Mn(II)-CNDs | Mn(II)-CNDs Normalized Without Cl | Mn(II)-CNDs | |
| C | 90.81 | 70.32 | 76.14 | 86.84 | 53.06 | 75.41 | - |
| N | 7.71 | 5.63 | 6.10 | 7.07 | 4.91 | 6.95 | - |
| O | 1.48 | 10.60 | 11.48 | 6.09 | 8.34 | 11.81 | - |
| Mn | - | 5.81 | 6.29 | - | 4.30 | 6.09 | 4.83 |
| Cl | - | 7.64 | - | - | 29.40 | - | |
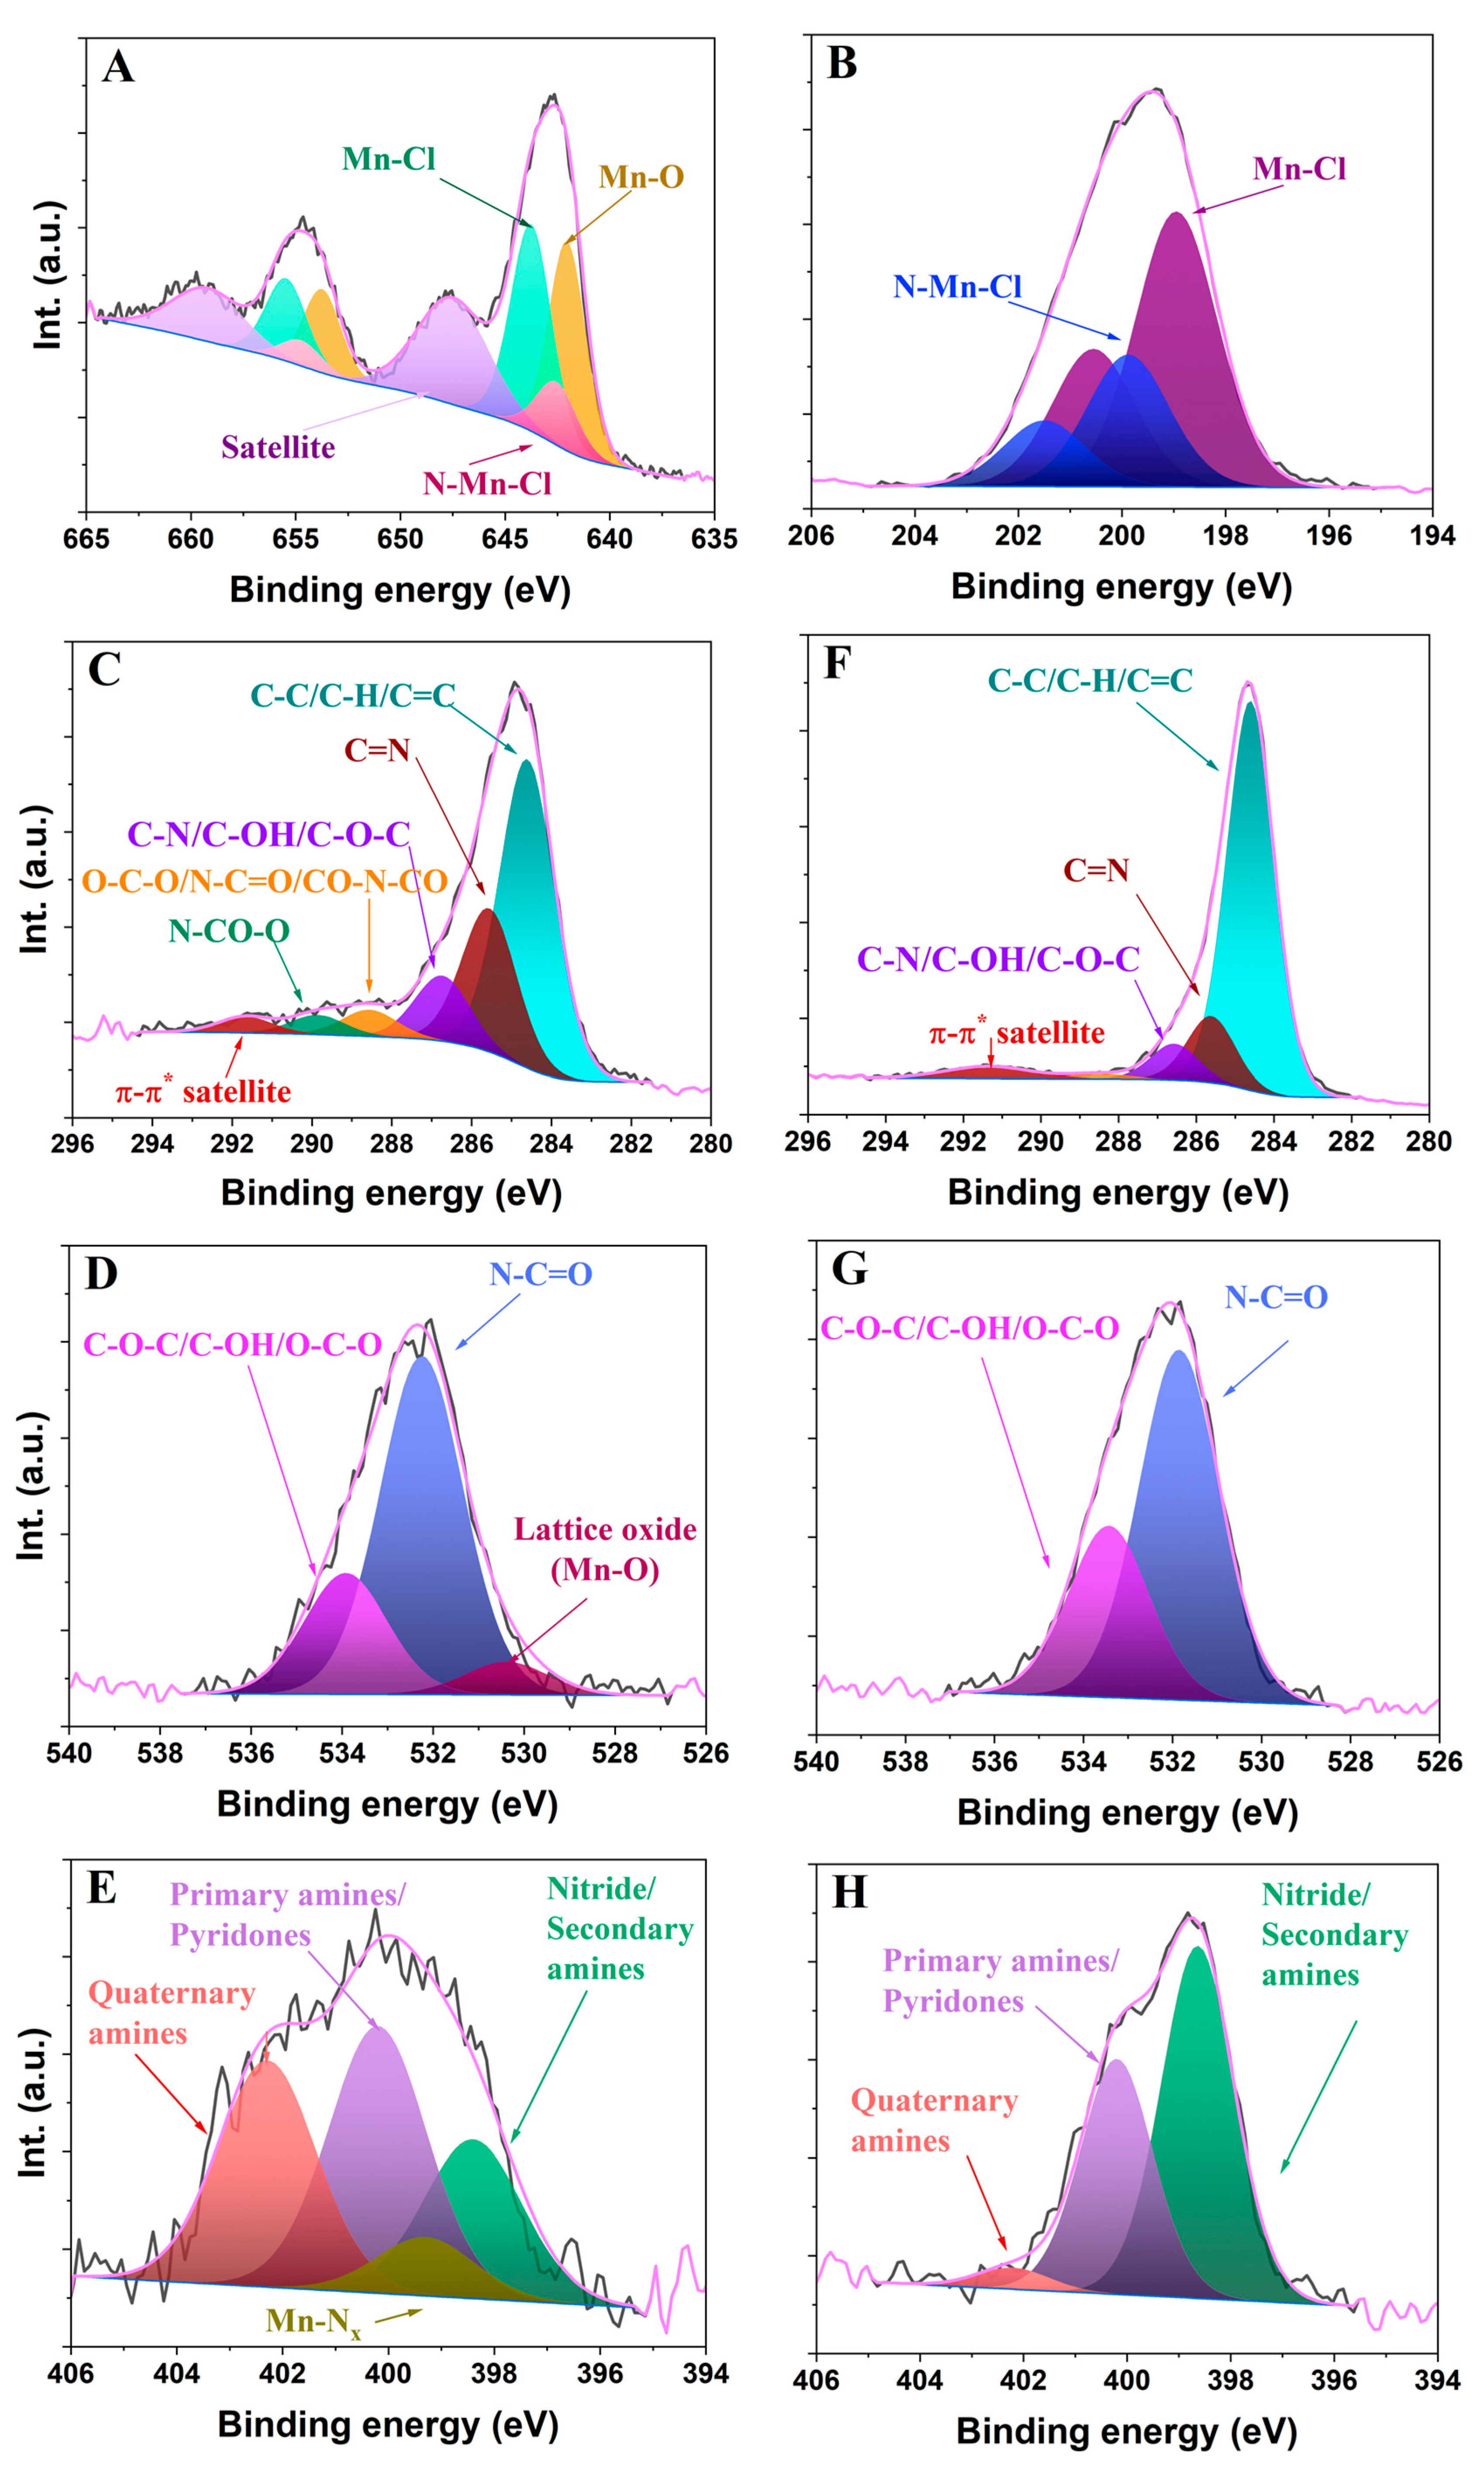
| C1s | Csp2 (284.6 eV) | C=N (285.6 eV) | C-N/ C-OH/ C-O-C (286.7 eV) | O-C-O/N-C=O/CO-N-CO (288.6 eV) | N-CO-O (289.9 eV) | π-π* (291.7 eV) |
|---|---|---|---|---|---|---|
| Mn-CNDs | 53.25 | 24.75 | 11.28 | 4.58 | 3.35 | 2.79 |
| DPH-CNDs | 74.95 | 12.74 | 6.93 | 1.24 | - | 4.14 |
| O 1s | Mn-O (530.2 eV) | N-C=O (532.1 eV) | C-O-C/C-OH/O-C-O (533.8 eV) | |||
| Mn-CNDs | 6.72 | 68.69 | 24.59 | |||
| DPH-CNDs | - | 67.11 | 32.89 | |||
| N 1s | Nitride/ Secondary amines (398.5 eV) | Mn-Nx (399.3 eV) | Primary amines/ Pyridones (400.2 eV) | Quaternary amines (402.3 eV) | ||
| Mn-CNDs | 22.36 | 8.28 | 37.52 | 31.84 | ||
| DPH-CNDs | 57.87 | - | 38.62 | 3.51 | ||
| Mn 2p | Mn-O (642.0 eV) | Mn-Cl (642.5 eV) | Mn-Nx (643.8 eV, eV) | Satellite (647.7 eV) | ||
| Mn-CNDs | 29.33 | 9.78 | 31.98 | 28.91 | ||
| DPH-CNDs | - | - | - | - | ||
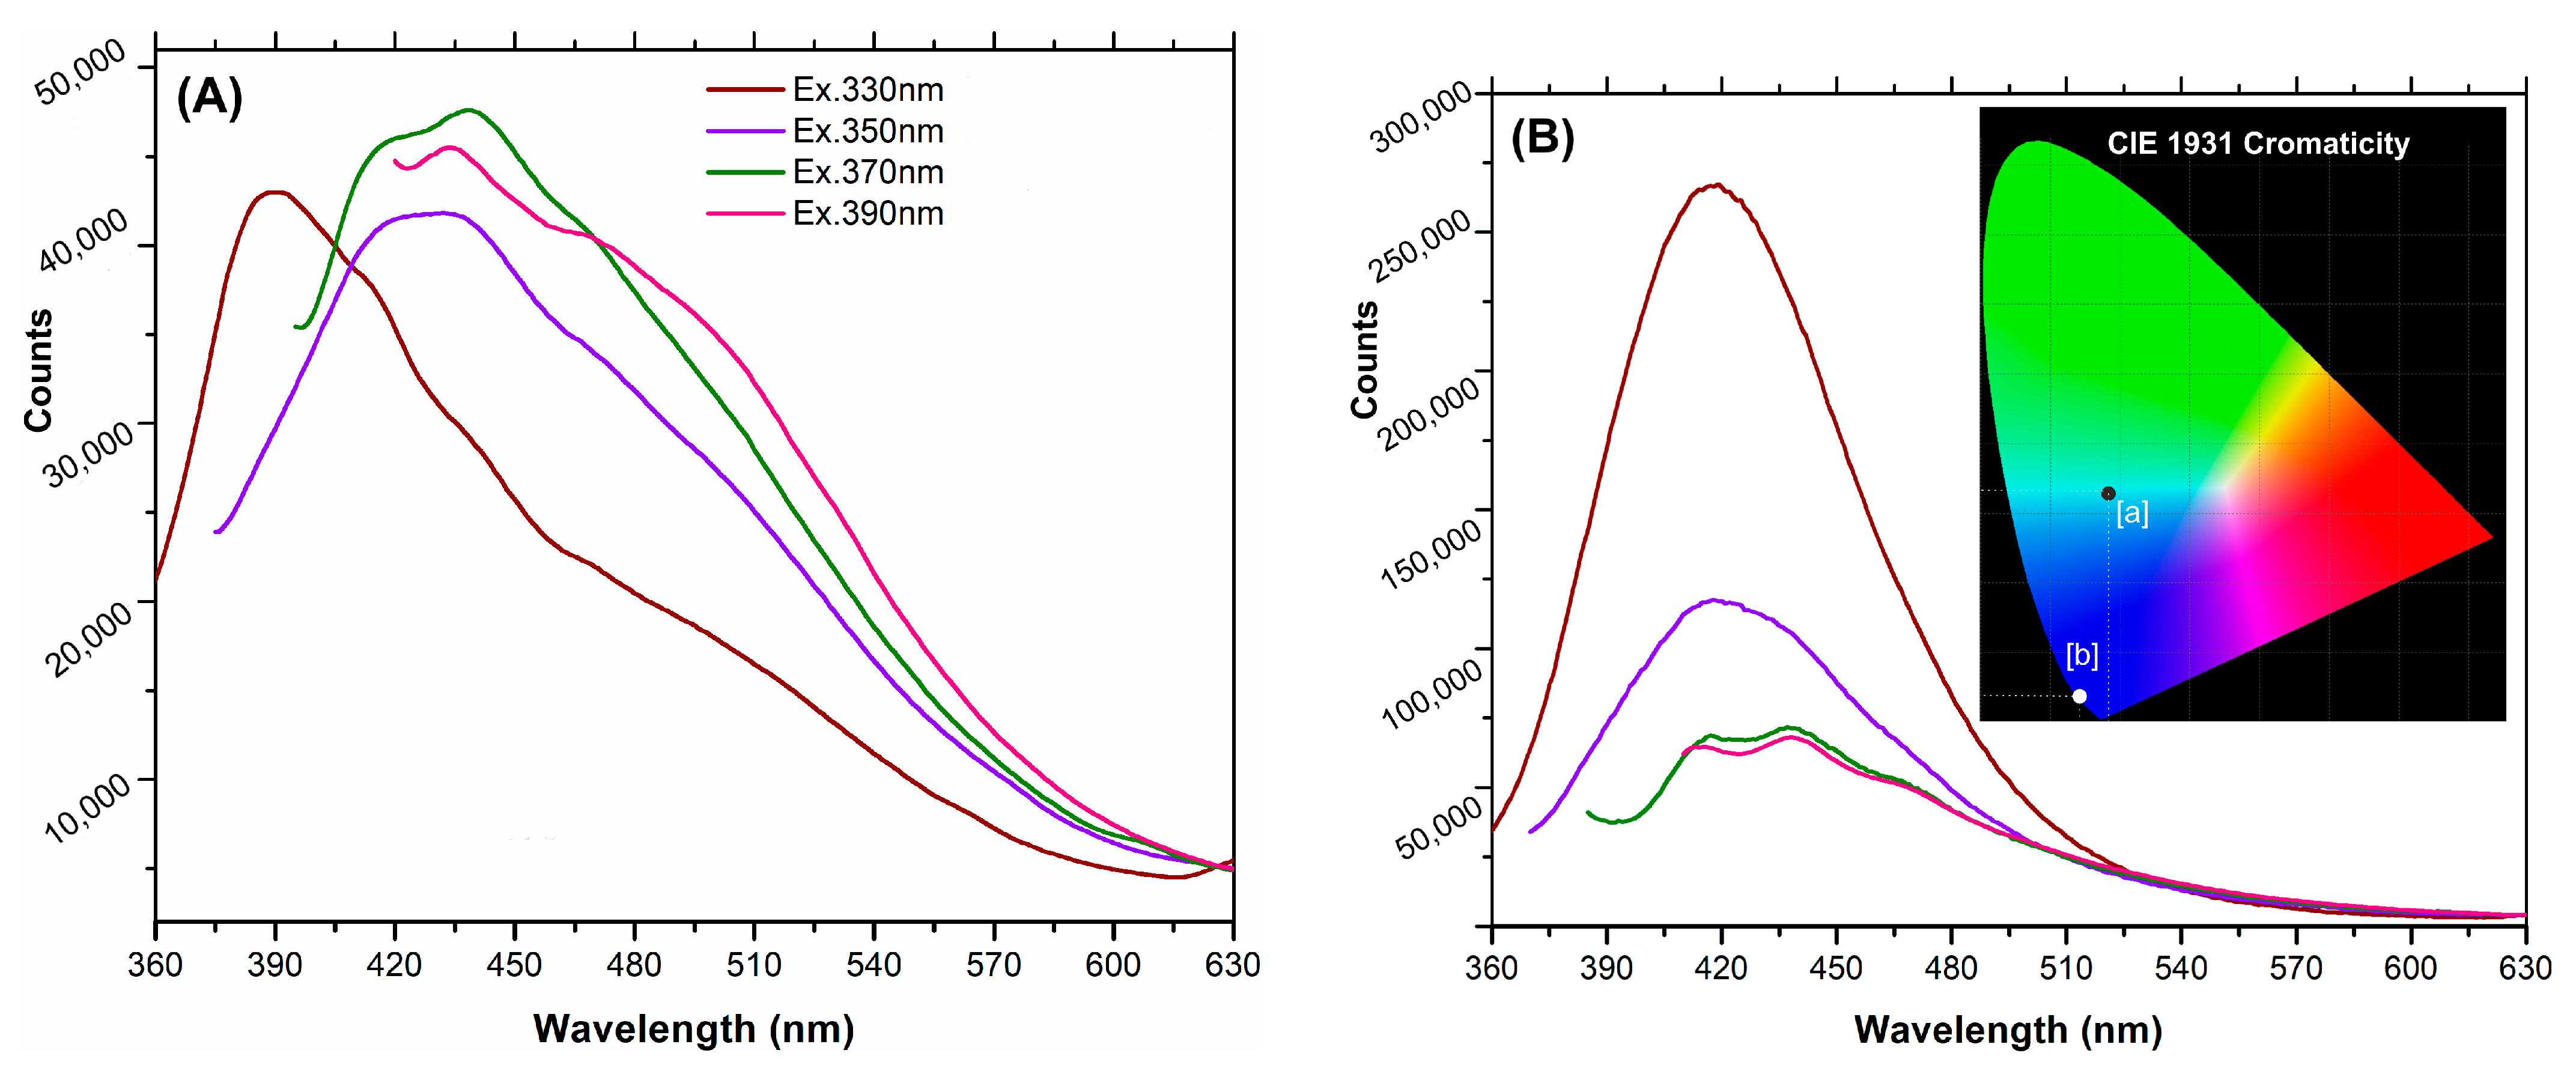
| Excitation (nm) | 330 | 350 | 370 | 390 |
|---|---|---|---|---|
| DPH-CNDs | 6.89 | 9.17 | 9.30 | 10.28 |
| Mn(II)-CNDs | 28.30 | 9.60 | 4.05 | 3.51 |
| Sample Code | τ1 (ns) | a1 (%) | τ2 (ns) | a2 (%) | τ3 (ns) | a3 (%) | <τ> (ns) | χ2 |
|---|---|---|---|---|---|---|---|---|
| Mn-CNDs–water λem = 413 nm | 12.2 | 78.5 | 4.3 | 17.4 | 0.82 | 4.1 | 11.6 | 1.05 |
| Mn-CNDs–water λem = 438 nm | 11.6 | 76.6 | 3.8 | 18.9 | 0.49 | 4.5 | 11.0 | 1.17 |
| Mn-CNDs–ethanol λem = 413 nm | 6.4 | 58.5 | 2.2 | 32.2 | 0.56 | 9.3 | 5.6 | 1.12 |
| Mn-CNDs–ethanol λem = 438 nm | 6.6 | 55.0 | 2.6 | 32.3 | 0.61 | 12.8 | 5.8 | 0.98 |
| Material | r1 [mM−1·s−1] | r2 [mM−1·s−1] | Magnetic Field (T) | Reference |
|---|---|---|---|---|
| Gadovist (Gadobutrol) (in plasma, 37 °C) | 5.2 | 6.1 | 1.5 | [68] |
| Dotarem (Gadoterate Meglumine) | 3.6 | 4.3 | 1.5 | |
| ProHance (Gadoteridol) | 4.1 | 5.0 | 1.5 | |
| Magnevist (Gadopentetate Dimeglumine) | 4.1 | 4.6 | 1.5 | |
| MultiHance (Gadobenate Dimeglumine) | 6.3 | 8.7 | 1.5 | |
| Omniscan (Gadodiamide) | 4.3 | 5.2 | 1.5 | |
| Mn carbon dots (up to 1 at. Mn) | 9.7/4.8/6.7 | 89/42/67 | 1.5 | [31] |
| Mn carbon dots (0.1 mM Mn) | 2.3 | -- | 1.5 | [47] |
| Mn2Al1-LDH | 0.6 | 17.9 | 16.4 | [69] |
| Mn0.5Mg2.6Al1-LDH | 1.2 | -- | 16.4 | [28] |
| MnFe2O4@PEGa | 0.7 | 118 | 9.4 | [70] |
| MnO | 0.5–0.1 | 1.7–0.4 | 3 | [71] |
| MnOx–SiO2 hollow@PEG | 0.8 | 27.7 | 3 | [72] |
| MnO2@PEG | 0.007 | - | 3 | [73] |
| Mn3Fe1-LDH | 0.08 | -- | 0.5 | [74] |
| MnSO4 | 3.8 | 19 | 1 | [75] |
| Mn_CP | 2.5 | 13 | 1 | [28] |
| CU_CP | 5.5 | 24 | 1 | |
| FU_CP_IE | 4 | 22 | 1 | |
| Mn(II)-CNDs | 1.0 | 21 | 1 | this work |
| Material | r1 [mL mg−1·s−1] | r2 [mL mg−1·s−1] | magnetic field (T) | reference |
| Mn-CNDs-NHF | 17.8 | 88.6 | 1 | [24] |
| Fe-CNDs-NHF | 0.2 | 48.7 | 1 | |
| Gd-CNDs-NHF | 10.0 | 22.1 | 1 | |
| Mn(II)-CNDs | 87.2 | 1541 | 1 | this work |
Disclaimer/Publisher’s Note: The statements, opinions and data contained in all publications are solely those of the individual author(s) and contributor(s) and not of MDPI and/or the editor(s). MDPI and/or the editor(s) disclaim responsibility for any injury to people or property resulting from any ideas, methods, instructions or products referred to in the content. |
© 2025 by the authors. Licensee MDPI, Basel, Switzerland. This article is an open access article distributed under the terms and conditions of the Creative Commons Attribution (CC BY) license (https://creativecommons.org/licenses/by/4.0/).
Share and Cite
Stan, C.S.; Coroaba, A.; Simionescu, N.; Uritu, C.M.; Bejan, D.; Ursu, L.E.; Dascalu, A.-I.; Doroftei, F.; Dobromir, M.; Albu, C.; et al. Mn-Doped Carbon Dots as Contrast Agents for Magnetic Resonance and Fluorescence Imaging. Int. J. Mol. Sci. 2025, 26, 6293. https://doi.org/10.3390/ijms26136293
Stan CS, Coroaba A, Simionescu N, Uritu CM, Bejan D, Ursu LE, Dascalu A-I, Doroftei F, Dobromir M, Albu C, et al. Mn-Doped Carbon Dots as Contrast Agents for Magnetic Resonance and Fluorescence Imaging. International Journal of Molecular Sciences. 2025; 26(13):6293. https://doi.org/10.3390/ijms26136293
Chicago/Turabian StyleStan, Corneliu S., Adina Coroaba, Natalia Simionescu, Cristina M. Uritu, Dana Bejan, Laura E. Ursu, Andrei-Ioan Dascalu, Florica Doroftei, Marius Dobromir, Cristina Albu, and et al. 2025. "Mn-Doped Carbon Dots as Contrast Agents for Magnetic Resonance and Fluorescence Imaging" International Journal of Molecular Sciences 26, no. 13: 6293. https://doi.org/10.3390/ijms26136293
APA StyleStan, C. S., Coroaba, A., Simionescu, N., Uritu, C. M., Bejan, D., Ursu, L. E., Dascalu, A.-I., Doroftei, F., Dobromir, M., Albu, C., & Ania, C. O. (2025). Mn-Doped Carbon Dots as Contrast Agents for Magnetic Resonance and Fluorescence Imaging. International Journal of Molecular Sciences, 26(13), 6293. https://doi.org/10.3390/ijms26136293