Article

Molecular Study from the Signaling Pathways of Four Potential asthma triggers: AKT1, MAPK13, STAT1, and TLR4

by
Lucía Cremades-Jimeno
1,
María López-Ramos
1,
Rubén Fernández-Santamaría
1,
María Ángeles De Pedro
1,
Ignacio Mahillo
2,
Cristina Rosales-Ariza
1,
José María Olaguibel
3,4,
Victoria del Pozo
1,4,
María Luisa Caballero
4,5,
Juan Alberto Luna-Porta
4,5,
Santiago Quirce
4,5,
Blanca Barroso
6,
Diana Betancor
6,
Marcela Valverde-Monge
6,
Joaquín Sastre
4,6,
Selene Baos
1 and
Blanca Cárdaba
1,4,*
1
Immunology Department, IIS-Fundación Jiménez Díaz-UAM, 28040 Madrid, Spain
2
Biostatistics and Epidemiology Unit, University Hospital Fundación Jiménez Díaz, 28040 Madrid, Spain
3
Allergology Service, University Hospital of Navarra, 31008 Pamplona, Spain
4
Ciber de Enfermedades Respiratorias (CIBERES), 28029 Madrid, Spain
5
Department of Allergy, La Paz University Hospital, IdiPAZ, 28029 Madrid, Spain
6
Allergy Department, University Hospital Fundación Jiménez Díaz, 28040 Madrid, Spain
*
Author to whom correspondence should be addressed.
Int. J. Mol. Sci. 2025, 26(13), 6240; https://doi.org/10.3390/ijms26136240
Submission received: 19 May 2025 / Revised: 17 June 2025 / Accepted: 24 June 2025 / Published: 28 June 2025
(This article belongs to the Section Molecular Pathology, Diagnostics, and Therapeutics)

Abstract

Asthma is a chronic and heterogeneous inflammatory airway disease with diverse clinical endotypes and limited curative treatment options. Recent systems biology analyses identified four potential molecular triggers—AKT1, MAPK13, STAT1, and TLR4—as candidate regulators of asthma-associated signaling pathways. This study aimed to validate the expression of these four proteins and their downstream signaling elements in peripheral blood mononuclear cells (PBMCs) from patients with allergic asthma (AA), nonallergic asthma (NA), and healthy controls (HC), to explore their potential as biomarkers or therapeutic targets. For that, PBMC samples were collected from 45 AA patients, 17 NA patients, and 15 HC subjects. Gene and protein expression of AKT1, MAPK13, STAT1, and TLR4 were quantified using RT-qPCR and Western blotting. Expression patterns were compared across groups and stratified by asthma severity. Correlations with clinical parameters (FEV1, FVC, FeNO, IgE, eosinophil counts) and treatment regimens were also assessed. All four target genes showed significantly reduced expression in asthma patients compared to controls (p < 0.001), with the most marked downregulation in NA patients. At the protein level, MAPK13 and TLR4 showed significant differential expression. Stratification by severity revealed a stepwise reduction in gene expression in AA patients, correlating with disease severity, whereas NA patients showed uniformly low expression regardless of severity. Multiple pathway-related genes, including RELA, SMAD3, NFATC1, and ALOX5, were also downregulated, particularly in NA patients. Notably, differential correlations were observed between gene expression and lung function parameters in AA vs. NA groups. In conclusion, this study supports the potential involvement of AKT1, MAPK13, STAT1, and TLR4 in asthma pathogenesis and highlights differences between allergic and nonallergic asthma at the molecular level. These proteins and their associated pathways may serve as future targets for biomarker development or endotype-specific therapies. Further studies in larger and more diverse cohorts, including functional validation, are warranted.

Graphical Abstract

1. Introduction

Highly prevalent chronic respiratory diseases, such as asthma, remain a priority healthcare challenge, despite significant progress in recent years. It is defined by the Global Initiative on Asthma (GINA) as a heterogeneous disease characterized by chronic airway inflammation [1]. Asthmatic patients have recurrent respiratory symptoms including shortness of breath, wheezing, chest tightness, coughing, and fatigue which limits expiratory airflow [2]. Generally, asthma is characterized by unpredictable attacks and exacerbations, which require continuous patient monitoring and frequent medication adjustments and changes, but in no case those treatments are curative. Clinically, asthma is associated with inflammation and a progressive decline in lung function. Allergic mechanisms have been implicated in 50–80% of asthmatic patients and in approximately 50% of severe asthmatics. This is one of the reasons why, traditionally, asthma has been associated with type 2 (T2) respiratory inflammation, characterized by elevated levels of IgE, eosinophils, and certain cytokines such as IL-4, IL-5, IL-13, and IL-9, canonically associated with allergic responses. However, not all patients present this type of inflammation. Although conventional therapies control the symptoms in a significant proportion of patients, precise diagnostic tools capable of predicting the highly heterogeneous nature of the disease, including its development, progression, severity, and adequate response to treatment, are still lacking. Advances in understanding the pathobiological mechanisms have enabled the clinical implementation of new biological therapies for the most severe cases with poorly controlled symptoms using conventional therapies. These therapies are primarily aimed at reducing type 2 inflammation (monoclonal antibodies against IgE, IL-4, IL-5, IL-13, TSLP, and the IL-5 receptor) [3,4,5]. Although the results with these biological agents are promising, there is some variability in relation to their efficacy, partly due to the high heterogeneity within T2 inflammation [6]. Besides, the nontype 2 asthma endotype (with a prevalence of neutrophilic inflammation or a neutrophil/eosinophil combination) is less characterized [7]. Therefore, no therapies with biologics against non-T2 inflammation have been developed to date. In addition, these therapies are targeted to the control of the symptoms, and the final goal of asthma treatment is to develop a disease-modifying therapy approach. This could be achieved through the development of therapies targeting specific inflammatory pathways in the pathogenesis of asthma, probably yet to be discovered [5,8,9].
The need to define new subtypes of asthma has been reclaimed for clinicians and researchers, and many different approaches could be used, as was recently summarized [10]. Clinical features, laboratory parameters, and -omic techniques are crucial in identifying asthma endotypes for better understanding of the immunological mechanism and treatment. Refining current endotypes and discovering new ones through multi-omics can improve asthma outcomes by informing treatment beyond the T2-centric focus [11].
In this context, we recently [12] defined at a molecular level three respiratory pathologies (allergic and nonallergic asthma and respiratory allergy) using systems biology, in means of mathematical models able to simulate each disease. With those models, we analyzed the ability of 94 proteins to modulate the activation of an important number of effector proteins of these pathologies. The objective of this strategy was to identify the proteins of interest whose modulation could promote the activation of the highest number of proteins involved in these three diseases, especially in asthma. With this, we described four proteins, AKT1, MAPK13, STAT1, and TLR4, that together were theoretically capable of activating a significant percentage of disease-defining proteins. These proteins were named asthma triggers, since their activation could trigger the asthmatic symptoms in allergic and nonallergic asthmatic patients. The four theoretical asthma triggers defined play essential roles in numerous cellular processes. Serine/threonine kinase 1 (AKT1) is an important regulator of cell growth, survival, and metabolism. It has been associated with airway hyperactivity, airway inflammation, and airway remodeling [13,14]. Mitogen-activated protein kinase 13 (MAPK13) is the p38δ isoform of the p38MAPK family, also called stress-activated protein kinases, that respond to inflammatory and environmental physical insults. The p38 MAPK family (α, β, γ, and δ) consists of highly conserved proline-directed serine-threonine protein kinases that are activated in response to a number of inflammatory signals, but they differ in their tissue distribution, regulation of kinase activation, and subsequent phosphorylation of downstream substrates [15]. The p38 MAPK pathway is crucial in inflammation, cell death and cell proliferation, and therefore has been implicated in many cellular events relevant to asthma pathophysiology being propose as good candidate for asthma treatment [16]. The Toll-like receptor 4 (TLR4) is a transmembrane protein receptor that is critical for proper activation of innate immunity. TLRs are induced by pathogen-associated molecular patterns (PAMPs), which are found in diverse pathogenic organisms and absent from the host [17]. TLRs are located on and within immune and nonimmune cells and are critical for initiating adaptive immune responses, playing essential roles to maintain immune homeostasis [18,19,20]. Finally, signal transducer and activator of transcription 1 (STAT1) is one of the seven members, which regulate, via the Janus Kinases (JAK)/STAT pathway, essential processes like cell proliferation, differentiation, apoptosis, and immune function in response to extracellular signals such as cytokines and growth factors [17].
Summarizing, in this study, we experimentally validated the expression of these four candidate asthma triggers and their signaling cascades in peripheral blood mononuclear cells to find experimental evidences that support the involvement of these signaling axes in asthma endotypes as a first point to further functional dissection as potential targets for endotype-specific therapeutic interventions. The final purpose is trying to define potential new therapeutic targets that could be relevant in the management of patients’ outcomes, helping the future treatment of asthma.

2. Results

2.1. Subjects

The study population was composed of 15 healthy control subjects (HC), 45 allergic asthmatic (AA) and 17 nonallergic asthmatic (NA) patients. The demographic and clinical characteristics of this population are presented in Table 1.
According to demographic characteristics, we observed a significantly higher mean age in the AA patients (48.02 ± 12 y.o; p < 0.0001) and NA patients (54.88 ± 11 y.o; p < 0.0001) than in the HC subjects (32.87 ± 10.8 y.o), without statistically significant differences between both asthma groups. The AA group had a higher presence of women (73.3%). Finally, most of the AA patients were non-smokers (55.6%), while most of the NA patients were ex-smokers (52.9%). About 11% of patients were still smokers in both asthma groups.
Patients were classified according to having AA (skin test positive and/or specific IgE against to at least one airborne allergen) or NA, patients who did not present any sensitization to aeroallergens. AA patients showed a positive skin test to pollens (36.5%), mites (29.5%), mites and pollens (2%), pet epithelial (25%), and other allergens (7%).
Both groups were also classified according to their asthma severity in mild, moderate, and severe patients defined by the Spanish Guide for Asthma Management (GEMA) [21]. While in the AA group, the ratio between the three severities was almost equal; in the NA patients the moderate diagnosis was higher (47%) than mild (29.5%) or severe (23.5%). The lung function was good in all the groups, with percentages of forced expiratory volumen in 1 s (FEV1) and forced vital capacity (FVC) above 85% without statistically significant differences between asthmatic patients and HC. As expected, the AA group presented the highest total IgE (tIgE) mean sera levels (436.71 ± 493.1 kU/L) compared to the HC (63.55 ± 94.7 kU/L; p = 0.0002) and the NA group (159.95 ± 173.2 kU/L; p = 0.04). The NA group also presented a significantly higher mean sera levels of total IgE than the HC subjects (p = 0.05). Finally, the fractional exhaled nitric oxide (FeNO) was higher in both asthma groups (38.4 ± 30.7 ppb in AA and 32.38 ± 27 ppb in NA), compared to HC (11.1 ± 5.9 ppb), but only the AA patients showed statistically significant differences compared to HC group (p = 0.006). No differences between both asthma groups were found.
Blood and sputum analyses were performed in asthmatic groups to better characterize the inflammatory profile of the patients, based on the presence of eosinophils and neutrophils. The eosinophil and neutrophil levels in peripheral blood and percentages in sputum were slightly higher in the NA patients, but without reaching statistical significance. However, the presence of eosinophils and neutrophils in sputum allowed us to classify the inflammatory profile of patients based on the predominant cell type as follows: eosinophilic (≥3% eosinophils), neutrophilic (≥70% neutrophils), mixed (≥3% eosinophils and ≥70% neutrophils), and paucigranulocytic (<3% eosinophils and <70% neutrophils). In both groups, the paucigranulocytic and eosinophilic were the predominant profiles, with similar percentages, while the neutrophilic profile was observed in a higher percentage of patients in the NA group (17.6% vs. 4.4% in AA). Sputum and blood eosinophils and neutrophils did not show any correlation in any of the groups.
Finally, according to the asthma treatment, most of the patients (>90%) were treated with inhaled corticosteroids and long-acting β2-agonists, and almost half of them were also treated with short-acting bronchodilators. Also, approximately 30% of AA patients received some form of specific immunotherapy. A total of 17.6% of NA patients were also receiving some form of biological treatment, higher in AA patients (40%), specifically, omalizumab or mepolizumab.

2.2. The Four Potential Gene Triggers Show Different Gene and Protein Expression in Asthma Patients than in the Healthy Subjects

Gene and protein expression of the four potential asthma triggers, AKT1, MAPK13, STAT1, and TLR4, was analyzed in PBMC samples obtained from AA, NA, and HC (Figure 1).
At the gene level, both asthmatic patient groups showed a statistically significant decrease in the expression of all genes (p < 0.001) compared to the HC healthy control group (Figure 1A). Furthermore, in all genes the expression was lower in the NA than in the AA group, these differences being statistically significant in AKT1 (NA = 0.067, AA = 0.154; p = 0.008), MAPK13 (NA = 0.095, AA = 0.177; p = 0.021), and STAT1 (NA = 0.051, AA = 0.117; p = 0.007), but without reaching the statistical signification in TLR4 (NA = 0.036, AA = 0.072; p = 0.06).
Minor differences were observed in the protein expression (Figure 1(Bi)). From the representative image of the profile observed for each protein (Figure 1(Bii)) in the Western blot, one faint 63 kDa band in AKT1 was observed; two 52 and 43 kDa bands in MAPK13; two 130 and 95 kDa in STAT1; and one 100 kDa band in TLR4. The expression of these proteins was very heterogeneous between the different subjects.
Firstly, a statistically significant decrease was found in the lower band of MAPK13 in HC (RI = 0.037), compared to asthmatic patients (AA RI = 0.103 and p = 0.01; NA RI = 0.099 and p = 0.01). On the other hand, TLR4 showed a significantly higher expression in the NA than in the AA group (AA RI = 0.364 and NA RI =0.765, p = 0.02). It is worth highlighting the different behavior of the two strips detected in MAPK13, where the upper seems to have a higher expression in the HC, while the lower band shows a higher expression in the asthmatic patients. Regarding AKT1, a slight increase in protein expression was observed in the NA group compared to HC and AA patients. In STAT1, the lower band also shows this behavior, but in the upper band, on the contrary, the highest expression was observed in HC.

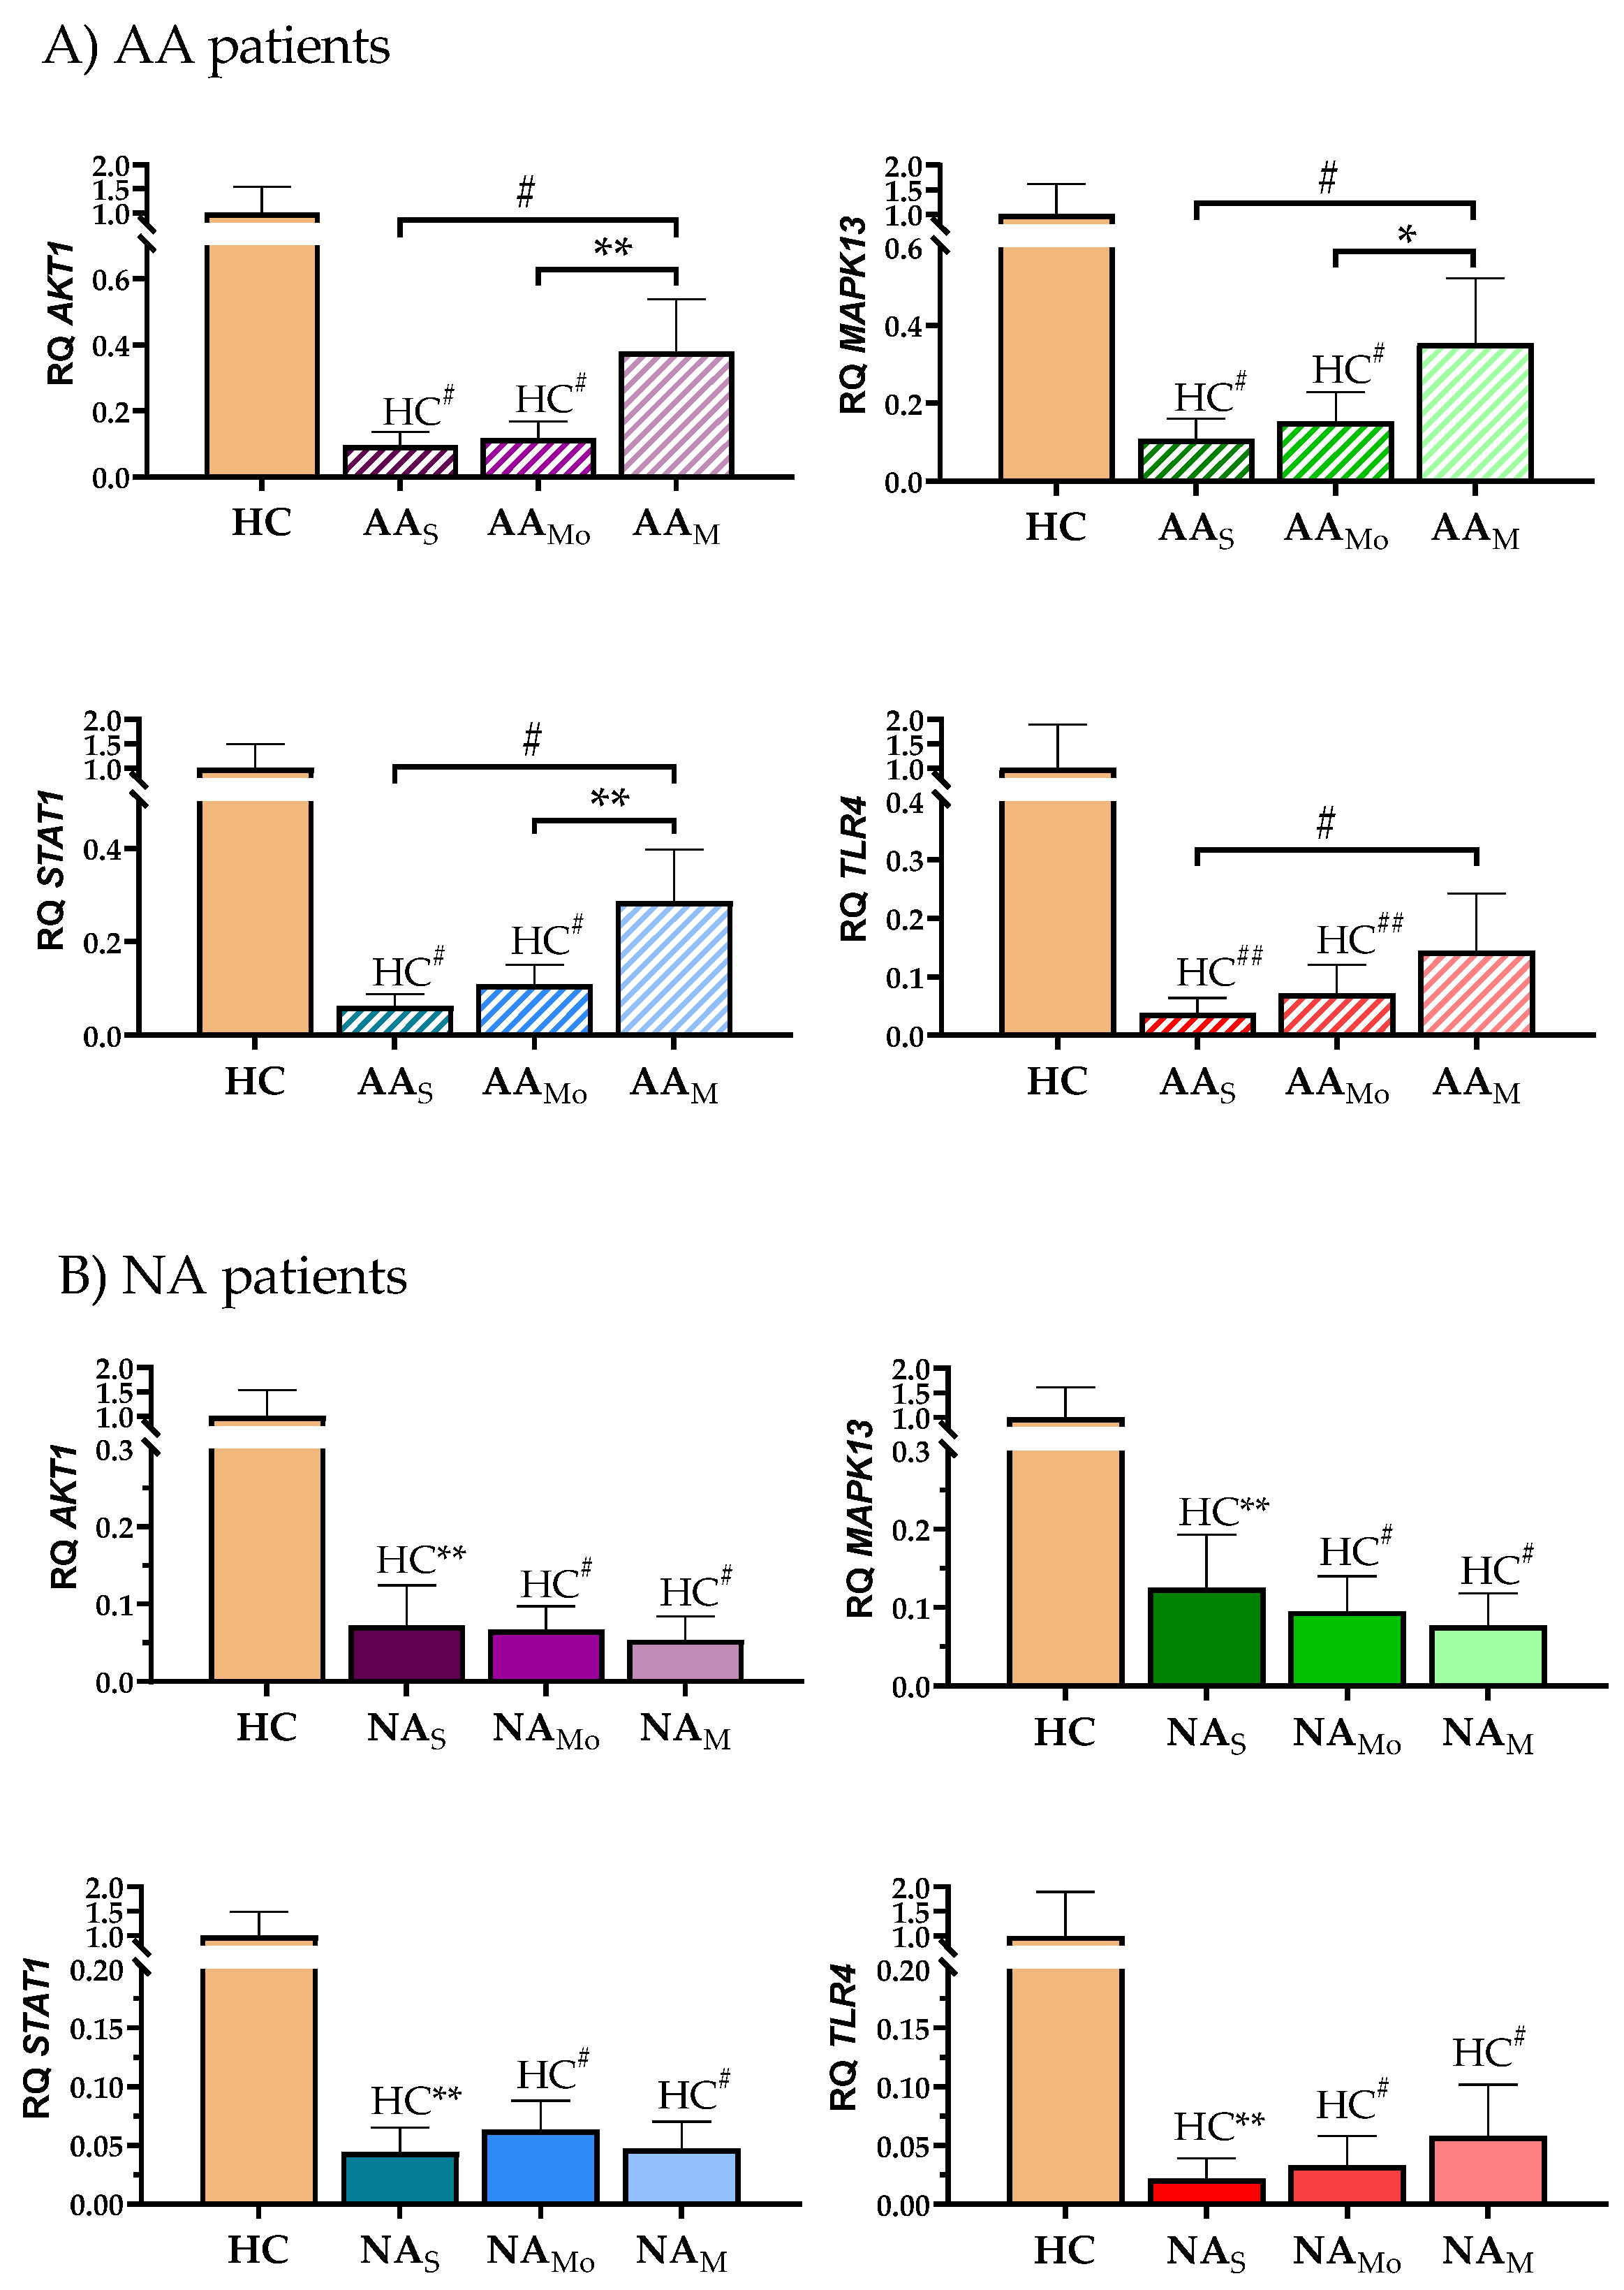
2.3. A Deeper Analysis Showed Differences in the Results Obtained for Each Clinical Group When Patients Were Segregated by Severity

We analyzed the gene expression of the four triggers by segregating asthma patients according to their severity (Figure 2). In the AA group, the lowest gene expression of the four genes was shown in severe patients and it increased as the severity was reduced (Figure 2A). These differences were statistically significant when HC subjects were compared with severe or moderate, but not with mild patients. In AA group, we also observed differences between severities. Interestingly, AKT1, MAPK13, and STAT1 gene expression showed a similar behavior, with statistically significant differences between the results obtained in the mild patients and the moderate and severe patients, but in TLR4 only severe and mild patients showed significant differences. By contrast, in the NA group all the severity subgroups showed a significant decrease in the expression of the four studied genes compared with the HC subjects. No differences between severities were observed (Figure 2B).

2.4. The Expression of the Four Potential Triggers Showed a Good Gene Correlation Between Them, but Worse at a Protein Level, with Differences Among Clinical Groups

Correlation between the expression of the four potential asthma triggers was assessed. The results (Table 2) showed good correlations among the gene expression of the four triggers in all the groups of the study, AKT1 and MAPK13 being the best correlated in HC group (Rs = 0.97; p < 0.001) and AKT1 and STAT1 in AA and NA patients (Rs = 0.92; p < 0.001 and Rs = 0.94; p < 0.001, respectively). TLR4 was the gene that showed the lower correlation with the rest of the genes in all the groups. However, according to protein expression, few statistically significant correlations were found, TLR4 being the protein that showed the highest correlations: with AKT1 in HC (Rs = 0.89; p = 0.001), with STAT1 in AA (Rs = 0.84; p < 0.001), and inversely with MAPK13 in NA (Rs = −0.62; p = 0.05).

2.5. The Four Potential Triggers Showed Different Correlation with Lung Functional Parameters Depending of the Group Studied

To determine the clinical implication of these four asthma triggers, a correlation analysis between their expression and clinical parameters (peripheral eosinophils/mL, Feno, tIgE levels, and lung function) was performed (Table 3). This analysis showed different correlations in AA than NA, drawing attention how even the direction of the correlations was different in both groups: while in AA all the correlations were negative, in NA all were positive, except for the peripheral blood eosinophils that showed the opposite behavior. Specifically, at a protein level the AA group showed the most significant negative correlations with the protein expression of STAT1 (with FEV1) and TLR4 (with FEV1 and FVC). At a gene level, we observed correlations between MAPK13 and STAT1 expression and FEV1 and FVC; and between TLR4 expression and the ratio FEV1/FVC. In contrast, NA patients showed the best positive correlations with protein expression of TLR4 (with FEV1 and FVC), and STAT1 expression with FVC. At a gene level, MAPK13 expression showed correlation with the ratio FEV/FVC and STAT1 expression correlated with FVC. Peripheral blood eosinophils correlated positively with STAT1 gene expression in AA and negatively with STAT1 protein expression in NA. The rest of the clinical parameters did not show statistically significant results.

2.6. Analysis of the Signaling Pathways of the Triggers Proteins Show a Significant Gene Expression Decrease in Asthma Groups Compared to HC Subjects

Our next step was the analysis of the gene expression of the main elements defined in the theoretical signaling pathways of each of the four asthma triggers, according to previous results [12], to experimentally corroborate their involvement in those pathways. From the 29 genes studied (detailed in Material and Methods), five, CCL11, CCL17, IL12B, IL17B, and MUC5B, were not detected in the samples analyzed. The remaining 24 genes were grouped by pathway and by their theoretical assignment as previously established (link nodes or mechanistic proteins). Table 4 shows the differential gene expression of those specific genes defined in endotype-specific pathways (AA or NA) in whole groups and severity subgroups, compared to HC.
Both asthma groups showed a statistically significant decrease in all the genes analyzed compared to HC subjects, as happened with the asthma triggers. However, the analysis according to asthma severity showed a different behavior in the expression of these genes depending on the asthma phenotype. In AA patients, the gene expression differences with HC decreased in the less severe phenotypes of the disease to the point that in the comparison between mild AA patients and HC subjects, only IL13RA1 showed statistically significant differences (Table 4A). In contrast, the NA patients showed very similar gene expression in all the severity subgroups compared with HC subjects (Table 4B): statistically significant differences in all genes except CXCL8 in the three severity subgroups, and CDH1 and TLR5 in severe patients.
The expression of these genes was also compared between the different severities within each asthma group. While the differential gene expression between the severity of NA subgroups did not show any statistically significant result, in AA group all genes showed statistically significant differences between mild and severe patients, fewer genes between mild and moderate patients (AKT1 (adjusted p = 0.005), RELA (adjusted p = 0.006), MAPK13 (adjusted p = 0.02), NFATC1 (adjusted p = 0.002), STAT1 (adjusted p = 0.002), CCL5 (adjusted p = 0.004), SMAD3 (adjusted p = 0.008), and in the four genes of the proteins with implication in the mechanisms: IL4R (adjusted p =0.004), ALOX5 (adjusted p = 0.005), BAX (adjusted p = 0.003), and TGFB1 (adjusted p = 0.03). No gene showed significant differences between moderate and severe patients. This highlights the different behavior of these genes in both asthma endotypes.

2.7. NA Patients Have Lower Gene Expression than AA Patients on the Common Genes to Both Signaling Pathways

The differences in gene expression between AA vs. NA of those common genes in the signaling pathways were analyzed. This was done in total groups and after segregating the patients by asthma severity. Firstly, all genes showed a lower expression in the NA group, this decrease being statistically significant in all genes except TLR4 (Table 5). However, when both groups were analyzed according to patients’ severity, no significant differences were observed in either severe or moderate subgroups, but in mild patients all genes except TLR2 and TLR4 were significantly decreased in the NA group (adjusted p = 0.003 for AKT1, RELA, STAT1 and ALOX5; adjusted p = 0.004 for SMAD3 and NFATC1; adjusted p = 0.005 for MAPK13).

3. Discussion

Asthma is a chronic disease caused by an imbalance in the immune system, characterized by inflammation, remodeling, and airway hyperreactivity, resulting from a complex, variable network of molecules that differ within each patient and between patients. Certain networks are repetitive among asthma patients and link to clinical expression, gene–environment interaction, and inflammatory cell profiles, offering new diagnostic and therapeutic strategies for specific endotypes. Besides, emerging evidence indicates that asthma pathogenesis may involve both airway inflammation and inflammation-independent mechanisms [22,23,24,25,26]. Unraveling the molecular mechanisms underlying requires multiple efforts and has been the challenge of many researchers for years [11,17]. Cell signaling pathways are crucial in inflammatory diseases playing a central role in intercellular communication. -Omics technology and bioinformatic advances enable pathway delineation, and the present work is an example. Here, we have analyzed theoretical signaling pathways related to four asthma trigger proteins, AKT1, MAPK13, STAT1, and TLR4, defined by previous systems biology study as proteins able to modify the activation of many effector proteins of respiratory diseases [12]. The final purpose of this work was to confirm the deregulation of these pathways in asthma disease and to define new targets that could be relevant as a starting point to future treatments.
All the four potential asthma triggers studied have an essential role in numerous cellular processes. AKT1 is involved in cell proliferation, differentiation, and survival by signal transduction through the PI3K/Akt/mTOR axis [13,27]. MAPK13 integrates various signals and regulates several cellular processes such as proliferation, differentiation, transcription regulation, and development. It can be activated by inflammatory cytokines and cellular stress. The MAPKs signaling pathway is crucial for immune response and is targeted in treatments for inflammatory disorders [15,16]. However, the role of p38MAPK usually is studied as global protein family, and the δ isoform is one of the 4 isoforms with less specific information. MAPK13 has been linked to cytokine production, cell migration, inflammasome activation, and T cell activation at the immune level [28,29]. STAT1 is a transcription factor that has been classically implicated in the Th1 inflammatory response due to its role in the response to IFNγ [30,31]. STAT1 activation has been implicated in the pathogenesis of allergic diseases [32,33]. Very recently it has been described that IL-9 induction was restrained by IFN-γ/STAT1 and IL-10, pointing to a new role of this pathway in the modulation of asthma disease [34].
Finally, TLR4 is a transmembrane receptor of the TLR family, with a fundamental role in immune response to extracellular stimuli [35,36], classically involved in the Th2 response, although under certain conditions, it can induce the Th1 response [37]. To maintain immune homeostasis, the activation of innate immune cells requires TLR signaling molecules. The strength of TLR signaling does determine the occurrence of allergic reactions or its absence. Strong TLR signals are protective against allergic airway disease, while low airway amounts of TLR ligands cause airway sensitization and Th2-type immunity [18,19,20]. In bronchial asthma, it was shown that TLR4 activation of macrophages produces cytokines that affect immune Th1/Th2 balance [38].
The activation pathways of these four proteins are closely related, with TLR4 as a central element in the regulation of the rest of triggers. Its activation and subsequent binding to different adaptors, such as MyD88 or TRIFF, promote the activation of the PI3K/AKT axis, as well as the p38MAPK pathway, with multiple effects on immune response [39,40,41]. Within the p38MAPK pathway, it has been shown that the inhibition of p38γ and δ leads to an absence of response to lipopolysaccharides (LPS), a molecule typically related to TLR4 signaling [42]. There is also a relationship between the activation of TLR4 and STAT1, dependent and independent of IFNγ signaling [43,44]. This cytokine has also been linked to STAT1 activation through the PI3K/AKT axis [45]. In view of this, it is expected that variations in these proteins jointly affect the development of asthma, although their concrete implication in asthma has never been addressed. Independently, AKT1 has been linked to the Th2 response in vivo and in vitro models [46,47], as well as to the response to treatments [48,49], although there are discrepancies regarding its involvement in airway inflammation [50,51]. Regarding STAT1, attempts have been made to analyze its influence on desensitization to ICS without obtaining conclusive results [52,53]. Multiple evidences suggest that toll-like receptors may be associated with the atypical stimulation of immune responses, contributing to the chronic inflammation seen in asthma. TLRs can affect epithelial and immune cell function in asthma. Of note, TLR4 is essential for Th17-driven neutrophilic airway inflammation and neutrophil recruitment [54,55]. Numerous authors have linked TLR4 to allergic sensitization and asthma, both by promoting and reducing the inflammatory response [48,56,57], and its increase in the airways of asthmatic patients has been linked to a worse prognosis [58].
Based on this information, it is not surprising that these proteins were related to molecular motifs involved in immune system related to asthma and that their combined trigger potential was defined by systems biology [12]. Therefore, in this work these triggers were analyzed in PBMCs from asthmatic patients and healthy subjects. First, the gene and protein expression of these four proteins were analyzed (Figure 1). Patients with asthma showed significantly lower gene expression compared to healthy controls. The gene decrease was more pronounced in NA patients compared to AA patients, with significant differences between both groups except for TLR4. Also, the relationship with severity was analyzed segregating the patients according to their asthma severity (Figure 2). The severe AA patients showed the lowest gene expression of the four genes, although all the severity subgroups showed gene decrease compared to the HC subjects. These differences were statistically significant when HC subjects were compared to severe or moderate patients, but not with mild patients (Figure 2A). There were also differences between severities. AKT1, MAPK13, and STAT1 were significantly decreased in moderate and severe patients compared to mild patients. TLR4 was significantly decreased in the severe patients compared to mild patients. However, the NA patients showed a significant decrease in the expression of the four studied genes in all the severity subgroups, compared with the HC subjects, and no differences between severities were observed (Figure 2B). However, at protein level only MAPK13 and TLR4 showed statistically significant differences among groups. In contrast, the protein expression of AKT1 was very similar in all groups, with a slight increase observed in the NA group, and STAT1 showed reduced protein levels in asthmatic patients, but without statistically significant differences, contrasting with previous observations [59]. Some works had related the expression of this gene in response to viral infections, an asthma trigger in some nonallergic patients [60,61], which could explain these results. Regarding MAPK13, two bands were detected by Western blot (Figure 1) that did not show the same behavior, so it would be of great interest to delve deeper into the possible post-translational modifications of this protein and its function in asthma. The lower band was the only protein with significantly higher expression in asthma patients compared to healthy subjects. This aligns with MAPK13’s known role in inflammatory mechanisms. However, this different behavior of gene and protein expression suggests a complex control of this signaling pathway. Methylation is one potential regulatory mechanism for this gene, as observed by other groups [62,63].
Finally, TLR4 showed the highest protein expression in NA patients, being significantly higher than that observed in AA patients. The expression of TLR4 was lower in monocytes and dendritic cells, but not in CD4+ T cells, of asthmatic patients who had been previously defined [64]. In addition, the regulation of TLR4 activation is strictly controlled by internalization mechanisms, and abnormal trafficking of this protein has already been linked to different diseases [65,66]. Therefore, in-depth studies of its expression in different cell types, as well as its activation, are necessary to understand the role of TLR4 in asthma.
Having in mind the relationship that these four proteins have, gene and protein correlation analysis between them was performed, corroborating this relationship (Table 2). There were statistically significant correlations among the gene expression of the four triggering in all the groups of the study, AKT1 and MAPK13 being the best correlated in HC group, and AKT1 and STAT1 in asthmatic patients. However, according to protein correlations, few statistically significant correlations were found, TLR4 being the protein that showed the highest correlations with AKT1 in HC, with STAT1 in AA, and with MAPK13 in NA, this last one being a negative correlation.
Finally, to determine the clinical associations of these four asthma triggers, a correlation analysis between their gene/protein expression and clinical parameters was performed. Results of the lung functional analysis showed different correlations in AA and NA (Table 3); remarkably, in AA all the correlations found were negative, which means that the lowest lung function comes with the highest ΔCt and protein expression, while in NA the correlations were positive. These results could not strongly demonstrate the involvement of these triggers in lung function, because the significant correlations with functional parameters were weak in many cases but highlight the possible different functions of these proteins in the different inflammation stages of asthmatic patients.
Searching for a possible explanation of these results, we analyzed the relationship of the gene and protein expression of the four asthma triggers and medications taken (Supplementary Figures S1 and S2). We found higher differences among patients with and without treatment in the gene expression than in the protein expression. Specifically, AKT1, MAPK13, and STAT1 gene expression were significantly decreased in patients taking long-acting β-antagonists (LABA). It was previously described that LABAs and p38MAPK inhibitors reverse the corticosteroid insensitivity of IL-8 in airway smooth muscle cells of COPD [67]. TLR4 gene expression was decreased in patients using bronchodilators and biologics (Omalizumab and Mepalizumab). In contrast, specific immunotherapy increased the gene-expression of the four asthma triggers. According to protein expression, patients taking biologics (Omalizumab and Mepalizumab) showed STAT1 expression significantly decreased and TLR4 expression significantly increased. Allergen-specific immunotherapy (AIT), in contrast, significantly decreased TLR4 protein expression. There is scarce information from the relationship of these proteins and treatments, but it recently has been demonstrated in an allergic asthma rat model the role of AIT inhibiting the HMGB1/TLR4/NF-κB signaling, in agreement with our data [68]. Those data must be confirmed but point to different molecular mechanisms underlying the different treatment response and underscore the relevance of keeping in mind the treatment of the patients in molecular studies.
To conclude, the gene expression of the proteins involved in the signaling pathways of the four asthma trigger proteins was analyzed (Table 4), finding a decrease of all of them in both asthma groups compared to HC, and in those elements common to the signaling pathways defined for AA and NA (RELA; SMAD3; NFATC1, TLR2 and ALOX5), this decrease was greater in the NA patient group (Table 5), in line with what was observed in the four triggers (Table 1). Curiously, in mild AA patients, a tendency to normalize these values was observed, which did not occur in NA patients. Of these common elements, some stand out, such as RELA or NF-kB subunit, a master transcriptional regulator of the committed epithelial–mesenchymal transition in airway epithelial cells [69]; SMAD3, a protein that functions in the transforming growth factor-beta signaling pathway and transmits signals from the cell surface to the nucleus, regulating gene activity and cell proliferation [70]; or NFATC1 or nuclear factor of activated T cells, a critical transcription factor for immune regulation with an essential role in T and myeloid cells [71]. It should be noted that the effector protein of the four pathways common to both asthma phenotypes, ALOX5 or 5-lipooxygenase (5-LO), an enzyme that uses Arachidonic Acid to synthesize Leukotrines (LTs), which induce airway spam, barely showed differences between the two asthma groups in severe and moderate patients but did in mild patients. This lipoxygenase has previously been related to asthma, mainly, to the response to treatment of patients [72,73] and could be an interesting potential therapeutic target in the treatment of asthma, allergic and nonallergic.
This study has several limitations, as the number of NA patients recruited that made it difficult to extrapolate solid conclusions, mainly when the patients were segregated by severities. Also, NA patients showed a statistically significantly higher BMI than healthy control subjects (27.5 ± 4.8 vs. 23.6 ± 1.3; p < 0.05), but were not classified as obese based on BMI (25.0–29.9). There is an interesting asthma phenotype, obesity-associated asthma, whose study has shown specific molecular characteristics, as recently described [74,75]. Although our patients did not present obesity, overweight could be related to molecular changes that should be investigated further in relation to the objectives of our study. Also, we have studied PBMCs, a mix of cells, and this could be a limitation for having clear conclusions. Studies with sorter populations and epigenetic analyses are needed.
Thus, a bigger study population and longitudinal or functional validation of findings is mandatory to clarify the results obtained in this study, mainly from NA patients. Further, the results shown here are related to peripheral and immune information, so a study of the relevance of these triggers in the lung (as target-organ of asthma) is essential, as their role could be different in this organ. Overall, our results show a decrease in the gene expression of the four asthma triggers studied and the molecules involved in their signaling pathways. This unexpected result must be validated in functional assays (increasing/decreasing our targets) for understanding how this gene decrease is associated with functional aspects of asthma disease and trying to find key elements not delimitated in the present study.
In conclusion, this work is to our knowledge the first assessing the expression of these four asthma triggers in combination and trying to find potential therapeutic targets. Overall, our results highlight the importance of these pathways in asthma, highlighting several common molecular elements (RELA, SMAD3, NFATC1, TLR2, and ALOX5) that were downregulated in AA and NA in the most severe phenotypes, opening possibilities in the search of new treatments useful for all asthmatic patients. These findings provide molecular evidence that position AKT1, MAPK13, STAT1, and TLR4 as central nodes in the pathophysiology of asthma, justifying future functional studies to delimitate their specific roles and attempt new therapeutic interventions.

4. Materials and Methods

4.1. Study Design: Subjects

The study population comprised 62 unrelated asthmatic patients, 45 with allergic asthma (AA) and 17 with nonallergic asthma (NA), who followed the selection criteria: aged 18–75 years and diagnosed with asthma at least 1 year before inclusion. The samples were selected from the biobank of the cohort from the MEGA [76] project. Subjects were diagnosed in the allergy and pulmonology departments of the Fundación Jiménez Díaz Hospital in Madrid, and in the allergy departments of La Paz Hospital in Madrid, and Complejo Hospitalario de Navarra in Pamplona. Samples were processed in each hospital. As a control group, 15 healthy subjects (HC) were recruited in the allergy departments of Fundación Jiménez Díaz Hospital in Madrid, Policlinic Hospital in Seville, and San Cecilio University Hospital in Granada, Spain; and samples were processed in the immunology department of the Health Research Institute-Fundación Jiménez Díaz-UAM (IIS-FJD-UAM) in Madrid.
For all subjects, tests of pulmonary function were carried out by determining the predicted percentage of forced vital capacity (%FVC) and the forced expiratory volume in 1 s (%FEV1). AA patients were asthmatic and sensitized to at least one airborne allergen, while NA patients were diagnosed with asthma disease but had a negative skin prick test. In both groups, the asthma severity was diagnosed as severe, moderate, or mild according to the Spanish Guidelines for the Management of Asthma (GEMA) [21]. The HC group was made up of healthy subjects with no history of respiratory diseases or allergic symptoms, and were negative to skin prick test against a panel of common allergens, including mites (Dermatophagoides pteronyssinus, Dermatophagoides farinae, and Lepidoglyphus destructor), epithelia (cat and dog), cockroaches (Blatella orientalis and Blatella germanica), pollens (Cypress, banana shadow, olive, mixture of grasses, Artemisia, Parietaria, and Salsola), and fungi (Alternaria, Cladosporium, Aspergillus, and Penicillium).
Written informed consent was obtained from each subject in accordance with the Declaration of Helsinki. Ethical approval for the study was obtained from the research ethics committee of the IIS-FJD-UAM.

4.2. Isolation of Peripheral Blood Mononuclear Cells, RNA, and Protein Extraction

Peripheral blood samples (PBMCs) were obtained from all the subjects included in the study. PBMCs were isolated from heparinized blood by gradient centrifugation using Lymphoprep (Comercial Rafer, Zaragoza, Spain) following the manufacturer’s instructions, under sterile conditions using endotoxin-free reagents. RNA and protein were extracted from PBMCs (106 cells) using the trizol method (TRItidy G, PanReac AppliChem, Darmstadt, Germany), following the manufacturers’ instructions. RNA quantification and purity (A260/A280 > 1.7) was checked by spectrophotometry using a spectrophotometer (Nanodrop ND-1000, Bonsái Technologies Group, Madrid, Spain), while protein was quantified with the Pierce BCA Protein Assay Kit (ThermoFisher Scientific, Waltham, MA, USA), following the manufacturer instructions.

4.3. Gene Selection and Differential Expression Analysis by RT-qPCR

A total of 29 genes were selected according to previous results of our group, based on their classification within the signaling pathways of the four theoretically defined asthma triggers (Table 6). Thus, the four triggers were studied, AKT1, MAPK13, STAT1, and TLR4, along with genes classified as mechanistic in at least one asthma endotype (ALOX5, BAX, CCL5, CCL11, IL4R, IL17A, MUC5B, PTGER2, TGFB1) and link nodes between both groups of genes (CCL17, CDH1, COL5A1, CXCR3, IL8, IL10, IL12A, IL12B, IL13RA1, MMP9, NFATC1, RELA, SMAD3, TLR2, TLR5, VCAN). The 18S gene expression was used as endogenous control.
Gene expression was analyzed in the Scientific Park of Cantoblanco (Madrid, Spain) by quantitative real-time PCR, using TaqMan Gene Expression System (Applied Biosystems, Foster City, CA, USA) in 384-well microfluidic cards. Briefly, 1.5 µg of RNA from each subject were converted to cDNA trough reverse transcription, using “High-capacity RNA to cDNA kit” (Applied Biosystems). Then, real time PCR was performed using Taqman Gene Expression and the HT7900 System (Applied Biosystems) with 40 amplification cycles. The results were analyzed with the SDS software v2.3 (Applied Biosystems, Foster City, CA, USA). Gene expression of the 29 selected genes was analyzed in duplicates, and expression of 18S gene was used as a reference, using the Thermofisher Scientific predesigned TaqMan Gene expression assays indicated in Table 6.
Finally, Relative Quantification (RQ) values were calculated according to the cycle threshold (Ct) method, with the gene expression represented as 2−ΔΔCt, where ΔΔCt = (ΔCtclinical group) − (ΔCtcontrol group) and ΔCt = (Ctstudy gene) − (Ct18S).

4.4. Differential Protein Expression Analysis by Western Blot

Protein expression was analyzed by Western blot using the Invitrogen Western Breeze® Chemiluminescent Western Blot Immunodetection Kit (Life Technologies, Carlsbad, CA, USA) as previously described [77]. The primary antibodies and conditions used to detect the four triggering proteins were the mouse IgG anti-human AKT1 or TLR4 (diluted 1:200 and 1:500, respectively) paired with the HRP-coupled secondary antibody m-IgG Fc (1:2500 and 1:5000, respectively) from Santa Cruz Biotechnology; and the rabbit IgG anti-human MAPK13 or STAT1 (both diluted 1:1000) from Cell Signaling and Thermo Fisher, respectively, paired with the ready to use anti-rabbit secondary antibody from the Invitrogen kit coupled with the AP enzyme. The visualization was performed using chemiluminescent specific substrates and the ImageQuant LAS 4000 luminescent image analyzer (GE Healthcare Life Science, Little Chalfont, Buckinghamshire, UK). Quantification results of specific protein bands were relativized to rabbit IgG anti-human β-Actin (dilution 1:1000; Cell Signaling) expression, through the equation RI (relative intensity) = specific protein intensity/b-actin protein intensity.

4.5. Statistical Analysis

Multiple comparisons for the differential gene expression analysis were performed, using the R program, with the obtained ΔCt values. Thus, gene expression was compared between clinical groups and severity subgroups through the ANOVA test for multiple comparisons, using Benjamini–Hochberg for posterior corrections. Also, simple comparisons between the differential protein expressions were performed with the non-parametric Mann–Whitney test, using the relative intensity data. The correlation analysis of the expression of each gene or protein with the other triggers, as well as their gene expression with functional parameters, was performed with the nonparametric Spearman test. A strong correlation was considered when the r coefficient (Rs) value was ≥0.80, moderate when it was between the values 0.50–0.79, and weak when r < 0.50.

5. Conclusions

AKT1, MAPK13, STAT1, and TLR4 and their associated pathways are deregulated at peripheral level in asthmatic patients compared with healthy control subjects. The results provide molecular evidence that position these four proteins as central nodes in the pathophysiology of asthma, justifying future functional studies to delimitate their specific roles and attempt new therapeutic interventions.

Supplementary Materials

The following supporting information can be downloaded at: https://www.mdpi.com/article/10.3390/ijms26136240/s1.

Author Contributions

L.C.-J., S.B. and B.C. have worked on all project steps, i.e., design of study, experimental work, discussion of results, and drafting of the manuscript. M.L.-R., R.F.-S., M.Á.D.P. and C.R.-A. collaborated in drafting the manuscript. I.M. collaborated in the statistical analyses and interpretation of the results. J.M.O., V.d.P., M.L.C., J.A.L.-P., S.Q., B.B., D.B., M.V.-M. and J.S., selected patients and collaborated in the design of the study. All authors have read and agreed to the published version of the manuscript.

Funding

This research was funded in part by research grant PI20/00903 and PI23/00524 and cofunded by FEDER, CIBERES (ISCIII, 0013), RETIC (RD09/0076/00101) from the Fondo de Investigación Sanitaria (Ministerio de Ciencia, Innovación y Universidades, Spain) and in part by the research grant Ayudas de la Sociedad Española de Alergia e Inmunología Clínica (SEAIC). L. Cremades-Jimeno was supported by Fundación Conchita Rábago and PI20/00903. M. López-Ramos and MA de Pedro were supported by contracts from Comunidad de Madrid (PEJD-2019-PRE/BMD-16537 and PEJ-2017-AI/SAL-5938, respectively, Sistema de Garantía Juvenil), cofunded by Fondo Social Europeo (FSE) and Iniciativa de Empleo Juvenil (IEJ). R Fernández-Santamaría was supported by a contract Sara Borrell (CD23/00118) from the Fondo de Investigación Sanitaria (Ministerio de Ciencia, Innovación y Universidades, Spain). C Rosales-Ariza was supported by a contract pFIS (FI24/00194) from the Fondo de Investigación Sanitaria (Ministerio de Ciencia, Innovación y Universidades, Spain).

Institutional Review Board Statement

The study was conducted in accordance with the Declaration of Helsinki, and approved by the the Research Ethics Committee of the IIS-FJD-UAM, University Hospital, IdiPAZ and University Hospital of Navarra, Spain (PICO14-18_FJD) on 23 April 2018.

Informed Consent Statement

Informed consent was obtained from all subjects involved in the study.

Data Availability Statement

The data presented in this study are available on request from the corresponding author. The data are not publicly available as they are part of an ongoing study.

Acknowledgments

We are grateful for the invaluable collaboration of all the subjects who agreed to participate in the study.

Conflicts of Interest

The authors declare no conflicts of interest.

References

  1. GINA. Global Initiative for Asthma. Global Strategy for Asthma Management and Prevention. 2021. Available online: http://www.ginasthma.org/ (accessed on 28 May 2024).
  2. Dubin, S.; Patak, P.; Jung, D. Update on Asthma Management Guidelines. Mo Med. 2024, 121, 364–367. [Google Scholar] [PubMed]
  3. Pelaia, C.; Crimi, C.; Vatrella, A.; Tinello, C.; Terracciano, R.; Pelaia, G. Molecular Targets for Biological Therapies of Severe Asthma. Front. Immunol. 2020, 11, 603312. [Google Scholar] [CrossRef] [PubMed]
  4. Vatrella, A.; Maglio, A.; Pelaia, C.; Ciampo, L.; Pelaia, G.; Vitale, C. Eosinophilic inflammation: An Appealing Target for Pharmacologic Treatments in Severe Asthma. Biomedicines 2022, 10, 2181. [Google Scholar] [CrossRef]
  5. Couillard, S.; Pavord, I.D.; Heaney, L.G.; Petousi, N.; Hinks, T.S.C. Sub-stratification of type-2 high airway disease for therapeutic decision-making: A ‘bomb’ (blood eosinophils) meets the ‘magnet’ (FeNO) framework. Respirology 2022, 27, 573–577. [Google Scholar] [CrossRef]
  6. Peters, M.C.; Ringel, L.; Dyjack, N.; Herrin, R.; Woodruff, P.G.; Rios, C.; O’cOnnor, B.; Fahy, J.V.; Seibold, M.A. A transcriptomic method to determine airway immune dysfunction in T2-High and T2-Low asthma. Am. J. Respir. Crit. Care Med. 2019, 199, 465–477. [Google Scholar] [CrossRef]
  7. Berry, A.; Busse, W.W. Biomarkers in asthmatic patients: Has their time come to direct treatment? J. Allergy Clin. Immunol. 2016, 137, 1317–1324. [Google Scholar] [CrossRef]
  8. Parulekar, A.D.; Diamant, Z.; Nicola, A.; Hanania, N.A. Role of biologics targeting type 2 airway inflammation in asthma: What have we learned so far? Curr. Opin. Pulm. Med. 2017, 23, 3–11. [Google Scholar] [CrossRef]
  9. Chung, K.F. New treatments for severe treatment-resistant asthma: Targeting the right patient. Lancet Respir. Med. 2013, 1, 639–652. [Google Scholar] [CrossRef]
  10. Muraro, A.; Lemanske, R.F., Jr.; Hellings, P.W.; Akdis, C.A.; Bieber, T.; Casale, T.B.; Jutel, M.; Ong, P.Y.; Poulsen, L.K.; Schmid-Grendelmeier, P.; et al. Precision medicine in patients with allergic diseases: Airway diseases and atopic dermatitis-PRACTALL document of the European Academy of Allergy and Clinical Immunology and the American Academy of Allergy, Asthma & Immunology. J. Allergy Clin. Immunol. 2016, 137, 1347–1358. [Google Scholar] [CrossRef]
  11. Tyler, S.R.; Bunyavanich, S. Leveraging -omics for asthma endotyping. J. Allergy Clin. Immunol. 2019, 144, 13–23. [Google Scholar] [CrossRef]
  12. Cremades-Jimeno, L.; de Pedro, M.Á.; López-Ramos, M.; Sastre, J.; Mínguez, P.; Fernández, I.M.; Baos, S.; Cárdaba, B. Prioritizing Molecular Biomarkers in Asthma and Respiratory Allergy Using Systems Biology. Front. Immunol. 2021, 12, 640791. [Google Scholar] [CrossRef] [PubMed]
  13. Ma, L.; Brown, M.; Kogut, P.; Serban, K.; Li, X.; McConville, J.; Chen, B.; Bentley, J.K.; Hershenson, M.B.; Dulin, N.; et al. Akt activation induces hypertrophy without contractile phenotypic maturation in airway smooth muscle. Am. J. Physiol. Cell. Mol. Physiol. 2011, 300, L701–L709. [Google Scholar] [CrossRef]
  14. Hoshino, M.; Takahashi, M.; Aoike, N. Expression of vascular endothelial growth factor, basic fibroblast growth factor, and angiogenin immunoreactivity in asthmatic airways and its relationship to angiogenesis. J. Allergy Clin. Immunol. 2001, 107, 295–301. [Google Scholar] [CrossRef] [PubMed]
  15. Chung, K.F. p38 mitogen-activated protein kinase pathways in asthma and COPD. Chest 2011, 139, 1470–1479. [Google Scholar] [CrossRef]
  16. Khorasanizadeh, M.; Eskian, M.; Gelfand, E.; Rezaei, N. Mitogen-activated protein kinases as therapeutic targets for asthma. Pharmacol. Ther. 2017, 174, 112–126. [Google Scholar] [CrossRef]
  17. Wang, J.; Zhou, Y.; Zhang, H.; Hu, L.; Liu, J.; Wang, L.; Wang, T.; Zhang, H.; Cong, L.; Wang, Q. Pathogenesis of allergic diseases and implications for therapeutic interventions. Signal Transduct. Target. Ther. 2023, 8, 138. [Google Scholar] [CrossRef]
  18. Karvonen, A.M.; Hyvärinen, A.; Rintala, H.; Korppi, M.; Täubel, M.; Doekes, G.; Gehring, U.; Renz, H.; Pfefferle, P.I.; Genuneit, J.; et al. Quantity and diversity of environmental microbial exposure and development of asthma: A birth cohort study. Allergy 2014, 69, 1092–1101. [Google Scholar] [CrossRef]
  19. Remot, A.; Descamps, D.; Noordine, M.-L.; Boukadiri, A.; Mathieu, E.; Robert, V.; Riffault, S.; Lambrecht, B.; Langella, P.; Hammad, H.; et al. Bacteria isolated from lung modulate asthma susceptibility in mice. ISME J. 2017, 11, 1061–1074. [Google Scholar] [CrossRef]
  20. Eisenbarth, S.C.; Piggott, D.A.; Huleatt, J.W.; Visintin, I.; Herrick, C.A.; Bottomly, K. Lipopolysaccharide-enhanced, toll-like receptor 4-dependent T helper cell type 2 responses to inhaled antigen. J. Exp. Med. 2002, 196, 1645–1651. [Google Scholar] [CrossRef]
  21. Plaza, V.; Blanco, M.; García, G.; Korta, J.; Molina, J.; Quirce, S. Highlights of the Spanish Asthma Guidelines (GEMA), version 5.0. Arch. Bronconeumol 2021, 57, 11–12. [Google Scholar] [CrossRef]
  22. Balenga, N.A.; Klichinsky, M.; Xie, Z.; Chan, E.C.; Zhao, M.; Jude, J.; Laviolette, M.; Panettieri, R.A., Jr.; Druey, K.M. A fungal protease allergen provokes airway hyper-responsiveness in asthma. Nat. Commun. 2015, 6, 6763. [Google Scholar] [CrossRef] [PubMed]
  23. Tang, D.D. Critical role of actin-associated proteins in smooth muscle contraction, cell proliferation, airway hyperresponsiveness and airway remodeling. Respir. Res. 2015, 16, 134. [Google Scholar] [CrossRef] [PubMed]
  24. Li, J.; Wang, R.; Gannon, O.J.; Rezey, A.C.; Jiang, S.; Gerlach, B.D.; Liao, G.; Tang, D.D. Polo-like Kinase 1 Regulates Vimentin Phosphorylation at Ser-56 and Contraction in Smooth Muscle. J. Biol. Chem. 2016, 291, 23693–23703. [Google Scholar] [CrossRef] [PubMed]
  25. Wang, R.; Wang, Y.; Liao, G.; Chen, B.; Panettieri, R.A., Jr.; Penn, R.B.; Tang, D.D. Abi1 mediates airway smooth muscle cell proliferation and airway remodeling via Jak2/STAT3 signaling. iScience 2022, 25, 103833. [Google Scholar] [CrossRef]
  26. Liao, G.; Wang, R.; Tang, D.D. Plk1 Regulates Caspase-9 Phosphorylation at Ser-196 and Apoptosis of Human Airway Smooth Muscle Cells. Am. J. Respir. Cell Mol. Biol. 2022, 66, 223–234. [Google Scholar] [CrossRef]
  27. Hanada, M.; Feng, J.; Hemmings, B.A. Structure, regulation and function of PKB/AKT—A major therapeutic target. Biochim. Biophys. Acta 2004, 1697, 3–16. [Google Scholar] [CrossRef]
  28. Risco, A.; Miguel A Martin-Serrano, M.A.; Barber, D.F.; Cuenda, A. p38γ and p38d are involved in T lymphocyte development. Front. Immunol. 2018, 9, 65. [Google Scholar] [CrossRef]
  29. Barrio, L.; Román-García, S.; Díaz-Mora, E.; Risco, A.; Jiménez-Saiz, R.; Carrasco, Y.R.; Cuenda, A. B Cell Development and T-Dependent Antibody Response Are Regulated by p38γ and p38δ. Front. Cell Dev. Biol. 2020, 8, 189. [Google Scholar] [CrossRef]
  30. Shuai, K.; Liu, B. Regulation of JAK-STAT signalling in the immune system. Nat. Rev. Immunol. 2003, 11, 900–911. [Google Scholar] [CrossRef]
  31. Wang, W.; Lopez McDonald, M.C.; Kim, C.; Ma, M.; Pan, Z.T.; Kaufmann, C.; Frank, D.A. The complementary roles of STAT3 and STAT1 in cancer biology: Insights into tumor pathogenesis and therapeutic strategies. Front. Immunol. 2023, 14, 1265818. [Google Scholar] [CrossRef]
  32. Chiba, Y.; Todoroki, M.; Misawa, M. Antigen exposure causes activations of signal transducer and activator of transcription 6 (STAT6) and STAT1, but not STAT3, in lungs of sensitized mice. Immunopharmacol. Immunotoxicol. 2011, 33, 43–48. [Google Scholar] [CrossRef] [PubMed]
  33. Quarcoo, D.; Weixler, S.; Groneberg, D.; Joachim, R.; Ahrens, B.; Wagner, A.H.; Hecker, M.; Hamelmann, E. Inhibition of signal transducer and activator of transcription 1 attenuates allergen-induced airway inflammation and hyperreactivity. J. Allergy Clin. Immunol. 2004, 114, 288–295. [Google Scholar] [CrossRef] [PubMed]
  34. Rao, G.; Mack, C.D.; Nguyen, T.; Wong, N.; Payne, K.; Worley, L.; Gray, P.E.; Wong, M.; Hsu, P.; Stormon, M.O.; et al. Inborn errors of immunity reveal molecular requirements for generation and maintenance of human CD4+ IL-9-expressing cells. J. Allergy Clin. Immunol. 2025, 155, 1161–1178. [Google Scholar] [CrossRef] [PubMed]
  35. Gangloff, M. Different dimerisation mode for TLR4 upon endosomal acidification? Trends Biochem. Sci. 2012, 37, 92–98. [Google Scholar] [CrossRef]
  36. Ren, Y.; Ichinose, T.; He, M.; Youshida, S.; Nishikawa, M.; Sun, G. Co-exposure to lipopolysaccharide and desert dust causes exacerbation of ovalbumin-induced allergic lung inflammation in mice via TLR4/MyD88-dependent and -independent pathways. Allergy Asthma Clin. Immunol. 2019, 15, 82. [Google Scholar] [CrossRef]
  37. Tan, A.M.; Chen, H.C.; Pochard, P.; Eisenbarth, S.C.; Herrick, C.A.; Bottomly, H.K. TLR4 Signaling in Stromal Cells Is Critical for the Initiation of Allergic Th2 Responses to Inhaled Antigen. J. Immunol. 2010, 184, 3535–3544. [Google Scholar] [CrossRef]
  38. Siwiec, J.; Zaborowski, T.; Jankowska, O.; Wojas-Krawczyk, K.; Krawczyk, P.; Milanowski, J. Evaluation of Th1/Th2 lymphocyte balance and lipopolysaccharide receptor expression in asthma patients. Pneumonol. Alergol. Pol. 2009, 77, 123–130. [Google Scholar]
  39. Kenny, E.F.; O’Neill, L.A.J. Signalling adaptors used by Toll-like receptors: An update. Cytokine 2008, 43, 342–349. [Google Scholar] [CrossRef]
  40. Laird, M.H.W.; Rhee, S.H.; Perkins, D.J.; Medvedev, A.E.; Piao, W.; Fenton, M.J.; Vogel, S.N. TLR4/MyD88/PI3K interactions regulate TLR4 signaling. J. Leukoc. Biol. 2009, 85, 966–977. [Google Scholar] [CrossRef]
  41. Bauerfeld, C.P.; Rastogi, R.; Pirockinaite, G.; Lee, I.; Hüttemann, M.; Monks, B.; Birnbaum, M.J.; Franchi, L.; Nuñez, G.; Samavati, L. TLR4-Mediated AKT Activation Is MyD88/TRIF Dependent and Critical for Induction of Oxidative Phosphorylation and Mitochondrial Transcription Factor A in Murine Macrophages. J. Immunol. 2012, 188, 2847–2857. [Google Scholar] [CrossRef]
  42. Risco, A.; del Fresno, C.; Mambol, A.; Alsina-Beauchamp, D.; MacKenzie, K.F.; Yang, H.-T.; Barber, D.F.; Morcelle, C.; Arthur, J.S.C.; Ley, S.C.; et al. P38γ and p38δ kinases regulate the Toll-like receptor 4 (TLR4)-induced cytokine production by controlling ERK1/2 protein kinase pathway activation. Proc. Natl. Acad. Sci. USA 2012, 109, 11200–11205. [Google Scholar] [CrossRef] [PubMed]
  43. Sikorski, K.; Chmielewski, S.; Olejnik, A.; Wesoly, J.Z.; Heemann, U.; Baumann, M.; Bluyssen, H. STAT1 as a central mediator of IFNγ and TLR4 signal integration in vascular dysfunction. JAK-STAT 2012, 1, 241–249. [Google Scholar] [CrossRef] [PubMed]
  44. Luu, K.; Greenhill, C.J.; Majoros, A.; Decker, T.; Jenkins, B.J.; Mansell, A. STAT1 plays a role in TLR signal transduction and inflammatory responses. Immunol. Cell Biol. 2014, 92, 761–769. [Google Scholar] [CrossRef]
  45. Nguyen, H.; Ramana, C.V.; Bayes, J.; Stark, G.R. Roles of Phosphatidylinositol 3-Kinase in Interferon-γ-dependent Phosphorylation of STAT1 on Serine 727 and Activation of Gene Expression. J. Biol. Chem. 2001, 276, 33361–33368. [Google Scholar] [CrossRef]
  46. Chen, K.; Xiang, Y.; Yao, X.; Liu, Y.; Gong, W.; Yoshimura, T.; Wang, J.M. The active contribution of Toll-like receptors to allergic airway inflammation. Int. Immunopharmacol. 2011, 11, 1391–1398. [Google Scholar] [CrossRef]
  47. Tang, L.; Chen, Q.; Meng, Z.; Sun, L.; Zhu, L.; Liu, J.; Hu, J.; Ni, Z.; Wang, X. Suppression of Sirtuin-1 Increases IL-6 Expression by Activation of the Akt Pathway during Allergic Asthma. Cell. Physiol. Biochem. 2017, 43, 1950–1960. [Google Scholar] [CrossRef]
  48. Fang, R.; Cui, Q.; Sun, J.; Duan, X.; Ma, X.; Wang, W.; Cheng, B.; Liu, Y.; Hou, Y.; Bai, G. PDK1/Akt/PDE4D axis identified as a target for asthma remedy synergistic with β2AR agonists by a natural agent arctigenin. Allergy 2015, 70, 1622–1632. [Google Scholar] [CrossRef]
  49. Dahlin, A.; Qiu, W.; Litonjua, A.A.; Lima, J.J.; Tamari, M.; Kubo, M.; Irvin, C.G.; Peters, S.P.; Wu, A.C.; Weiss, S.T.; et al. The phosphatidylinositide 3-kinase (PI3K) signaling pathway is a determinant of zileuton response in adults with asthma. Pharmacogenom J. 2018, 18, 665–677. [Google Scholar] [CrossRef]
  50. Zou, W.; Ding, F.; Niu, C.; Fu, Z.; Liu, S. Brg1 aggravates airway inflammation in asthma via inhibition of the PI3K/Akt/mTOR pathway. Biochem. Biophys. Res. Commun. 2018, 503, 3212–3218. [Google Scholar] [CrossRef]
  51. Cui, H.; Cheng, Y.; He, Y.; Cheng, W.; Zhao, W.; Zhao, H.; Zhou, F.H.; Wang, L.; Dong, J.; Cai, S. The AKT inhibitor MK2206 suppresses airway inflammation and the pro-remodeling pathway in a TDI-induced asthma mouse model. Mol. Med. Rep. 2020, 22, 3723–3734. [Google Scholar] [CrossRef]
  52. Gauthier, M.; Chakraborty, K.; Oriss, T.B.; Raundhal, M.; Das, S.; Chen, J.; Huff, R.; Sinha, A.; Fajt, M.; Ray, P.; et al. Severe asthma in humans and mouse models suggest a CXCL10 signature underlies corticosteroid-resistant Th1 bias. J. Clin. Investig. 2017, 2, e94580. [Google Scholar] [CrossRef] [PubMed]
  53. Lewis, B.W.; Jackson, D.; Amici, S.A.; Walum, J.; Guessas, M.; Guessas, S.; Coneglio, E.; Boda, A.V.; Guerau-De-Arellano, M.; Grayson, M.H.; et al. Corticosteroid Insensitivity Persists in the Absence of STAT1 Signaling in Severe Allergic Airway Inflammation. Am. J. Physiol. Cell. Mol. Physiol. 2021, 321, L1194–L1205. [Google Scholar] [CrossRef] [PubMed]
  54. McAlees, J.W.; Whitehead, G.S.; Harley, I.T.; Cappelletti, M.; Rewerts, C.L.; Holdcroft, A.M.; Divanovic, S.; Wills-Karp, M.; Finkelman, F.D.; Karp, C.L.; et al. Distinct Tlr4-expressing cell compartments control neutrophilic and eosinophilic airway inflammation. Mucosal Immunol. 2015, 8, 863–873. [Google Scholar] [CrossRef]
  55. Wan, B.; Xu, W.-J.; Chen, M.-Z.; Sun, S.-S.; Jin, J.-J.; Lv, Y.-L.; Zhan, P.; Zhu, S.-H.; Wang, X.-X.; Lv, T.-F.; et al. Geranylgeranyl diphosphate synthase 1 knockout ameliorates ventilator-induced lung injury via regulation of TLR2/4-AP-1 signaling. Free Radic Biol. Med. 2020, 147, 159–166. [Google Scholar] [CrossRef]
  56. Zakeri, A.; Russo, M. Dual role of toll-like receptors in human and experimental asthma models. Front. Immunol. 2018, 9, 1027. [Google Scholar] [CrossRef]
  57. Lim, J.O.; Kim, W.I.; Pak, S.W.; Lee, S.J.; Park, S.H.; Shin, I.S.; Kim, J.C. Toll-like receptor 4 is a key regulator of asthma exacerbation caused by aluminum oxide nanoparticles via regulation of NF-κB phosphorylation. J. Hazard. Mater. 2023, 448, 130884. [Google Scholar] [CrossRef]
  58. Ferreira, D.S.; Annoni, R.; Silva, L.F.F.; Buttignol, M.; Santos, A.B.G.; Medeiros, M.C.R.; Andrade, L.N.S.; Yick, C.Y.; Sterk, P.J.; Sampaio, J.L.M.; et al. Toll-like receptors 2, 3 and 4 and thymic stromal lymphopoietin expression in fatal asthma. Clin. Exp. Allergy 2012, 42, 1459–1471. [Google Scholar] [CrossRef]
  59. Shi, H.L.; Liu, J.B.; Lu, A.P. Expression profiles of PI3K, NF-κB, and STAT1 in peripheral blood mononuclear cells in children with bronchial asthma. Chin. J. Cont. Pediatr. 2016, 18, 614–617. [Google Scholar] [CrossRef]
  60. Alhetheel, A.; Albarrag, A.; Hakami, A.; Shakoor, Z.; Alswat, K.; Abdo, A.; Al-Hamoudi, W.; Alomar, S. In the peripheral blood mononuclear cells (PBMCs) of HCV infected patients the expression of STAT1 and IRF-1 is downregulated while that of caspase-3 upregulated. Acta Virol. 2020, 64, 352–358. [Google Scholar] [CrossRef]
  61. Zhu, L.; Yang, P.; Zhao, Y.; Zhuang, Z.; Wang, Z.; Song, R.; Zhang, J.; Liu, C.; Gao, Q.; Xu, Q.; et al. Single-Cell Sequencing of Peripheral Mononuclear Cells Reveals Distinct Immune Response Landscapes of COVID-19 and Influenza Patients. Immunity 2020, 53, 685–696.e3. [Google Scholar] [CrossRef]
  62. Ehrlich, M.; Sanchez, C.; Shao, C.; Nishiyama, R.; Kehrl, J.; Kuick, R.; Kubota, T.; Hanash, S.M. ICF, an immunodeficiency syndrome: DNA methyltransferase 3B involvement, chromosome anomalies, and gene dysregulation. Autoimmunity 2008, 41, 253–271. [Google Scholar] [CrossRef] [PubMed]
  63. Gao, L.; Smit, M.A.; Oord, J.J.v.D.; Goeman, J.J.; Verdegaal, E.M.E.; van der Burg, S.H.; Stas, M.; Beck, S.; Gruis, N.A.; Tensen, C.P.; et al. Genome-wide promoter methylation analysis identifies epigenetic silencing of MAPK13 in primary cutaneous melanoma. Pigment. Cell Melanoma Res. 2013, 26, 542–554. [Google Scholar] [CrossRef] [PubMed]
  64. Lun, S.W.M.; Wong, C.K.; Ko, F.W.S.; Hui, D.S.C.; Lam, C.W.K. Expression and functional analysis of toll-like receptors of peripheral blood cells in asthmatic patients: Implication for immunopathological mechanism in asthma. J. Clin. Immunol. 2009, 29, 330–342. [Google Scholar] [CrossRef] [PubMed]
  65. Bruscia, E.M.; Zhang, P.-X.; Satoh, A.; Caputo, C.; Medzhitov, R.; Shenoy, A.; E Egan, M.; Krause, D.S. Abnormal Trafficking and Degradation of TLR4 Underlie the Elevated Inflammatory Response in Cystic Fibrosis. J. Immunol. 2011, 186, 6990–6998. [Google Scholar] [CrossRef]
  66. Ciesielska, A.; Matyjek, M.; Kwiatkowska, K. TLR4 and CD14 trafficking and its influence on LPS-induced pro-inflammatory signaling. Cell. Mol. Life Sci. 2021, 78, 1233–1261. [Google Scholar] [CrossRef]
  67. Knobloch, J.; Jungck, D.; Kronsbein, J.; Stoelben, E.; Ito, K.; Koch, A. LABAs and p38MAPK Inhibitors Reverse the Corticosteroid-Insensitivity of IL-8 in Airway Smooth Muscle Cells of COPD. J. Clin. Med. 2019, 8, 2058. [Google Scholar] [CrossRef]
  68. Zhai, Y.; Zheng, P.; Sun, B.; Li, J.; Wang, B. Allergen-specific immunotherapy with Alutard SQ improves allergic inflammation in house-dust mites-induced allergic asthma rats through inactivation of the HMGB1/TLR4/NF-κB pathway. J. Thorac. Dis. 2023, 15, 77–89. [Google Scholar] [CrossRef]
  69. Tian, B.; Widen, S.G.; Yang, J.; Wood, T.G.; Kudlicki, A.; Zhao, Y.; Brasier, A.R. The NFκB subunit RELA is a master transcriptional regulator of the committed epithelial-mesenchymal transition in airway epithelial cells. J. Biol. Chem. 2018, 293, 16528–16545. [Google Scholar] [CrossRef]
  70. Gu, W.; Lei, J.; Zhu, H.; Xiao, Y.; Zhang, Z.; Zhao, L. Effect of the BMPR-II-SMAD3/MRTF pathway on proliferation and migration of ASMCs and the mechanism in asthma. Mol. Biol. Rep. 2022, 49, 9283–9296. [Google Scholar] [CrossRef]
  71. Yang, Z.; Krammer, S.; Mitländer, H.; Grund, J.C.; Zirlik, S.; Wirtz, S.; Rauh, M.; Shermeh, A.S.; Finotto, S. NFATc1 in CD4+ T cells and CD11c+ dendritic cells drives TH2-mediated eosinophilic inflammation in allergic asthma. J. Allergy Clin. Immunol. Glob. 2024, 4, 100355. [Google Scholar] [CrossRef]
  72. Drazen, J.M.; Yandava, C.N.; Dubé, L.; Szczerback, N.; Hippensteel, R.; Pillari, A.; Israel, E.; Schork, N.; Silverman, E.S.; Katz, D.A. Pharmacogenetic association between ALOX5 promoter genotype and the response to anti-asthma treatment. Nat. Genet. 1999, 22, 168–170. Available online: http://genetics.nature.com (accessed on 16 June 2025). [CrossRef] [PubMed]
  73. Mougey, E.; Lang, J.E.; Allayee, H.; Teague, W.G.; Dozor, A.J.; Wise, R.A.; Lima, J.J. ALOX5 Polymorphism associates with increased leukotriene production and reduced lung function and asthma control in children with poorly controlled asthma. Clin. Exp. Allergy 2013, 43, 512–520. [Google Scholar] [CrossRef] [PubMed]
  74. Alhamdan, F.; Marsh, L.M.; Pedersen, F.; Alhamwe, B.A.; Thölken, C.; Pfefferle, P.I.; Bahmer, T.; Greulich, T.; Potaczek, D.P.; Garn, H. Differential Regulation of Interferon Signaling Pathways in CD4+ T Cells of the Low Type-2 Obesity-Associated Asthma Phenotype. Int. J. Mol. Sci. 2021, 22, 10144. [Google Scholar] [CrossRef] [PubMed]
  75. Bantulà, M.; Arismendi, E.; Tubita, V.; Roca-Ferrer, J.; Mullol, J.; de Hollanda, A.; Sastre, J.; Valero, A.; Baos, S.; Cremades-Jimeno, L.; et al. Effect of Obesity on the Expression of Genes Associated with Severe Asthma—A Pilot Study. J. Clin. Med. 2023, 12, 4398. [Google Scholar] [CrossRef]
  76. Muñoz, X.; Álvarez-Puebla, M.J.; Arismendi, E.; Arochena, L.; Ausín, M.d.P.; Barranco, P.; Bobolea, I.; Cañas, J.A.; Cardaba, B.; Crespo, A.; et al. The MEGA Project: A Study of the Mechanisms Involved in the Genesis and Disease Course of Asthma. Asthma Cohort Creation and Long-Term Follow-Up. Arch. Bronconeumol. 2018, 54, 378–385. [Google Scholar] [CrossRef]
  77. Baos, S.; Calzada, D.; Cremades, L.; Sastre, J.; Quiralte, J.; Florido, F.; Lahoz, C.; Cárdaba, B. Biomarkers associated with disease severity in allergic and nonallergic asthma. Mol. Immunol. 2017, 82, 34–45. [Google Scholar] [CrossRef]
Figure 1. Differential gene and protein expression results of AKT1, MAPK13, STAT1, and TLR4 in PBMCs samples. (A) The relative expression of each gene is represented as the mean relative quantification (RQ) in each asthma group compared to healthy controls. Error bars represent the standard error. (B) (i) Protein expression results are displayed in a box-and-whisker plot, which shows the relative intensity (RI) of each band detected by Western blot and the β-Actin band in each sample. (ii) A representative example of a Western blot including two control subjects (HC), five allergic asthmatic patients (AA), and three nonallergic asthmatic patients (NA) is shown. Statistically significant differences between groups, according to the nonparametric Mann–Whitney test, are indicated: HC* and HC## (p < 0.05 and p < 0.001, respectively) for statistically significant differences between the control group and the indicated clinical group; * and ** (p < 0.05 and p < 0.01, respectively) for statistically significant differences between the two clinical groups indicated by the horizontal bar.
Ijms 26 06240 g001
Figure 2. Differential gene expression of potential asthma triggers according to asthma severity in (A) allergic asthmatic (AA) patients and (B) nonallergic asthmatic (NA) patients. The relative expression of each gene is represented as the mean relative quantification (RQ) in each asthma group compared to healthy controls. Error bars represent the standard error. The gene expression was compared among severities and with healthy control (HC) subjects by non-parametric Mann–Whitney test, using the R program, and differences were considered significant with adjusted p-values under 0.05. Statistically significant differences between HC and the indicated severity subgroup are shown as HC**, HC#, and HC## (p ≤ 0.01, p ≤ 0.005, and p ≤ 0.001, respectively). Statistically significant differences among indicated subgroups are shown as *, **, and # (p ≤ 0.05, p ≤ 0.01, and p ≤ 0.001, respectively). AAS, AAMo, AAM: severe, moderate, and mild allergic asthmatic patients, respectively; and NAS, NAMo, NAM: severe, moderate, and mild nonallergic asthmatic patients, respectively.
Ijms 26 06240 g002
Table 1. Demographic and clinical characteristics of the study population.
HCAANA
N154517
Age (y.o), mean ± SD32.87 ± 10.848.02 ± 12 ##54.88 ± 11 ##
Gender, N (%)
 Male7 (46.7)12 (26.7)7 (41.2)
 Female8 (53.3)33 (73.3)10 (58.8)
Smoking habit, N (%)
 Smoker 5 (11.1)2 (11.8)
 Ex- Smoker 13 (28.9)9 (52.9)
 No Smoker 25 (55.6)6 (35.3)
 ND15 (100)2 (4.4)0 (0)
BMI (Kg/m2), mean ± SD23.6 ± 1.325.87 ± 4.527.5 ± 4.8 *
Asthma severity, N (%)
 Severe-17 (37.8)4 (23.5)
 Moderate-14 (31.1)8 (47)
 Mild-14 (31.1)5 (29.5)
Spirometry, mean ± SD
 FEV1 (%)100.82 ± 7.987.74 ± 2096.89 ± 21.8
 FVC (%)104 ± 6.998.88 ± 18.7110.1 ± 20.6
 FEV1/FVC82.53 ± 2.277.09 ± 9.881.78 ± 14.4
FeNO (ppb), mean ± SD11.1 ± 5.938.4 ± 30.7 **32.38 ± 27
Total IgE (IU/mL), mean ± SD63.55 ± 94.7436.71 ± 493.1 #,†159.95 ± 173.2 *
Blood cells
 Eosinophils (cells/mm3), mean ± SD280 ± 168.7324.67 ± 206.1424.8 ± 205
 Neutrophils (cells/mm3), mean ± SDND3823 ± 1574.64438.33 ± 1172.6
Sputum cells
 Eosinophils (%), mean ± SDND9.6 ± 17.416 ± 27.9
 ≥3% eosinophils, N (%)ND10 (22.2)5 (29.4)
 Neutrophils (%), mean ± SDND29.4 ± 2440 ± 30.4
 ≥70% neutrophils, N (%)ND4 (8.8)3 (17.6)
Cellular profile, N (%)
 EosinophilicND9 (20)5 (29.4)
 NeutrophilicND2 (4.4)3 (17.7)
 MixedND1 (2.2)0 (0)
 PaucigranulocyteND13 (28.9)4 (23.5)
 NDND19 (42.2)5 (29.4)
Treatment, N (%)
 Inhaled Corticosteroids (ICS)-43 (95.5)17 (100)
 Systemic Corticosteroids -1 (2.2)2 (11.8)
 Long-term β2-Agonists (LABA)-39 (86.7)17 (100)
 Short-term anticholinergics -1 (2.2)1 (5.9)
 Long-term anticholinergics -9 (2)2 (11.8)
 Leukotriens receptor agonists -12 (26.7)3 (17.7)
 Short-term bronchodilators -18 (40)7 (41.2)
 Specific immunotherapy -12 (26.7)0 (0)
 Biologics (Omaluzimab, Mepaluzimab)-14 (31.1), 4 (8.8)2 (11.8), 1(5.9)
HC: healthy control subjects. AA: allergic asthmatic patients. NA: nonallergic asthmatic patients. SD: Standard deviation. ND: No data. BMI: Body mass index. FEV1: Forced expiratory volume in 1 s. FVC: Forced vital capacity. FeNO: Fractional exhaled nitric oxide (ppb). Total IgE units: IU/mL (International Units per mL). Statistically significant diferences between clinical groups and healthy control are shown as *, **, #, ## for values p < 0.05, p < 0.01, p < 0.001, and p < 0.0001, respectively. Statistically significant diferences between groups and NA are shown as for p < 0.05.
Table 2. Analysis of correlation among triggering gene (cursive) and protein expression by clinical groups.
(A)
Healthy control
AKT1MAPK13STAT1TLR4
AKT1 Rs = 0.97; p < 0.001Rs = 0.73; p = 0.002Rs = 0.60; p = 0.02
MAPK13Rs = 0.82; p = 0.004 Rs = 0.69; p = 0.005Rs = 0.64; p = 0.01
STAT1Rs = 0.51; p = nsRs = 0.57; p = ns Rs = 0.55; p = 0.04
TLR4Rs = 0.89; p = 0.001Rs = −0.19; p = nsRs = 0.74; p = 0.02
(B)
Allergic asthmatic patients
AKT1MAPK13STAT1TLR4
AKT1 Rs = 0.86; p < 0.001Rs = 0.92; p < 0.001Rs = 0.71; p < 0.001
MAPK13Rs = −0.41; p = ns Rs = 0.83; p < 0.001Rs = 0.60; p < 0.001
STAT1Rs = 0.10; p = nsRs = 0.74; p = 0.01 Rs = 0.75; p < 0.001
TLR4Rs = −0.47; p = nsRs = 0.59; p = nsRs = 0.84; p < 0.001
(C)
Nonallergic asthmatic patients
AKT1MAPK13STAT1TLR4
AKT1 Rs = 0.92; p < 0.001Rs = 0.94; p < 0.001Rs = 0.53; p = 0.04
MAPK13Rs = −0.53; p = ns Rs = 0.83; p < 0.001Rs = 0.53; p = 0.04
STAT1Rs = −0.35; p = nsRs = −0.36; p = ns Rs = 0.53; p = 0.04
TLR4Rs = 0.24; p = nsRs = −0.62; p = 0.05Rs = 0.55; p = ns
The results obtained for the gene expression data are showed in italics and the results obtained for the protein expression data are shown in regular font. In bold are highlighted the statistically significant results.
Table 3. Correlation between functional parameters and trigger gene and protein expression by clinical groups.
(A)
Allergic asthmatic patients
FEV1FVCFEV/FVCPBE
AKT1GeneRs = −0.28; p = nsRs = −0.30; p = nsRs = −0.15; p = nsRs = 0.28; p = ns
ProteinRs = −0.59; p = nsRs = −0.62; p = nsRs = −0.16; p = nsRs = −0.16; p = ns
MAPK13GeneRs = −0.39; p = 0.009Rs = −0.36; p = 0.02Rs = −0.13; p = nsRs = 0.07; p = ns
ProteinRs = 0.27; p = nsRs = 0.36; p = nsRs = −0.38; p = nsRs = −0.19; p = ns
STAT1GeneRs = −0.41; p = 0.006Rs = −0.41; p = 0.005Rs = −0.25; p = nsRs = 0.30; p = 0.04
ProteinRs = −0.63; p = 0.01Rs = −0.41; p = nsRs = −0.14; p = nsRs = 0.15; p = ns
TLR4GeneRs = −0.19; p = nsRs = −0.23; p = nsRs = −0.41; p = 0.009Rs = 0.15; p = ns
ProteinRs = −0.62; p = 0.02Rs = −0.62; p = 0.01Rs = 0.24; p = nsRs = 0.15; p = ns
(B)
Nonallergic asthmatic patients
FEV1FVCFEV/FVCPBE
AKT1 GeneRs = 0.24; p = nsRs = 0.45; p = nsRs = 0.39; p = nsRs = 0.06; p = ns
ProteinRs = −0.08; p = nsRs = 0.53; p = nsRs = −0.25; p = nsRs = 0.02; p = ns
MAPK13GeneRs = 0.17; p = nsRs = 0.36; p = nsRs = 0.49; p = 0.04Rs = 0.06; p = ns
ProteinRs = 0.04; p = nsRs = 0.57; p = nsRs = 0.19; p = nsRs = −0.24; p = ns
STAT1GeneRs = 0.25; p = nsRs = 0.46; p = nsRs = 0.36; p = nsRs = 0.09; p = ns
ProteinRs = 0.43; p = nsRs = 0.58; p = 0.04Rs = −0.06; p = nsRs = −0.56; p = 0.04
TLR4GeneRs = −0.22; p = nsRs = 0.16; p = nsRs = −0.15; p = nsRs = −0.11; p = ns
ProteinRs = 0.65; p = 0.03Rs = 0.85; p = 0.002Rs = 0.20; p = nsRs = −0.13; p = ns
PBE: peripheral blood eosinophils (cells/mm3). In bold are highlighted the statistically significant results.
Table 4. Differential gene expression results in asthmatic patients and healthy control subjects for the main proteins of the signaling pathways of the four asthma triggers.
(A)
Allergic asthma (AA) vs. Healthy Control (HC)
GeneGene Classification Total AA Severe AA Moderate AA Mild AA
RQAdj P RQAdj P RQ Adj P RQ Adj P
AKT1 pathway AKT1Trigger0.177<0.0010.109<0.0010.154<0.0010.354ns
COL5A1Link Node 0.1770.0040.067<0.0010.203ns0.467ns
MMP90.041<0.0010.027<0.0010.0330.0060.082ns
RELA0.165<0.0010.088<0.0010.154<0.0010.379ns
SMAD30.25<0.0010.134<0.0010.218<0.0010.616ns
TLR20.102<0.0010.051<0.0010.117<0.0010.177ns
MAPK13 pathway MAPK13Trigger 0.177<0.0010.109<0.0010.154<0.0010.354ns
IL12ALink Node 0.2180.0110.154<0.0010.1650.0180.435ns
IL13RA10.117<0.0010.072<0.0010.125<0.0010.1770.029
NFATC10.144<0.0010.067<0.0010.117<0.0010.5ns
RELA0.165<0.0010.088<0.0010.154<0.0010.379ns
STAT1 pathway STAT1Trigger 0.117<0.0010.063<0.0010.109<0.0010.287ns
CCL5Link Node 0.145<0.0010.067<0.0010.127<0.0010.412ns
COL5A10.1770.0040.067<0.0010.203ns0.467ns
IL100.067<0.0010.038<0.0010.0880.0080.117ns
IL12A0.2180.0110.1540.0010.1650.0180.435ns
MMP90.041<0.0010.027<0.0010.0330.0060.082ns
RELA0.165<0.0010.088<0.0010.154<0.0010.379ns
TLR4 pathway TLR4Trigger0.072<0.0010.038<0.0010.072<0.0010.144ns
MMP9Link Node0.041<0.0010.027<0.0010.0330.0060.082ns
RELA0.165<0.0010.088<0.0010.154<0.0010.379ns
SMAD30.250<0.0010.134<0.0010.218<0.0010.616ns
CommonALOX5Mechanistic0.102<0.0010.044<0.0010.088<0.0010.287ns
BAX0.233<0.0010.154<0.0010.203<0.0010.5ns
IL4R0.134<0.0010.063<0.0010.117<0.0010.435ns
TGFB10.180<0.0010.11<0.0010.157<0.0010.337ns
(B)
Nonallergic asthma (NA) vs. Healthy Control (HC)
GeneGene classification Total NASevere NAModerate NAMild NA
RQAdj PRQAdj PRQ Adj PRQ Adj P
AKT1 pathway AKT1Trigger0.067<0.0010.0720.0060.067<0.0010.054<0.001
CDH1Link Node 0.044<0.0010.077ns0.038<0.0010.036<0.001
RELA0.062<0.0010.0540.0020.072<0.0010.058<0.001
SMAD30.125<0.0010.1170.0020.134<0.0010.109<0.001
TLR20.044<0.0010.0270.0020.036<0.0010.0880.004
MAPK13 pathway MAPK13Trigger 0.036<0.0010.0220.0040.033<0.0010.058<0.001
CXCL8Link Node 0.058ns0.054ns0.054ns0.072ns
NFATC10.067<0.0010.0630.0020.067<0.0010.077<0.001
RELA0.062<0.0010.0540.0020.072<0.0010.058<0.001
STAT1 pathway STAT1Trigger 0.051<0.0010.0440.0020.063<0.0010.047<0.001
CXCR3Link Node0.077<0.0010.0880.0190.077<0.0010.0820.001
RELA0.062<0.0010.0540.0020.072<0.0010.058<0.001
VCAN0.058<0.0010.0410.0020.054<0.0010.095<0.001
TLR4 pathway TLR4Trigger 0.036<0.0010.0220.0040.033<0.0010.058<0.001
CDH1Link Node 0.044<0.0010.077ns0.038<0.0010.036<0.001
RELA0.062<0.0010.0540.0020.072<0.0010.058<0.001
SMAD30.125<0.0010.1170.0020.134<0.0010.109<0.001
TLR50.051<0.0010.102ns0.038<0.0010.0540.002
CommonALOX5Mechanistic 0.038<0.0010.0380.0020.038<0.0010.036<0.001
CCL50.058<0.0010.0510.0020.063<0.0010.054<0.001
PTGER20.067<0.0010.0360.0020.077<0.0010.077<0.001
RQ: Relative quantification with respect to HC. Ns: not statistically significant.
Table 5. Differential gene expression results between asthmatic patients (AA vs. NA) for the genes common in both clinical phenotypes groups by triggering pathways.
GeneGene ClassificationAA RQNA RQAdjusted P
AKT1
Pathway
AKT1Trigger0.1770.0670.008
RELALink Node0.1650.062<0.001
SMAD30.2500.1250.021
TLR20.1020.0440.022
MAPK13
Pathway
MAPK13Trigger0.1770.0360.021
NFATC1Link Node0.1440.0670.028
RELA0.1650.062<0.001
STAT1 pathwaySTAT1Trigger0.1170.0510.007
RELALink Node0.1650.062<0.001
TLR4 pathwayTLR4Trigger0.0720.036ns
RELALink Node0.1650.062<0.001
SMAD30.2500.1250.021
CommonsALOX5Mechanistic0.1020.0380.011
RQ: relative quantification of the gene expression value obtained in each asthma group compared to the control group. AA: allergic asthmatic patients; NA: nonallergic asthmatic patients. Ns: not significant.
Table 6. Genes studied, their classification in the signaling pathways of the trigger proteins in both asthma endotypes, chromosome location, and primers used for the gene expression analysis.
GeneDefinition of the Gene According to Biology Systems [12]Chromosome Location
(GRCh38/hg38)
Primer Reference
AKT1TriggerChr.14: 104769349–104795743Hs00178289_m1
ALOX5Mechanistic in NA and AAChr.10: 45374166–45446121Hs01095330_m1
BAXMechanistic in AAChr.19: 48954825–48961798Hs00180269_m1
CCL5Mechanistic in NA, link node in AAChr.17: 35871491–35880373Hs00982282_m1
CCL11Mechanistic in NAChr.17: 34285668–34288180Hs00237013_m1
CCL17Link node in NAChr.16: 57396076–57416063Hs00171074_m1
CDH1Link node in NAChr.16: 68737290–68835542Hs01023895_m1
COL5A1Link node in AAChr.9: 134641790–134844843Hs00609088_m1
CXCR3Link node in NAChr.X: 71615913–71618517Hs01847760_s1
IL4RMechanistic in AAChr.16: 27313668–27364778Hs00166237_m1
IL8 (CXCL8)Link node in NAChr.4: 73740506–73743716Hs00174103_m1
IL10Link node in AAChr.1: 206767603–206772494Hs00961622_m1
IL12ALink node in AAChr.3: 159988836–159996019Hs01073447_m1
IL12BLink node in AAChr.5: 159314783–159330473Hs01011518_m1
IL13RA1Link node in AAChr.X: 118726954–118794533Hs00609817_m1
IL17AMechanistic in NA and AAChr.6: 52186387–52190638Hs00174383_m1
MAPK13TriggerChr.6: 36130484–36144524Hs00559623_m1
MUC5BMechanistic in NA and AAChr.11: 1223065–1262176Hs00861595_m1
MMP9Link node in AAChr.20: 46008908–46016561Hs00957562_m1
NFATC1Link node in NA and AAChr.18: 79395772–79529323Hs00542678_m1
PTGER2Mechanistic in NAChr.14: 52314298–52328606Hs04183523_m1
RELALink node in NA and AAChr.11: 65653596–65662972Hs00153294_m1
SMAD3Link node in NA and AAChr.15: 67065698–67195195Hs00969210_m1
STAT1TriggerChr.2: 190969036–191014250Hs01013996_m1
TGFB1Mechanistic in AAChr.19: 41330531–41353933Hs00998133_m1
TLR2Link node in NA and AAChr.4: 153684080–153710643Hs00152932_m1
TLR4TriggerChr.9: 117704175–117717491Hs00152939_m1
TLR5Link node in NAChr.1: 223108401–223143282Hs01920773_s1
VCANLink node in NAChr.5: 83471674–83582303Hs00171642_m1
18SEndogenous -Hs99999901_s1
In red are highlighted those genes studied but not detected in the samples analyzed.
Disclaimer/Publisher’s Note: The statements, opinions and data contained in all publications are solely those of the individual author(s) and contributor(s) and not of MDPI and/or the editor(s). MDPI and/or the editor(s) disclaim responsibility for any injury to people or property resulting from any ideas, methods, instructions or products referred to in the content.

