Abstract
Class III peroxidases (PODs) are plant-specific enzymes that play crucial roles in plant growth, development and responses to stress. However, the POD gene family in the radish (Raphanus sativus L.) has not been comprehensively investigated to date. In this study, a total of 95 RsPODs were identified in the radish genome, which were classified into six subgroups based on a phylogenetic analysis. The gene structures and conserved motifs of the RsPODs were highly conserved within each subgroup. An intraspecific collinearity analysis revealed 7 tandem and 40 segmental duplication events. An expression analysis across diverse tissues and developmental stages demonstrated that the RsPODs were functionally involved in radish development. Using a chimeric-colored radish mutant, this study revealed significantly higher POD activity in the green tissues compared to purple tissues. Through transcriptome sequencing, two RsPOD genes (RsPOD14 and RsPOD28) were identified as candidate genes related to the anthocyanin metabolism. Our study provides a genome-wide perspective on the RsPOD genes in the radish and highlights their potential roles in the anthocyanin metabolism. These findings establish a critical foundation for future research aimed at uncovering the functional roles of specific RsPOD genes, with a particular emphasis on elucidating the molecular mechanisms that regulate anthocyanin degradation in the radish.
Keywords:
class III peroxidase; radish; anthocyanin; genome-wide; transcriptome; expression analysis 1. Introduction
Peroxidases (EC 1.11.1.X) are a ubiquitous class of enzymes found across all domains of life, ranging from archaea to mammals [1]. Based on structural characteristics and functional properties, peroxidases can be classified into haem peroxidase and non-haem peroxidase [2]. Haem peroxidases, which are characterized by the presence of a prosthetic heme group, are further subdivided into animal-type and non-animal-type subgroups. Notably, non-animal haem peroxidases are further classified into three distinct classes: Class I peroxidases (intracellular enzymes), Class II peroxidases (extracellular fungal enzymes), and Class III peroxidases (plant secretory peroxidases) [3]. Class III peroxidases (EC 1.11.1.7) are plant-specific oxidoreductases, also known by several abbreviations, including PER, POD, POX, Prx, and Px [4,5]. To maintain nomenclatural consistency, we refer to them exclusively as POD throughout this study. It is important to note that peroxiredoxins (Prx; EC 1.11.1.15), despite some overlapping abbreviations, represent an evolutionarily distinct protein family, and are not included in our analysis.
The functions of the POD genes have been extensively characterized in numerous studies, demonstrating their crucial roles in plant growth, development, and responses to various stresses. For instance, PODs have been documented to participate in a wide range of biological processes, including seed germination [6], root elongation [7], pollen development [8], fruit ripening [9], cell wall metabolism [10], lignification [11,12], reactive oxygen species (ROS) generation and scavenging [13,14], and phytohormone metabolism [15,16]. In addition, PODs play pivotal roles in plant defense against diverse abiotic stressors, such as drought [17], salinity [18], and low temperature [19], and biotic stressors, such as bacterial and fungal pathogens [20,21]. Notably, PODs have been implicated in the regulation of the anthocyanin metabolism, particularly in the degradation of anthocyanins [22]. In Brunfelsia calycina, BcPOD1 was presented in the vacuoles of deeply purple pigmented petals, where its expression led to the degradation of anthocyanin [23]. In the strawberry, FaPOD27 has been closely associated with anthocyanin degradation in the fruit [24]. High temperatures have been shown to induce the expression of PODs in the grapevine and in Malus profusion, leading to enhanced anthocyanin degradation [25,26].
The radish (Raphanus sativus L.) is an important root vegetable crop, extensively cultivated across Asia, Europe, and North America [27]. Through prolonged natural selection and artificial domestication processes, numerous radish cultivars with distinct taproot coloration have been systematically developed. Certain radish cultivars develop red or purple taproots owing to anthocyanin accumulation. Radish-derived anthocyanins exhibit remarkable thermal stability and potent anti-oxidant capacity, and have been extensively utilized as natural pigments in food processing, pharmaceutical manufacturing, and chemical industries. Therefore, research on radish anthocyanins has received growing attention [28,29]. The metabolic pathway of radish anthocyanins begins with the synthesis of the leucoanthocyanidin backbone using phenylalanine. Subsequently, this backbone undergoes glycosylation, and potentially methylation or acylation modifications, to form stable anthocyanins. The modified anthocyanins are subsequently transported into vacuoles for storage. In the acidic environment of the vacuole, anthocyanins exhibit different colors. Finally, polyphenol oxidase (PPO) or POD catalyze the oxidation and decomposition, completing the metabolic process. Currently, related genes for the synthesis and regulation of radish anthocyanins have been cloned [30,31], but research on the degradation of radish anthocyanins is still relatively scarce. The ‘Xinlimei’ radishes, a group of cultivars specific to China and distinguished by their red-to-purple root flesh and high anthocyanin content [32], serve as a valuable model for investigating the relationship between the anthocyanin metabolism and the POD activity. To date, the POD family members have been identified in numerous species, including 73 in Arabidopsis [33], 138 in rice [34], 91 in cassava [35], 102 in potato [36], 75 in carrot [37] and 109 in Brassica napus [38]. However, a genome-wide analysis of this gene family in the radish has not yet been reported.
This study presents the first comprehensive identification of all POD family members in the radish, accompanied by systematic analyses of their gene structure, evolutionary history, and functional diversification. A chimeric-colored radish mutant of ‘Xinlimei’ was employed to investigate the relationship between the anthocyanin metabolism and the POD activity in the taproot. Through a transcriptome analysis, a number of candidate POD genes potentially associated with anthocyanin degradation were identified. These findings establish a genome-wide framework of the POD members in the radish, and lay the foundation for subsequent functional studies on the specific PODs that may modulate the anthocyanin metabolism in this species.
2. Result
2.1. Identification and Characterization of the RsPODs
To comprehensively and accurately identify the POD genes in the radish, BLAST and hidden markov model (HMM)-based methods were employed using the previously reported Arabidopsis POD genes (AtPODs) as queries [33]. After filtering, 95 POD genes were identified from the radish genome and were designated as RsPOD1 to RsPOD95 based on their chromosomal positions (Figure S1). The RsPODs are unevenly distributed across nine chromosomes, with each chromosome containing 5 to 21 genes. Subsequently, the physicochemical properties of the RsPOD proteins were analyzed (Table S1). The RsPOD proteins range in length from 205 (RsPOD79) to 401 (RsPOD18) amino acids, with the molecular weight (MW) ranging from 22.35 to 44.56 kDa. The isoelectric point (pI) falls between 4.49 (RsPOD51) and 10.64 (RsPOD49), with 36 RsPODs classified as acidic proteins (pI < 7) and 59 as basic proteins (pI > 7). The grand average of hydropathicity (GRAVY) of most RsPODs was below 0, suggesting that the majority are hydrophilic proteins. Subcellular localization predictions revealed diverse cellular compartmentalization, with 41 RsPODs localized in the chloroplast, 25 in the extracellular space, 12 in the vascular membrane, 9 in the cytoplasm, 3 in the nucleus, 3 in the plasma membrane, and 2 in the endoplasmic reticulum. The structural diversity observed in the predicted three-dimensional models of the RsPOD proteinssuggests potential functional redundancy and sub/neo-functionalization among these genes in the radish (Figure S2).
2.2. Phylogenetic Relationship of the RsPODs
To further elucidate the evolutionary relationship of POD proteins, a maximum likelihood phylogenetic tree was constructed using MEGA11 software, incorporating 168 PODs from two species: 95 from R. sativus and 73 from Arabidopsis thaliana, based on their protein sequences. Based on the evolutionary divergence, the phylogenetic tree was divided into six subgroups (Figure 1). A phylogenetic analysis revealed that the POD proteins exhibited an uneven distribution across each subgroup. The largest subgroups, III and VI, consist of 21 and 22 RsPOD members, respectively, whereas the smallest subgroups, I and II, contain 10 and 11 RsPOD members, respectively. Subgroups IV and V are composed of 18 and 13 RsPOD members, respectively.
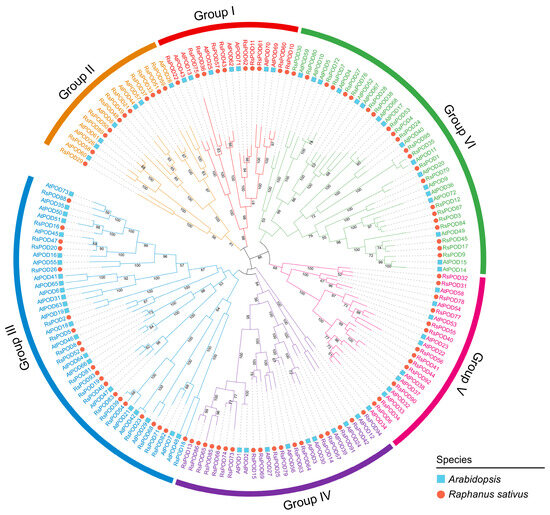
Figure 1.
Phylogenetic analysis of POD proteins in R. sativus and A. thaliana. The PODs were divided into six subgroups (group I, II, III, IV, V, and VI). The blue squares and red circles represent the POD proteins in A. thaliana and R. sativus, respectively.
2.3. Motif and Structural Analysis of the RsPODs
Gene structure, coupled with their constituent motifs and domains, is often closely associated with gene function. To investigate the motif compositions among the RsPOD proteins, conserved motifs were analyzed using the Multiple EM for Motif Elicitation (MEME) online tool in accordance with the phylogenetic relationship, by which, a total of 12 conserved motifs were identified (Table S2). These conserved motifs were then annotated using the InterProScan 5 online platform. Four motifs (motifs 1–4) were identified as peroxidase domains, whereas the other motifs (motifs 5–12) had no known functional annotation. As shown in Figure 2A, most RsPODs within the same subgroup share similar motif composition and arrangement, with the exceptions including RsPOD75 in subgroup I, RsPOD67 and RsPOD79 in subgroup IV, RsPOD6 in subgroup V, and RsPOD27 and RsPOD84 in subgroup VI. To gain further insights into the evolutionary patterns of the RsPOD family, exon–intron structures in the RsPOD genes were analyzed. The gene structures and the location of the peroxidase domains are shown in Figure 2B. Most RsPODs contain three or four exons, while RsPOD39, RsPOD54 and RsPOD84 exhibit the most complex gene structures, each containing five exons. By contrast, RsPOD71 and RsPOD82 have the fewest exons, with only two. Additionally, RsPOD73 and RsPOD92 show intron insertion within the 5′ untranslated region (UTR) of the gene. In conclusion, the consistency of the phylogenetic relationships, the conserved motif patterns, and the gene structures supports the conserved gene organizations within the subgroups, and suggests that the RsPOD gene functions may have diversified and become more complex during evolution.
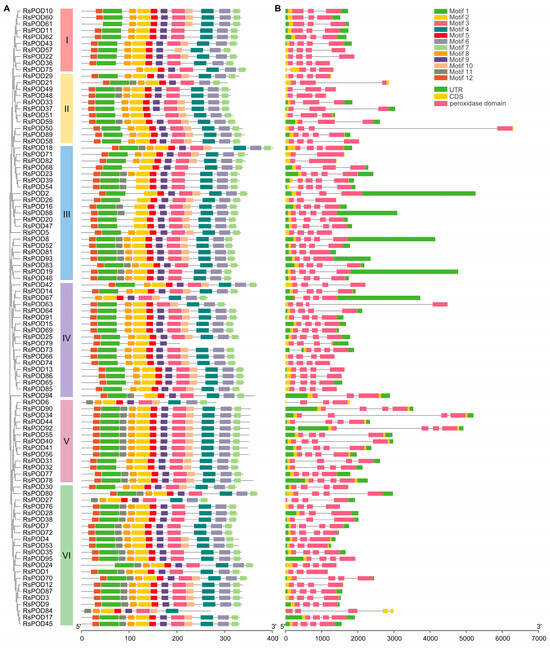
Figure 2.
Conserved motifs and exon–intron structure analysis of the RsPODs. (A) The phylogenetic tree shows that the RsPODs are distributed in six groups (I–VI), which are indicated by red, yellow, blue, purple, pink, and green, respectively. Boxes with different colors represent different motifs. (B) The exon–intron structures of the RsPODs. The green, yellow, and pink boxes represent the UTR, CDS, and peroxidase domain, respectively. The size of the RsPOD members is indicated by the scales at the bottom.
2.4. Collinearity Analysis of the RsPODs
Plant genomes are frequently subject to gene family expansion events throughout evolutionary trajectories and domestication processes. To understand the expansion events of the RsPODs in the radish, an intraspecific collinearity analysis was conducted. Genome duplication events within R. sativus were investigated using TBtools-II software. As shown in Figure 3A, 47 collinear gene pairs were identified across 9 chromosomes with uneven distribution patterns, including 7 tandem and 40 segmental duplication events. For instance, RsPOD31 and RsPOD32 (RsPOD40 and RsPOD41) likely originated from tandem duplication events, and RsPOD15 and RsPOD25 (RsPOD33 and RsPOD37) likely originated from segmental duplication events. Chromosomes Rs01 and Rs02 contained the highest number of duplicated genes, suggesting that they play a major role in the expansion of the RsPOD family in the radish. Furthermore, the 47 RsPOD gene pairs were analyzed by calculating their non-synonymous (Ka) and synonymous (Ks). The substitution ratios (Ka/Ks) of all gene pairs were below 1 (Table S3), indicating these genes have undergone purifying selection during the evolution and domestication processes.
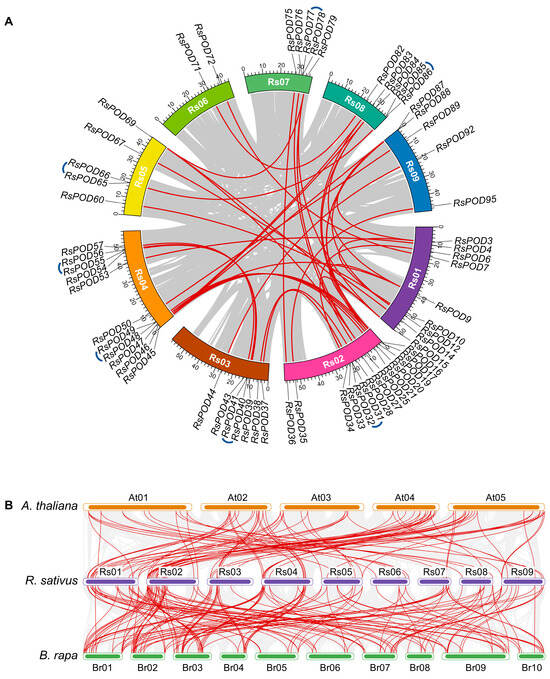
Figure 3.
Collinearity analysis of the RsPODs. (A) Intraspecific collinearity analysis of the RsPODs in the radish. Different chromosomes are shown in different colors. Approximate positions of the RsPODs are marked with black lines on the chromosomes. Red and blue curves indicate segmental and tandem duplication events of the RsPODs, respectively. (B) Interspecific collinearity analysis of PODs in A. thaliana, R. sativus, and B. rapa. Red curves indicate the gene pairs of PODs in three species.
Syntenic relationships of the conserved chromosomal segments across divergent species provide critical evidence for elucidating the evolutionary origins of gene family members. To further comprehend the evolutionary dynamic of the PODs in the radish and other species, an interspecific collinearity analysis was conducted among three cruciferous plants (A. thaliana, R. sativus, and Brassica rapa). A total of 76 RsPODs were identified in 93 colinear blocks with 54 A. thaliana genes, and 79 RsPODs in 157 colinear blocks with 88 B. rapa genes (Figure 3B and Table S4). The greater number of collinear blocks between B. rapa and R. sativus compared to those between A. thaliana and R. sativus suggests a closer evolutionary relationship between B. rapa and R. sativus. Among these, 74 RsPODs were syntenic across all three species, suggesting these genes may play conserved and crucial roles throughout the evolution of cruciferous plants.
2.5. cis-Acting Elements in the RsPODs
cis-acting elements, located within the promoter region upstream of the gene transcription start site, are essential for gene expression. To explore the potential function of the RsPODs, a comprehensive analysis of cis-elements in the 2000 bp promoter region of the RsPODs was conducted using the PlantCARE online platform. A total of 2172 cis-elements were predicted in the promoter region of the RsPODs (Table S5), and are visualized in Figure 4. Among them, RsPOD82 contained the largest number of cis-elements (45), while RsPOD78 had the least number of cis-elements (2). All cis-elements were classified into three major functional categories. The first category, the hormone response element (687), consisted of abscisic acid (ABA) responsiveness (192, 27.95%), gibberellin (GA) responsiveness (93, 13.54%), auxin (IAA) responsiveness (117, 17.03%), methyl jasmonate (MeJA) responsiveness (248, 36.10%), and salicylic acid (SA) responsiveness (37, 5.38%). Almost all RsPOD promoters contain multiple ABA responsiveness (ABRE) and MeJA-responsiveness (CGTCA-motif and TGACG-motif), suggesting that they may respond to specific hormones in a rapid and robust way. The second category, the growth and development element (976), consisted of circadian control (28, 2.87%), endosperm expression (21, 2.15%), light responsive element (887, 90.88%), and meristem expression (40, 4.10%). Light responsive elements (e.g., ACE, GT1-motif, Box 4) were highly abundant in nearly all RsPOD promoters, while circadian control (circadian), endosperm expression (GCN4_motif), and meristem expression (CAT-box) were relatively scarce. The third category, the stress response element (509), consisted of anaerobic induction (231, 45.38%), defense and stress responsiveness (69, 13.56%), drought inducibility (84, 16.50%), low-temperature responsiveness (63, 12.38%), and wound responsiveness (62, 12.18%). Anaerobic induction elements (ARE) were ubiquitously present in the RsPOD promoters, while defense and stress responsiveness (TC-rich repeats), drought inducibility (DRE core and MBS), low-temperature responsiveness (LTR), and wound responsiveness (WUN-motif) were present in only certain members. For instance, RsPOD62 contained four drought inducibility elements and RsPOD69 had nine low-temperature responsiveness elements, suggesting they play distinct roles in stress responses. These findings suggest that the RsPODs play critical roles in plant growth and development, hormone signaling, and stress tolerance.
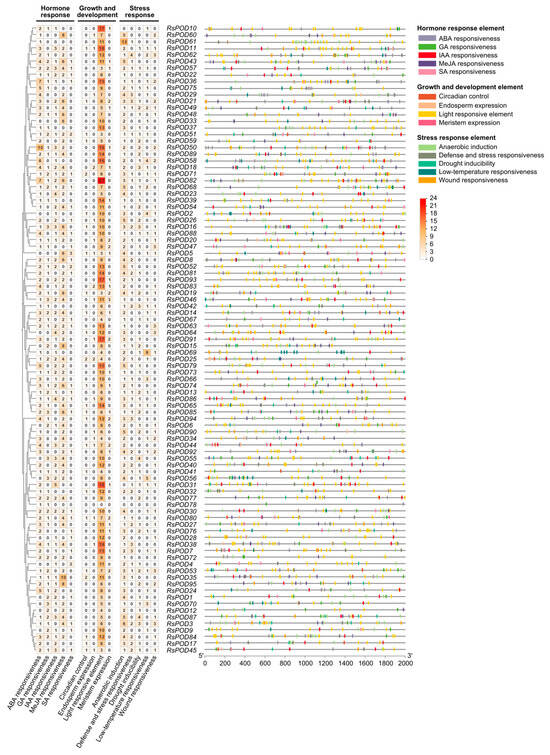
Figure 4.
cis-element analysis in the promoter region of the RsPODs. The cis-elements were grouped according to their functional implications. The left heatmap shows the number of elements in each promoter. The distribution of these elements in the promoter region is shown on the right. Different elements are represented with different colored boxes.
2.6. Prediction Analysis of the RsPOD-Mediated Regulatory Network
PODs are typically regulated by transcription factors (TFs) and interact with other proteins to execute their physiological roles. To elucidate the transcriptional regulatory networks and underlying mechanisms governing the RsPODs in the radish, we systematically predicted TF binding sites within the promoter regions of the RsPOD genes using the PlantRegMap online tool. A subsequent analysis identified 748 binding sites corresponding to 23 distinct TF families, representing the putative regulatory elements of the RsPODs (Table S6). As shown in Figure 5A, RsPOD56 contained the highest number of regulatory sites (44), followed by RsPOD61 (34), RsPOD38 (24), and RsPOD91 (23). Furthermore, we prioritized the top 10 TF families based on interaction frequency, including the Dof (122), B3 (90), BPC (90), MADS (85), AP2 (75), GRAS (54), ERF (51), C2H2 (46), MYB (36), and SRS (35) families, and mapped their predicted regulatory interactions with specific RsPODs (Figure 5B). These TF families exhibited significant enrichment, suggesting their putative regulatory roles in modulating RsPOD transcription. In addition, a protein–protein interaction (PPI) network for the RsPOD proteins was constructed using the STRING database (Figure 5C). The RsPODs appeared to function by forming heterodimers with other members within their family, but no interactions were observed with the protein from other families. Notably, RsPOD33 and RsPOD37 exhibited the highest number of interactions with other RsPODs (16), whereas RsPOD10, RsPOD20, RsPOD47 and RsPOD60 were found to exclusively interact with only 4 distinct RsPODs.
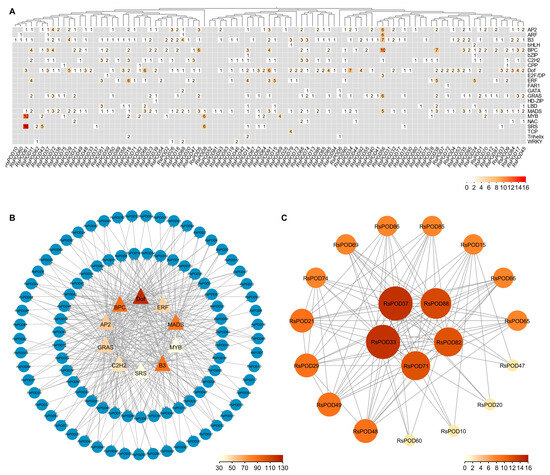
Figure 5.
Regulatory network of the RsPODs. (A) Heatmap showing the number of TF binding sites in promoter regions of the RsPODs. (B) The top 10 highly enriched TFs and their targeted RsPODs. Triangle and circle nodes represent TFs and their targeted RsPODs, respectively. The node color represents the number of TFs. (C) Functional interaction networks of the RsPOD proteins. The node color represents the number of proteins.
2.7. Expression Profiles of the RsPODs in Different Tissues
To explore the potential biological functions of the RsPODs in the radish, their expression patterns in five different tissues and five representative developmental stages of roots were analyzed using RNA-seq data from the previous studies [32,39]. A heatmap was constructed based on the fragments per kilobase of transcript per million fragments mapped reads (FPKM) values of the RsPODs (Figure 6). The RsPODs showed differential expression across various tissues and developmental stages. Among them, RsPOD23 was highly expressed across all tissues and stages, while RsPOD29 and RsPOD66 were not expressed in any. In addition, several RsPODs exhibited tissue- or stage-specific expression patterns. For instance, RsPOD24, RsPOD38, and RsPOD70 were highly expressed in the flower; RsPOD10, RsPOD45, RsPOD55, and RsPOD76 were highly expressed in the callus; RsPOD34, RsPOD45, RsPOD55, and RsPOD76 were highly expressed in the ESS and SS stages; RsPOD40, RsPOD41, and RsPOD94 were highly expressed in the EES, RES and SS stages. These findings suggest that the RsPODs display diverse expression patterns, indicating their important roles in radish development.
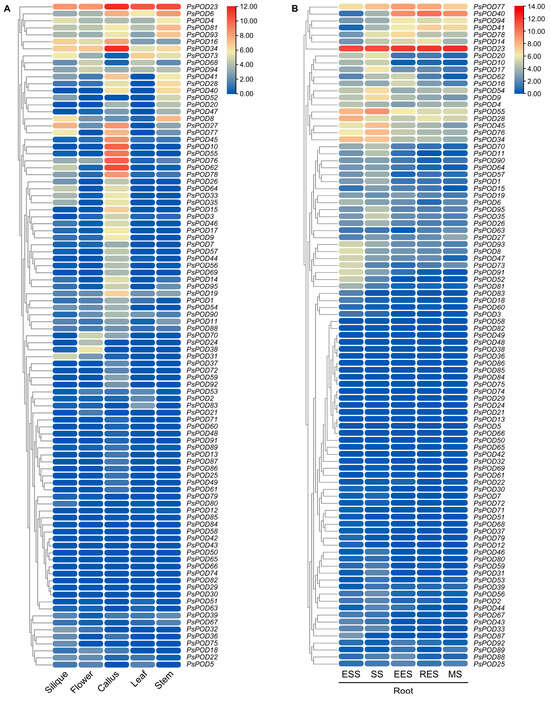
Figure 6.
Expression analysis of the RsPODs in different tissues based on RNA-seq data. (A) Expression analysis of the RsPODs in five tissues, including the silique, flower, callus, leaf, and stem. (B) Expression analysis of the RsPODs in five root developmental stages. ESS, seedling stage; SS, splitting stage; EES, early expanding stage; RES, rapid expanding stage; MS, mature stage. The expression levels are calculated by log2 (FPKM + 1) values.
2.8. RNA-Seq Analysis in the Radish
To investigate the anthocyanin metabolism in the radish, a chimeric-colored radish mutant derived from a purple skin and purple flesh ‘Xinlimei’ cultivar was selected for further analysis. This mutant exhibited a dichotomous phenotype, with half of the root skin and flesh tissue displaying purple pigmentation and the other half showing green pigmentation (Figure 7A,B). Comparative analyses were conducted to measure the anthocyanin content and POD enzyme activity across distinct tissue sectors. The results demonstrate that the purple skin (PS) and purple flesh (PF) sectors contained significantly higher anthocyanin content compared to the green skin (GS) and green flesh (GF) (Figure 7C). Conversely, the POD activity levels in the PS and PF were markedly lower than those detected in the GS and GF tissues (Figure 7D).
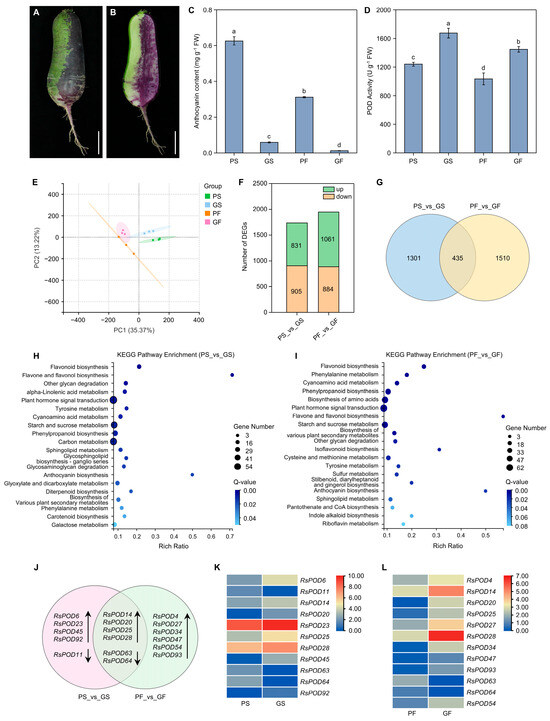
Figure 7.
Transcriptome analysis of the chimeric-colored radish. (A,B) Phenotype of the chimeric-colored radish taproot. Scale bar = 5 cm. (C,D) The anthocyanin content and POD activity in four different tissues. Data are presented as a mean ± SD (n = 3). Different letters indicate statistically significant differences (one-way ANOVA followed by post hoc Tukey test; p < 0.05). PS, purple skin; GS, green skin; PF, purple flesh; GF, green flesh. (E) PCA of all genes identified from the PS, GS, PF, and GF. (F) The number of DEGs in the PS vs. GS and the PF vs. GF. (G) Venn diagrams of the DEGs of cross-comparisons between the PS vs. GS and the PF vs. GF. (H,I) KEGG enrichment analysis of the DEGs in the PS vs. GS and the PF vs. GF comparison, respectively. (J) Venn diagram of differentially expressed RsPODs found in the different tissues. (K,L) Heatmap shows the expression of differentially expressed RsPODs in skin and flesh, respectively. The expression levels are calculated by log2 (FPKM + 1) values.
Subsequently, an RNA-seq analysis was conducted. The root skin and root flesh with different colors were collected separately. Samples were obtained from three individual plants separately, and subjected to independent transcriptome sequencing. Each sample generated over 2.0 Gb of clean reads per sample group. More than 89% of the bases had Phred quality scores above 30 (Q30), and the alignment rate to the reference genome exceeded 94%, confirming high sequencing quality and reliability for downstream processes (Table S7). A principal component analysis (PCA) revealed distinct clustering of the PS, GS, PF, and GF, with PC1 and PC2 accounting for 35.37% and 13.22% of the variance, respectively (Figure 7E). A total of 1736 differentially expressed genes (DEGs) were identified between the PS and the GS, including 831 upregulated and 905 downregulated genes. The comparison between the PF and the GF revealed 1945 DEGs, comprising 1061 upregulated and 884 downregulated genes (Figure 7F). Notably, 435 common DEGs were shared between these two comparative pairs (Figure 7G and Table S8). Then, a KEGG pathway enrichment analysis was performed to identify the functional roles of the DEGs in both comparative pairs. As shown in Figure 7H,I, PS vs. GS and PF vs. GF exhibited similar metabolic patterns. In the PS vs. GS comparison, the most enriched pathways were the plant hormone signal transduction, the carbon metabolism, and the starch and sucrose metabolism, with flavone and flavonol biosynthesis, anthocyanin biosynthesis, and flavonoid biosynthesis displaying the highest rich ratios. Similarly, in the PF vs. GF comparison, the DEGs were most enriched in the plant hormone signal transduction, the biosynthesis of amino acids, and the starch and sucrose metabolism, with flavone and flavonol biosynthesis, anthocyanin biosynthesis, and isoflavonoid biosynthesis showing the highest ratios.
2.9. Potential Roles of the RsPODs in the Anthocyanin Metabolism
To explore the regulatory role of the RsPOD genes in the anthocyanin metabolism in the radish, we identified the RsPODs among the DEGs of two comparative pairs from the RNA-seq data. In the PS vs. GS comparison, eleven differentially expressed RsPOD genes were detected, with eight exhibiting upregulation in the GS (Figure 7J,K). In the PF vs. GF comparison, twelve RsPOD genes were identified as DEGs, with ten upregulated in the GF (Figure 7I,J). Six RsPOD genes were common DEGs in both comparisons; among these, four (RsPOD14, RsPOD20, RsPOD25, and RsPOD28) were upregulated in both the GS and the GF. These results indicate that most differentially expressed RsPOD genes exhibited higher expression levels in the green tissues than in the purple tissues. Notably, RsPOD14, RsPOD20, RsPOD25, and RsPOD28 were potentially involved in anthocyanin degradation in both the skin and the flesh tissues.
2.10. Co-Expression Network of the RsPODs in the Anthocyanin Metabolism
To elucidate the co-expression network between the RsPOD genes and the related genes, a weighted gene co-expression network analysis (WGCNA) was performed using the RNA-seq data from the chimeric-colored radish mutants. After filtering, 20,877 genes were retained and grouped into 13 modules (MEs), comprising 12 distinct co-expression networks. The module sizes ranged from 244 (MEtan) to 9740 (MEturquoise), with outliers assigned to the unclustered MEgrey module (Figure 8A). To identify the modules significantly associated with anthocyanin content, the module-trait correlations were analyzed (Figure 8B). Anthocyanin content exhibited significant negative correlations with MEpurple (R = −0.73) and MEblue (R = −0.82). RsPOD14 and RsPOD28 were found to belong to MEpurple, while RsPOD54 was assigned to MEblue (Figure 8C,D). Notably, RsPOD14 and RsPOD28 were common DEGs in both the PS vs. GS and the PF vs. GF comparisons, while RsPOD54 was a DEG in the PF vs. GF comparison (Figure 7J). Genes co-expressed with these three RsPODs (Spearman correlation coefficient, |SCC| > 0.80) were screened and visualized for further analysis (Table S9). As shown in Figure 8E–G, one TF (TIFY7) is co-expressed with RsPOD14, five TFs (BED, BEE2, CPC, MYB4, and TIFY10) are co-expressed with RsPOD28, and eight TFs (ARF17, bZIP63, MYB114, RAP2-12, NAC79, NAC82, NAC86, and WRKY12) are co-expressed with RsPOD54. These results indicate that RsPOD14, RsPOD28, and RsPOD54 are closely associated with anthocyanin degradation. The TFs co-expressed with these RsPOD genes may participate in the anthocyanin metabolism by regulating their expression.
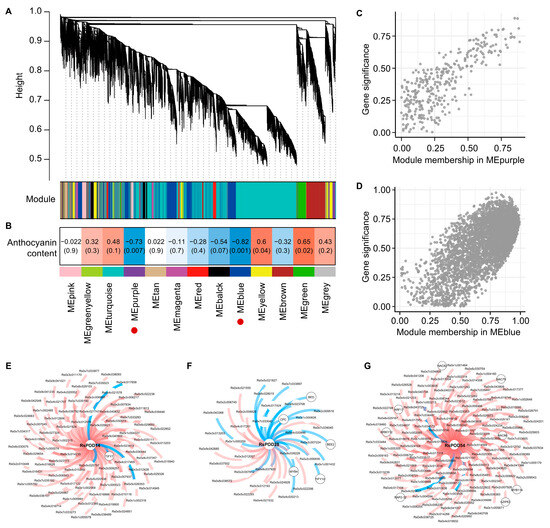
Figure 8.
Co-expression network analysis of the RsPODs and the related genes based on the RNA-seq data. (A) Hierarchical cluster tree revealing gene co-expression modules identified by the WGCNA. The branches contain 13 modules labeled in different colors. (B) Module-trait associations. The correlation between the two is shown in the cell by the Spearman correlation coefficient, and the p-value is in parentheses. Cell color ranges from red (high positive correlation) to blue (high negative correlation). The red circles indicate that these module have a significant negative correlation with the anthocyanin content. (C,D) Correlation analysis between module membership (MM) and gene significance for genes in the MEpurple and MEblue, respectively. For each grey (unsorted) gene point, absolute values were computed for both MM and gene significance. (E–G) Co-expression network of RsPOD14 and RsPOD28 in MEpurple, as well as RsPOD54 in MEblue, respectively. Transcription factors are encircled within gray circles, with red lines indicating positive correlations and blue lines indicating negative correlations.
2.11. RT-qPCR Analysis of the RsPODs
To verify the reliability of the transcriptome data, seven RsPOD genes were selected to assess their expression levels by RT-qPCR. These genes included RsPOD14, RsPOD20, RsPOD25, RsPOD28, RsPOD63, and RsPOD64, which were identified as common DEGs in both the PS vs. GS and the PF vs. GF comparisons, as well as RsPOD14, RsPOD28, and RsPOD54, which were selected based on WGCNA. The RT-qPCR results showed that the expression patterns of these selected RsPODs were highly consistent with the RNA-seq data, thereby confirming the accuracy and reproducibility of the transcriptomic data (Figure 9). Subsequently, a correlation analysis was performed to investigate the relationship between the expression levels of the selected RsPOD genes and the POD enzyme activity (Table S10). The results showed that the POD enzyme activity was significantly positively correlated with the expression of RsPOD20, RsPOD25, and RsPOD28, whereas it was significantly negatively correlated with the expression of RsPOD63.
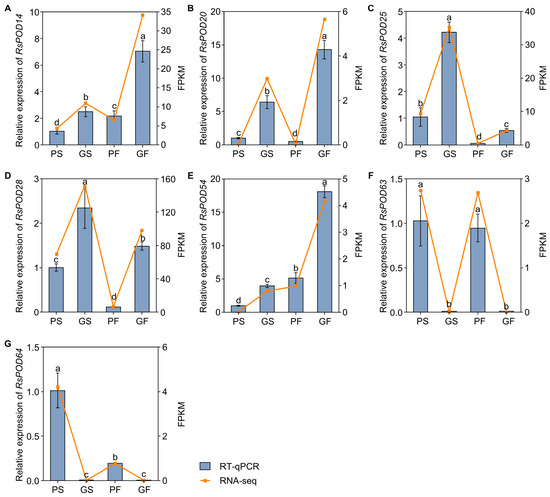
Figure 9.
Validation of the selected RsPODs by RT-qPCR. (A–G) The expression levels of selected RsPODs in different tissues. The radish RsACTIN gene was used as an internal control. The yellow broken line represents the FPKM of RNA-seq; the gray histogram represents the relative mRNA expression determined by qRT-PCR. The data are presented as the mean ± SD (n = 3). The different lowercase letters indicate statistically significant differences as determined by one-way ANOVA followed by Tukey’s post hoc test; p < 0.05.
3. Discussion
Class III peroxidases exhibit multifunctional roles in plant metabolic and physiological processes [1,2,3]. PODs have been extensively characterized in diverse plant species, such as Arabidopsis [33], rice [34], cassava [35], potato [36], carrot [37], and B. napus [38]. However, the biological functions of numerous RsPODs and their underlying regulatory mechanisms remain largely unexplored. Therefore, a comprehensive genome-wide identification and an analysis of the RsPOD genes is imperative for enhancing our understanding of their functional roles and the molecular mechanisms in the radish. In this study, utilizing the reference radish genome published by Zhang et al. [27], we identified 95 RsPODs. By contrast, only 73 POD homologs have been characterized in Arabidopsis (Figure S1). A phylogenetic analysis classified POD proteins from both the radish and Arabidopsis into six distinct subgroups (Figure 1). The similar distribution of PODs across the subgroups in both species supports the notion of evolutionary conservation within the plant POD family.
Genomic structure is typically conserved during plant evolution and domestication [40]. In our study, as shown in Figure 2, the RsPODs displayed conserved motif compositions and gene structures. The majority of the RsPODs contain three to four exons; however, there are a few that exhibit variations in the intron–exon structure. For instance, RsPOD39, RsPOD54, and RsPOD84 contain five exons, whereas RsPOD71 and RsPOD82 contain only two exons. These alterations in the exon–intron structure may endow these genes with unique functional capabilities, enabling their participation in a range of biological processes. Gene duplication is a main driver of gene evolution and expansion [41,42]. In the radish, we observed 7 tandem duplications and 40 segmental duplications (Figure 3A), indicating that segmental duplication is the primary factor contributing to the expansion of the RsPODs in the radish. An analysis of the selection pressure on duplicated RsPODs suggests that they have undergone purifying selection during the evolution or domestication processes (Table S3). These findings are consistent with the results observed in maize [43], potato [36], Litchi [44], and B. napus [38]. Furthermore, 74 homologous POD genes were found to be conserved across A. thaliana, R. sativus, and B. rapa (Figure 3B and Table S4), suggesting that these genes possess similar functions and regulatory mechanisms, and play a pivotal role in the evolutionary trajectory of the POD family.
cis-acting elements located in the promoter region are closely linked to gene function [45,46]. In the promoter region of the RsPODs, we identified cis-elements involved in hormone responses, growth and development, as well as defense and stress responses (Figure 4), highlighting the functional complexity of the RsPODs. Although most RsPODs share conserved gene structures and motifs, their cis-elements exhibit distinct variations, possibly due to long-term adaptation to environmental changes [47]. TFs regulate the transcription of downstream genes by binding to specific sites within the promoter region [48]. In our study, as shown in Figure 5A, a substantial number of TF binding sites were identified in the promoter regions of the RsPODs. Among these, Dof, B3, BPC, MADS, AP2, GRAS, ERF, C2H2, MYB, and SRS exhibited the highest binding densities (Figure 5B), suggesting these TFs play critical regulatory roles in modulating RsPOD-mediated physiological processes. Certain genes, such as RsPOD56, RsPOD61, RsPOD38, and RsPOD91, possess a large number of binding sites in their promoters, indicating more complex transcriptional regulatory mechanisms [49]. The expression profiles of the RsPODs across different tissues and developmental stages of the radish revealed spatiotemporally specific expression patterns (Figure 6), indicating their sustained activity throughout the radish development.
Peroxidases are known to participate in the anthocyanin metabolism, particularly in degradation processes [22]. However, the role of the RsPOD genes in the degradation of anthocyanins in the radish remains poorly understood. In our study, we utilized a chimeric-colored radish mutant derived from a purple skin and purple flesh ‘Xinlimei’ cultivar (Figure 7A,B). Due to its distinct green and purple taproot sectors, this mutant serves as an ideal model for studying the relationship between the anthocyanin metabolism and the POD activity. Our results found that, within the same tissue, the POD enzyme activity in the green parts was higher than the activity in the purple parts (Figure 7D), suggesting that elevated POD activity contributes to reduced anthocyanin accumulation in the radish. This observation is consistent with previous findings on the litchi, in which the reduced anthocyanin levels were associated with the increased POD activity during storage [50]. Moreover, the POD activity is closely associated with lignin biosynthesis, as peroxidases catalyze the final step of lignin formation [51]. In Arabidopsis, the functional loss of AtPOD2 or AtPOD25 has been shown to lead to a significant reduction in lignin content [11]. In the carrot, xylem exhibiting lower anthocyanin content contains higher lignin levels than phloem with higher anthocyanin content [37]. In the strawberry, the metabolic interaction between anthocyanin synthesis and lignin formation is related to peroxidase, and the increased FaPOD27 led to the transfer of anthocyanin to lignin in the strawberry fruits [24]. Consequently, the elevated POD enzyme activity observed in the green tissues of the radish (GS and GF) may potentially contribute to increased lignin accumulation, although further investigation is warranted to confirm this hypothesis.
A transcriptome analysis further revealed that four differentially expressed RsPODs, including RsPOD14, RsPOD20, RsPOD25, and RsPOD28, were upregulated in the green tissues compared to the purple tissues (Figure 7J). In addition, a WGCNA revealed that RsPOD14, RsPOD28, and RsPOD54 were significantly negatively correlated with the anthocyanin content. Among them, RsPOD14 and RsPOD28 were present in both the differentially expressed RsPODs and the WGCNA result. Therefore, RsPOD14 and RsPOD28 may serve as key candidate genes involved in the anthocyanin metabolism. Future research will focus on elucidating the precise functions and regulatory mechanisms of these RsPOD genes, which will greatly enhance our understanding of the molecular basis of the anthocyanin metabolism in the radish.
4. Materials and Methods
4.1. Plant Materials
The chimeric-colored radish mutant of ‘Xinlimei’, exhibiting a taproot with green and purple sectors (both skin and flesh), was used in this study. The seeds were planted in late August in the experimental field of the Institute of Vegetables, Shandong Academy of Agricultural Sciences, and were harvested 70 days after sowing. Root skin and root flesh with different colors were collected separately. Samples were obtained from three individual plants separately, and subjected to independent downstream analyses. All materials were frozen in liquid nitrogen and stored at −80 °C for further study.
4.2. Identification of the RsPODs
The chromosome-level radish genome ‘Xinlimei’ (Rs00) were retrieved from the National Genomics Data Center (BioProject PRJCA003033; https://ngdc.cncb.ac.cn/gwh/Assembly/9797/show, accessed on 19 December 2024) [27]. Two complementary methods were used to identify the POD genes from the radish genome. First, a complete set of AtPOD protein sequences in Arabidopsis was obtained from the Tair database (https://www.arabidopsis.org/, accessed on 19 December 2024), and used as queries to retrieve the radish genome by the BlastP method with an E-value threshold of ≤1 × 10⁻⁵ in TBtools-II software v2.1.5 [52]. Second, HMM profiling was performed using the conserved peroxidase domain (PF00141) from the InterPro database (https://www.ebi.ac.uk/interpro/, accessed on 20 December 2024) [53]. Subsequently, all putative RsPOD members were validated using the online Conserved Domain Database (https://www.ncbi.nlm.nih.gov/cdd/, accessed on 21 December 2024) [54]. Finally, the identified RsPOD genes were renamed according to their physical positions in the radish genome.
4.3. Characterization of the RsPODs
The genetic information of the RsPODs was obtained from the radish genome database using TBtools-II software. The coding protein characteristics of the RsPODs, including protein length, MW, pI, instability index (II), aliphatic index (AI), and GRAVY, were calculated using the ProtParam tool on the Expasy server (https://web.expasy.org/protparam/, accessed on 5 January 2025) [55]. The subcellular localization of the RsPOD proteins were predicted using the WoLF PSORT website (https://wolfpsort.hgc.jp/, accessed on 5 January 2025) [56]. The three-dimensional structure of the RsPOD proteins was predicted and visualized using the AlphaFold 3 model (https://alphafoldserver.com/, accessed on 6 January 2025) and PyMOL software v2.6.2 [57].
4.4. Phylogenetic Analysis of the PODs
The full-length protein sequences from R. sativus and A. thaliana were employed to construct the phylogenetic tree using MEGA11 software v11.0.13 [58]. The alignment of the POD proteins was performed using the ClustalW method in MEGA11. A phylogenetic analysis of the aligned sequences was performed with the maximum likelihood method, WAG+G+I model, and 1000 bootstrap replicates. The generated phylogeny was optimized and visualized through the Interactive Tree of Life (iTOL) platform (https://itol.embl.de/index.shtml, accessed on 8 January 2025) [59].
4.5. Conserved Protein Motifs and Gene Structures Analysis of the RsPODs
The conserved motifs of the RsPOD proteins were analyzed using the MEME online tool (https://meme-suite.org/meme/tools/meme, accessed on 10 January 2025) [60], with the maximum number of motifs setting to 12. The other settings were kept at the default values. Then, these 12 motifs were annotated using the InterProScan 5 online platform (https://www.ebi.ac.uk/jdispatcher/pfa/iprscan5, accessed on 10 January 2025) [61]. The conserved domains of the RsPOD proteins were detected using the Batch CD-Search online tool (https://www.ncbi.nlm.nih.gov/Structure/bwrpsb/bwrpsb.cgi, accessed on 10 January 2025) [54]. The conserved protein motifs and gene structures combined with the phylogenetic tree were visualized using TBtools-II software.
4.6. Gene Duplication and Collinearity Analysis
The following analyses were conducted utilizing the TBtools-II software. The duplication events of the RsPODs were analyzed using the One Step MCScanX module. Gene location and gene linear relationship on the respective chromosomes were visualized using the Amazing Super Circos module. The evolutionary relationship between the RsPODs and tandem replication and segmental replication were calculated using the Ka/Ks Calculator module. A collinearity analysis among R. sativus, A. thaliana, and B. rapa were performed and visualized using the One Step MCScanX module and Multiple Synteny Plot module.
4.7. cis-Regulatory Element Analysis of the RsPODs
The 2000 bp sequence upstream of the translation start sites of the RsPOD genes was extracted from the radish genome using TBtools-II software, and regarded as the promoter region. The cis-elements in the promoter regions were analyzed and visualized using the PlantCARE website (https://bioinformatics.psb.ugent.be/webtools/plantcare/html/, accessed on 17 January 2025) and TBtools-II software [62].
4.8. The RsPOD-Mediated Regulatory Network
The TF binding sites in the promoter regions of the RsPODs were analyzed using the PlantRegMap online tool (https://plantregmap.gao-lab.org/binding_site_prediction.php, accessed on 20 January 2025) with a p-value ≤ 1 × 10⁻⁵ [63], and visualized using TBtools-II software. The PPI network of the RsPOD proteins was analyzed using the STRING website (https://cn.string-db.org/, accessed on 21 January 2025) [64]. Arabidopsis served as the selected plant species in the preceding analysis. The network map was constructed utilizing Cytoscape v3.10.0 software.
4.9. Determination of Total Anthocyanin Content and Peroxidase Activity
The total anthocyanin contents (ADS-W-KY016) and peroxidase activities (ADS-F-KY003) of the tissues with different colors were measured using assay kits (Jiangsu Aidisheng Biological Technology Co., Ltd., Yancheng, China). The analysis was performed with three independent biological replicates.
4.10. Transcriptome Sequencing and Data Analysis
The transcriptome data of different tissues and developmental stages (ESS: 11 days; SS: 21 days; EES: 44 days; RES: 56 days; MS: 73 days) were acquired from the NCBI Sequence Read Archive (SRA) repository (PRJNA353559 and PRJNA413464) [32,39]. Transcriptome sequencing of the tissues of the chimeric-colored radish mutant was completed by BGI (Beijing Genomics Institute, Shenzhen, China). Root skin and root flesh with different colors were collected separately. Samples were obtained from three individual plants separately and subjected to independent transcriptome sequencing. Briefly, the total RNA was extracted using the modified CTAB method and quantified using a fragment analyzer or an Agilent 2100 Bioanalyzer (Agilent, Santa Clara, CA, USA), or Qseq-400 (Bioptic, New Taipei, China). Library preparation was performed using an Optimal Dual-mode mRNA Library Prep Kit (BGI-Shenzhen, China). Paired-end 100/150 bases reads were generated on the G400 platform (BGI, Shenzhen, China).
After removing the adapter sequences and low-quality reads, the high-quality clean reads were mapped to the reference genome of the radish using the HISAT v2.1.0 [65]. The transcriptome was assembled and quantified using the StringTie v2.1.7 [66]. The values of FPKM were calculated based on gene lengths. Differential gene expression between the samples was calculated using DEseq2 v1.22.1 [67], based on the original count data. Genes with |log1.5 fold change| ≥ 1 and Q-value ≤ 0.05 were regarded as DEGs.
4.11. Expression Analyses
Total RNA was extracted from the tissues with different colors using the TransZol Up Kit (TransGen Biotech Co., Ltd., Beijing, China). An All-in-one First Strand cDNA Synthesis Kit Ⅱ (Sevenbio, Beijing, China) was used to synthesize cDNA from the total RNA. Reverse transcription quantitative PCR (RT-qPCR) was performed using a CFX96 TouchTM real-time PCR system (Bio-Rad Laboratories, Hercules, CA, USA) and TB Green® Premix Ex Taq™ II (RR82WR; Takara Biotechnology (Dalian) Co., Ltd., Dalian, China), according to the manufacturer’s protocol. The radish RsACTIN gene was used as the internal control. The expression levels were calculated using the comparative CT method [68]. The analysis was performed with three independent biological replicates. The primers used for the expression analysis are listed in Table S11.
4.12. WGCNA Analysis
Transcriptome data from the chimeric-colored radish mutant and the WGCNA package were employed to construct a weighted gene co-expression network [69]. After filtering out genes with total FPKM values below 5 across all samples, normalizing the data via variance-stabilizing transformation (VST), and removing genes exhibiting zero median absolute deviation (MAD), the remaining genes were employed in subsequent analyses. The pickSoftThreshold function determined the soft power (β = 6) based on the scale-free topology criterion. An adjacency matrix was then generated using this soft threshold. Weighted co-expression modules were identified via the blockwiseModules function with the parameters power = 6, TOMType = unsigned, minModuleSize = 50, mergeCutHeight = 0.3, and the default settings for other parameters. Module-trait associations were assessed by calculating the Spearman correlation coefficients and p-values between module eigengenes and target traits. Within selected modules, pairwise correlations between the RsPODs and candidate genes were computed (Spearman correlation coefficient, |SCC| > 0.80), and the resulting co-expression network was visualized using Cytoscape software.
4.13. Statistical Analysis
All data were analyzed using one-way ANOVA with SPSS Statistics v30.0.0 (IBM, New York, NY, USA). Data are shown as a mean ± standard deviation.
5. Conclusions
In this study, 95 RsPODs were identified from the radish and their basic characteristics were systematically analyzed. Based on their domain architectures and phylogenetic relationships, these genes were classified into six distinct subgroups. A genomic collinearity analysis revealed that segmental and tandem duplication events contributed to the expansion of the RsPOD gene family, and a Ka/Ks analysis indicated that these genes have been subject to purifying selection during evolution and/or domestication. Further analyses of cis-elements, TF binding sites, and expression profiles demonstrated that the RsPODs likely participate in radish development and a range of physiological processes. Notably, a transcriptome analysis of the chimeric-colored radish mutant identified four RsPODs (RsPOD14, RsPOD20, RsPOD25, and RsPOD28) associated with the anthocyanin metabolism. In summary, our work establishes a theoretical foundation for functional investigations of the RsPODs and provides candidate genes for elucidating the molecular mechanisms underlying the anthocyanin metabolism in the radish.
Supplementary Materials
The following supporting information can be downloaded at: https://www.mdpi.com/article/10.3390/ijms26135917/s1.
Author Contributions
S.W., C.L., and Z.W. conceived and designed the research. Z.W., W.F., X.L., W.X., and L.C. performed the experiments. Z.W., W.F., C.L., and L.C. analyzed the data. Z.W. and W.F. wrote the paper. S.W. and C.L. revised the paper. All authors have read and agreed to the published version of the manuscript.
Funding
This work was supported by the Modern Agricultural Industrial Technology System Funding of Shandong Province, China (SDAIT-05), the Prospect of Shandong Seed Project, China (2022LZGC008, 2022LZGCQY013, 2024LZGC014), the Projects of 20 Rules for New Universities in Jinan, China (202228092), and Shandong Provincial Government Sponsored Study Abroad Program, China (201802015).
Institutional Review Board Statement
Not applicable.
Informed Consent Statement
Not applicable.
Data Availability Statement
All sequence data were deposited in the NCBI SRA under accession number PRJNA1255629.
Conflicts of Interest
The authors declare no conflicts of interest.
References
- Li, S.; Zheng, H.; Sui, N.; Zhang, F. Class III peroxidase: An essential enzyme for enhancing plant physiological and developmental process by maintaining the ROS level: A review. Int. J. Biol. Macromol. 2024, 283, 137331. [Google Scholar] [CrossRef]
- Kidwai, M.; Ahmad, I.Z.; Chakrabarty, D. Class III peroxidase: An indispensable enzyme for biotic/abiotic stress tolerance and a potent candidate for crop improvement. Plant Cell Rep. 2020, 39, 1381–1393. [Google Scholar] [CrossRef]
- Freitas, C.D.T.; Costa, J.H.; Germano, T.A.; Rocha, R.d.O.; Ramos, M.V.; Bezerra, L.P. Class III plant peroxidases: From classification to physiological functions. Int. J. Biol. Macromol. 2024, 263, 130306. [Google Scholar] [CrossRef] [PubMed]
- Hiraga, S.; Sasaki, K.; Ito, H.; Ohashi, Y.; Matsui, H. A large family of class III plant peroxidases. Plant Cell Physiol. 2001, 42, 462–468. [Google Scholar] [CrossRef] [PubMed]
- Almagro, L.; Gómez Ros, L.V.; Belchi-Navarro, S.; Bru, R.; Ros Barceló, A.; Pedreño, M.A. Class III peroxidases in plant defence reactions. J. Exp. Bot. 2009, 60, 377–390. [Google Scholar] [CrossRef]
- Jemmat, A.M.; Ranocha, P.; Ru, A.L.; Neel, M.; Jauneau, A.; Raggi, S.; Ferrari, S.; Burlat, V.; Dunand, C. Coordination of five class III peroxidase-encoding genes for early germination events of Arabidopsis thaliana. Plant Sci. 2020, 298, 110565. [Google Scholar] [CrossRef]
- Xu, X.; Liu, M.; Hu, Q.; Yan, W.; Pan, J.; Yan, Y.; Chen, X. A CsEIL3-CsARN6.1 module promotes waterlogging-triggered adventitious root formation in cucumber by activating the expression of CsPrx5. Plant J. 2023, 114, 824–835. [Google Scholar] [CrossRef] [PubMed]
- Jacobowitz, J.R.; Doyle, W.C.; Weng, J.K. PRX9 and PRX40 are extensin peroxidases essential for maintaining tapetum and microspore cell wall integrity during arabidopsis anther development. Plant Cell 2019, 31, 848–861. [Google Scholar] [CrossRef]
- Wang, C.; Chan, Y.; Shien, C.; Yeh, K. Molecular characterization of fruit-specific class III peroxidase genes in tomato (Solanum lycopersicum). J. Plant Physiol. 2015, 177, 83–92. [Google Scholar] [CrossRef]
- Francoz, E.; Ranocha, P.; Nguyen-Kim, H.; Jamet, E.; Burlat, V.; Dunand, C. Roles of cell wall peroxidases in plant development. Phytochemistry 2015, 112, 15–21. [Google Scholar] [CrossRef]
- Shigeto, J.; Itoh, Y.; Hirao, S.; Ohira, K.; Fujita, K.; Tsutsumi, Y. Simultaneously disrupting AtPrx2, AtPrx25 and AtPrx71 alters lignin content and structure in Arabidopsis stem. J. Integr. Plant Biol. 2015, 57, 349–356. [Google Scholar] [CrossRef] [PubMed]
- Cosio, C.; Ranocha, P.; Francoz, E.; Burlat, V.; Zheng, Y.; Perry, S.E.; Ripoll, J.J.; Yanofsky, M.; Dunand, C. The class III peroxidase PRX17 is a direct target of the MADS-box transcription factor AGAMOUS-LIKE15 (AGL15) and participates in lignified tissue formation. New Phytol. 2017, 213, 250–263. [Google Scholar] [CrossRef]
- Daudi, A.; Cheng, Z.; O’Brien, J.A.; Mammarella, N.; Khan, S.; Ausubel, F.M.; Bolwell, G.P. The apoplastic oxidative burst peroxidase in Arabidopsis is a major component of pattern-triggered immunity. Plant Cell 2012, 24, 275–287. [Google Scholar] [CrossRef]
- Zhang, H.; Wang, Z.; Li, X.; Gao, X.; Dai, Z.; Cui, Y.; Zhi, Y.; Liu, Q.; Zhai, H.; Gao, S.; et al. The IbBBX24–IbTOE3–IbPRX17 module enhances abiotic stress tolerance by scavenging reactive oxygen species in sweet potato. New Phytol. 2022, 233, 1133–1152. [Google Scholar] [CrossRef]
- Vatulescu, A.D.; Fortunato, A.S.; Sá, M.C.; Amâncio, S.; Ricardo, C.P.P.; Jackson, P.A. Cloning and characterisation of a basic IAA oxidase associated with root induction in Vitis vinifera. Plant Physiol. Biochem. 2004, 42, 609–615. [Google Scholar] [CrossRef] [PubMed]
- Herrero, J.; Esteban Carrasco, A.; Zapata, J.M. Arabidopsis thaliana peroxidases involved in lignin biosynthesis: In silico promoter analysis and hormonal regulation. Plant Physiol. Biochem. 2014, 80, 192–202. [Google Scholar] [CrossRef] [PubMed]
- Zhai, X.; Yan, X.; Zenda, T.; Wang, N.; Dong, A.; Yang, Q.; Zhong, Y.; Xing, Y.; Duan, H. Overexpression of the peroxidase gene ZmPRX1 increases maize seedling drought tolerance by promoting root development and lignification. Crop J. 2024, 12, 753–765. [Google Scholar] [CrossRef]
- Su, P.; Yan, J.; Li, W.; Wang, L.; Zhao, J.; Ma, X.; Li, A.; Wang, H.; Kong, L. A member of wheat class III peroxidase gene family, TaPRX-2A, enhanced the tolerance of salt stress. BMC Plant Biol. 2020, 20, 392. [Google Scholar] [CrossRef]
- Kumar, S.; Jaggi, M.; Sinha, A.K. Ectopic overexpression of vacuolar and apoplastic Catharanthus roseus peroxidases confers differential tolerance to salt and dehydration stress in transgenic tobacco. Protoplasma 2012, 249, 423–432. [Google Scholar] [CrossRef]
- O’Brien, J.A.; Daudi, A.; Finch, P.; Butt, V.S.; Whitelegge, J.P.; Souda, P.; Ausubel, F.M.; Bolwell, G.P. A peroxidase-dependent apoplastic oxidative burst in cultured Arabidopsis cells functions in MAMP-elicited defense. Plant Physiol. 2012, 158, 2013–2027. [Google Scholar] [CrossRef]
- Li, Q.; Qin, X.; Qi, J.; Dou, W.; Dunand, C.; Chen, S.; He, Y. CsPrx25, a class III peroxidase in Citrus sinensis, confers resistance to citrus bacterial canker through the maintenance of ROS homeostasis and cell wall lignification. Hortic. Res. 2020, 7, 192. [Google Scholar] [CrossRef] [PubMed]
- Zhao, Y.; Wang, C.; Huang, X.; Hu, D. Anthocyanin stability and degradation in plants. Plant Signal. Behav. 2021, 16, 1987767. [Google Scholar] [CrossRef] [PubMed]
- Zipor, G.; Duarte, P.; Carqueijeiro, I.; Shahar, L.; Ovadia, R.; Teper-Bamnolker, P.; Eshel, D.; Levin, Y.; Doron-Faigenboim, A.; Sottomayor, M.; et al. In planta anthocyanin degradation by a vacuolar class III peroxidase in Brunfelsia calycina flowers. New Phytol. 2015, 205, 653–665. [Google Scholar] [CrossRef] [PubMed]
- Ring, L.; Yeh, S.Y.; Hücherig, S.; Hoffmann, T.; Blanco-Portales, R.; Fouche, M.; Villatoro, C.; Denoyes, B.; Monfort, A.; Caballero, J.L.; et al. Metabolic interaction between anthocyanin and lignin biosynthesis is associated with peroxidase FaPRX27 in strawberry fruit. Plant Physiol. 2013, 163, 43–60. [Google Scholar] [CrossRef]
- Movahed, N.; Pastore, C.; Cellini, A.; Allegro, G.; Valentini, G.; Zenoni, S.; Cavallini, E.; D’Incà, E.; Tornielli, G.B.; Filippetti, I. The grapevine VviPrx31 peroxidase as a candidate gene involved in anthocyanin degradation in ripening berries under high temperature. J. Plant Res. 2016, 129, 513–526. [Google Scholar] [CrossRef]
- Rehman, R.N.U.; You, Y.; Zhang, L.; Goudia, B.D.; Khan, A.R.; Li, P.; Ma, F. High temperature induced anthocyanin inhibition and active degradation in Malus profusion. Front. Plant Sci. 2017, 8, 1401. [Google Scholar] [CrossRef]
- Zhang, X.; Liu, T.; Wang, J.; Wang, P.; Qiu, Y.; Zhao, W.; Pang, S.; Li, X.; Wang, H.; Song, J.; et al. Pan-genome of Raphanus highlights genetic variation and introgression among domesticated, wild, and weedy radishes. Mol. Plant 2021, 14, 2032–2055. [Google Scholar] [CrossRef]
- Wang, Q.; Wang, Y.; Sun, H.; Sun, L.; Zhang, L. Transposon-induced methylation of the RsMYB1 promoter disturbs anthocyanin accumulation in red-fleshed radish. J. Exp. Bot. 2020, 71, 2537–2550. [Google Scholar] [CrossRef]
- Tao, J.; Li, S.; Wang, Q.; Yuan, Y.; Ma, J.; Xu, M.; Yang, Y.; Zhang, C.; Chen, L.; Sun, Y. Construction of a high-density genetic map based on specific-locus amplified fragment sequencing and identification of loci controlling anthocyanin pigmentation in Yunnan red radish. Hortic. Res. 2022, 9, uhab031. [Google Scholar] [CrossRef]
- Lim, S.H.; Kim, D.H.; Kim, J.K.; Lee, J.Y.; Ha, S.H. A radish basic helix-loop-helix transcription factor, RsTT8 acts a positive regulator for anthocyanin biosynthesis. Front. Plant Sci. 2017, 8, 1917. [Google Scholar] [CrossRef]
- Fan, L.; Wang, Y.; Xu, L.; Tang, M.; Zhang, X.; Ying, J.; Li, C.; Dong, J.; Liu, L. A genome-wide association study uncovers a critical role of the RsPAP2 gene in red-skinned Raphanus sativus L. Hortic. Res. 2020, 7, 164. [Google Scholar] [CrossRef] [PubMed]
- Sun, Y.; Wang, J.; Qiu, Y.; Liu, T.; Song, J.; Li, X. Identification of ‘Xinlimei’ radish candidate genes associated with anthocyanin biosynthesis based on a transcriptome analysis. Gene 2018, 657, 81–91. [Google Scholar] [CrossRef] [PubMed]
- Tognolli, M.; Penel, C.; Greppin, H.; Simon, P. Analysis and expression of the class III peroxidase large gene family in Arabidopsis thaliana. Gene 2002, 288, 129–138. [Google Scholar] [CrossRef]
- Passardi, F.; Longet, D.; Penel, C.; Dunand, C. The class III peroxidase multigenic family in rice and its evolution in land plants. Phytochemistry 2004, 65, 1879–1893. [Google Scholar] [CrossRef]
- Wu, C.; Ding, X.; Ding, Z.; Tie, W.; Yan, Y.; Wang, Y.; Yang, H.; Hu, W. The Class III peroxidase (POD) gene family in cassava: Identification, phylogeny, duplication, and expression. Int. J. Mol. Sci. 2019, 20, 2730. [Google Scholar] [CrossRef]
- Yang, X.; Yuan, J.; Luo, W.; Qin, M.; Yang, J.; Wu, W.; Xie, X. Genome-wide identification and expression analysis of the class III peroxidase gene family in potato (Solanum tuberosum L.). Front. Genet. 2020, 11, 593577. [Google Scholar] [CrossRef]
- Meng, G.; Fan, W.; Rasmussen, S.K. Characterisation of the class III peroxidase gene family in carrot taproots and its role in anthocyanin and lignin accumulation. Plant Physiol. Biochem. 2021, 167, 245–256. [Google Scholar] [CrossRef] [PubMed]
- Shah, O.U.; Khan, L.U.; Basharat, S.; Zhou, L.; Ikram, M.; Peng, J.; Khan, W.U.; Liu, P.; Waseem, M. Genome-wide investigation of class III peroxidase genes in Brassica napus reveals their responsiveness to abiotic stresses. Plants 2024, 13, 942. [Google Scholar] [CrossRef]
- Wang, J.; Qiu, Y.; Wang, X.; Yue, Z.; Yang, X.; Chen, X.; Zhang, X.; Shen, D.; Wang, H.; Song, J.; et al. Insights into the species-specific metabolic engineering of glucosinolates in radish (Raphanus sativus L.) based on comparative genomic analysis. Sci. Rep. 2017, 7, 16040. [Google Scholar] [CrossRef]
- Song, W.; Xue, L.; Jin, X.; Liu, X.; Chen, X.; Wu, X.; Cui, M.; Liu, Q.; Wang, D. Genome-wide identification of SWEET family genes and functional analysis of NtSWEET12i under drought and saline-alkali stresses in tobacco. BMC Plant Biol. 2025, 25, 195. [Google Scholar] [CrossRef]
- Tang, M.; Xu, L.; Wang, Y.; Cheng, W.; Luo, X.; Xie, Y.; Fan, L.; Liu, L. Genome-wide characterization and evolutionary analysis of heat shock transcription factors (HSFs) to reveal their potential role under abiotic stresses in radish (Raphanus sativus L.). BMC Genom. 2019, 20, 772. [Google Scholar] [CrossRef] [PubMed]
- Ma, Y.; Chhapekar, S.S.; Lu, L.; Oh, S.; Singh, S.; Kim, C.S.; Kim, S.; Choi, G.J.; Lim, Y.P.; Choi, S.R. Genome-wide identification and characterization of NBS-encoding genes in Raphanus sativus L. and their roles related to Fusarium oxysporum resistance. BMC Plant Biol. 2021, 21, 47. [Google Scholar] [CrossRef]
- Wang, Y.; Wang, Q.; Zhao, Y.; Han, G.; Zhu, S. Systematic analysis of maize class III peroxidase gene family reveals a conserved subfamily involved in abiotic stress response. Gene 2015, 566, 95–108. [Google Scholar] [CrossRef] [PubMed]
- Yang, J.; Chen, R.; Xiang, X.; Liu, W.; Fan, C. Genome-wide identification and expression analysis of the Class III peroxidase gene family under abiotic stresses in Litchi (Litchi chinensis Sonn.). Int. J. Mol. Sci. 2024, 25, 5804. [Google Scholar] [CrossRef]
- Wang, Y.; Ying, J.; Zhang, Y.; Xu, L.; Zhang, W.; Ni, M.; Zhu, Y.; Liu, L. Genome-wide identification and functional characterization of the cation proton antiporter (CPA) family related to salt stress response in radish (Raphanus sativus L.). Int. J. Mol. Sci. 2020, 21, 8262. [Google Scholar] [CrossRef]
- Zhang, X.; Cao, Y.; Xin, R.; Xu, L.; Wang, Y.; Wang, L.; Ma, Y.; Liu, L. Genome-wide identification of the RsSWEET gene family and functional analysis of RsSWEET17 in root growth and development in radish. Horticulturae 2023, 9, 698. [Google Scholar] [CrossRef]
- Passardi, F.; Tognolli, M.; De Meyer, M.; Penel, C.; Dunand, C. Two cell wall associated peroxidases from Arabidopsis influence root elongation. Planta 2006, 223, 965–974. [Google Scholar] [CrossRef]
- Hu, X.; Liang, J.; Wang, W.; Cai, C.; Ye, S.; Wang, N.; Han, F.; Wu, Y.; Zhu, Q. Comprehensive genome-wide analysis of the gene family in Moso bamboo (Phyllostachys edulis): Evidence for the role of PeDREB28 in plant abiotic stress response. Plant J. 2023, 116, 1248–1270. [Google Scholar] [CrossRef] [PubMed]
- Zuo, Z.; Zhao, H.; Fan, Y.; Zhu, Y.; Song, W.; Zhai, H.; He, S.; Zhang, H.; Zhao, N.; Liu, Q.; et al. Evolutionary analysis of DELLA proteins in sweet potato and related species reveals their roles in development and stress responses. Front. Plant Sci. 2025, 16, 1494621. [Google Scholar] [CrossRef]
- Zhang, Z.; Pang, X.; Xuewu, D.; Ji, Z.; Jiang, Y. Role of peroxidase in anthocyanin degradation in litchi fruit pericarp. Food Chem. 2005, 90, 47–52. [Google Scholar] [CrossRef]
- Dixon, R.A.; Barros, J. Lignin biosynthesis: Old roads revisited and new roads explored. Open Biol. 2019, 9, 190215. [Google Scholar] [CrossRef] [PubMed]
- Chen, C.; Wu, Y.; Li, J.; Wang, X.; Zeng, Z.; Xu, J.; Liu, Y.; Feng, J.; Chen, H.; He, Y.; et al. TBtools-II: A “one for all, all for one” bioinformatics platform for biological big-data mining. Mol. Plant 2023, 16, 1733–1742. [Google Scholar] [CrossRef]
- Blum, M.; Andreeva, A.; Florentino, L.C.; Chuguransky, S.R.; Grego, T.; Hobbs, E.; Pinto, B.L.; Orr, A.; Paysan-Lafosse, T.; Ponamareva, I.; et al. InterPro: The protein sequence classification resource in 2025. Nucleic Acids Res. 2025, 53, D444–D456. [Google Scholar] [CrossRef] [PubMed]
- Wang, J.; Chitsaz, F.; Derbyshire, M.K.; Gonzales, N.R.; Gwadz, M.; Lu, S.; Marchler, G.H.; Song, J.S.; Thanki, N.; Yamashita, R.A.; et al. The conserved domain database in 2023. Nucleic Acids Res. 2023, 51, D384–D388. [Google Scholar] [CrossRef]
- Gasteiger, E.; Hoogland, C.; Gattiker, A.; Duvaud, S.; Wilkins, M.R.; Appel, R.D.; Bairoch, A. Protein identification and analysis tools on the ExPASy server. In The Proteomics Protocols Handbook; Humana: Totowa, NJ, USA, 2005; pp. 571–607. [Google Scholar]
- Horton, P.; Park, K.-J.; Obayashi, T.; Fujita, N.; Harada, H.; Adams-Collier, C.J.; Nakai, K. WoLF PSORT: Protein localization predictor. Nucleic Acids Res. 2007, 35, W585–W587. [Google Scholar] [CrossRef]
- Abramson, J.; Adler, J.; Dunger, J.; Evans, R.; Green, T.; Pritzel, A.; Ronneberger, O.; Willmore, L.; Ballard, A.J.; Bambrick, J.; et al. Accurate structure prediction of biomolecular interactions with AlphaFold 3. Nature 2024, 630, 493–500. [Google Scholar] [CrossRef]
- Tamura, K.; Stecher, G.; Kumar, S. MEGA11: Molecular evolutionary genetics analysis version 11. Mol. Biol. Evol. 2021, 38, 3022–3027. [Google Scholar] [CrossRef] [PubMed]
- Letunic, I.; Bork, P. Interactive Tree of Life (iTOL) v6: Recent updates to the phylogenetic tree display and annotation tool. Nucleic Acids Res. 2024, 52, W78–W82. [Google Scholar] [CrossRef]
- Bailey, T.L.; Boden, M.; Buske, F.A.; Frith, M.; Grant, C.E.; Clementi, L.; Ren, J.; Li, W.; Noble, W.S. MEME Suite: Tools for motif discovery and searching. Nucleic Acids Res. 2009, 37, W202–W208. [Google Scholar] [CrossRef]
- Madeira, F.; Madhusoodanan, N.; Lee, J.; Eusebi, A.; Niewielska, A.; Tivey, A.R.N.; Lopez, R.; Butcher, S. The EMBL-EBI Job Dispatcher sequence analysis tools framework in 2024. Nucleic Acids Res. 2024, 52, W521–W525. [Google Scholar] [CrossRef]
- Lescot, M.; Déhais, P.; Thijs, G.; Marchal, K.; Moreau, Y.; Van de Peer, Y.; Rouzé, P.; Rombauts, S. PlantCARE, a database of plant cis-acting regulatory elements and a portal to tools for in silico analysis of promoter sequences. Nucleic Acids Res. 2002, 30, 325–327. [Google Scholar] [CrossRef] [PubMed]
- Tian, F.; Yang, D.; Meng, Y.; Jin, J.; Gao, G. PlantRegMap: Charting functional regulatory maps in plants. Nucleic Acids Res. 2020, 48, D1104–D1113. [Google Scholar] [CrossRef] [PubMed]
- Szklarczyk, D.; Kirsch, R.; Koutrouli, M.; Nastou, K.; Mehryary, F.; Hachilif, R.; Gable, A.L.; Fang, T.; Doncheva, N.T.; Pyysalo, S.; et al. The STRING database in 2023: Protein–protein association networks and functional enrichment analyses for any sequenced genome of interest. Nucleic Acids Res. 2023, 51, D638–D646. [Google Scholar] [CrossRef]
- Kim, D.; Langmead, B.; Salzberg, S.L. HISAT: A fast spliced aligner with low memory requirements. Nat. Methods 2015, 12, 357–360. [Google Scholar] [CrossRef] [PubMed]
- Pertea, M.; Pertea, G.M.; Antonescu, C.M.; Chang, T.C.; Mendell, J.T.; Salzberg, S.L. StringTie enables improved reconstruction of a transcriptome from RNA-seq reads. Nat. Biotechnol. 2015, 33, 290–295. [Google Scholar] [CrossRef]
- Love, M.I.; Huber, W.; Anders, S. Moderated estimation of fold change and dispersion for RNA-seq data with DESeq2. Genome Biol. 2014, 15, 550. [Google Scholar] [CrossRef]
- Schmittgen, T.D.; Livak, K.J. Analyzing real-time PCR data by the comparative CT method. Nat. Protoc. 2008, 3, 1101–1108. [Google Scholar] [CrossRef]
- Langfelder, P.; Horvath, S. WGCNA: An R package for weighted correlation network analysis. BMC Bioinform. 2008, 9, 559. [Google Scholar] [CrossRef]
Disclaimer/Publisher’s Note: The statements, opinions and data contained in all publications are solely those of the individual author(s) and contributor(s) and not of MDPI and/or the editor(s). MDPI and/or the editor(s) disclaim responsibility for any injury to people or property resulting from any ideas, methods, instructions or products referred to in the content. |
© 2025 by the authors. Licensee MDPI, Basel, Switzerland. This article is an open access article distributed under the terms and conditions of the Creative Commons Attribution (CC BY) license (https://creativecommons.org/licenses/by/4.0/).