
Centrifuge-Less Mixed Micelle-Mediated Cloud Point Extraction-Spectrophotometric Determination of Vanadium Using 4-Nitrocatechol and Cetylpyridinium Chloride

 , ,
, ,  , , and
Abstract
1. Introduction
2. Results and Discussion
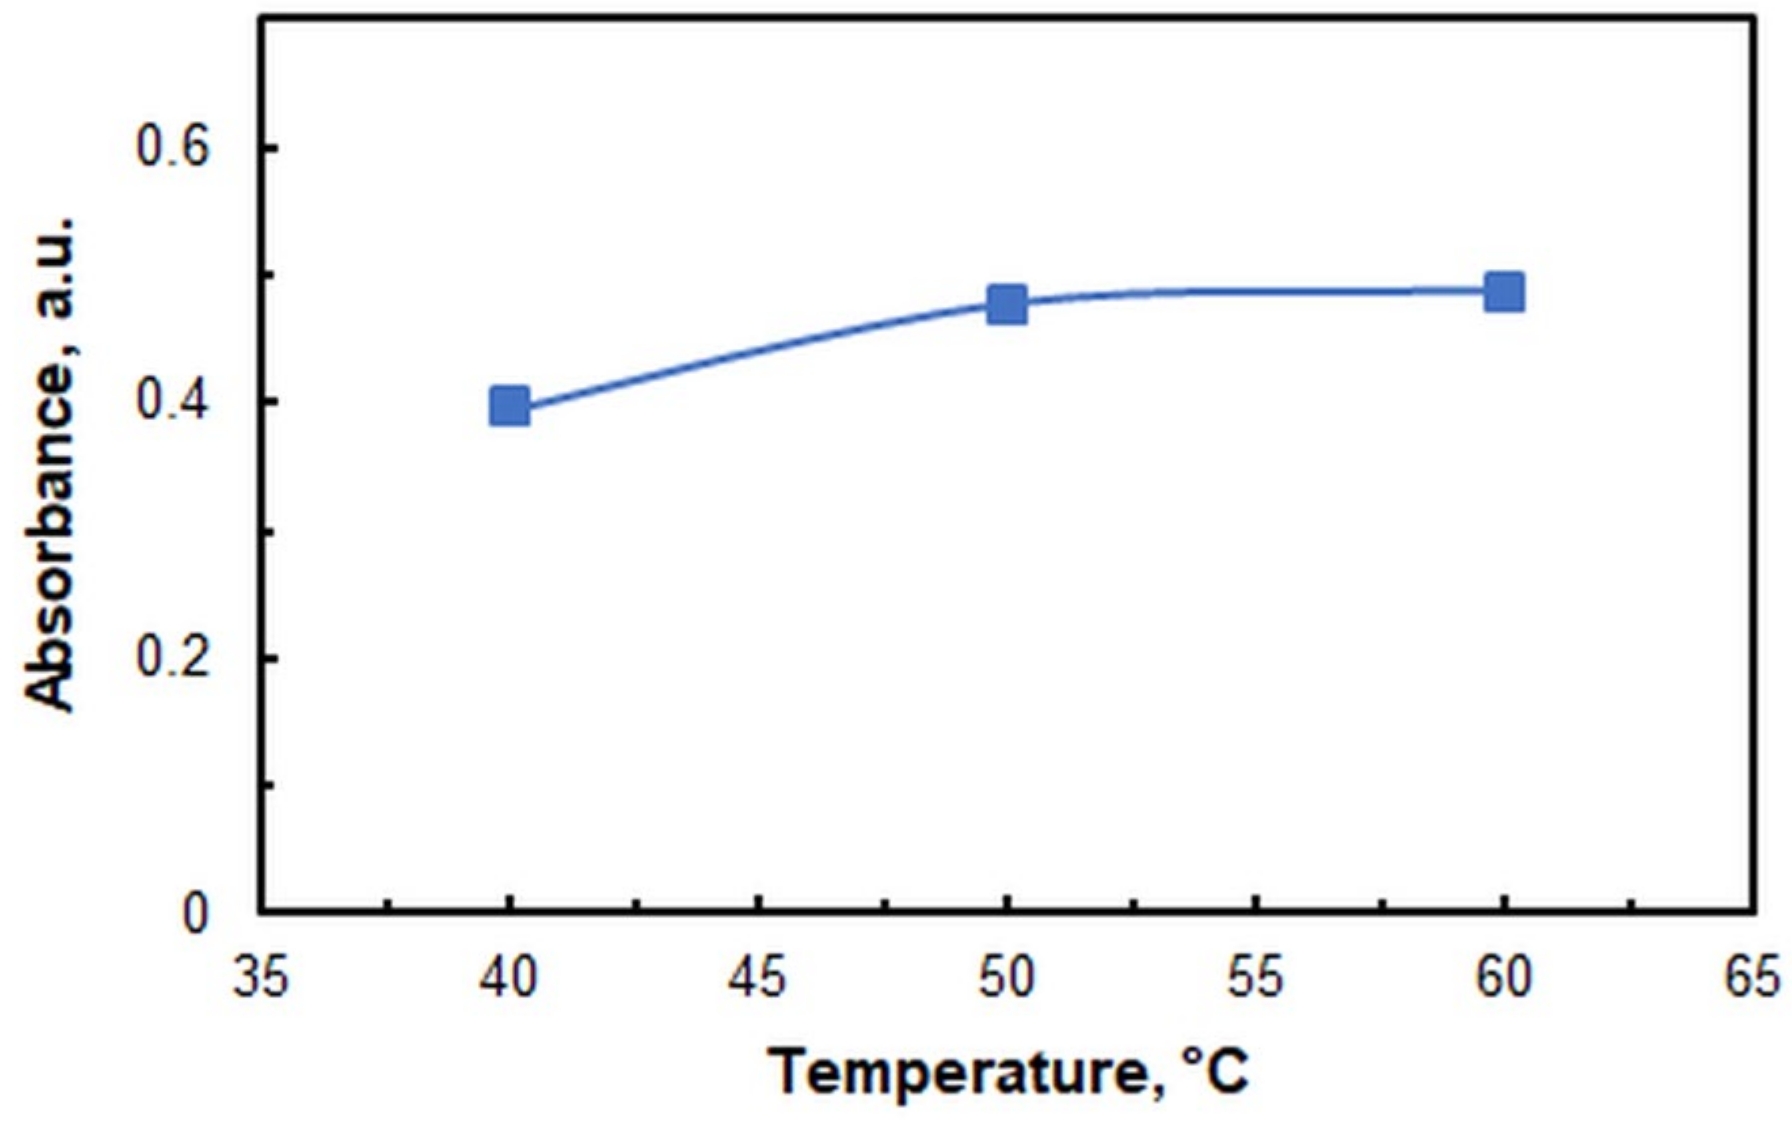
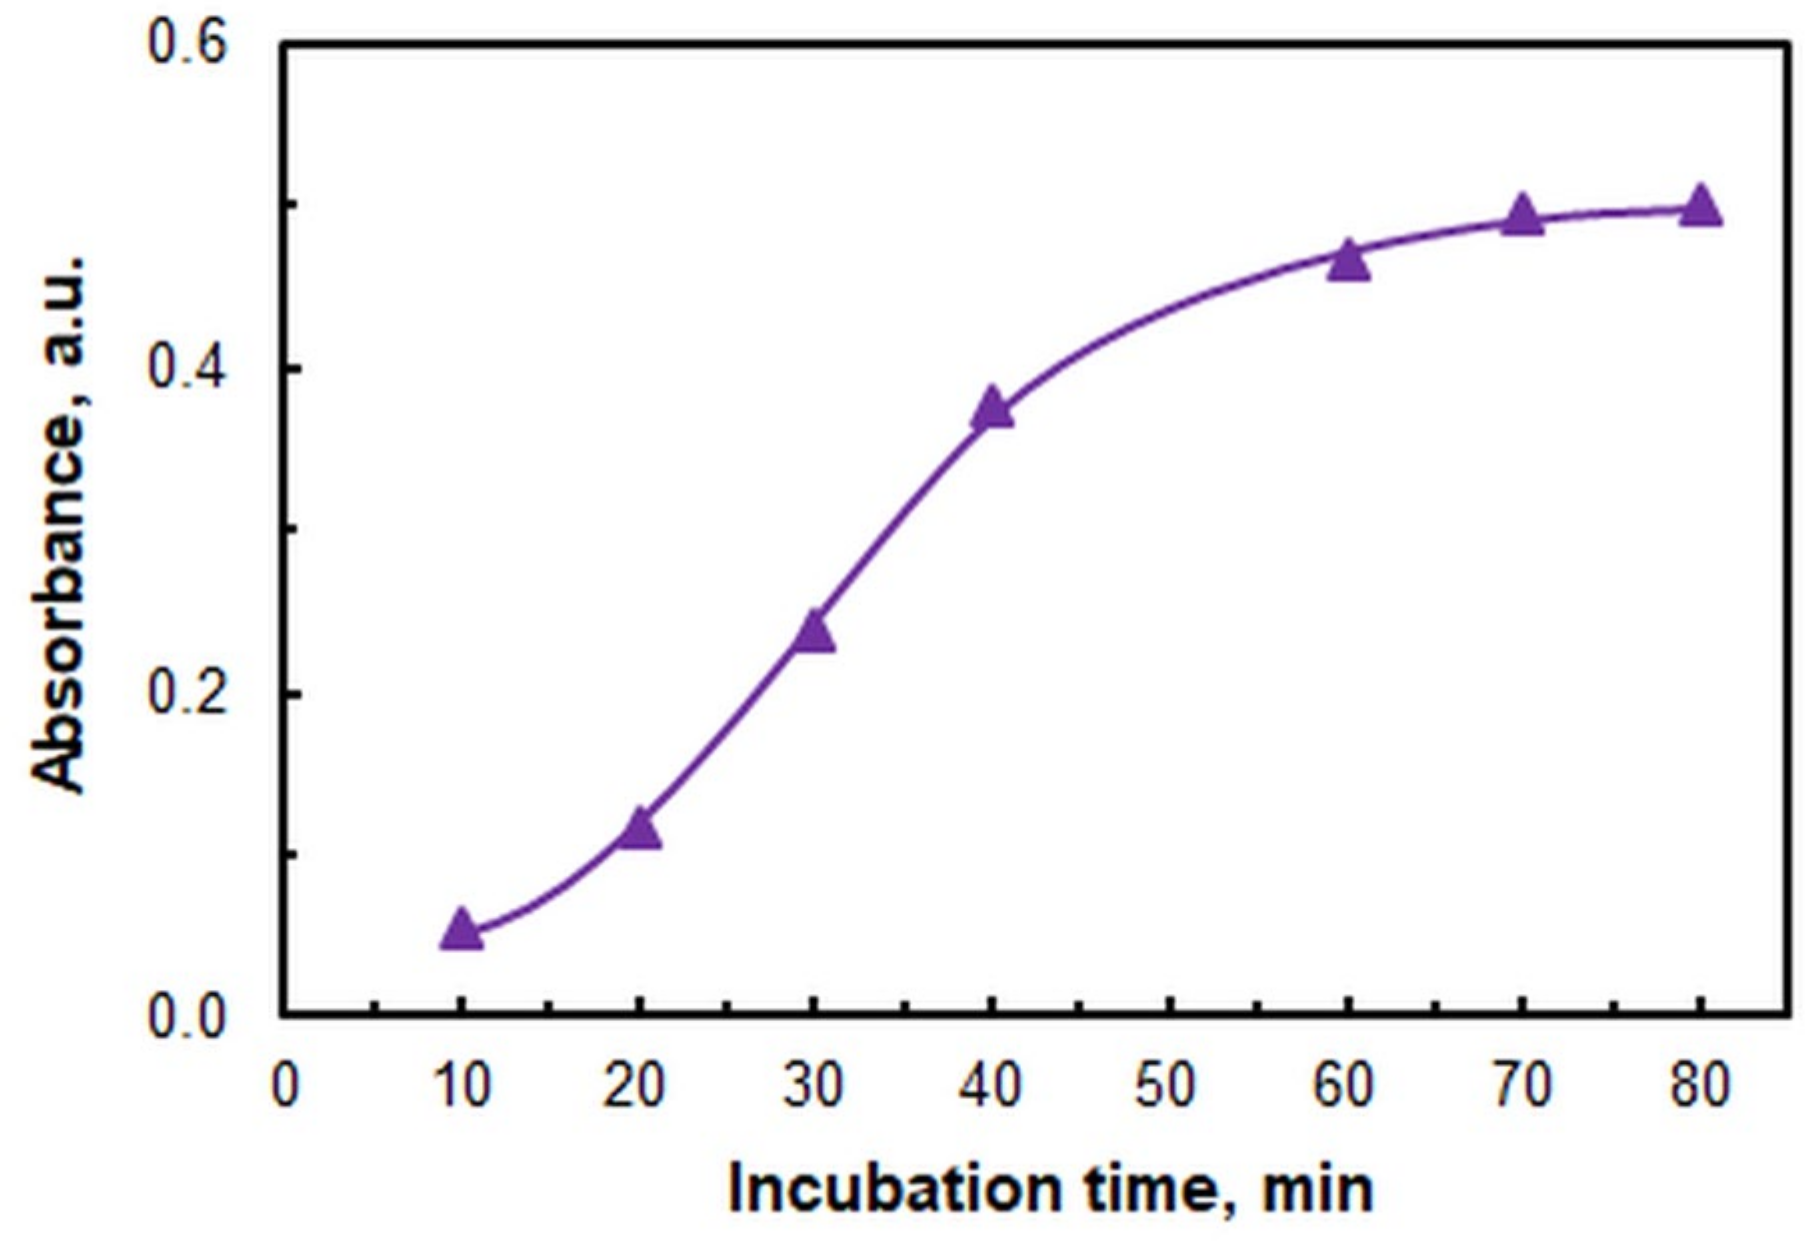
2.1. Optimization of Working Conditions
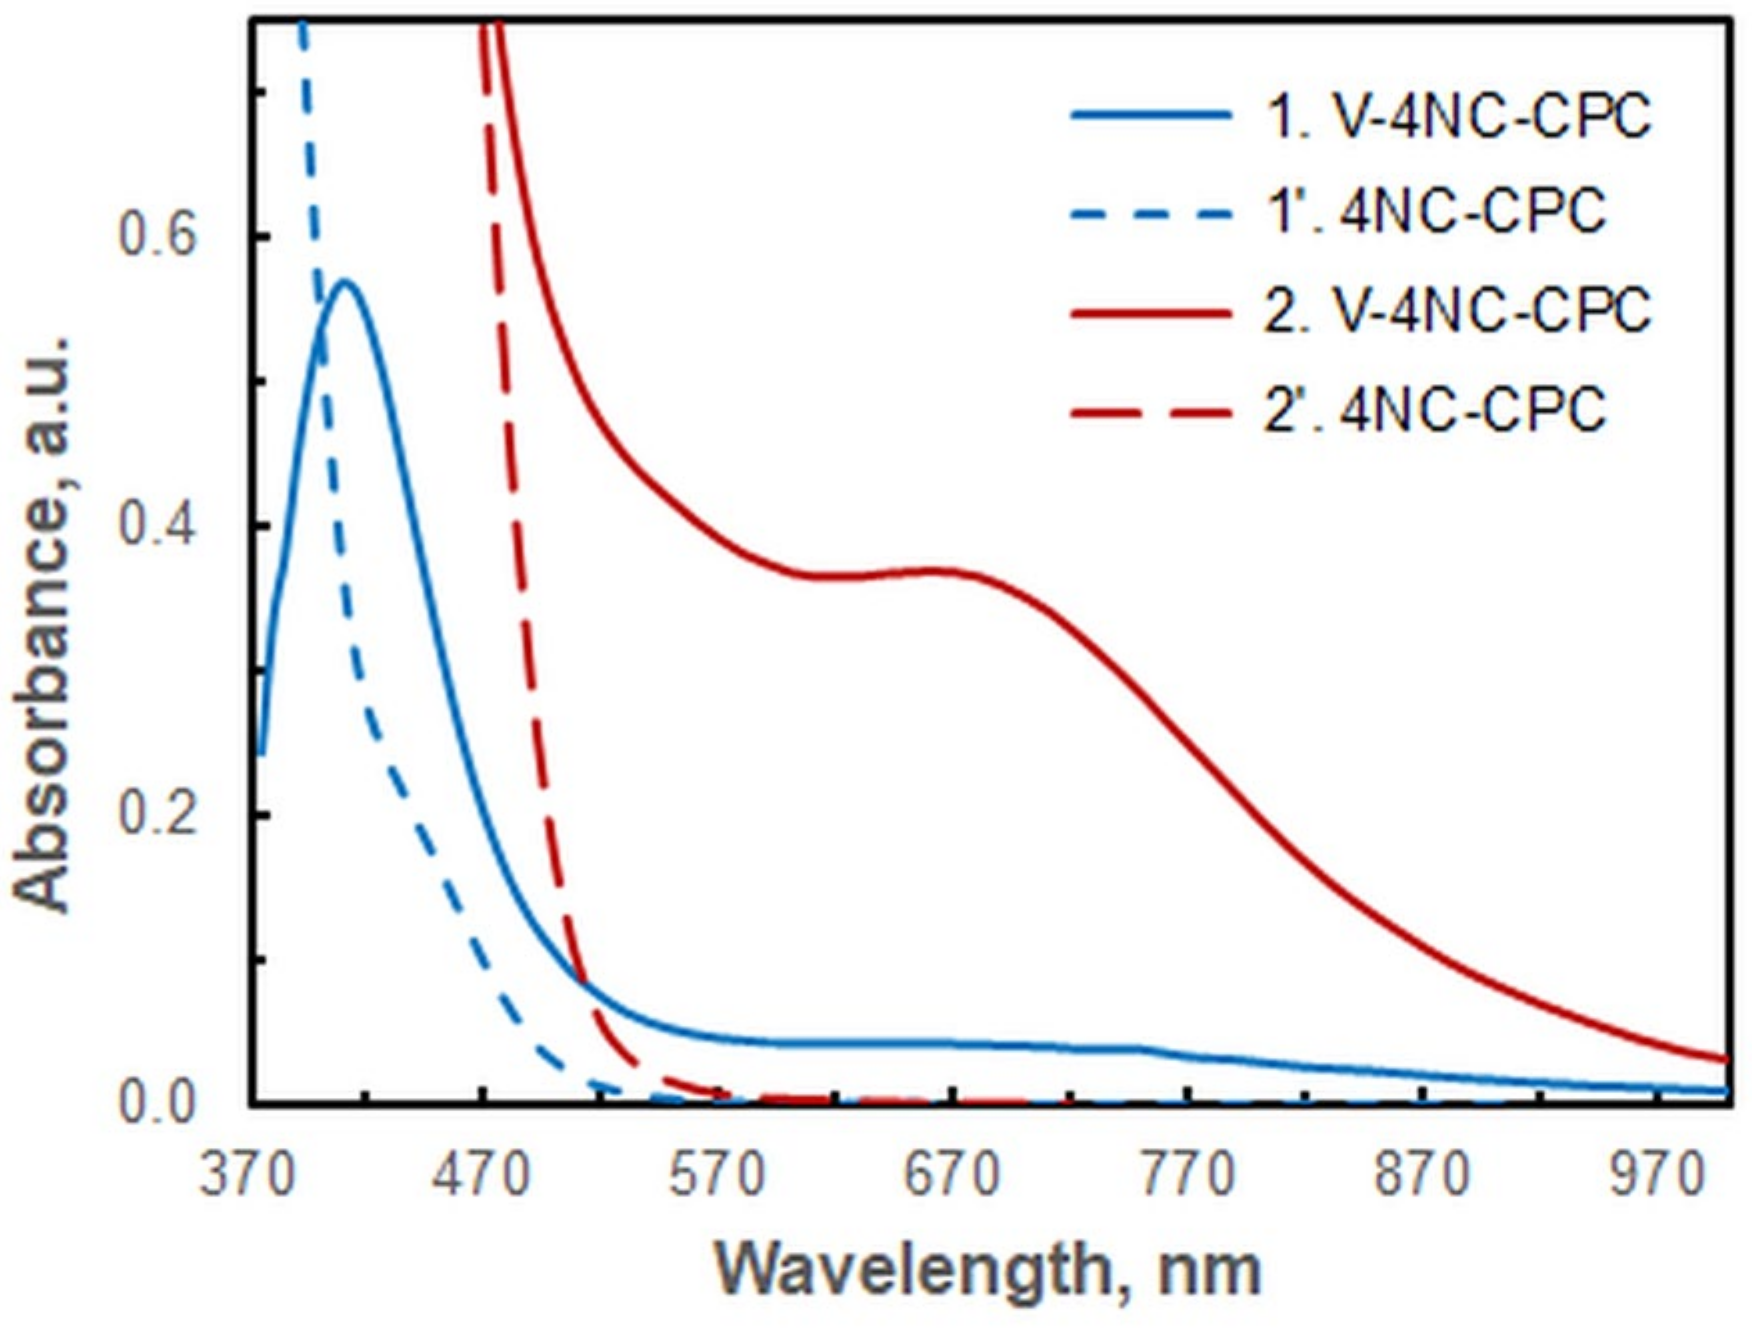
- The blank sample demonstrates virtually zero absorption, a property that facilitates the experimental process (measurements are made against water) and promotes the high repeatability of the results.
- The majority of the other 4NC complexes exhibit yellow or yellow-orange coloration (λ of 380–480 nm). The molar absorption coefficients of these complexes at 670 nm are negligible, a prerequisite for the development of a highly selective spectrophotometric method for determining vanadium.
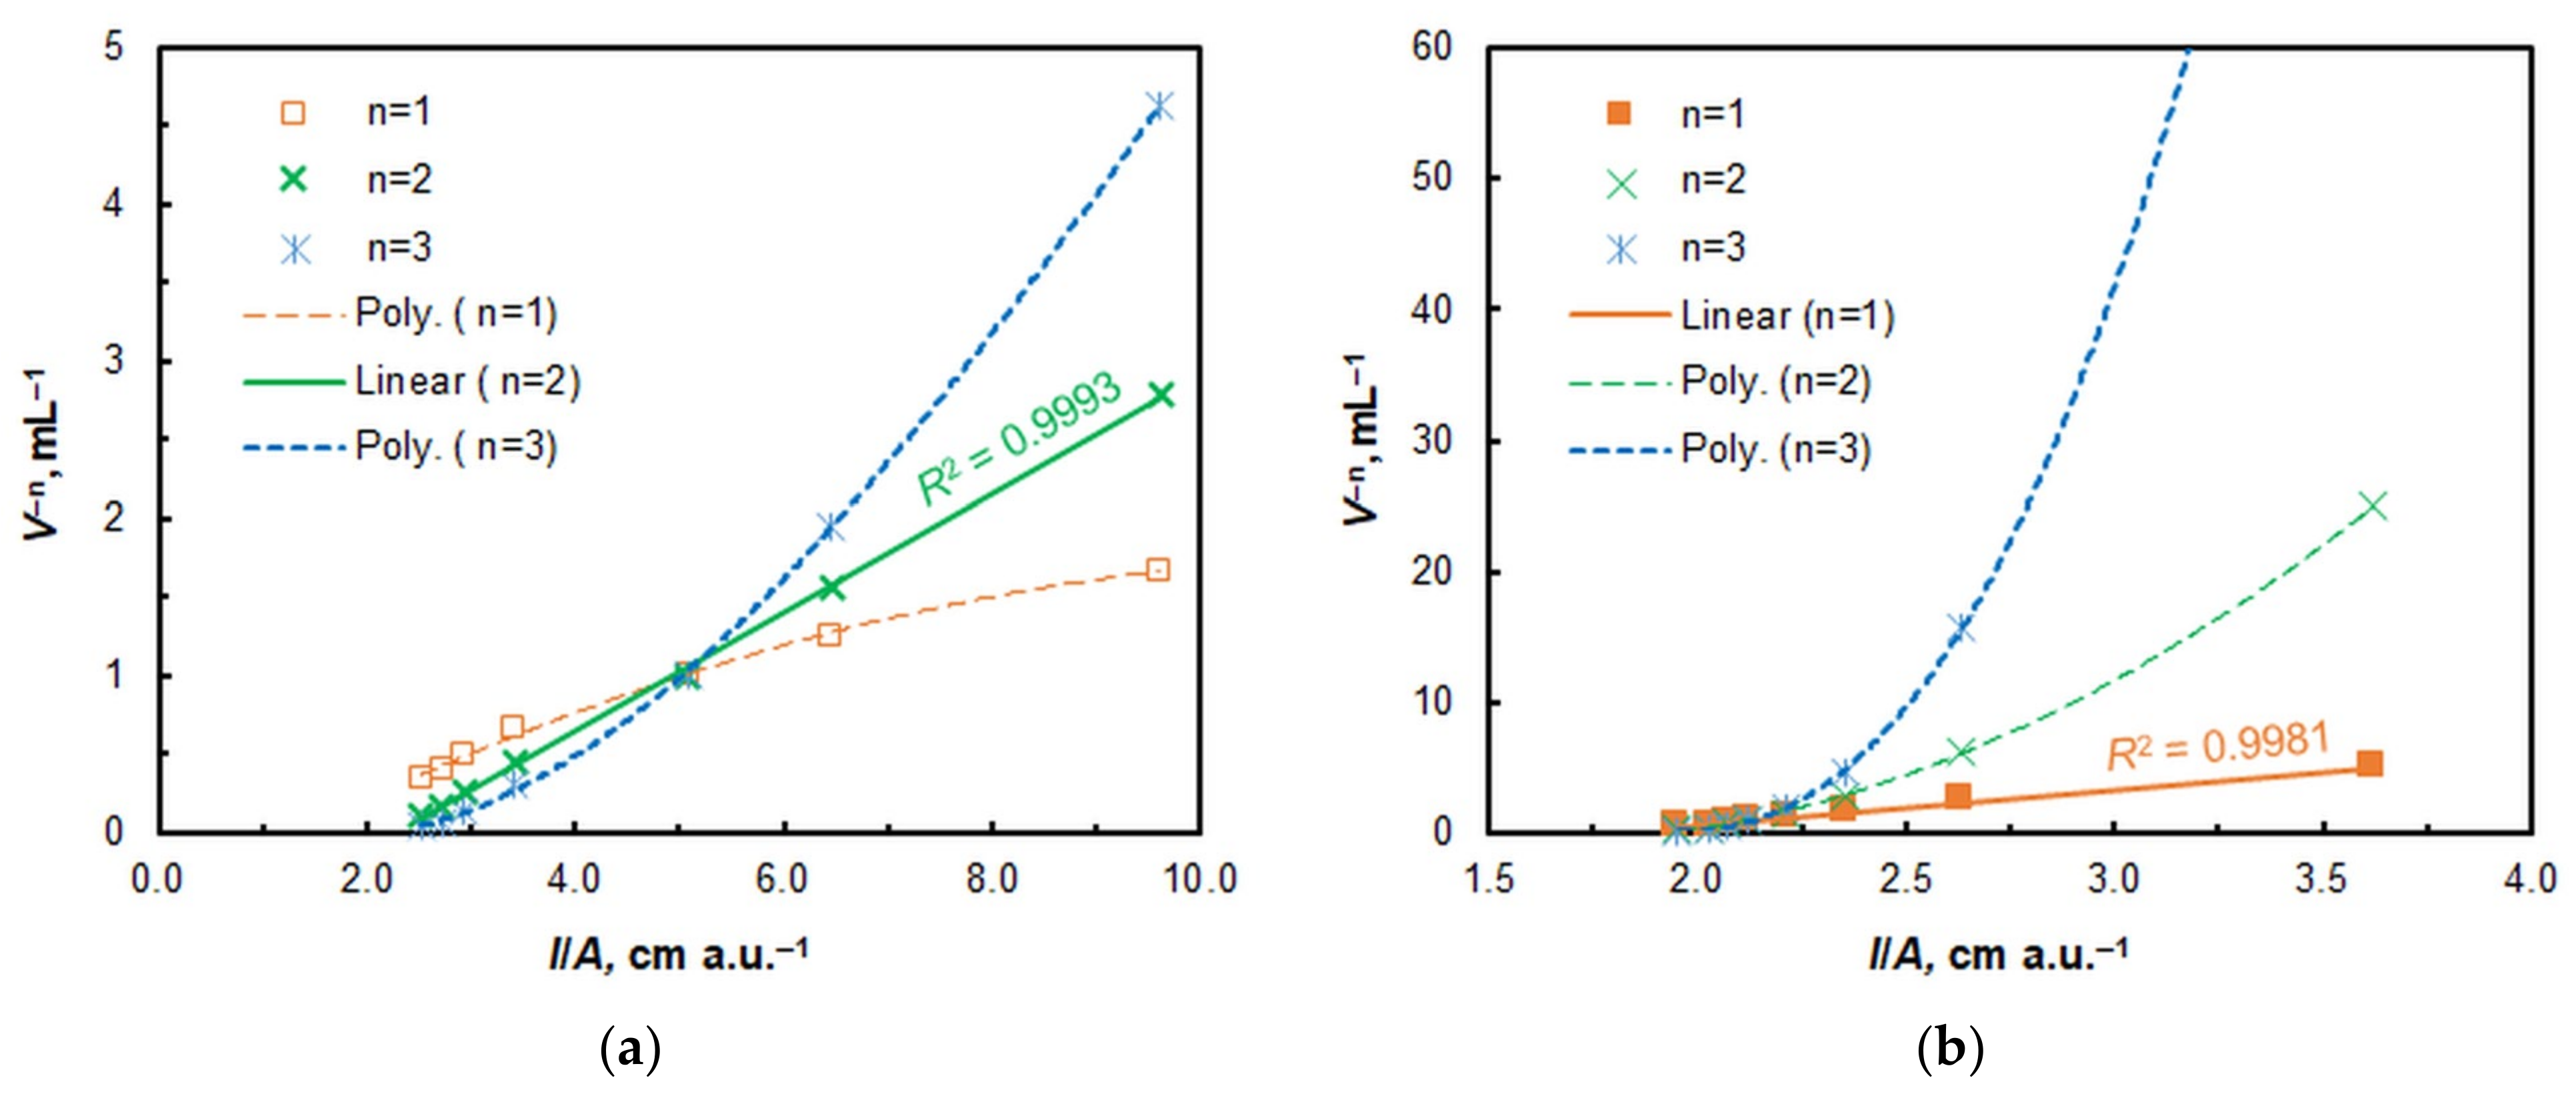
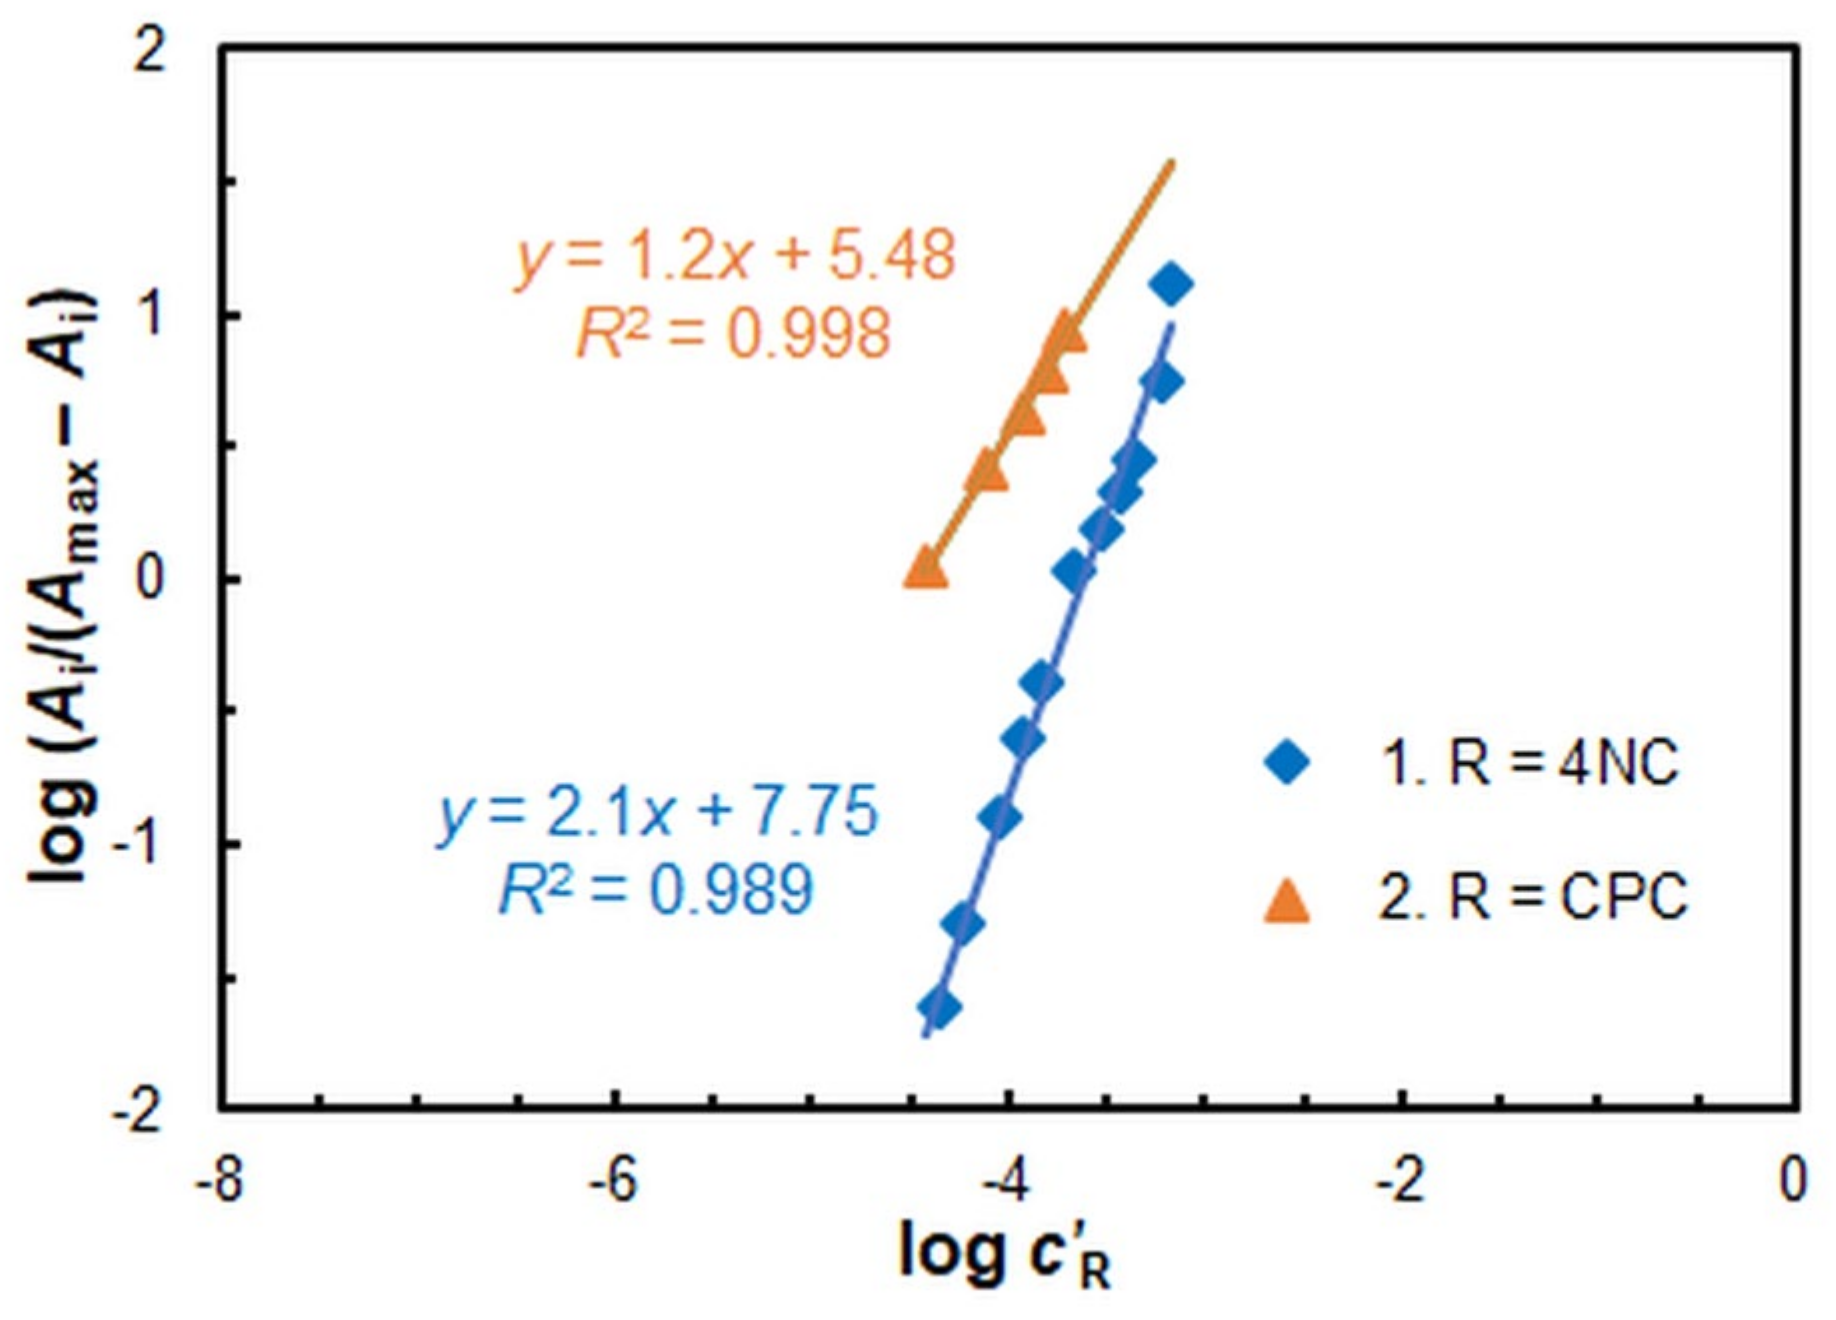
2.2. Stoichiometry, Complex Formation Equation, and Extraction Constant
2.3. Analytical Characteristics
2.4. Effect of Diverse Ions
2.5. Analytical Application
2.6. Comparison with Other Methods and Practicality Assessment

| Reagent(s) | Extraction Technique | Extractant | Linear Range, ng mL−1 | λmax, nm | ε·10−4, L mol−1 cm−1 | LOD, ng mL−1 | Sample | Ref. |
|---|---|---|---|---|---|---|---|---|
| Br-PADAP | CPE | TX-114 | 7–300 | 603 | NR | 2.2 | Tap water and river water | [31] |
| DCDHNAQ | SPE | Carbon-18 | 10–450 | 573 | 24.5 | 3.2 | Water, alloy, soil, and urine | [64] |
| DPs + HAs | LLE | Chloroform | 400–16,000 | 614–630 | 2.95–3.85 | 9 | Soil, water, and food samples | [40] |
| EDTA + Safranin T | UA-CPE | TX-114 | 2–180 (VV) 1–40 (VIV) | 530 | NR | 0.53 (VV) 0.26 (VIV) | Vegetal oils and vinegar | [63] |
| HTAR + H2O2 | CPE | TX-100 | Up to 510 | 582 | 16.6 | 0.8 | Lake water and spent catalysts | [36] |
| HTAR + TTC | LLE | Chloroform | 15–2000 | 549 | 5.2 | 4.6 | Spent catalysts and pharmaceuticals | [62] |
| HTAR + NTC | LLE | Chloroform | 23–1100 | 556 | 5.2 | 6.8 | – | [62] |
| N-BPHA | LLE | Chloroform | 0–1500 | 530 | 0.545 | NR | Natural waters | [37] |
| NTA8HQ + BIABP + H2O2 | CPE | TX-114 | 1–70 (VV) 10–100 (VIV) | 634 625 | 160 (VV) 206 (VIV) | 0.72 (VV) 1.78 (VIV) | Water, soil, rice, and vegetables | [35] |
| PAR | MCPE | TX-114 | 50–600 | 568 | 1.85 | 5.51 | Tap water | [33] |
| PAR + BDTA | SPE | Clinoptilolite | 10–3000 | 550 | NR | 0.07 | Synthetic samples and alloys | [65] |
| PG + Safranin T | UA-CPE | TX114 | 2–500 | 533 | NR | 0.58 | Beverages | [43] |
| TA + CTAB | DLLME-SFOD | 1-Undecanol | 6–1000 | 600 | NR | 1.8 | Fruit juice samples | [39] |
| TAN + H2O2 | CL-CPE | TX-100 | Up to 760 | 607 | 8.84 | 1.4 | Natural water, aluminum alloy, catalyst, and solution for infusion | [32] |
| TAR + H2O2 | CL-CPE | TX-100 | Up to 510 | 569 | 7.4 | 1.7 | Dietary supplement and catalysts | [34] |
| 4NC + MTT | LLE | Chloroform | 120–1200 | 400 | 3.13 | 35 | Steel and catalysts | [45] |
| 4NC + CPC | MM-CL-CPE | TX114 | 2–305 | 670 | 12.2 | 0.6 | Mineral water, dietary supplement, and spent catalyst | This work |
3. Materials and Methods
3.1. Reagents and Chemicals
3.2. Instrumentation
3.3. Samples and Sample Preparation
3.4. Optimization Procedure
3.5. Recommended Procedure for Determining Vanadium
4. Conclusions
Author Contributions
Funding
Institutional Review Board Statement
Informed Consent Statement
Data Availability Statement
Acknowledgments
Conflicts of Interest
References
- IMA Database of Mineral Properties. Available online: https://rruff.info/ima/ (accessed on 27 May 2025).
- Huang, J.-H.; Huang, F.; Evans, L.; Glasauer, S. Vanadium: Global (bio)geochemistry. Chem. Geol. 2015, 417, 68–89. [Google Scholar] [CrossRef]
- Rehder, D. Vanadium in health issues. ChemTexts 2018, 4, 20. [Google Scholar] [CrossRef]
- Schlesinger, W.H.; Klein, E.M.; Vengosh, A. Global biogeochemical cycle of vanadium. Proc. Natl. Acad. Sci. USA 2017, 114, E11092–E11100. [Google Scholar] [CrossRef]
- Viers, J.; Dupré, B.; Gaillardet, J. Chemical composition of suspended sediments in World Rivers: New insights from a new database. Sci. Total Environ. 2009, 407, 853–868. [Google Scholar] [CrossRef] [PubMed]
- Watt, J.A.; Burke, I.T.; Edwards, R.A.; Malcolm, H.M.; Mayes, W.M.; Olszewska, J.P.; Pan, G.; Graham, M.C.; Heal, K.V.; Rose, N.L.; et al. Vanadium: A re-emerging environmental hazard. Environ. Sci. Technol. 2018, 52, 11973–11974. [Google Scholar] [CrossRef]
- Gruzewska, K.; Michno, A.; Pawelczyk, T.; Bielarczyk, H. Essentiality and toxicity of vanadium supplements in health and pathology. J. Physiol. Pharmacol. 2014, 65, 603–611. [Google Scholar]
- Fawcett, J.P.; Farquhar, S.J.; Thou, T.; Shand, B.I. Oral vanadyl sulphate does not affect blood cells, viscosity or biochemistry in humans. Pharmacol. Toxicol. 1997, 80, 202. [Google Scholar] [CrossRef]
- Scior, T.; Antonio Guevara-Garcia, J.; Do, Q.-T.; Bernard, P.; Laufer, S. Why antidiabetic vanadium complexes are not in the pipeline of “big pharm” drug research? A critical review. Curr. Med. Chem. 2016, 23, 2874–2891. [Google Scholar] [CrossRef]
- Amaral, L.; Moniz, T.; Silva, A.M.N.; Rangel, M. Vanadium compounds with antidiabetic potential. Int. J. Mol. Sci. 2023, 24, 15675. [Google Scholar] [CrossRef]
- Kostova, I. Anticancer metallocenes and metal complexes of transition elements from groups 4 to 7. Molecules 2024, 29, 824. [Google Scholar] [CrossRef]
- Kowalski, S.; Wyrzykowski, D.; Inkielewicz-Stępniak, I. Molecular and cellular mechanisms of cytotoxic activity of vanadium compounds against cancer cells. Molecules 2020, 25, 1757. [Google Scholar] [CrossRef] [PubMed]
- Crans, D.C.; Yang, L.; Haase, A.; Yang, X. Health benefits of vanadium and its potential as an anticancer agent. In Metallo-Drugs: Development and Action of Anticancer Agents; Astrid, S., Helmut, S., Eva, F., Roland, K.O.S., Eds.; De Gruyter: Berlin, Germany, 2018; pp. 251–280. [Google Scholar] [CrossRef]
- de Jesus, A.M.; Oliveira, L.F.; Canevari, N.T.; Pereira-Filho, E.R. Sequential preconcentration using cloud point extraction: Determination of vanadium and molybdenum in water and pharmaceutical samples using Flame Atomic Absorption Spectrometry. Braz. J. Anal. Chem. 2013, 10, 476–480. [Google Scholar]
- Gürkan, R.; Korkmaz, S.; Altunay, N. Preconcentration and determination of vanadium and molybdenum in milk, vegetables and foodstuffs by ultrasonic-thermostatic-assisted cloud point extraction coupled to flame atomic absorption spectrometry. Talanta 2016, 155, 38–46. [Google Scholar] [CrossRef] [PubMed]
- Filik, H.; Yanaz, Z.; Apak, R. Selective determination of total vanadium in water samples by cloud point extraction of its ternary complex. Anal. Chim. Acta 2008, 620, 27–33. [Google Scholar] [CrossRef]
- López-García, I.; Marín-Hernández, J.J.; Hernández-Córdoba, M. Graphite furnace atomic absorption spectrometric determination of vanadium after cloud point extraction in the presence of graphene oxide. Spectroc. Acta Part B Atom. Spectr. 2018, 143, 42–47. [Google Scholar] [CrossRef]
- Souza, V.S.; Teixeira, L.S.; Bezerra, M.A. Application of multivariate designs in the development of a method for vanadium determination in natural waters by HR-CS GF AAS after cloud-point extraction. Microchem. J. 2016, 129, 318–324. [Google Scholar] [CrossRef]
- Khan, S.; Kazi, T.G.; Baig, J.A.; Kolachi, N.F.; Afridi, H.I.; Wadhwa, S.K.; Shah, A.Q.; Kandhro, G.A.; Shah, F. Cloud point extraction of vanadium in pharmaceutical formulations, dialysate and parenteral solutions using 8-hydroxyquinoline and nonionic surfactant. J. Hazard. Mater. 2010, 182, 371–376. [Google Scholar] [CrossRef]
- Zhu, X.; Zhu, Z.; Wu, S. Determination of trace vanadium in soil by cloud point extraction and graphite furnace atomic absorption spectroscopy. Microchim. Acta 2008, 161, 143–148. [Google Scholar] [CrossRef]
- Liu, Y.; Xu, J.; Xue, Y.; Wang, J.; Chang, Y.; Xue, C. Determination of trace vanadium in sea cucumbers by ultrasound-assisted cloud point extraction and graphite furnace atomic absorption spectrometry. Int. J. Environ. Anal. Chem. 2015, 95, 258–270. [Google Scholar] [CrossRef]
- Filik, H.; Aksu, D. Determination of vanadium in food samples by cloud point extraction and graphite furnace atomic absorption spectroscopy. Food Anal. Meth. 2012, 5, 359–365. [Google Scholar] [CrossRef]
- Ullah, N.; Hazer, B.; Tuzen, M.; Saleh, T.A. Syringe-based microextraction for the removal of vanadium from different water and food samples using newly synthesized imino diacetate functionalized polystyrene as a new adsorbent: A multivariate approach. J. Mol. Liq. 2024, 394, 123703. [Google Scholar] [CrossRef]
- Mortada, W.I.; El-Defrawy, M.M.; Erfan, E.; El-Asmy, H.A. Cloud point extraction coupled with back-extraction for speciation of inorganic vanadium in water and determination of total vanadium in food samples by ICP-OES. J. Food Compos. Anal. 2022, 108, 104445. [Google Scholar] [CrossRef]
- D’Ilio, S.; Violante, N.; Majorani, C.; Petrucci, F. Dynamic reaction cell ICP-MS for determination of total As, Cr, Se and V in complex matrices: Still a challenge? A review. Anal. Chim. Acta 2011, 698, 6–13. [Google Scholar] [CrossRef] [PubMed]
- Wlazłowska, E.; Grabarczyk, M. Adsorptive stripping voltammetry for determination of vanadium: A review. Materials 2023, 16, 3646. [Google Scholar] [CrossRef]
- Kassem, A.; Sarheel, A.; Al-Somel, N. Determination of trace elements in soil and plants in the Orontes basin of Syria by using instrumental neutron activation analysis. J. Radioanal. Nucl. Chem. 2005, 262, 555–561. [Google Scholar] [CrossRef]
- Serfor-Armah, Y.; Carboo, D.; Akuamoah, R.; Chatt, A. Micelle-mediated extraction and neutron activation determination of nanogram levels of vanadium in seaweeds. J. Radioanal. Nucl. Chem. 2018, 318, 2039–2047. [Google Scholar] [CrossRef]
- He, W.-y.; Wang, K.-p.; Yang, J.-y. Spectrophotometric methods for determination of vanadium: A review. Toxicol. Environ. Chem. 2018, 100, 20–31. [Google Scholar] [CrossRef]
- Goswami, A.K. Spectrophotometric Determination of Vanadium, Chromium and Manganese: Reagents and Methods; De Gruyter: Berlin, Germany, 2024; pp. 21–42. [Google Scholar] [CrossRef]
- Deng, J.; Huang, K.; An, L.; Hu, C.; Ju, S.; Xiao, N. Cloud point extraction and simultaneous spectrophotometric determination of V(V), Co(II) and Cu(II) ions in water samples by 5-Br-PADAP using partial least squares regression. J. Radioanal. Nucl. Chem. 2014, 300, 835–842. [Google Scholar] [CrossRef]
- Stefanova-Bahchevanska, T.; Milcheva, N.; Zaruba, S.; Andruch, V.; Delchev, V.; Simitchiev, K.; Gavazov, K. A green cloud-point extraction-chromogenic system for vanadium determination. J. Mol. Liq. 2017, 248, 135–142. [Google Scholar] [CrossRef]
- Ghasemi, E.; Kaykhaii, M. Developing a new micro cloud point extraction method for simultaneous preconcentration and spectrophotometric determination of uranium and vanadium in brine. Anal. Sci. 2015, 31, 407–411. [Google Scholar] [CrossRef]
- Genç, F.; Milcheva, N.P.; Hristov, D.G.; Gavazov, K.B. A simple cloud point extraction-spectrophotometric method for total vanadium determination using 4-(2-thiazolylazo)resorcinol and H2O2. Chem. Pap. 2020, 74, 1891–1901. [Google Scholar] [CrossRef]
- Khammas, Z.A.; Ibrahim, Z.T.; Al-adilee, K.J. Two-steps cloud point extraction-spectrophotomtric method for separation, pre-concentration and determination of V (IV) and V (V) ions in real samples using laboratory-made organic reagents. Int. Res. J. Pure Appl. Chem. 2015, 8, 33–48. [Google Scholar] [CrossRef]
- Milcheva, N.P.; Genç, F.; Racheva, P.V.; Delchev, V.B.; Andruch, V.; Gavazov, K.B. An environmentally friendly cloud point extraction-spectrophotometric determination of trace vanadium using a novel reagent. J. Mol. Liq. 2021, 334, 116086. [Google Scholar] [CrossRef]
- Bychkova, O.A.; Zavodova, M.N.; Nikitina, T.G.; Nikonorov, V.V. Extraction–photometric determination of vanadium in natural waters. J. Anal. Chem. 2015, 70, 962–966. [Google Scholar] [CrossRef]
- Mardanova, V.I.; Nagiev, K.D.; Chyragov, F.M. Interaction of Vanadium(V) with 4-(2′,3′,4′-Trihydroxyphenyl)-3-Nitro-5-Sulfoazobenzene in the Presence of Cationic Surfactants. J. Anal. Chem. 2024, 79, 1426–1430. [Google Scholar] [CrossRef]
- Mortada, W.I.; Zedan, H.E.; Khalifa, M.E. Spectrophotometric determination of trace vanadium in fresh fruit juice samples by ion pair-based surfactant-assisted microextraction procedure with solidification of floating organic drop. Spectroc. Acta Part A Molec. Biomolec. Spectr. 2023, 302, 123107. [Google Scholar] [CrossRef]
- Kuliev, K.; Ibrahimov, H.; Ismailova, S.Y.; Aliyev, S.; Mamedova, S.A. Spectrophotometric determination of vanadium(IV, V) using dithiolphenols and aminophenols. Indo Am. J. Pharm. Sci. 2019, 6, 3267–3278. [Google Scholar] [CrossRef]
- Verdizade, N.; Magerramov, A.; Kuliev, K. Extraction-spectrophtometric determination of vanadium using 2, 6-dithiol-4-tert-butylphenol and aminophenols. J. Anal. Chem. 2011, 66, 1159–1164. [Google Scholar] [CrossRef]
- Mondal, R.K.; Rathore, D.P.S.; Tarafder, P.K. Determination of vanadium in steel and geological samples by its extraction and spectrophotometry determination using 2,3-dihydroxynaphthalene. Explor. Res. At. Miner. 2013, 23, 113–116. [Google Scholar]
- Temel, N.K.; Gürkan, R. Preconcentration and determination of trace vanadium(V) in beverages by combination of ultrasound assisted-cloud point extraction with spectrophotometry. Acta Chim. Slov. 2018, 65, 138–149. [Google Scholar] [CrossRef]
- Saravanska, A.D.; Racheva, P.V.; Divarova, V.V.; Toncheva, G.K.; Milcheva, N.P.; Delchev, V.B.; Gavazov, K.B. Extraction-spectrophotometric and theoretical studies on a ternary complex obtained from vanadium(V) and 4-nitrocatechol. Russ. J. Inorg. Chem. 2021, 66, 1880–1886. [Google Scholar] [CrossRef]
- Racheva, P.V.; Gavazov, K.B.; Lekova, V.D.; Dimitrov, A.N. Extraction equilibria and spectrophotometric determination of vanadium(V) with 4-nitrocatechol and the ion-pair reagent thiazolyl blue tetrazolium. J. Anal. Chem. 2010, 65, 21–25. [Google Scholar] [CrossRef]
- Arya, S.S.; Kaimal, A.M.; Chib, M.; Sonawane, S.K.; Show, P.L. Novel, energy efficient and green cloud point extraction: Technology and applications in food processing. J. Food Sci. Technol. 2019, 56, 524–534. [Google Scholar] [CrossRef] [PubMed]
- Mortada, W.I. Recent developments and applications of cloud point extraction: A critical review. Microchem. J. 2020, 157, 105055. [Google Scholar] [CrossRef]
- Halko, R.; Hagarová, I.; Andruch, V. Innovative Approaches in Cloud-Point Extraction. J. Chromatogr. A 2023, 1701, 464053. [Google Scholar] [CrossRef]
- Snigur, D.; Azooz, E.A.; Zhukovetska, O.; Guzenko, O.; Mortada, W. Recent innovations in cloud point extraction towards a more efficient and environmentally friendly procedure. Trac-Trends Anal. Chem. 2023, 164, 117113. [Google Scholar] [CrossRef]
- Semysim, F.A.; Shabaa, G.J.; Azooz, E.A.; Snigur, D. Alternative green solvents in cloud point extraction methods: Recent developments, challenges, and greenness evaluation. Trends Environ. Anal. Chem. 2025, 45, e00250. [Google Scholar] [CrossRef]
- Sommer, L.; Ackermann, G.; Burns, D.T.; Savvin, S.B. Present and future status of organic analytical reagents-Part I: General remarks. Pure Appl. Chem. 1990, 62, 2147–2166. [Google Scholar] [CrossRef]
- Divarova, V.; Gajdošová, A.; Racheva, P.; Gavazov, K. An Ionic liquid-assisted mixed micelle-mediated centrifuge-less cloud point extraction spectrophotometric method for the determination of molybdenum(VI). Int. J. Mol. Sci. 2025, 26, 4597. [Google Scholar] [CrossRef]
- Sigma-Aldrich Safety Data Sheet: 4-Nitrocatechol. Available online: https://www.sigmaaldrich.com/BG/en/sds/aldrich/n15553?userType=anonymous (accessed on 27 May 2025).
- Asmus, E. Eine neue Methode zur Ermittlung der Zusammensetzung schwacher Komplexe. Fresenius’ J. Anal. Chem. 1960, 178, 104–116. [Google Scholar] [CrossRef]
- Zhiming, Z.; Dongsten, M.; Cunxiao, Y. Mobile equilibrium method for determining composition and stability constant of coordination compounds of the form MmRn. J. Rare Earths 1997, 15, 216–219. [Google Scholar]
- Kurbatova, L.D.; Koryakova, O.V.; Valova, M.A.; Yanchenko, M.Y. Examination of extraction of vanadium(V) by trioctylamine from sulfuric solutions. Z. Anorg. Allg. Chem. 2015, 641, 617–621. [Google Scholar] [CrossRef]
- Gavazov, K.B. Nitroderivatives of catechol: From synthesis to application. Acta Chim. Slov. 2012, 59, 1–17. [Google Scholar] [PubMed]
- Nurchi, V.M.; Pivetta, T.; Lachowicz, J.I.; Crisponi, G. Effect of substituents on complex stability aimed at designing new iron(III) and aluminum(III) chelators. J. Inorg. Biochem. 2009, 103, 227–236. [Google Scholar] [CrossRef]
- Giroux, S.; Aury, S.; Rubini, P.; Parant, S.; Desmurs, J.-R.; Dury, M. A spectroscopic investigation of the complexing ability of catecholate or salicylate derivatives towards aluminium(III). Polyhedron 2004, 23, 2393–2404. [Google Scholar] [CrossRef]
- Holme, A.; Langmyhr, F.J. A modified and a new straight-line method for determining the composition of weak complexes of the form AmBn. Anal. Chim. Acta 1966, 36, 383–391. [Google Scholar] [CrossRef]
- Divarova, V.V.; Stojnova, K.T.; Radkovska, I.D.; Saravanska, A.D.; Toncheva, G.K.; Delchev, V.B.; Gavazov, K.B. Extraction system for the spectrophotometric determination of tungsten(VI) with 4-nitrocatechol and benzalkonium chloride. Acta Chim. Slov. 2024, 71, 519–527. [Google Scholar] [CrossRef]
- Gavazov, K.B.; Racheva, P.V.; Saravanska, A.D.; Toncheva, G.K.; Delchev, V.B. Extractive spectrophotometric determination and theoretical investigations of two new vanadium(V) complexes. Molecules 2023, 28, 6723. [Google Scholar] [CrossRef]
- Temel, N.K.; Kuş, B.; Gürkan, R. A new ion-pair ultrasound assisted-cloud point extraction approach for determination of trace V(V) and V(IV) in edible vegetal oils and vinegar by spectrophotometry. Microchem. J. 2019, 150, 104139. [Google Scholar] [CrossRef]
- Amin, A.S.; Saber, A.L.; Mohammed, T.Y. Study on solid phase extraction and spectrophotometric determination of vanadium with 2,3-dichloro-6-(2,7-dihydroxy-1-naphthylazo)quinoxaline. Spectroc. Acta Part A Molec. Biomolec. Spectr. 2009, 73, 195–200. [Google Scholar] [CrossRef]
- Rostampour, L.; Taher, M.A. Determination of trace amounts of vanadium by UV–vis spectrophotometric after separation and preconcentration with modified natural clinoptilolite as a new sorbent. Talanta 2008, 75, 1279–1283. [Google Scholar] [CrossRef] [PubMed]
- Stefanova, T.S.; Simitchiev, K.K.; Gavazov, K.B. Liquid–liquid extraction and cloud point extraction for spectrophotometric determination of vanadium using 4-(2-pyridylazo) resorcinol. Chem. Pap. 2015, 69, 495–503. [Google Scholar] [CrossRef]
- Manousi, N.; Wojnowski, W.; Płotka-Wasylka, J.; Samanidou, V. Blue applicability grade index (BAGI) and software: A new tool for the evaluation of method practicality. Green Chem. 2023, 25, 7598–7604. [Google Scholar] [CrossRef]

| Parameter | Optimal Value |
|---|---|
| Wavelength, nm | 670 |
| pH | 5.5 |
| Volume of buffer, mL | 2.0 |
| Concentration of 4NC, M | 7.5 × 10⁻⁴ |
| Concentration of CPC, M | 5.0 × 10⁻⁴ |
| Mass fraction of TX, % | 0.4 |
| Incubation time, min | 70 |
| Incubation temperature, °C | 60 |
| Cooling time (at −20 °C), min | 55 |
| Test tube capacity, mL | 50 |
| Mass * of diluted SRP, g | 3.00 |
| Time | Calibration Plot Parameters | ||
|---|---|---|---|
| Slope ± SD | Intercept ± SD | R2 | |
| 0 min = 30 min | 2.402 ± 0.026 | –0.0045 ± 0.0049 | 0.9998 |
| 60 min | 2.401 ± 0.025 | –0.0044 ± 0.0048 | 0.9998 |
| 120 min | 2.400 ± 0.024 | –0.0043 ± 0.0047 | 0.9998 |
| 200 min | 2.417 ± 0.023 | –0.0040 ± 0.0044 | 0.9998 |
| 20 h | 2.549 ± 0.015 | –0.0013 ± 0.0028 | 0.9999 |
| Ion | Added Salt Formula | Ion–V(V) Mass Ratio | V(V) Found, μg | R, % |
|---|---|---|---|---|
| AlIII | Al2(SO4)3·18H2O | 5 | 9.3 | 91.6 |
| 100 a | 10.0 | 98.4 | ||
| BaII | Ba(NO3)2 | 2000 b | 10.3 | 101 |
| Br− | NaBr | 2000 b | 9.9 | 97.6 |
| CaII | Ca(NO3)2 | 2000 b | 10.6 | 104 |
| CdII | Cd(NO3)2·4H2O | 2000 b | 9.6 | 94.4 |
| Citrate3− | Na3C6H5O7 | 500 | 10.0 | 98.3 |
| 2000 | 9.4 | 92.2 | ||
| Cl− | NaCl | 2000 b | 10.4 | 102 |
| CoII | CoSO4·7H2O | 500 | 10.0 | 98.1 |
| CrIII | Cr2(SO4)3 | 2 | 11.3 | 110 |
| 5 c,d | 10.1 | 99.2 | ||
| CrVI | K2CrO4 | 1 | 10.7 | 105 |
| 2 | 11.1 | 109 | ||
| CuII | Cu(SO4)2·5H2O | 50 | 10.4 | 102 |
| F− | NaF | 500 | 9.8 | 96.2 |
| FeIII | Fe2(SO4)3 | 1 | 12.3 | 121 |
| 2 a,d | 10.2 | 100 | ||
| HgII | Hg(NO3)2 | 500 | 9.8 | 96.1 |
| HPO42− | Na2HPO4·12H2O | 1000 | 10.0 | 98.5 |
| I− | KI | 100 | 10.4 | 102 |
| MgII | MgSO4·7H2O | 2000 b | 9.7 | 95.6 |
| MnII | MnSO4·5H2O | 1000 | 10.0 | 98.4 |
| MoVI | Na2MoO4 | 20 | 10.4 | 102 |
| NiII | NiSO4·7H2O | 2000 b | 10.0 | 98.5 |
| PbII | Pb(NO3)2 | 100 | 10.2 | 100 |
| ReVII | NH4ReO4 | 75 | 10.1 | 99.5 |
| SrII | Sr(NO3)2 | 2000 b | 10.1 | 99.4 |
| Tartrate2− | KNaC4H4O6·4H2O | 1000 | 10.1 | 99.0 |
| UVI | UO2(CH3CO2)2·H2O | 50 | 9.4 | 92.4 |
| WVI | Na2WO4·2H2O | 50 | 10.7 | 105 |
| ZnII | ZnSO4·7H2O | 750 | 10.0 | 98.3 |
| Mineral Water | VV Concentration, ng mL−1 | RSD, % | R, % | |
|---|---|---|---|---|
| Added | Found c | |||
| Sample 1 a | 0 | Not detected | – | – |
| 20.4 | 21.0 ± 0.3 | 1.4 | 103.3 | |
| 40.8 | 39.7 ± 0.8 | 2.0 | 97.4 | |
| 61.1 | 61.6 ± 0.3 | 0.5 | 100.8 | |
| Sample 2 b | 0 | 2.1 ± 0.2 | 8.0 | – |
| 20.4 | 20.9 ± 0.6 | 1.9 | 92.4 | |
| 40.8 | 43.7 ± 1.5 | 1.9 | 102.0 | |
| 61.1 | 63.2 ± 3.3 | 6.5 | 100.0 | |
Disclaimer/Publisher’s Note: The statements, opinions and data contained in all publications are solely those of the individual author(s) and contributor(s) and not of MDPI and/or the editor(s). MDPI and/or the editor(s) disclaim responsibility for any injury to people or property resulting from any ideas, methods, instructions or products referred to in the content. |
© 2025 by the authors. Licensee MDPI, Basel, Switzerland. This article is an open access article distributed under the terms and conditions of the Creative Commons Attribution (CC BY) license (https://creativecommons.org/licenses/by/4.0/).
Share and Cite
Gajdošová, A.; Racheva, P.; Kiradzhiyska, D.; Divarova, V.; Saravanska, A.; Šandrejová, J.; Gavazov, K. Centrifuge-Less Mixed Micelle-Mediated Cloud Point Extraction-Spectrophotometric Determination of Vanadium Using 4-Nitrocatechol and Cetylpyridinium Chloride. Int. J. Mol. Sci. 2025, 26, 5808. https://doi.org/10.3390/ijms26125808
Gajdošová A, Racheva P, Kiradzhiyska D, Divarova V, Saravanska A, Šandrejová J, Gavazov K. Centrifuge-Less Mixed Micelle-Mediated Cloud Point Extraction-Spectrophotometric Determination of Vanadium Using 4-Nitrocatechol and Cetylpyridinium Chloride. International Journal of Molecular Sciences. 2025; 26(12):5808. https://doi.org/10.3390/ijms26125808
Chicago/Turabian StyleGajdošová, Andrea, Petya Racheva, Denitsa Kiradzhiyska, Vidka Divarova, Antoaneta Saravanska, Jana Šandrejová, and Kiril Gavazov. 2025. "Centrifuge-Less Mixed Micelle-Mediated Cloud Point Extraction-Spectrophotometric Determination of Vanadium Using 4-Nitrocatechol and Cetylpyridinium Chloride" International Journal of Molecular Sciences 26, no. 12: 5808. https://doi.org/10.3390/ijms26125808
APA StyleGajdošová, A., Racheva, P., Kiradzhiyska, D., Divarova, V., Saravanska, A., Šandrejová, J., & Gavazov, K. (2025). Centrifuge-Less Mixed Micelle-Mediated Cloud Point Extraction-Spectrophotometric Determination of Vanadium Using 4-Nitrocatechol and Cetylpyridinium Chloride. International Journal of Molecular Sciences, 26(12), 5808. https://doi.org/10.3390/ijms26125808