Cells, Instruments, and Materials
The following were purchased for this study: Mouse intestinal epithelial MODE-K cells were purchased from Bei Na Biotechnology Co. (Beijing, China). Micropipettes (Sartorius, Göttingen, Germany). Clean bench (SW-CJ-1FD; Layte, Nantong, China). CO2 cell incubator (Thermo Fisher Scientific, WML, Waltham, MA, USA). Inverted microscope (MF52-N; Guangzhou Mshot Optoelectronic Technology Co., Guangzhou, China). Low-speed centrifuge (L3-5K; Ke-Cheng Technology Co., Taiwan, China). Water bath (HH-2; Changzhou Aohua Instrument Co., Changzhou, China). Enzyme marker (BioTek ELx800; Turner BioSystems, Sunnyvale, CA, USA). Flow cytometer (CytoFLEX; Beckman, Brea, CA, USA). Ultraperformance liquid chromatography tandem Fourier-transformed mass spectrometer (UHPLC-Q Exactive HF-X; Thermo Fisher Scientific, Guangzhou, China). Electronic balance (NewClassic MF MS105DU; Mettler, Zurich, Switzerland). PCR cycler (GeneAmp®9700; ABI, Benton Harbor, MI, USA). Sequencer (NovaSeq 6000; Illumina, San Diego, CA, USA). Electrophoresis power supply (DYY-6C; Beijing Liuyi Instrument Factory, Beijing, China).Penicillin-streptomycin solution (100×), 0.25% trypsin solution (containing EDTA, dissolved in PBS), Dulbecco’s modified Eagle’s medium (Wuhan Procell Life Sciences Co., Wuhan, China). Anti-β-actin antibody (Beijing Boao Sen Biotechnology Co., Beijing, China). Anti-Hsp70 antibody (3A3) (Abcam, Cambridge, UK). Horseradish peroxidase-labelled IgG (Biosharp, Chongqing, China). Foetal bovine serum (ExCell Bio, Suzhou, China). Thiazolyl blue (MedChemExpress, Shanghai, China). Dual antibody (Thermo Fisher Scientific, Guangzhou, China). Library building kits (NEXTFLEX Rapid DNA-Seq; Bio Scientific, Austin, TX, USA). Sequencing kits (NovaSeq Reagent; Illumina, San Diego, CA, USA). Pipettes (N13462C; Eppendorf, Hamburg, Germany). Cell culture dishes, 96-well cell culture plates, and cell culture flasks (Corning, New York, NY, USA).
Cell culture and passage. Culture medium: DMEM + 10% FBS + 1% (penicillin-streptomycin solution). Cell resuscitation: MODE-K cells were quickly removed from liquid nitrogen and placed in a water bath at 37 °C with gentle shaking; after dissolution of the cryopreservation agent, cells were transferred to a centrifuge tube containing 5 mL of medium and centrifuged at 1000 rpm for 5 min at room temperature. The supernatant was discarded, and the cells were harvested and suspended in complete medium containing 10% fetal bovine serum, mixed gently, and placed for culture at 37 °C, 5% CO2, and saturated humidity. The cells were passaged when the cell density reached 80%, and the cells were washed with PBS after the medium was discarded; then, the cells were digested with 1–2 mL of 0.25% trypsin for 1–2 min. When the cells separated from each other and rounded, the trypsin was discarded, and the complete medium was added. Single-cell suspensions were obtained by gentle shaking, passaged at a ratio of 1:3, and incubated at 37 °C, 5% CO2, and saturated humidity.
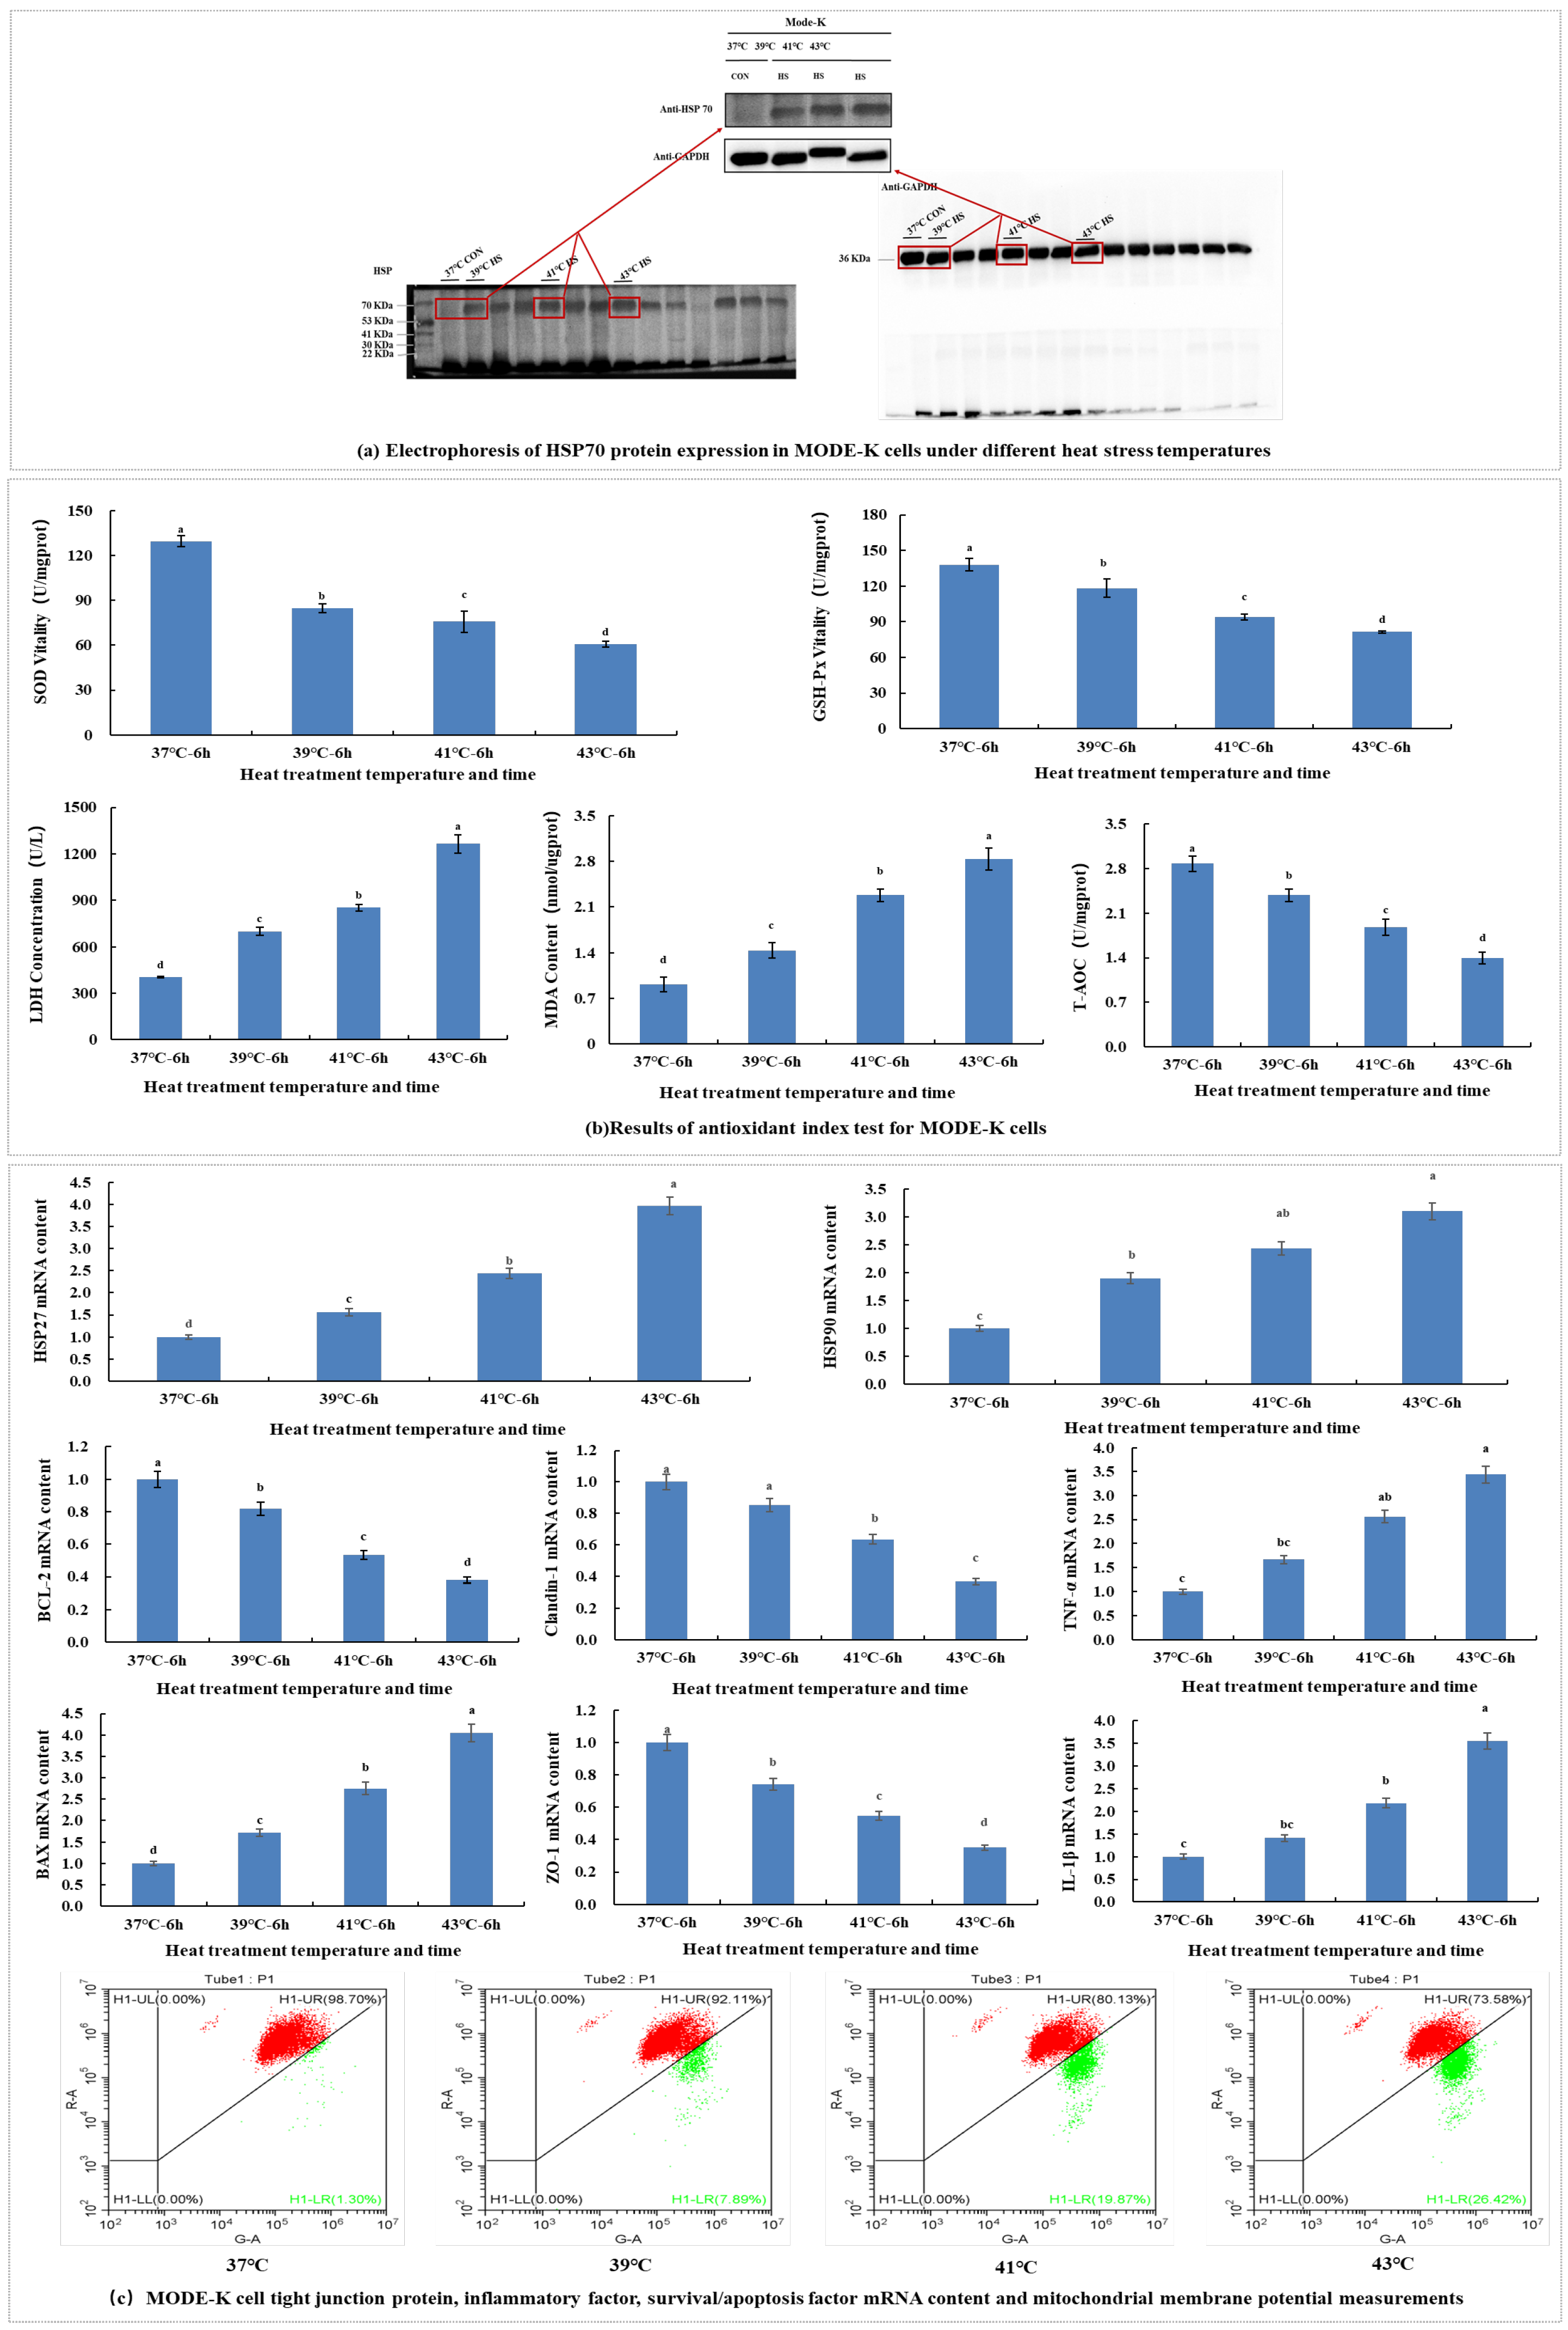
Cellular heat stress model induction. The MODE-K cells were grown to approximately 80% density and then incubated either at 37 °C (CON) or subjected to heat stress at 39 °C (39 °C HS), 41 °C (41 °C HS), and 43 °C (43 °C HS) for 6 h [
73], followed by recovery at 37 °C for 6 h. In each group, three cell samples were used in parallel. The cells were collected for metabolomic and transcriptomic analyses.
Tight junction protein, inflammatory factors, survival/apoptotic factor mRNA expression analysis and mitochondrial membrane potential assay were conducted.
Determination of mitochondrial membrane potential and antioxidant index. Cells under different heat stress temperatures were collected when they were cultured to the experimental state. They were then measured according to MDA, LDH, GSH-PX, T-AOC, SOD, and mitochondrial membrane potential assay kits. Changes in relative mRNA expression of HSP27, HSP70, HSP90, Claudin-1, ZO-1, TNF-α, IL-1β, Bcl-2 and Bax genes were monitored. The Trizol method was used for RNA extraction, as described below: 1 mL Trizol reagent was added to the cells for mixing and transferred to a 1.5 mL RNAse-free EP tube for lysis for 10 min. Then, 200 μL of chloroform was added, mixed vigorously inverted several times, and left for 5 min at room temperature. The mixture was centrifuged for 15 min (4 °C, 12,000 rpm); the upper aqueous phase (approximately 400 μL) was transferred to a new 1.5 mL EP tube, mixed thoroughly by adding 400 μL isopropanol, and left for 10 min at room temperature. The mixture was then centrifuged at 12,000 rpm at 4 °C for 10 min, and a white RNA precipitate was visible at the bottom of the tube. The supernatant was discarded, vortexed with 1 mL of RNAse-free 75% ethanol, and centrifuged at 10,000 rpm for 5 min at 4 °C. This was repeated only once. The supernatant was discarded, and the RNA precipitate was dried in air for 5–10 min and dissolved in 20 μL of DEPC water. Then, 2 μL of dissolved RNA was used to measure the OD260, OD280 and OD260/OD280 values using a microspectrophotometer to calculate the purity and concentration of RNA. The RNA mass was estimated according to the OD260/OD280 ratio, which was between 1.8 and 2.0, to meet experimental requirements. The concentration of total RNA was calculated from the absorbance values according to the following formula:
The total RNA was stored at −80 °C for further analysis. The primer sequences used for genetic testing are listed in
Table 6.
HSP70 electrophoresis. Total protein was extracted from 107 cells. The proteins were separated by electrophoresis on denaturing polyacrylamide gels and blotted onto polyvinylidene difluoride membranes. The membranes were incubated with Tris-buffered saline (TBS) containing 5% skimmed milk powder at room temperature for 2 h and then probed with diluted primary antibodies (mouse anti-human β-actin and HSP70 antibodies) at 4 °C overnight. The following day, after three washes with 0.5% Tween-20/TBS at room temperature, the membranes were incubated with the secondary antibody (horseradish peroxidase-labelled goat anti-mouse IgG antibody) for 2 h. The membranes were washed three times with 0.5% Tween-20 in TBS at room temperature, and specific bands were detected using an ECL chemiluminescence kit (Shanghai Bangjing Industrial Co., Ltd., Shanghai, China).
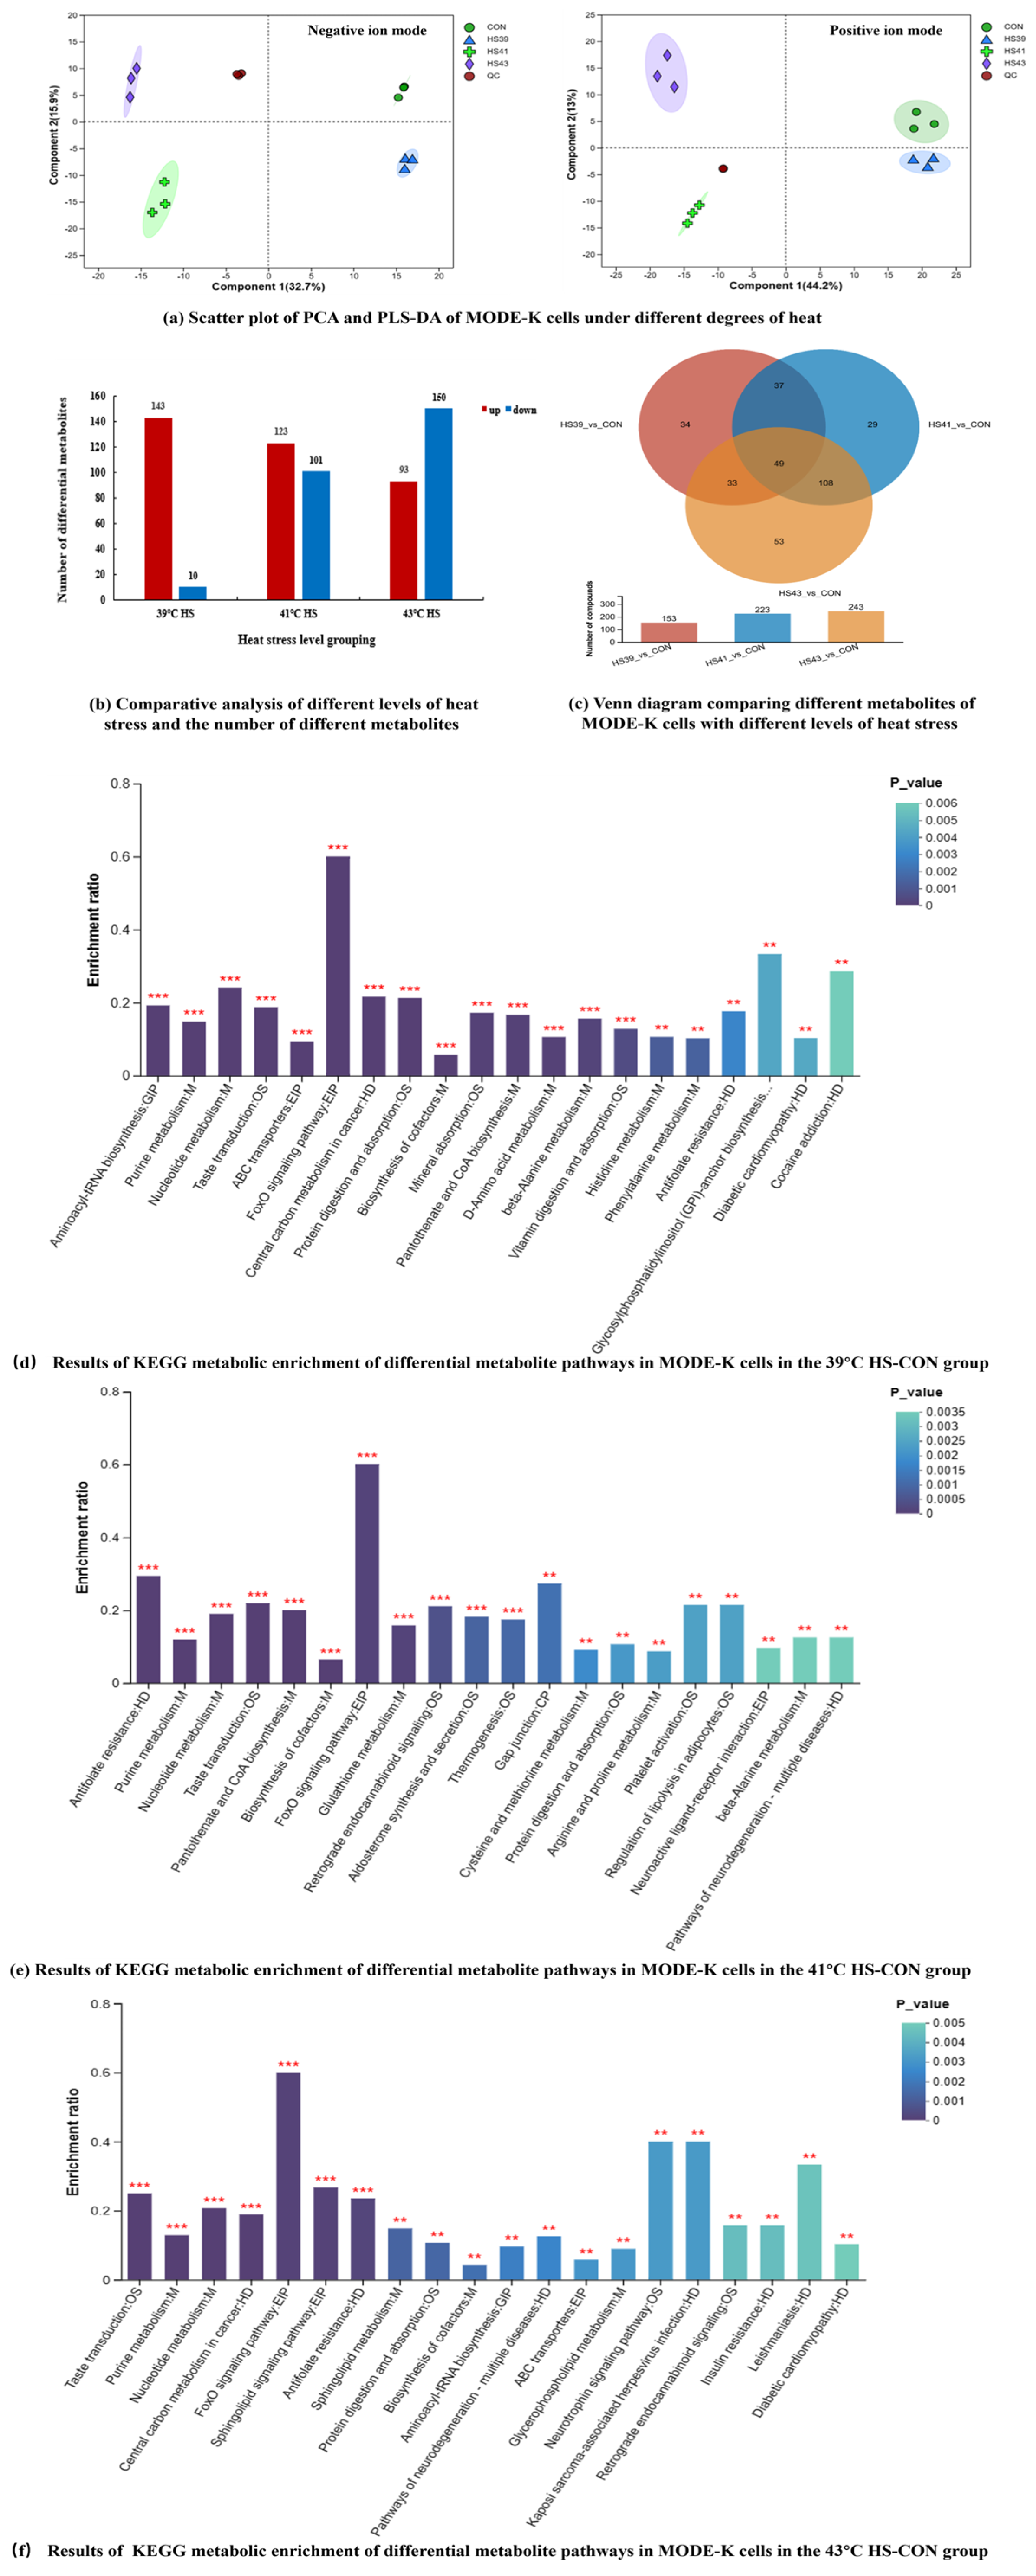
Metabolomic analysis. Metabolomic analysis was performed using the UHPLC-Q Exactive HF-X. Sample Preparation: 10
7 cells were added to a 2 mL centrifuge tube and a 6 mm diameter grinding bead was added. Further, 400 μL of extraction solution (methanol:water = 4:1 (
v:
v)) containing 0.02 mg/mL of internal standard (L-2-chlorophenylalanine) was used for metabolite extraction. Cells were ground using the Wonbio-96c frozen tissue grinder for 6 min (−10 °C, 50 Hz), followed by low-temperature ultrasonic extraction for 30 min (5 °C, 40 kHz). The cells were left at −20 °C for 30 min, centrifuged for 15 min (4 °C, 13,000 ×
g), and the supernatant was transferred to the injection vial for LC-MS/MS analysis. In addition, 20 µL of supernatant was removed from each sample and mixed as a quality control sample. LC−MS Analysis: Chromatographic conditions: ACQUITYUPLCHSST3 (100 mm × 2.1 mm i.d., 1.8 µm; Waters, Milford, CT, USA); mobile phase A consisted of 95% water + 5% acetonitrile (containing 0.1% formic acid), and mobile phase B consisted of 47.5% acetonitrile + 47.5% isopropanol + 5% water (containing 0.1% formic acid). The injection volume was 3 μL, and the column temperature was 40 °C, The elution gradient of the mobile phase is shown in
Table 7. Ms conditions: Samples were ionized by electrospray, and MS signals were collected by positive and negative ion scanning modes, respectively. Scantype 70–1050
m/
z, Sheathgasflowrate50 arb, Auxgasflowrate13 arb, Heatertemp 425 °C, Capillary temp 325 °C, Spray voltage(+) 3500 V, Spray voltage(−) −3500 V, S-Lens RF Level 50, Normalized collision energy 20, 40, 60 eV, Resolution 60,000 Full MS, Resolution 7500 MS2.
Raw mass spectrometry data were filtered for missing values, which were simulated (missing value recoding). Missing value removal is performed by first counting the percentage of actual missing values within the group and filtering out if it is greater than the set missing value threshold. Metabolites with more than 20% missing values within each group are removed; i.e., metabolites with more than 80% non-zero values in at least one group are retained. Filtered data will still have missing values, which are populated in this study using the minimum value of expression for that metabolite in all samples except 0. Standardization: The data were summed and normalized, QC verified RSD ≤ 30%, and Log value method was Log10 value. Quality control: The quality control (QC) samples were prepared by mixing the extract of all samples in the same volume. Each QC volume was the same as the sample, and the QC samples were processed and tested in the same way as the analytical samples. In the process of instrumental analysis, one QC sample was inserted in every five analytical samples to investigate the stability of the whole detection process.
Identification of metabolites. The raw data were imported into ProgenesisQI (Waters Corporation, Milford, CT, USA) for baseline filtering, peak identification, integration, retention time correction, peak alignment, etc. Finally, the data matrix containing retention time, mass-to-charge ratio and peak intensity information was obtained. The software used for metabolite identification was ProgenesisQIv3.0 (Waters Corporation, Milford, CT, USA), and the main databases were the mainstream public databases such as
http://www.hmdb.ca/ (accessed on 25 December 2024),
https://metlin.scripps.edu/ (accessed on 25 December 2024) as well as self-built databases. Search parameters: signal-to-noise ratio S/N ≥ 3. When the S/N ratio of the measurement result is higher than this threshold, the result is considered to be reliable. Molecular formula prediction was performed by using information such as the mass-to-charge ratio (
m/
z) of the parent ion in the primary mass spectrum, possible addition ions and isotopic peaks, and possible metabolites were identified based on a mass deviation of 10 ppm and matching with substances in the database. The secondary spectra of possible substances in the database were matched based on the corresponding daughter ions of each parent ion, scored using improved weighted mass cosine similarity, and those with a secondary fragmentation match score of 35 or more were retained for subsequent analysis. Then, the data were normalized, quality controlled, and converted. The data were compared with the KEGG and HMDB databases to obtain metabolite annotation information. Then, the data were subjected to multivariate statistical analyses, including PCA and OPLS-DA, using the ROPLS package in R. To screen for differential metabolites, we used univariate statistical analysis (
t-tests) combined with multivariate statistical analysis (OPLS-DA/PLS-DA). Differential metabolites were screened out based on
p < 0.05 and VIP > 1 (and |log
2(fold change)| ≥ 1, but not by default). Results were tested using one-way ANOVA with FDR correction, applying the Student’s
t-test for outcome testing with appropriate FDR correction. SciPy in Python (Python 3.13) was used for differential metabolite metabolic pathway enrichment analysis and VIP value analysis. Based on metabolite comparison to KEGG compound IDs, metabolic pathway information was obtained and hierarchical clustering analysis (based on the metabolite expression information in different samples, the distance of metabolites or samples was calculated, and then the metabolites or samples were classified using an iterative approach) was performed. VIP value analysis of the enriched metabolic pathways was performed using the ropls in R package(Version1.6.2, accessed on 25 December 2024).
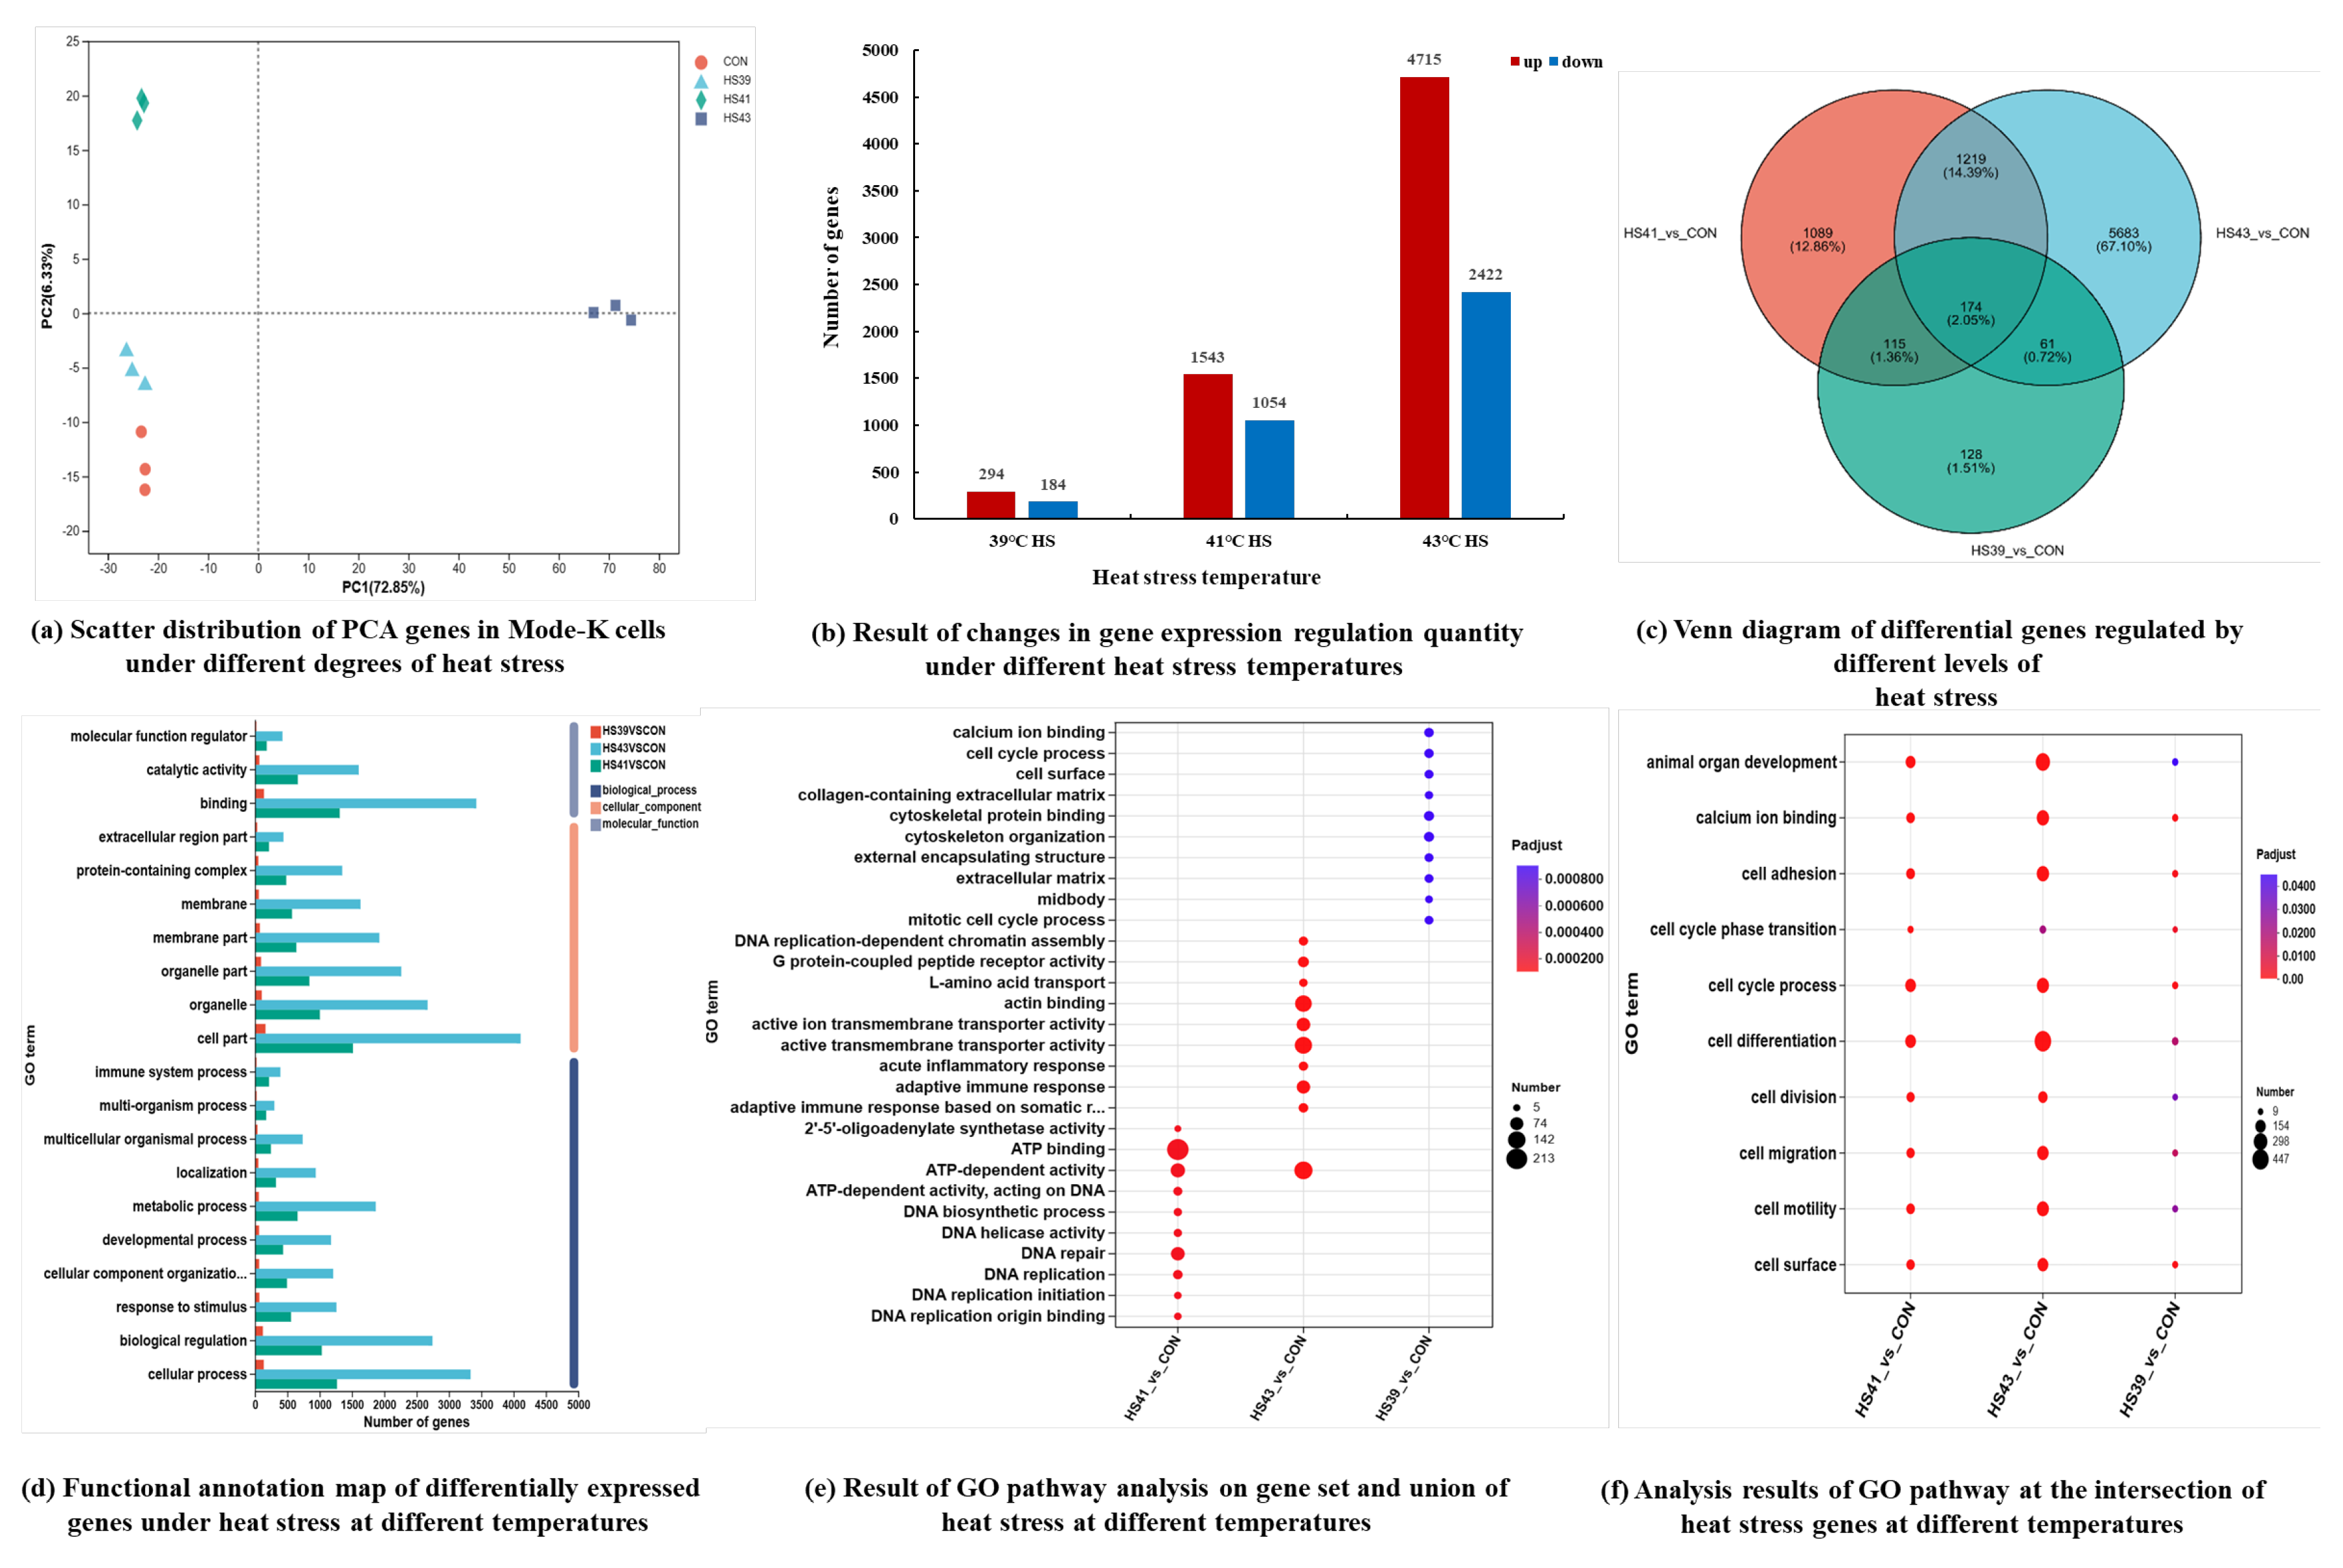
Cellular transcriptomics analysis. Total RNA was extracted from cells (QIAzolLysis Reagent; Qiagen, New York, NY, USA), and RNA concentration and purity were determined using a Nanodrop2000 (Thermo Fisher Scientif, MA, USA). RNA integrity was assessed by agarose gel electrophoresis, and RIN values were determined using an Agilent 2100 instrument. Single builds require total RNA ≥ 1 μg, concentration ≥ 35 ng/μL, OD260/280 ≥ 1.8, and OD260/230 ≥ 1.0. mRNA was enriched using oligo (dT) magnetic beads and digested in fragmentation buffer to obtain approximately 300 bp fragments, which were isolated by magnetic bead screening. The fragments were subjected to reverse cDNA synthesis using reverse transcriptase and six-base random primers (random hexamers). cDNA sticky ends were filled using End Repair Mix, followed by the addition of an A base at the 3 end. The libraries were enriched by PCR amplification in 15 cycles. The PCR products were subjected to 2% agarose gel for the recovery of target bands. We used TBS380 (PicoGreen, Eugene, OR, USA) for quantification. Clusters were generated by bridge PCR amplification on cBot, followed by sequencing on a NovaSeq 6000 platform (read length 2 × 150 bp). The reads were matched with the GRCm39 reference genome (
http://asia.ensembl.org/Mus_musculus/Info/Index, accessed on 25 December 2024) for each sample separately.
Expression analysis: Gene expression levels were calculated by the number of sequences (clean reads) localized to genomic regions (reads counts). The expression levels of genes and transcripts were quantified separately using the software RSEM (
http://deweylab.github.io/RSEM/, accessed on 20 December 2024) for subsequent analysis of differential expression of genes/transcripts among different samples.
Differential expression analysis: After obtaining the ReadCounts of genes, multi-sample (≥2) projects were analyzed for differential expression of genes between samples to identify the differentially expressed genes between samples and then to study the functions of the differentially expressed genes. The software used for differential expression is DESeq2 (
http://bioconductor.org/packages/stats/bioc/DESeq2/, accessed on 25 December 2024), and the default screening criteria for significantly differentially expressed genes are: FDR < 0.05&|log
2FC| ≥ 1. When a gene satisfies these two conditions at the same time, the gene is regarded as a Differentially expressed gene (DEG).
Differential gene function annotation: Using the GO database (
http://geneontology.org/, accessed on 25 December 2024), we can perform GO annotation on differentially expressed genes. Using KEGG database (
https://www.genome.jp/kegg/, accessed on 25 December 2024), genes can be categorized according to the pathways they participate in or the functions they perform, and KEGG annotation of differentially expressed genes can be realized.
Enrichment of differentially expressed genes: Enrichment analysis was performed using the software Goatools (
https://github.com/tanghaibao/GOatools, accessed on 25 December 2024) using Fisher’s exact test. The
p-values were corrected for four multiple tests (Bonferroni, Holm, Sidak and false discovery rate) to control for the calculated false-positive rate, and, in general, significant enrichment was considered to exist for this GO function when the corrected
p-value (p_fdr) was <0.05. KEGG pathway enrichment analysis was performed using the Pythonscipy software package (
https://scipy.org/install/, accessed on 25 December 2024) and calculated using Fisher’s exact test. To control the calculation of false-positive rate, multiple tests were performed using the BH (FDR) method, and the corrected
p-value was used as the threshold value of 0.05; KEGG pathways meeting this condition were defined as KEGG pathways significantly enriched in differentially expressed genes. The data were analyzed on the online platform of Majorbio Cloud Platform (
www.majorbio.com, Visit from October to December 2024).


 ,
, 

