Figure 1.
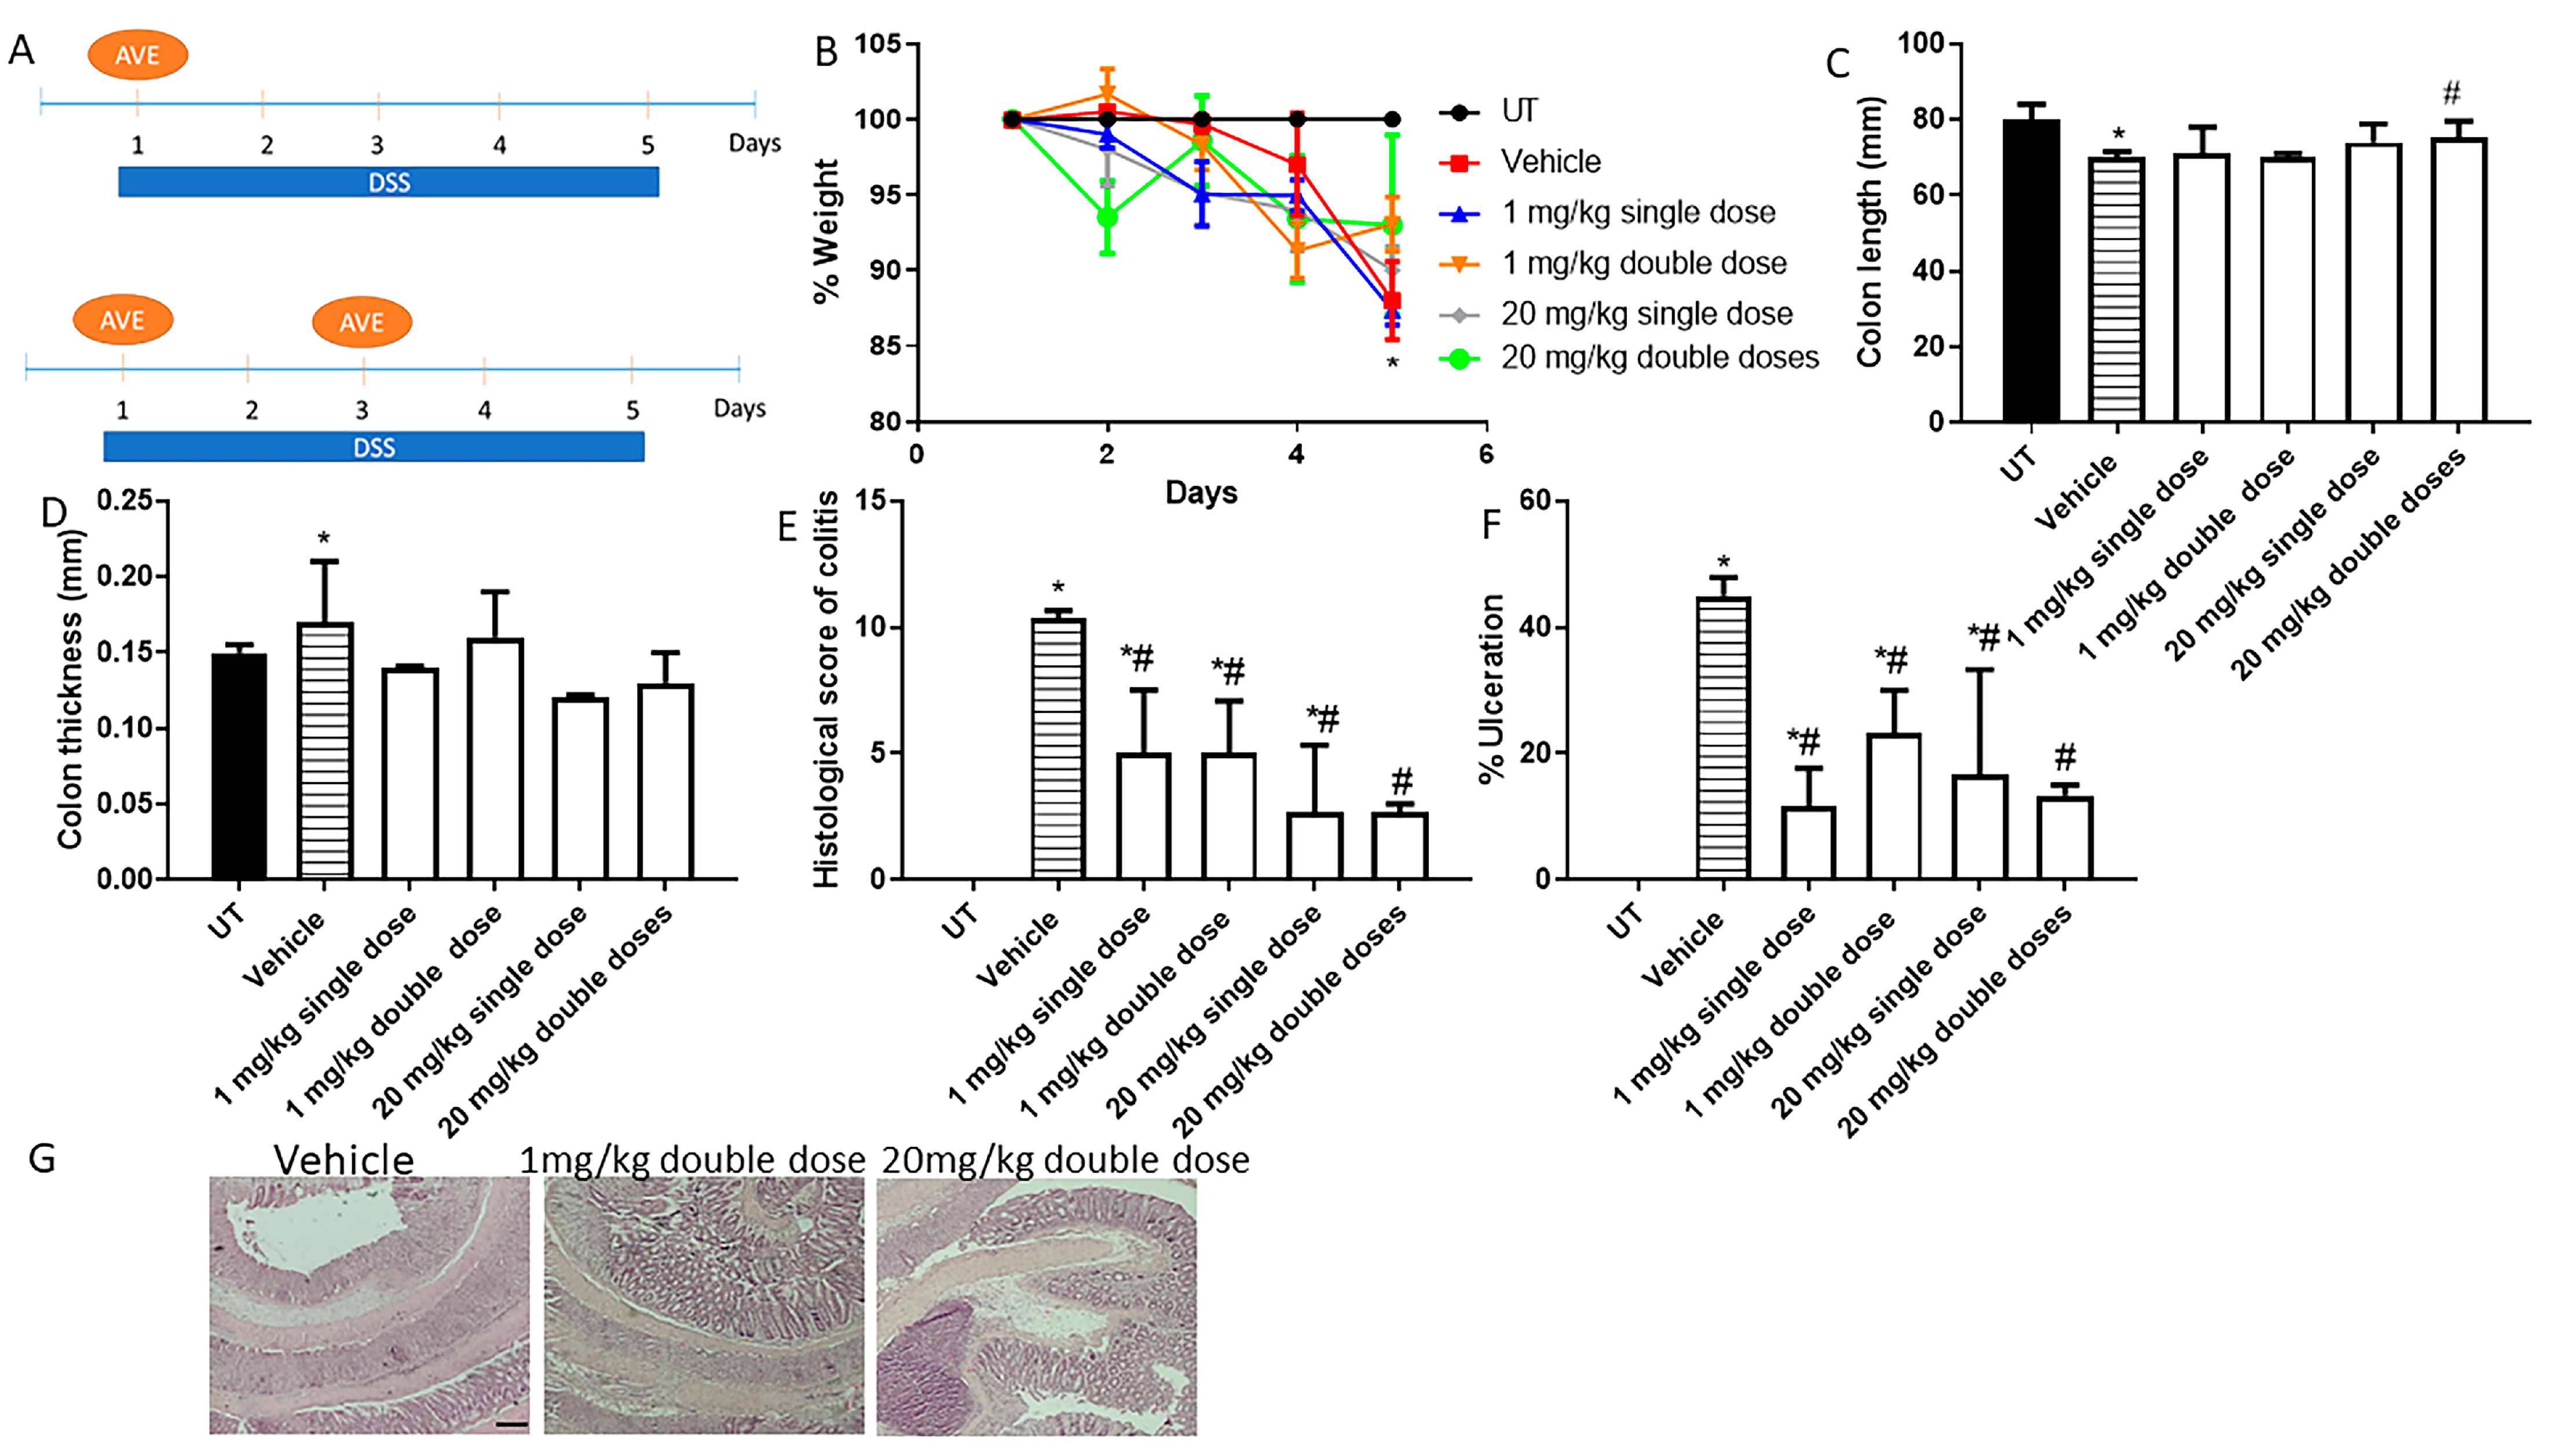
Effect of administration of a single or double dose of AVE0991 on colitis severity using the prophylactic approach. (A) shows the protocols used in this part of the study. (B) shows percentage body weight changes in vehicle- or AVE0991-treated mice after DSS administration compared to untreated (UT) mice receiving tap water only. Colon length (C) and thickness (D) were determined in vehicle- (hatched bars) or AVE0991-treated mice (open bars) compared to the UT group (solid bars). (E,F) represent the histological assessment of colitis severity and the percentage of ulceration in the whole colon section, respectively, in the indicated groups. (G) illustrates a colon section taken from a mouse treated by daily i.p vehicle plus DSS, where there is significant mucosal destruction, goblet cell depletion, muscle thickness, and immune cells recruitment, or a mouse treated with 1 or 20 mg/kg double dose of AVE0991, with little improvement in colitis severity. * denotes a significant difference from UT mice, with p < 0.05. # denotes a significant difference from DSS/i.p vehicle-treated mice, with p < 0.05 (n = 3 per group). The scale bar represents 150 µm.
Figure 1.
Effect of administration of a single or double dose of AVE0991 on colitis severity using the prophylactic approach. (A) shows the protocols used in this part of the study. (B) shows percentage body weight changes in vehicle- or AVE0991-treated mice after DSS administration compared to untreated (UT) mice receiving tap water only. Colon length (C) and thickness (D) were determined in vehicle- (hatched bars) or AVE0991-treated mice (open bars) compared to the UT group (solid bars). (E,F) represent the histological assessment of colitis severity and the percentage of ulceration in the whole colon section, respectively, in the indicated groups. (G) illustrates a colon section taken from a mouse treated by daily i.p vehicle plus DSS, where there is significant mucosal destruction, goblet cell depletion, muscle thickness, and immune cells recruitment, or a mouse treated with 1 or 20 mg/kg double dose of AVE0991, with little improvement in colitis severity. * denotes a significant difference from UT mice, with p < 0.05. # denotes a significant difference from DSS/i.p vehicle-treated mice, with p < 0.05 (n = 3 per group). The scale bar represents 150 µm.
![Ijms 26 05784 g001]()
Figure 2.
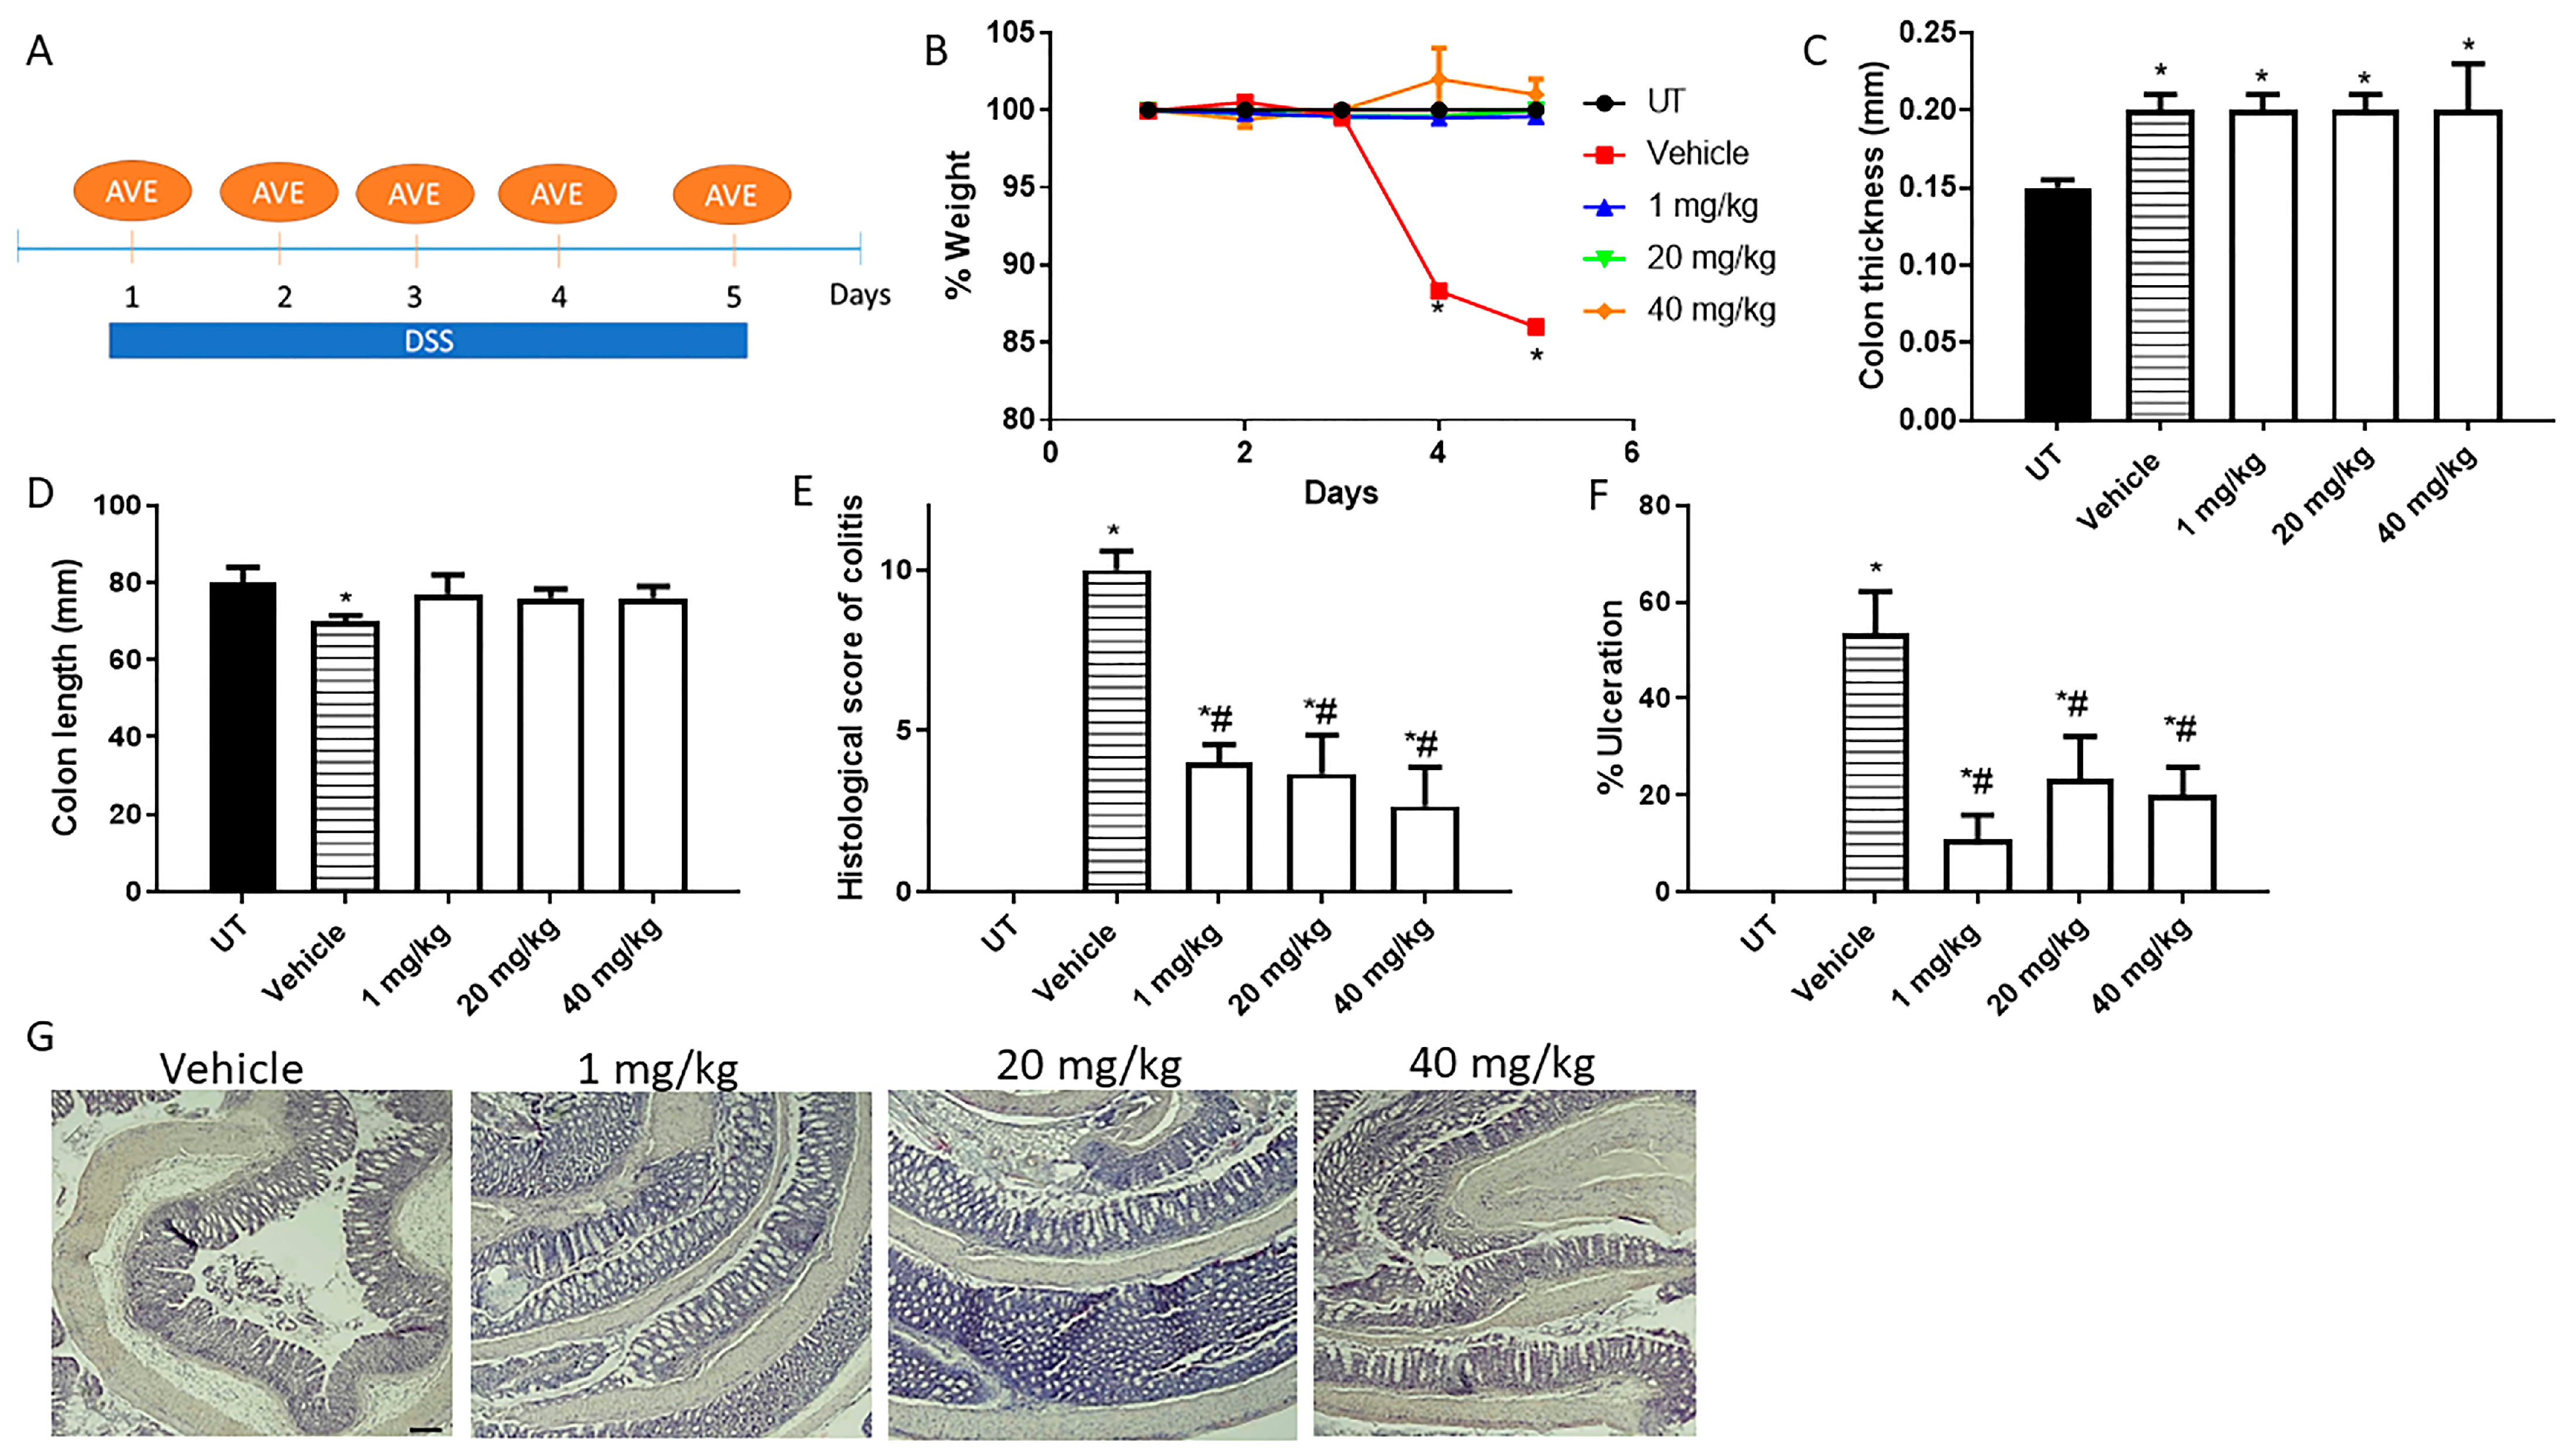
Effect of daily administration of AVE0991 on colitis severity using the prophylactic approach. (A) shows the protocol used in this part of the study. (B) shows percentage body weight changes in vehicle- or AVE0991-treated mice after DSS administration compared to UT mice. Colon length (C) and thickness (D) were determined in vehicle- (hatched bars) or AVE0991-treated mice (open bars) compared to the UT group (solid bars). (E,F) represent the histological assessment of colitis severity and the percentage of ulceration in the whole colon section, respectively, in the indicated groups. (G) illustrates a colon section taken from a mouse treated by daily i.p vehicle plus DSS, or a mouse treated with 1, 20, or 40 mg/kg daily dose of AVE0991 with significant improvement in colitis severity. * denotes a significant difference from UT mice, with p < 0.05. # denotes a significant difference from DSS/i.p vehicle-treated mice, with p < 0.05 (n = 3 per group). The scale bar represents 150 µm.
Figure 2.
Effect of daily administration of AVE0991 on colitis severity using the prophylactic approach. (A) shows the protocol used in this part of the study. (B) shows percentage body weight changes in vehicle- or AVE0991-treated mice after DSS administration compared to UT mice. Colon length (C) and thickness (D) were determined in vehicle- (hatched bars) or AVE0991-treated mice (open bars) compared to the UT group (solid bars). (E,F) represent the histological assessment of colitis severity and the percentage of ulceration in the whole colon section, respectively, in the indicated groups. (G) illustrates a colon section taken from a mouse treated by daily i.p vehicle plus DSS, or a mouse treated with 1, 20, or 40 mg/kg daily dose of AVE0991 with significant improvement in colitis severity. * denotes a significant difference from UT mice, with p < 0.05. # denotes a significant difference from DSS/i.p vehicle-treated mice, with p < 0.05 (n = 3 per group). The scale bar represents 150 µm.
![Ijms 26 05784 g002]()
Figure 3.
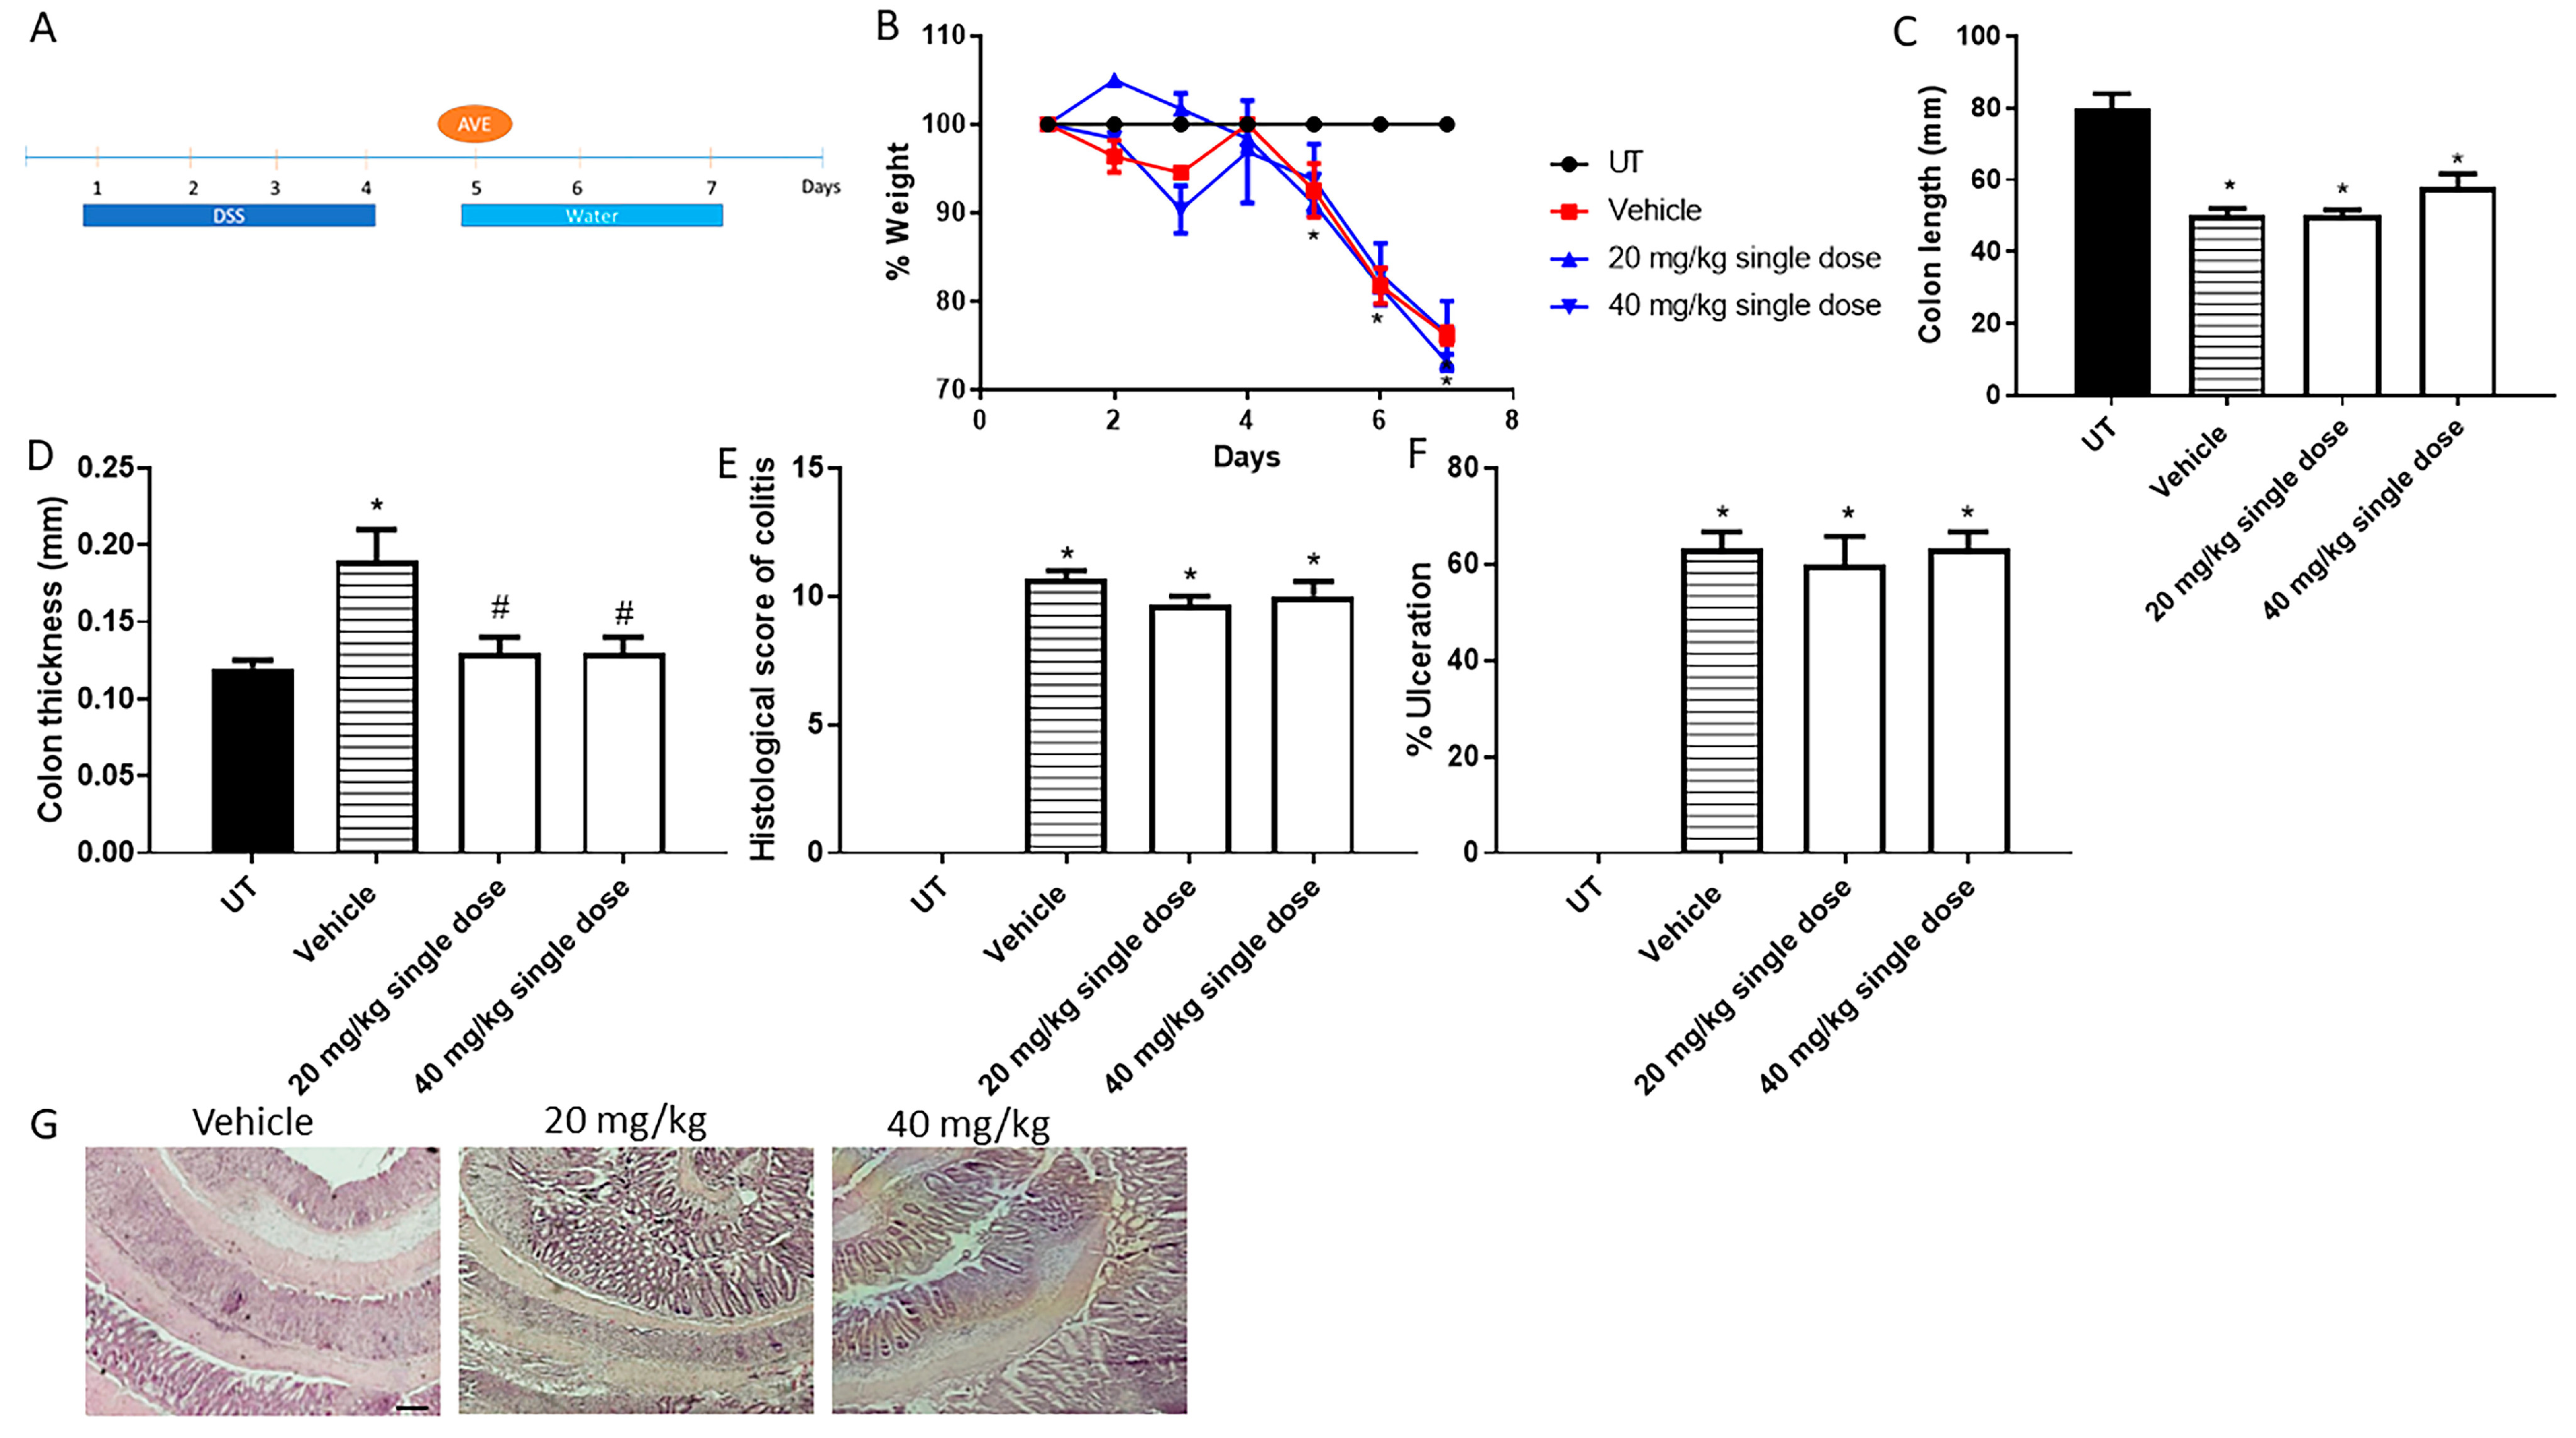
Effect of administration of a single dose of AVE0991 on colitis severity using the treatment approach. (A) shows the protocol used in this part of the study. (B) shows percentage body weight changes in vehicle- or AVE0991-treated mice after DSS administration compared to UT mice. Colon length (C) and thickness (D) were determined in vehicle- (hatched bars) or AVE0991-treated mice (open bars) compared to the UT group (solid bars). (E,F) represent the histological assessment of colitis severity and the percentage of ulceration in the whole colon section, respectively, in the indicated groups. (G) illustrates a colon section taken from a mouse treated by daily i.p vehicle plus DSS, or a mouse treated with a single dose of AVE0991 (20 or 40 mg/kg) with little improvement in colitis severity. * denotes a significant difference from UT mice, with p < 0.05. # denotes a significant difference from DSS/i.p vehicle-treated mice, with p < 0.05 (n = 3 per group). The scale bar represents 150 µm.
Figure 3.
Effect of administration of a single dose of AVE0991 on colitis severity using the treatment approach. (A) shows the protocol used in this part of the study. (B) shows percentage body weight changes in vehicle- or AVE0991-treated mice after DSS administration compared to UT mice. Colon length (C) and thickness (D) were determined in vehicle- (hatched bars) or AVE0991-treated mice (open bars) compared to the UT group (solid bars). (E,F) represent the histological assessment of colitis severity and the percentage of ulceration in the whole colon section, respectively, in the indicated groups. (G) illustrates a colon section taken from a mouse treated by daily i.p vehicle plus DSS, or a mouse treated with a single dose of AVE0991 (20 or 40 mg/kg) with little improvement in colitis severity. * denotes a significant difference from UT mice, with p < 0.05. # denotes a significant difference from DSS/i.p vehicle-treated mice, with p < 0.05 (n = 3 per group). The scale bar represents 150 µm.
![Ijms 26 05784 g003]()
Figure 4.
Effect of daily administration of AVE0991 on colitis severity using the treatment approach. (A) shows the protocol used in this part of the study. (B) shows percentage body weight changes in vehicle- or AVE0991-treated mice after DSS administration compared to UT mice. Colon length (C) and thickness (D) were determined in vehicle- (hatched bars) or AVE0991-treated mice (open bars) compared to the UT group (solid bars). (E,F) represent the histological assessment of colitis severity and the percentage of ulceration in the whole colon section, respectively, in the indicated groups. (G) illustrates a colon section taken from a mouse treated by daily i.p vehicle plus DSS, or a mouse treated with 30 or 40 mg/kg daily dose of AVE0991 with significant improvement in colitis severity. * denotes a significant difference from UT mice, with p < 0.05. # denotes a significant difference from DSS/i.p vehicle-treated mice, with p < 0.05 (vehicle n = 6, UT and the treatment groups n = 4 per group). The scale bar represents 150 µm.
![Ijms 26 05784 g004]()
Figure 5.
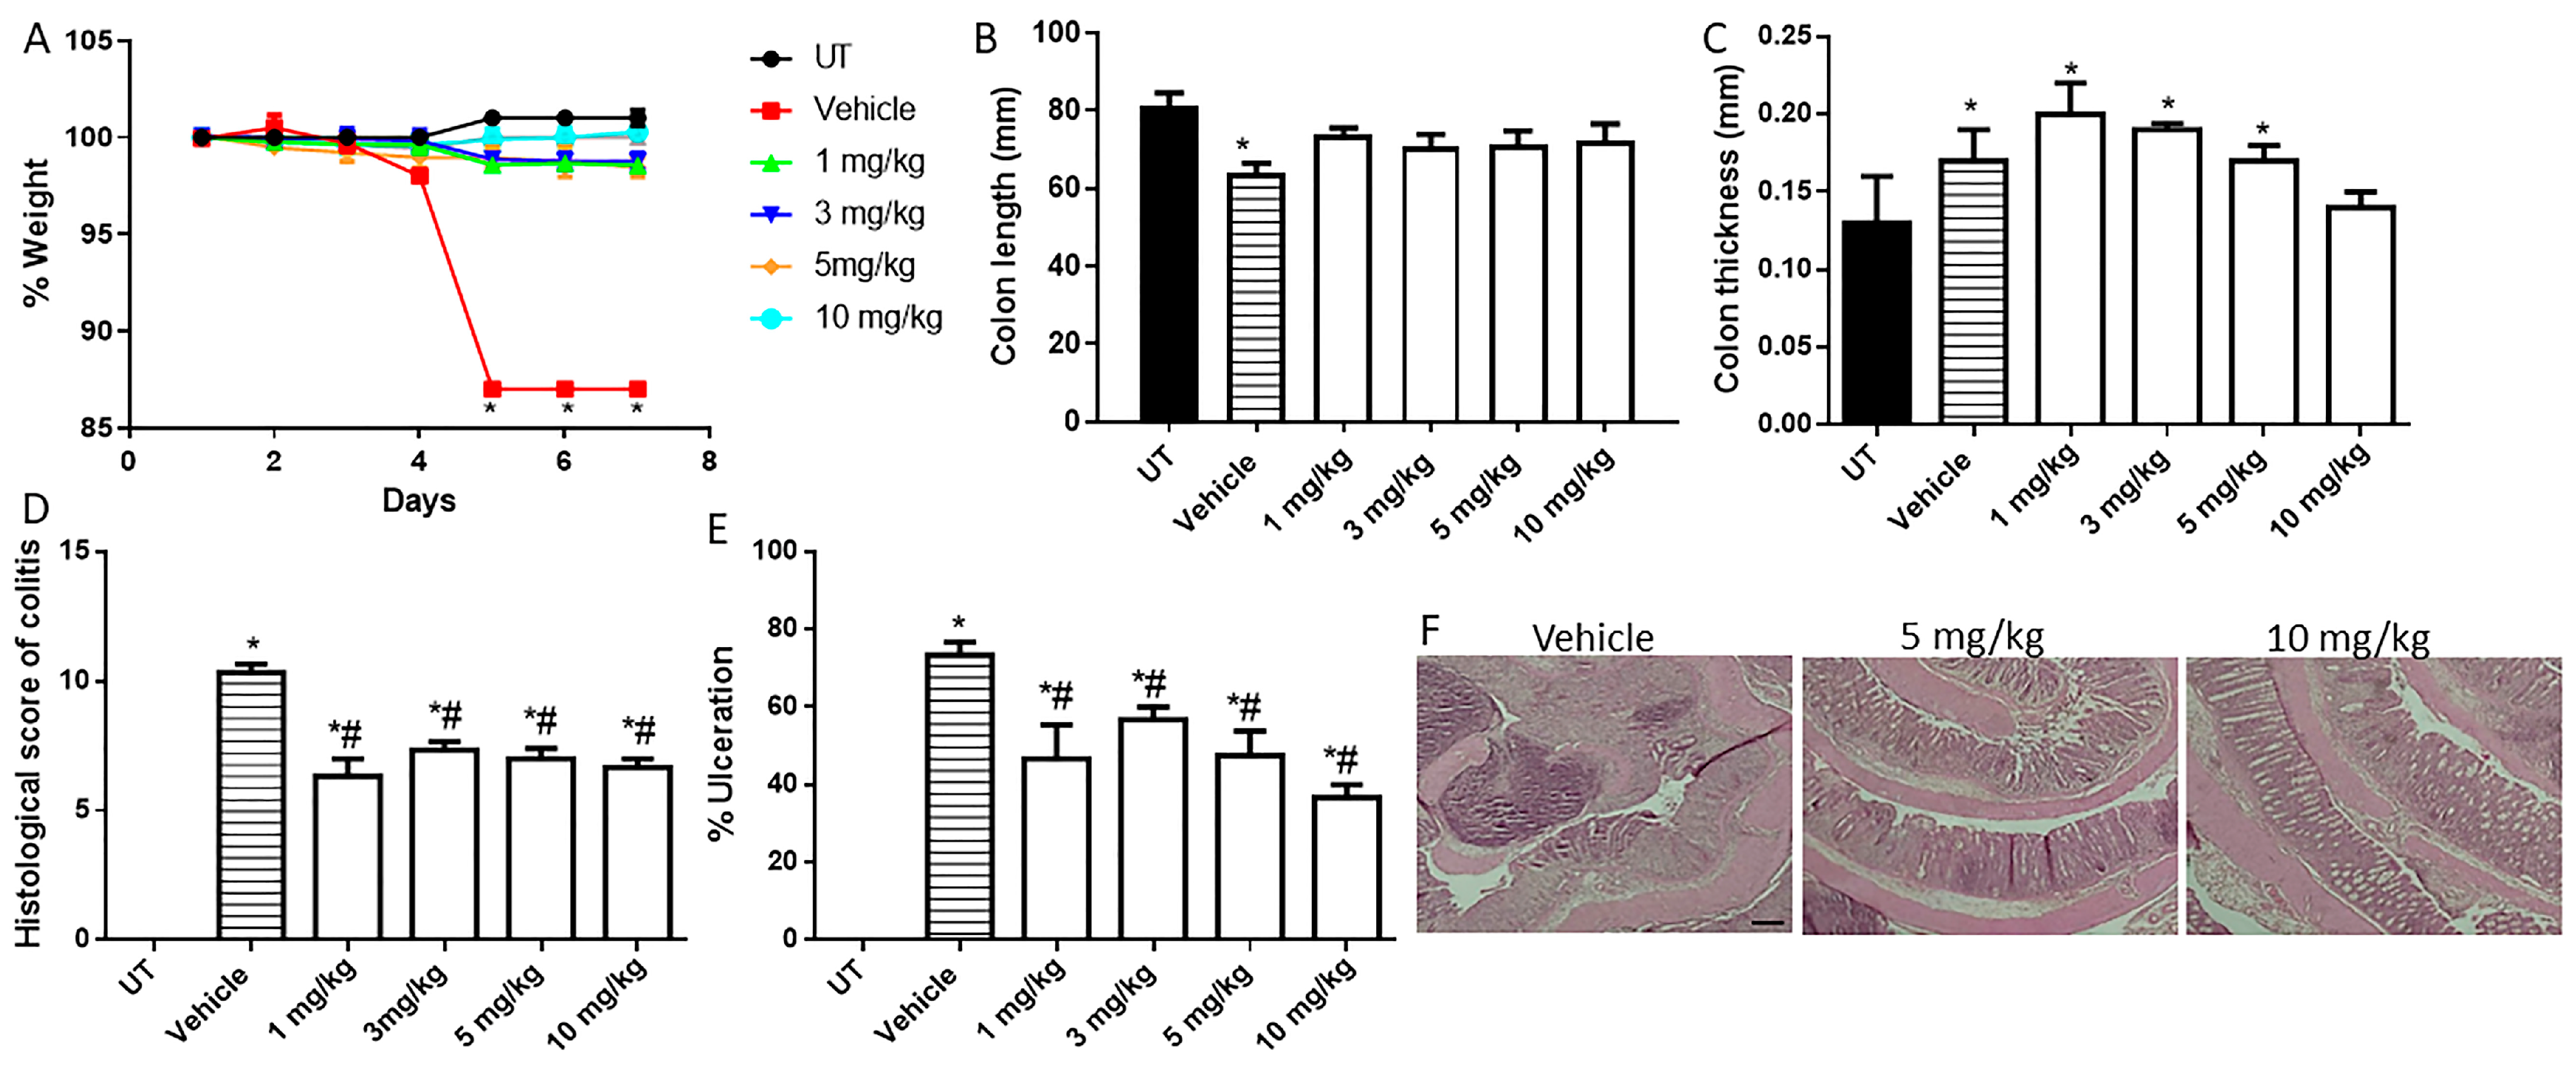
Effect of daily administration of azathioprine on colitis severity using the treatment approach. (A) shows percentage body weight changes in vehicle- or azathioprine-treated mice after DSS administration compared to UT mice. Colon length (B) and thickness (C) were determined in vehicle- (hatched bars) or azathioprine-treated mice (open bars) compared to the UT group (solid bars). (D,E) represent the histological assessment of colitis severity and the percentage of ulceration in the whole colon section, respectively, in the indicated groups. (F) illustrates a colon section taken from a mouse treated by daily i.p vehicle plus DSS, or a mouse treated with 5 or 10 mg/kg daily dose of azathioprine with some improvement in colitis severity. * denotes a significant difference from UT mice, with p < 0.05. # denotes a significant difference from DSS/i.p vehicle-treated mice, with p < 0.05 (vehicle n = 4, UT and the treatment groups n = 3 per group). The scale bar represents 150 µm.
Figure 5.
Effect of daily administration of azathioprine on colitis severity using the treatment approach. (A) shows percentage body weight changes in vehicle- or azathioprine-treated mice after DSS administration compared to UT mice. Colon length (B) and thickness (C) were determined in vehicle- (hatched bars) or azathioprine-treated mice (open bars) compared to the UT group (solid bars). (D,E) represent the histological assessment of colitis severity and the percentage of ulceration in the whole colon section, respectively, in the indicated groups. (F) illustrates a colon section taken from a mouse treated by daily i.p vehicle plus DSS, or a mouse treated with 5 or 10 mg/kg daily dose of azathioprine with some improvement in colitis severity. * denotes a significant difference from UT mice, with p < 0.05. # denotes a significant difference from DSS/i.p vehicle-treated mice, with p < 0.05 (vehicle n = 4, UT and the treatment groups n = 3 per group). The scale bar represents 150 µm.
Figure 6.
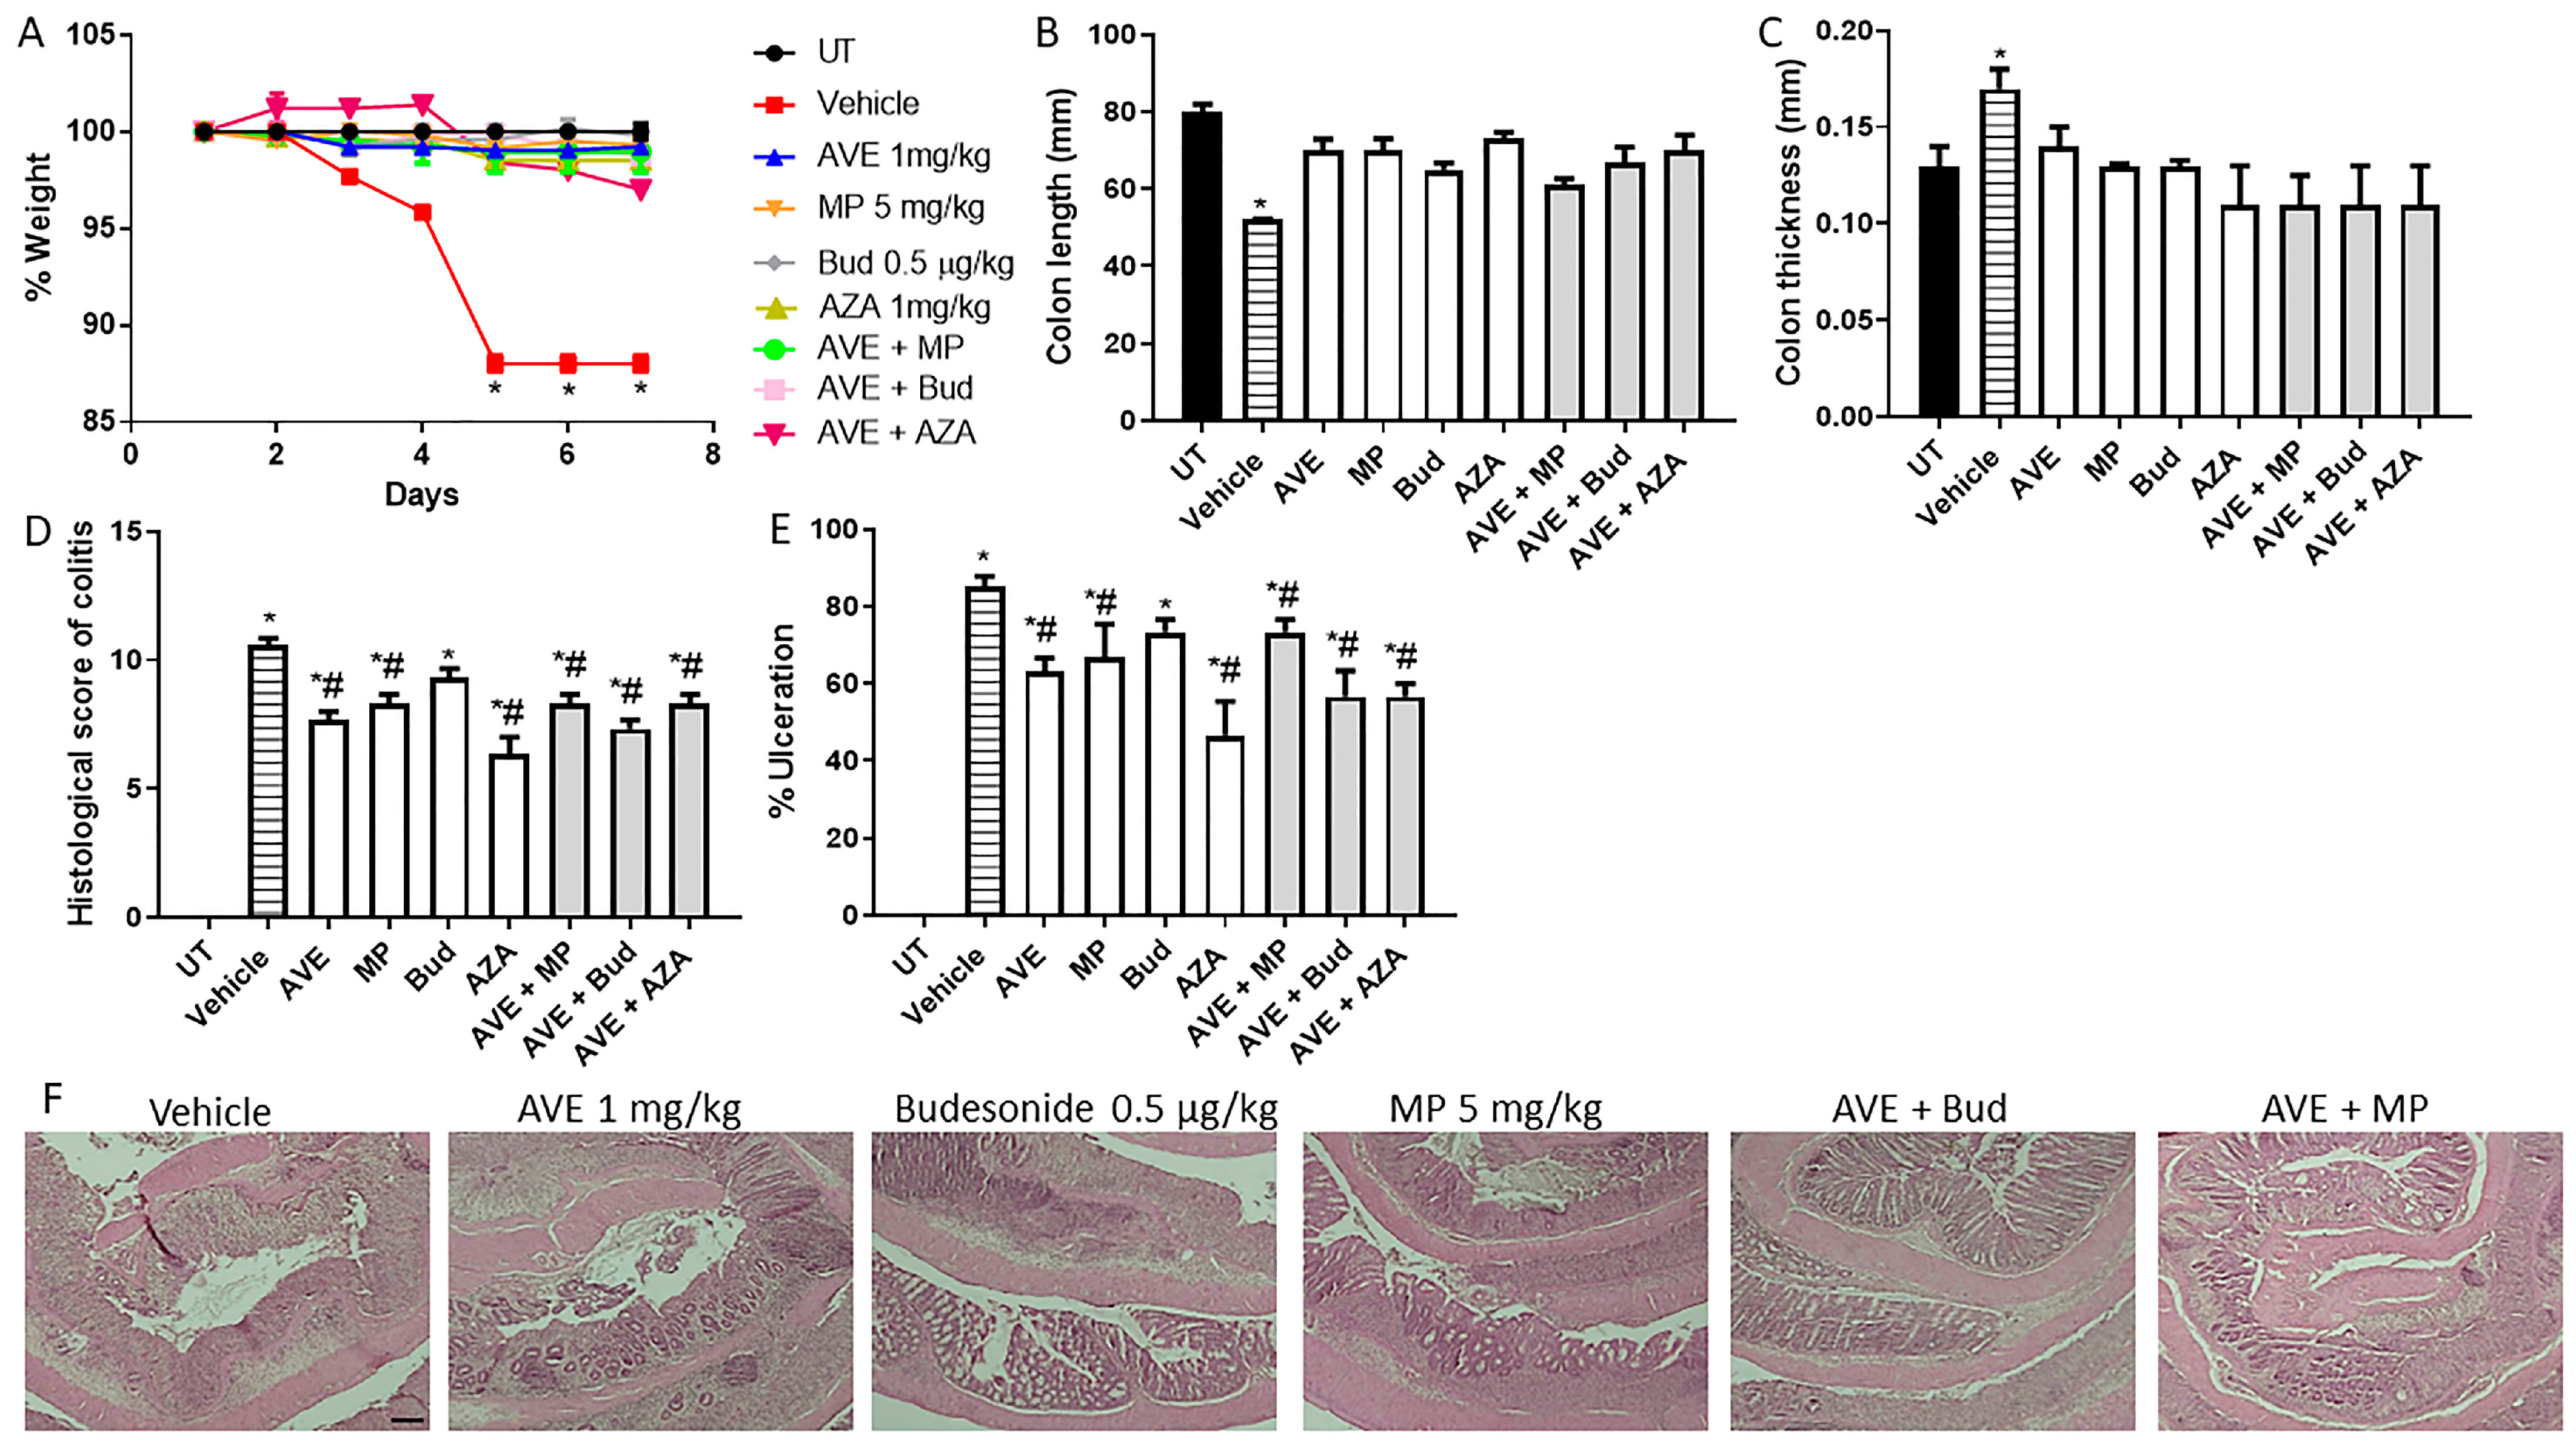
Effect of methylprednisolone, budesonide, and azathioprine; either as monotherapy or in combination with AVE0991 (1 mg/kg dose) on colitis severity using the treatment approach. (A) shows percentage body weight changes in the different treatment approaches. Colon length (B) and thickness (C) were determined in the vehicle (hatched bars) or different treatment approaches (open bars for monotherapy and gray bars for combination regimens) compared to the UT group (solid bars). (D,E) represent the histological assessment of colitis severity and the percentage of ulceration in the whole colon section, respectively, in the indicated groups. (F) illustrates a colon section taken from different treatment regimens. * denotes a significant difference from UT mice, with p < 0.05. # denotes a significant difference from DSS/i.p vehicle-treated mice, with p < 0.05 (n = 3 per group). The scale bar represents 150 µm.
Figure 6.
Effect of methylprednisolone, budesonide, and azathioprine; either as monotherapy or in combination with AVE0991 (1 mg/kg dose) on colitis severity using the treatment approach. (A) shows percentage body weight changes in the different treatment approaches. Colon length (B) and thickness (C) were determined in the vehicle (hatched bars) or different treatment approaches (open bars for monotherapy and gray bars for combination regimens) compared to the UT group (solid bars). (D,E) represent the histological assessment of colitis severity and the percentage of ulceration in the whole colon section, respectively, in the indicated groups. (F) illustrates a colon section taken from different treatment regimens. * denotes a significant difference from UT mice, with p < 0.05. # denotes a significant difference from DSS/i.p vehicle-treated mice, with p < 0.05 (n = 3 per group). The scale bar represents 150 µm.
Figure 7.
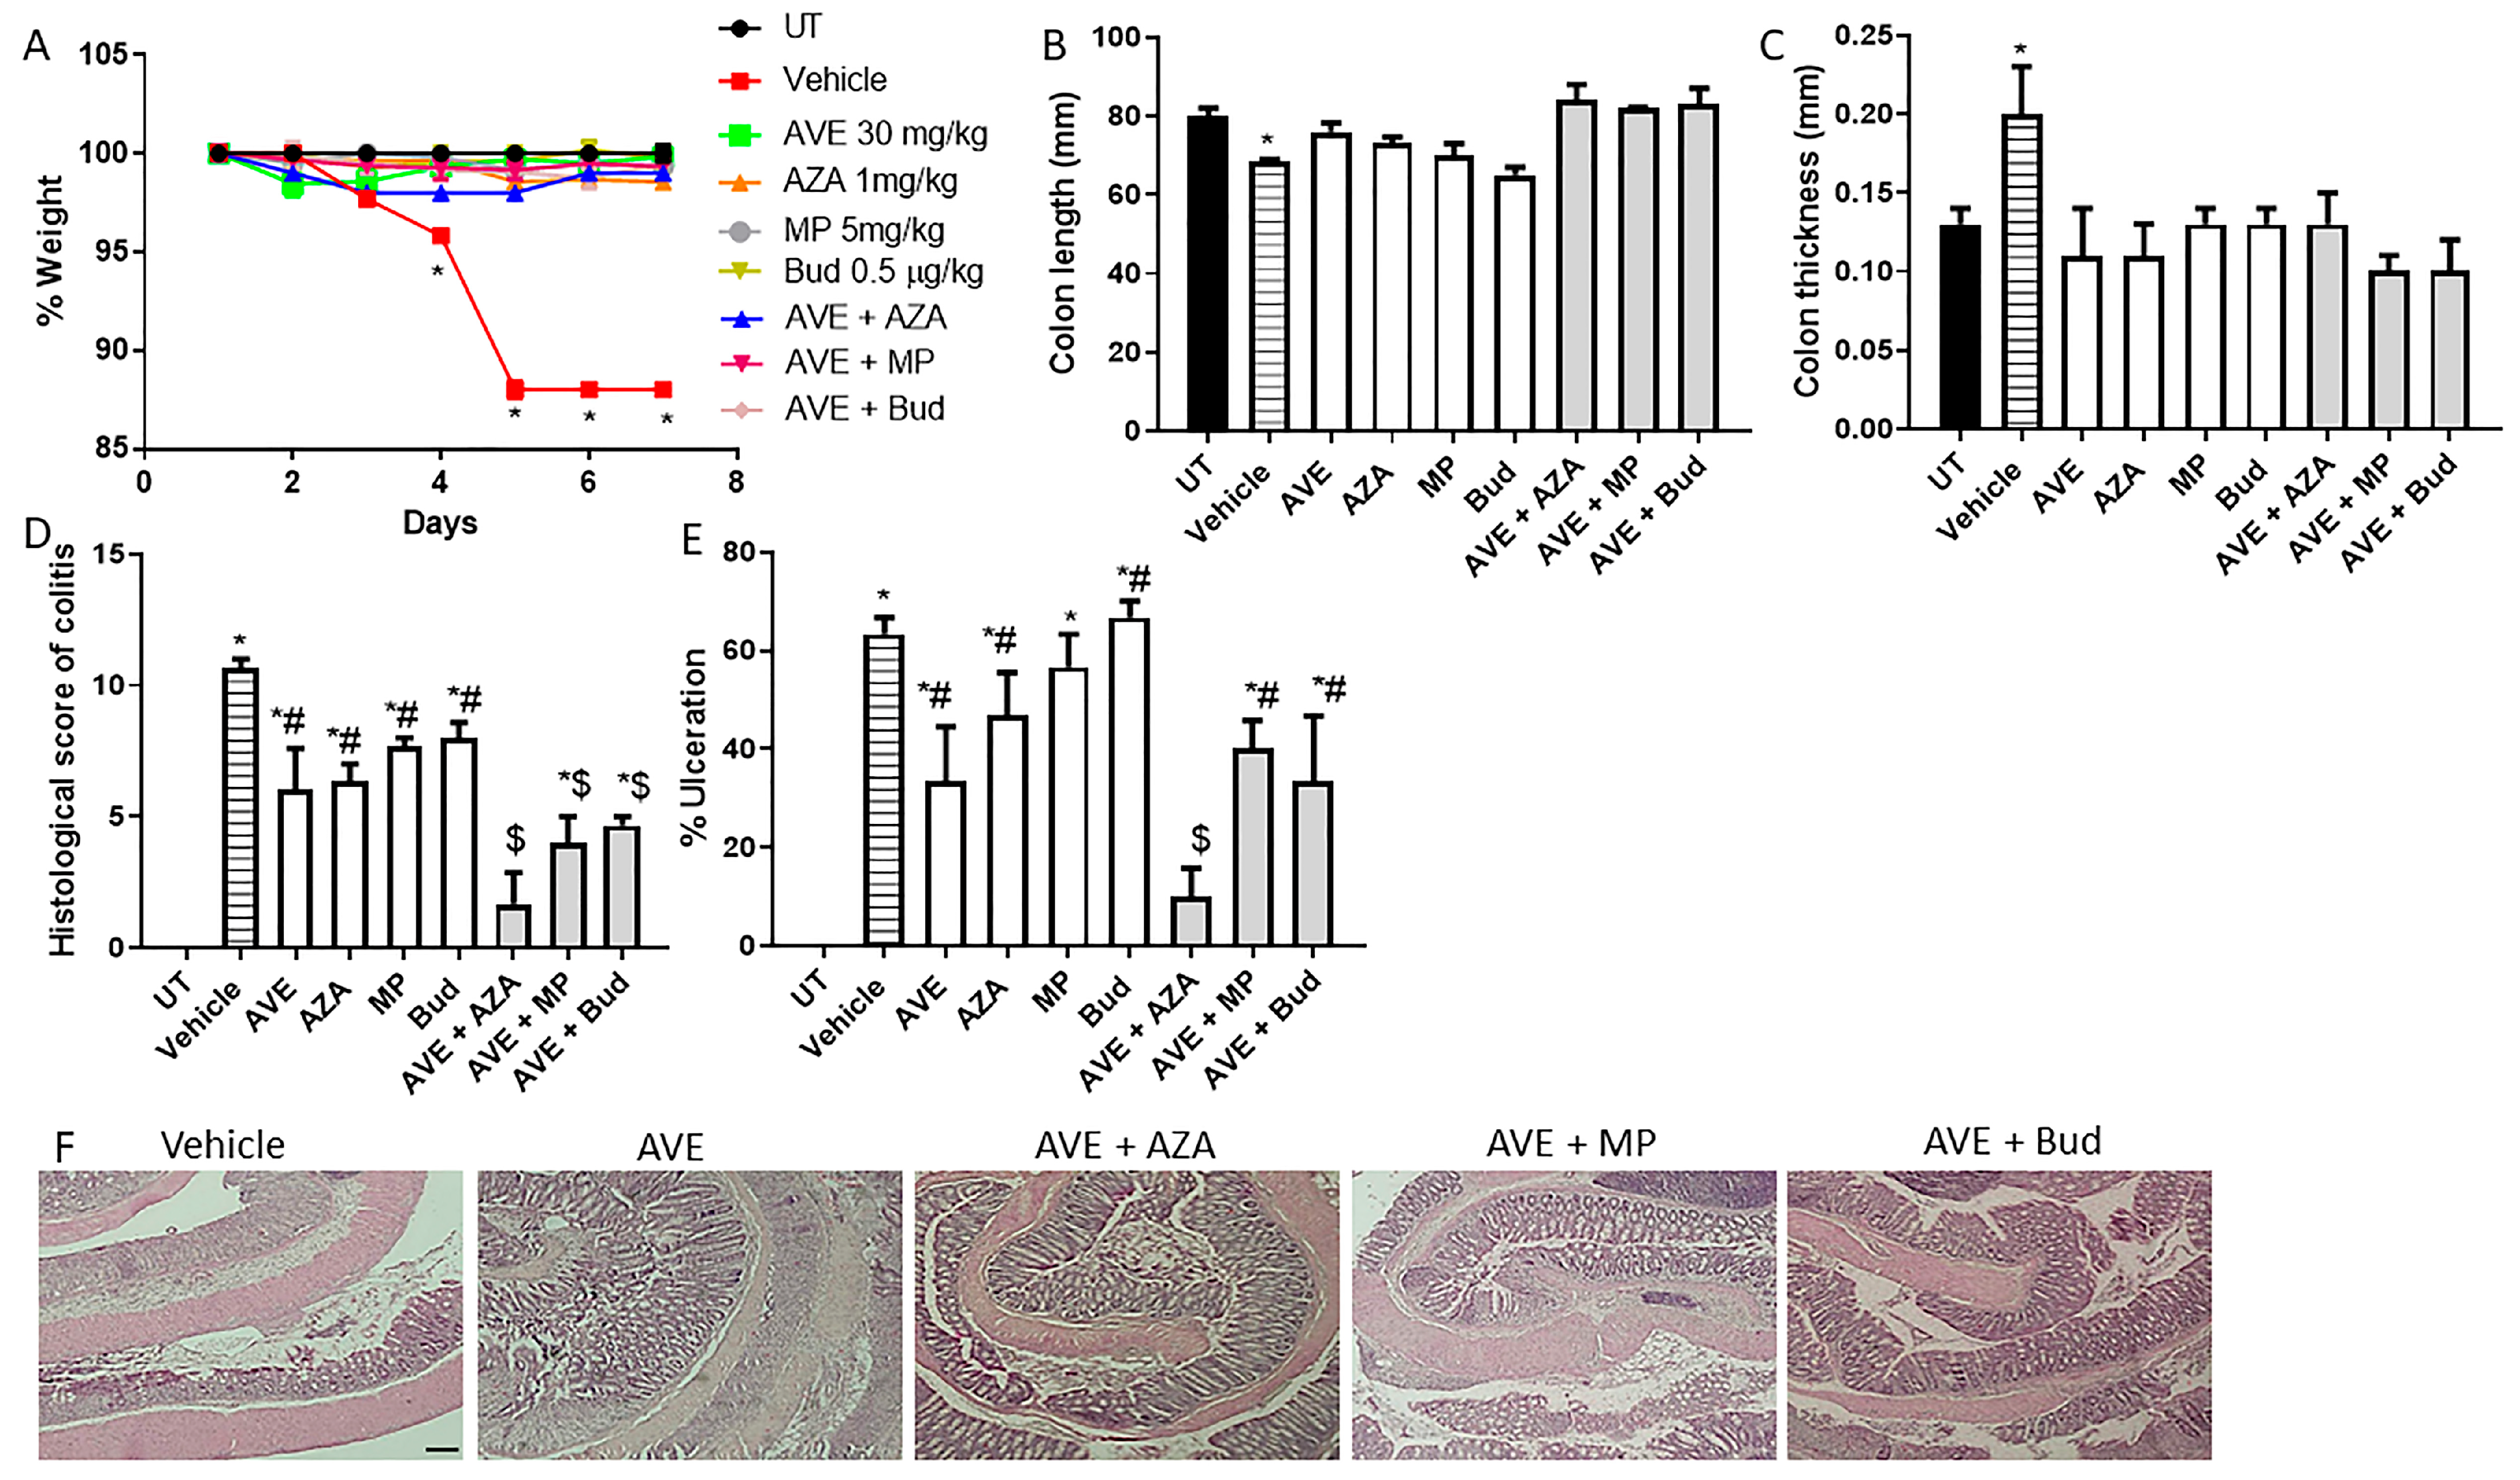
Effect of methylprednisolone, budesonide, and azathioprine; either as monotherapy or in combination with AVE0991 (30 mg/kg dose) on colitis severity using the treatment approach. (A) shows percentage body weight changes in the different treatment approaches. Colon length (B) and thickness (C) were determined in the vehicle (hatched bars) or different treatment approaches (open bars for monotherapy and gray bars for combination regimens) compared to the UT group (solid bars). (D,E) represent the histological assessment of colitis severity and the percentage of ulceration in the whole colon section, respectively, in the indicated groups. (F) illustrates a colon section taken from different treatment regimens. * denotes a significant difference from UT mice, with p < 0.05. # denotes a significant difference from DSS/i.p vehicle-treated mice, with p < 0.05. $ denotes a significant difference from monotherapy, with p < 0.05 (n = 3 per group). The scale bar represents 150 µm.
Figure 7.
Effect of methylprednisolone, budesonide, and azathioprine; either as monotherapy or in combination with AVE0991 (30 mg/kg dose) on colitis severity using the treatment approach. (A) shows percentage body weight changes in the different treatment approaches. Colon length (B) and thickness (C) were determined in the vehicle (hatched bars) or different treatment approaches (open bars for monotherapy and gray bars for combination regimens) compared to the UT group (solid bars). (D,E) represent the histological assessment of colitis severity and the percentage of ulceration in the whole colon section, respectively, in the indicated groups. (F) illustrates a colon section taken from different treatment regimens. * denotes a significant difference from UT mice, with p < 0.05. # denotes a significant difference from DSS/i.p vehicle-treated mice, with p < 0.05. $ denotes a significant difference from monotherapy, with p < 0.05 (n = 3 per group). The scale bar represents 150 µm.
Figure 8.
Immunofluorescent detection of FAK and JAM-A in colon sections. Colon sections taken from UT mice or mice treated with DSS plus AVE0991 (30 mg/kg) and azathioprine (1 mg/kg) combination or vehicle were immunostained with antisera against focal adhesion kinase (FAK, (A)) or junctional adhesion molecule-A (JAM-A, (C)). (B,D) represent the quantitative assessment of fluorescence intensity (arbitrary units). Histobars represent means ± SEM for 3 mice in each group. * denotes a significant difference from UT mice, with p < 0.05; # denotes a significant difference from DSS/i.p vehicle-treated mice, with p < 0.05. The scale bar represents 150 µm.
Figure 9.
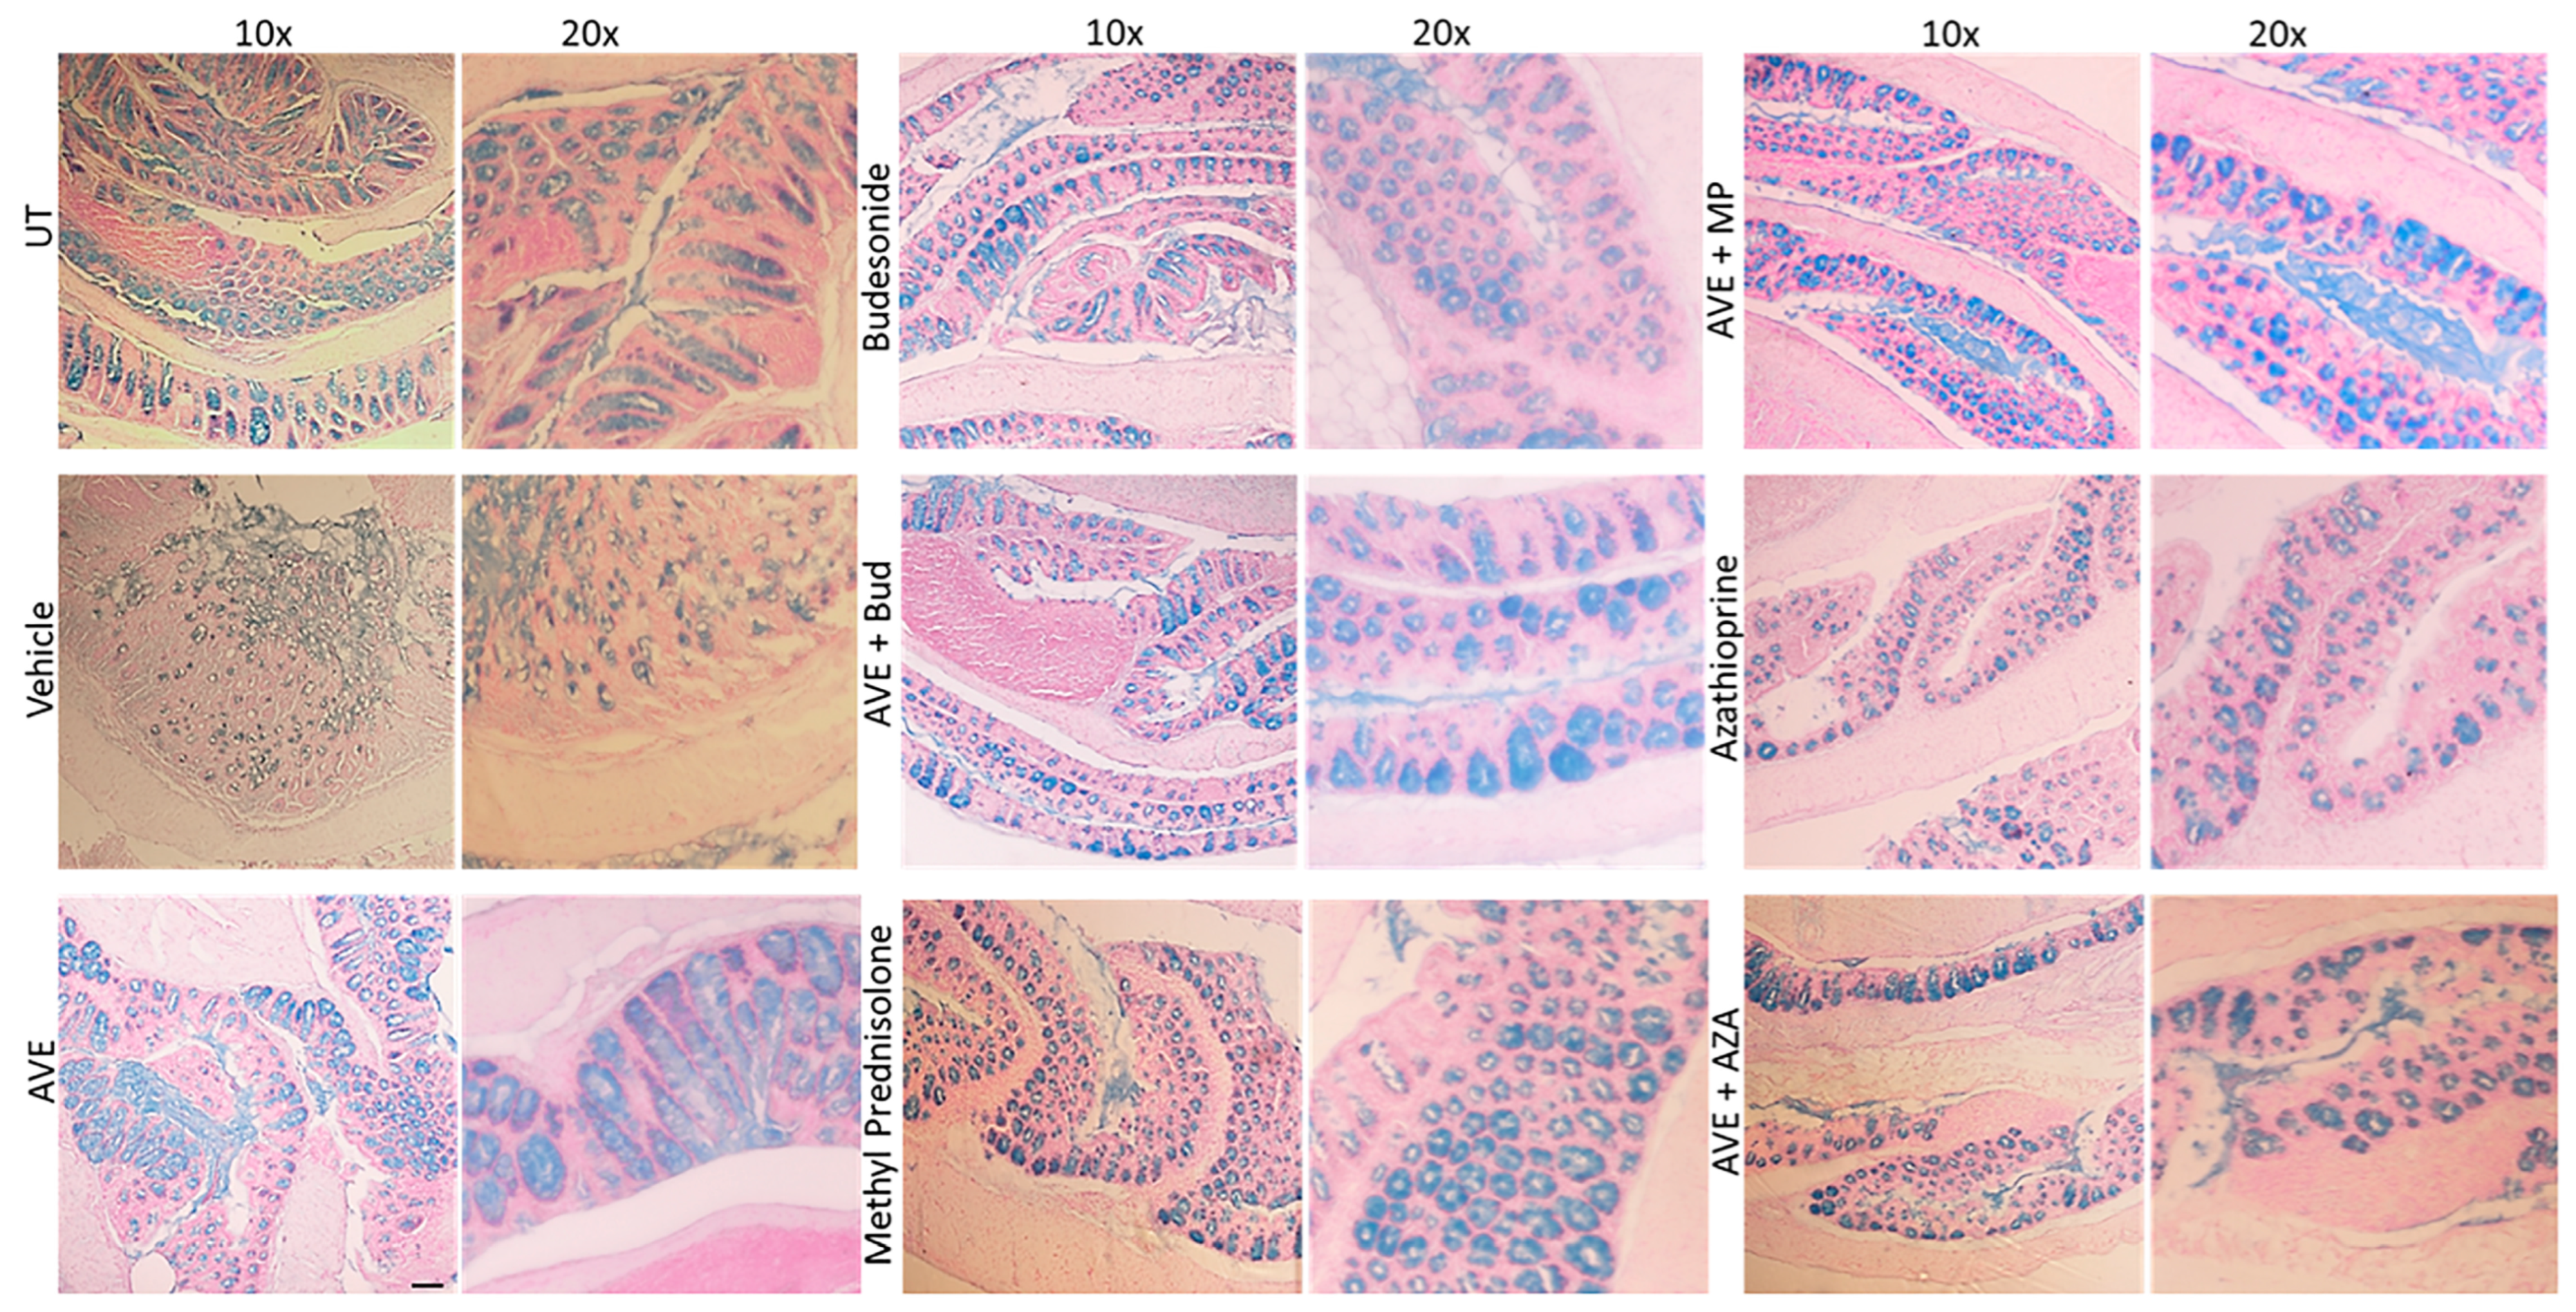
Effect of methylprednisolone, budesonide, and azathioprine; either as monotherapy or in combination with AVE0991 (30 mg/kg dose) on colonic mucus levels Colon sections taken from UT mice or mice treated with different treatment approaches, as monotherapy or combination regimens, were stained with alcian blue stain. The sections represent a sample from three separate experiments. The scale bar represents 150 µm.
Figure 9.
Effect of methylprednisolone, budesonide, and azathioprine; either as monotherapy or in combination with AVE0991 (30 mg/kg dose) on colonic mucus levels Colon sections taken from UT mice or mice treated with different treatment approaches, as monotherapy or combination regimens, were stained with alcian blue stain. The sections represent a sample from three separate experiments. The scale bar represents 150 µm.
Figure 10.
Western blot analysis of the phosphorylated levels of src, ERK1/2, p38 MAPK, and Akt in colon sections. Colon sections taken from UT mice or mice treated with DSS plus AVE0991 (30 mg/kg), azathioprine (1 mg/kg), a combination regimen, or vehicle were used for western blot analysis. The blots represent a sample from three separate experiments.
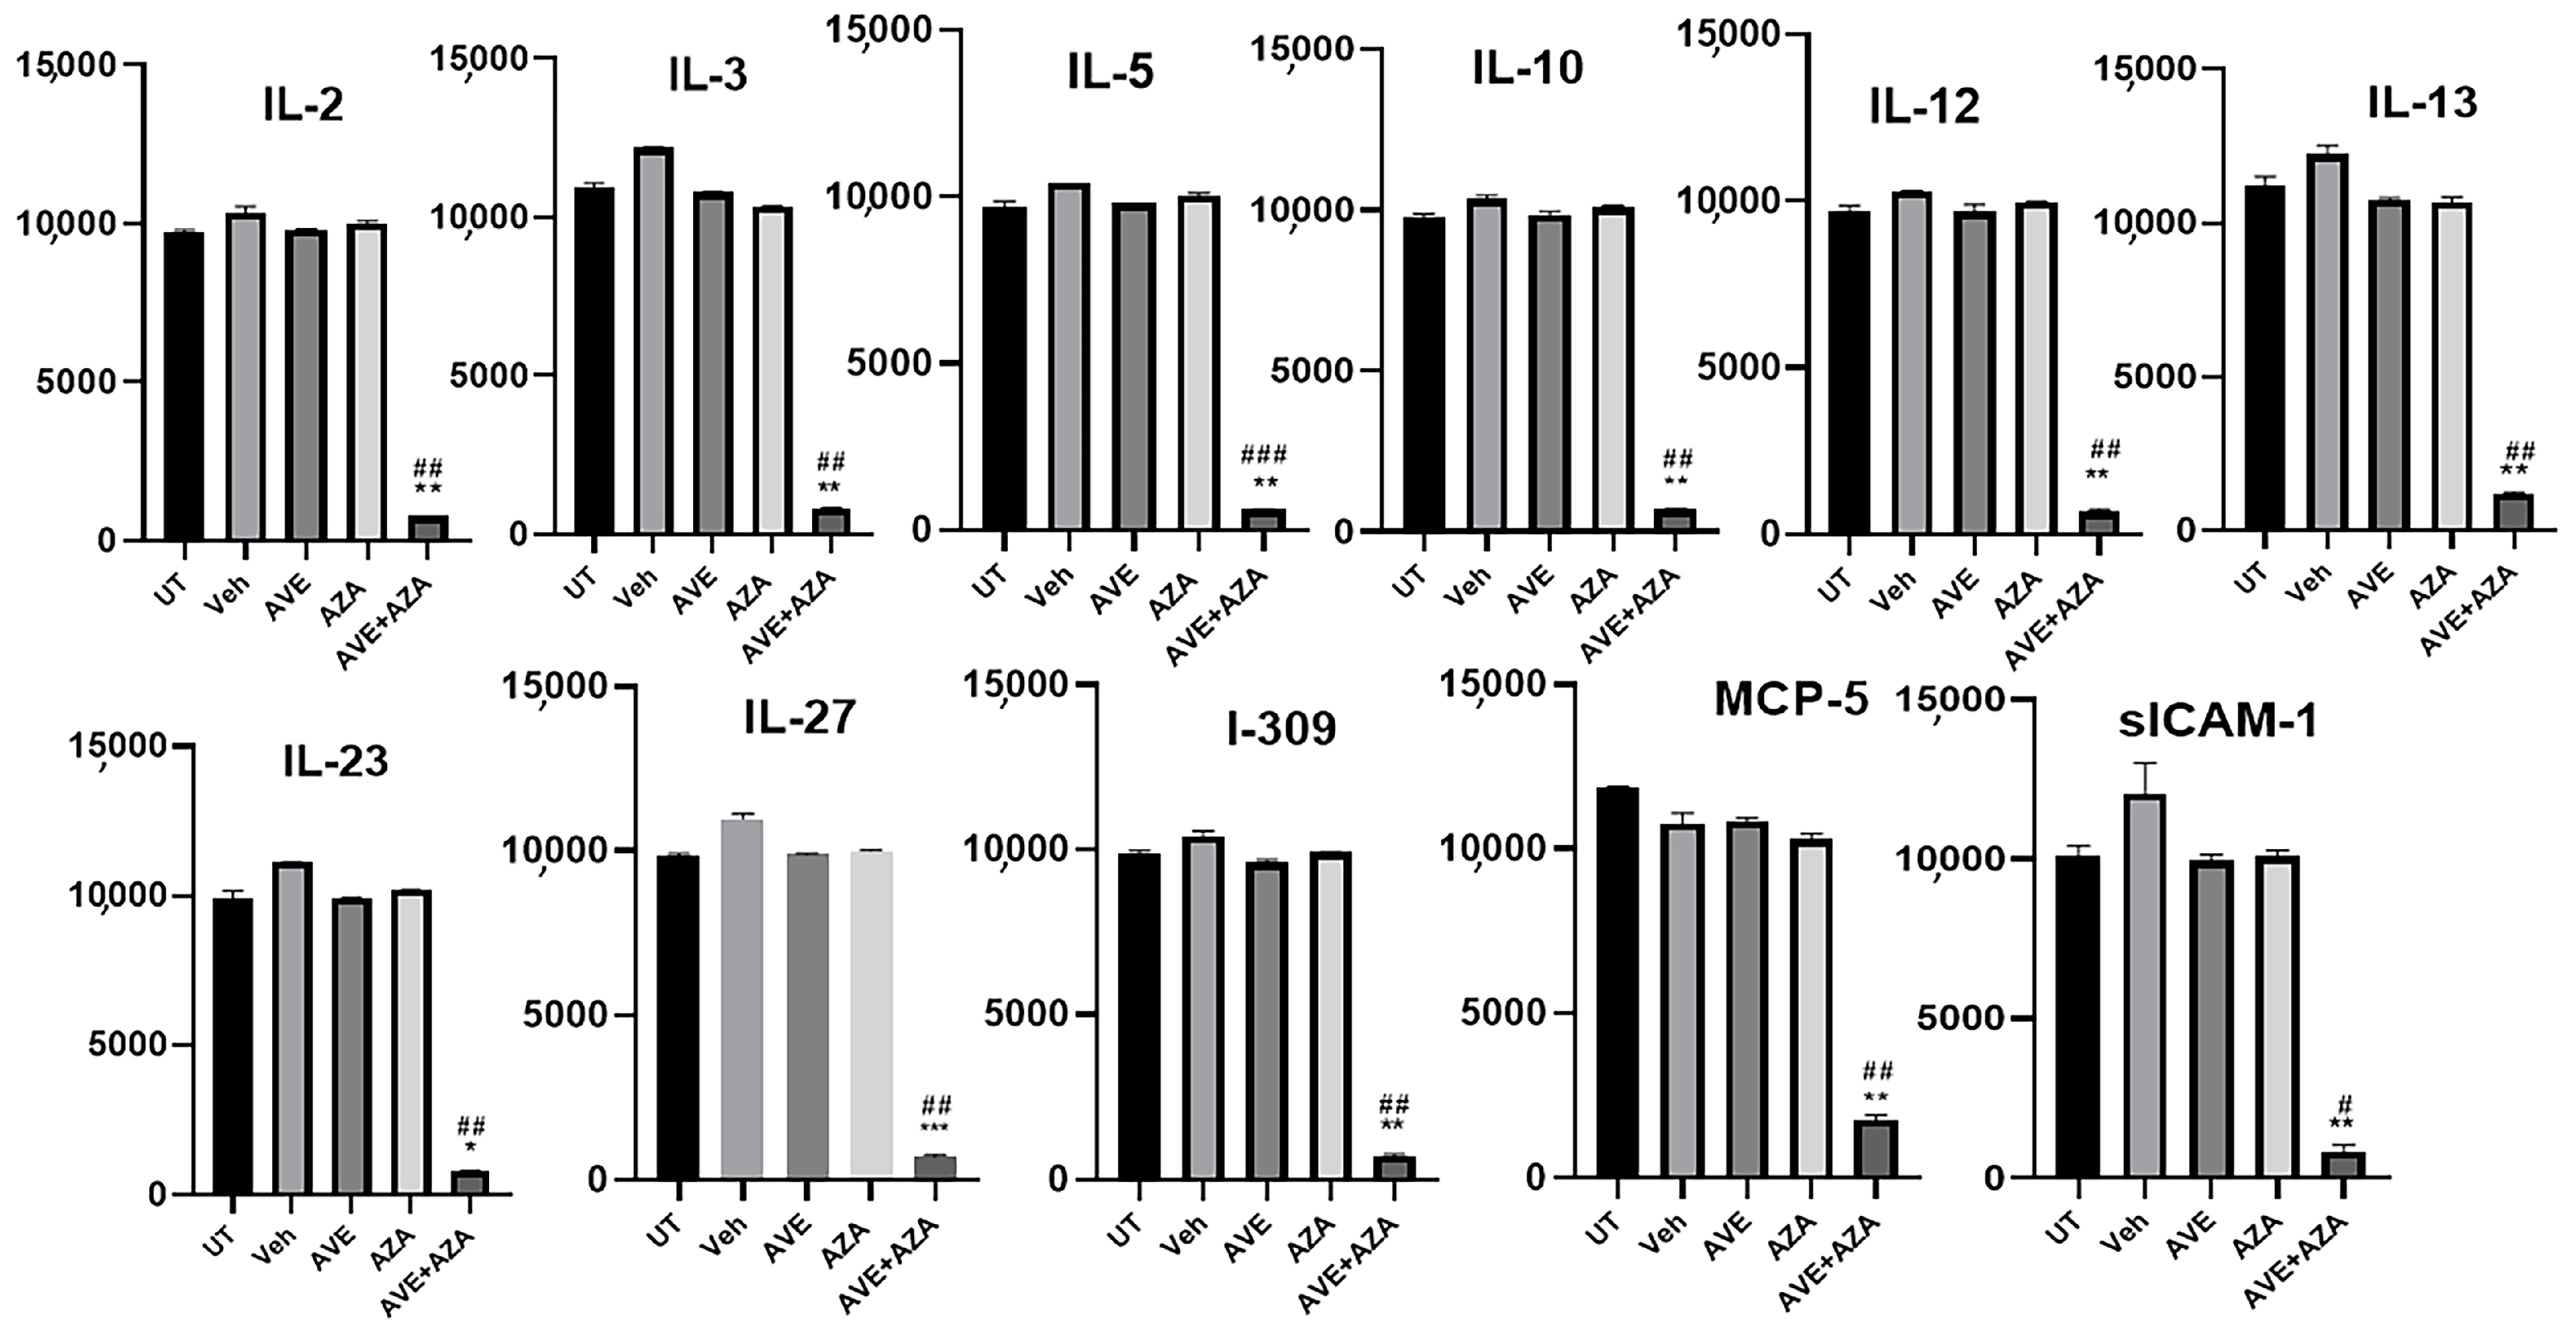
Figure 11.
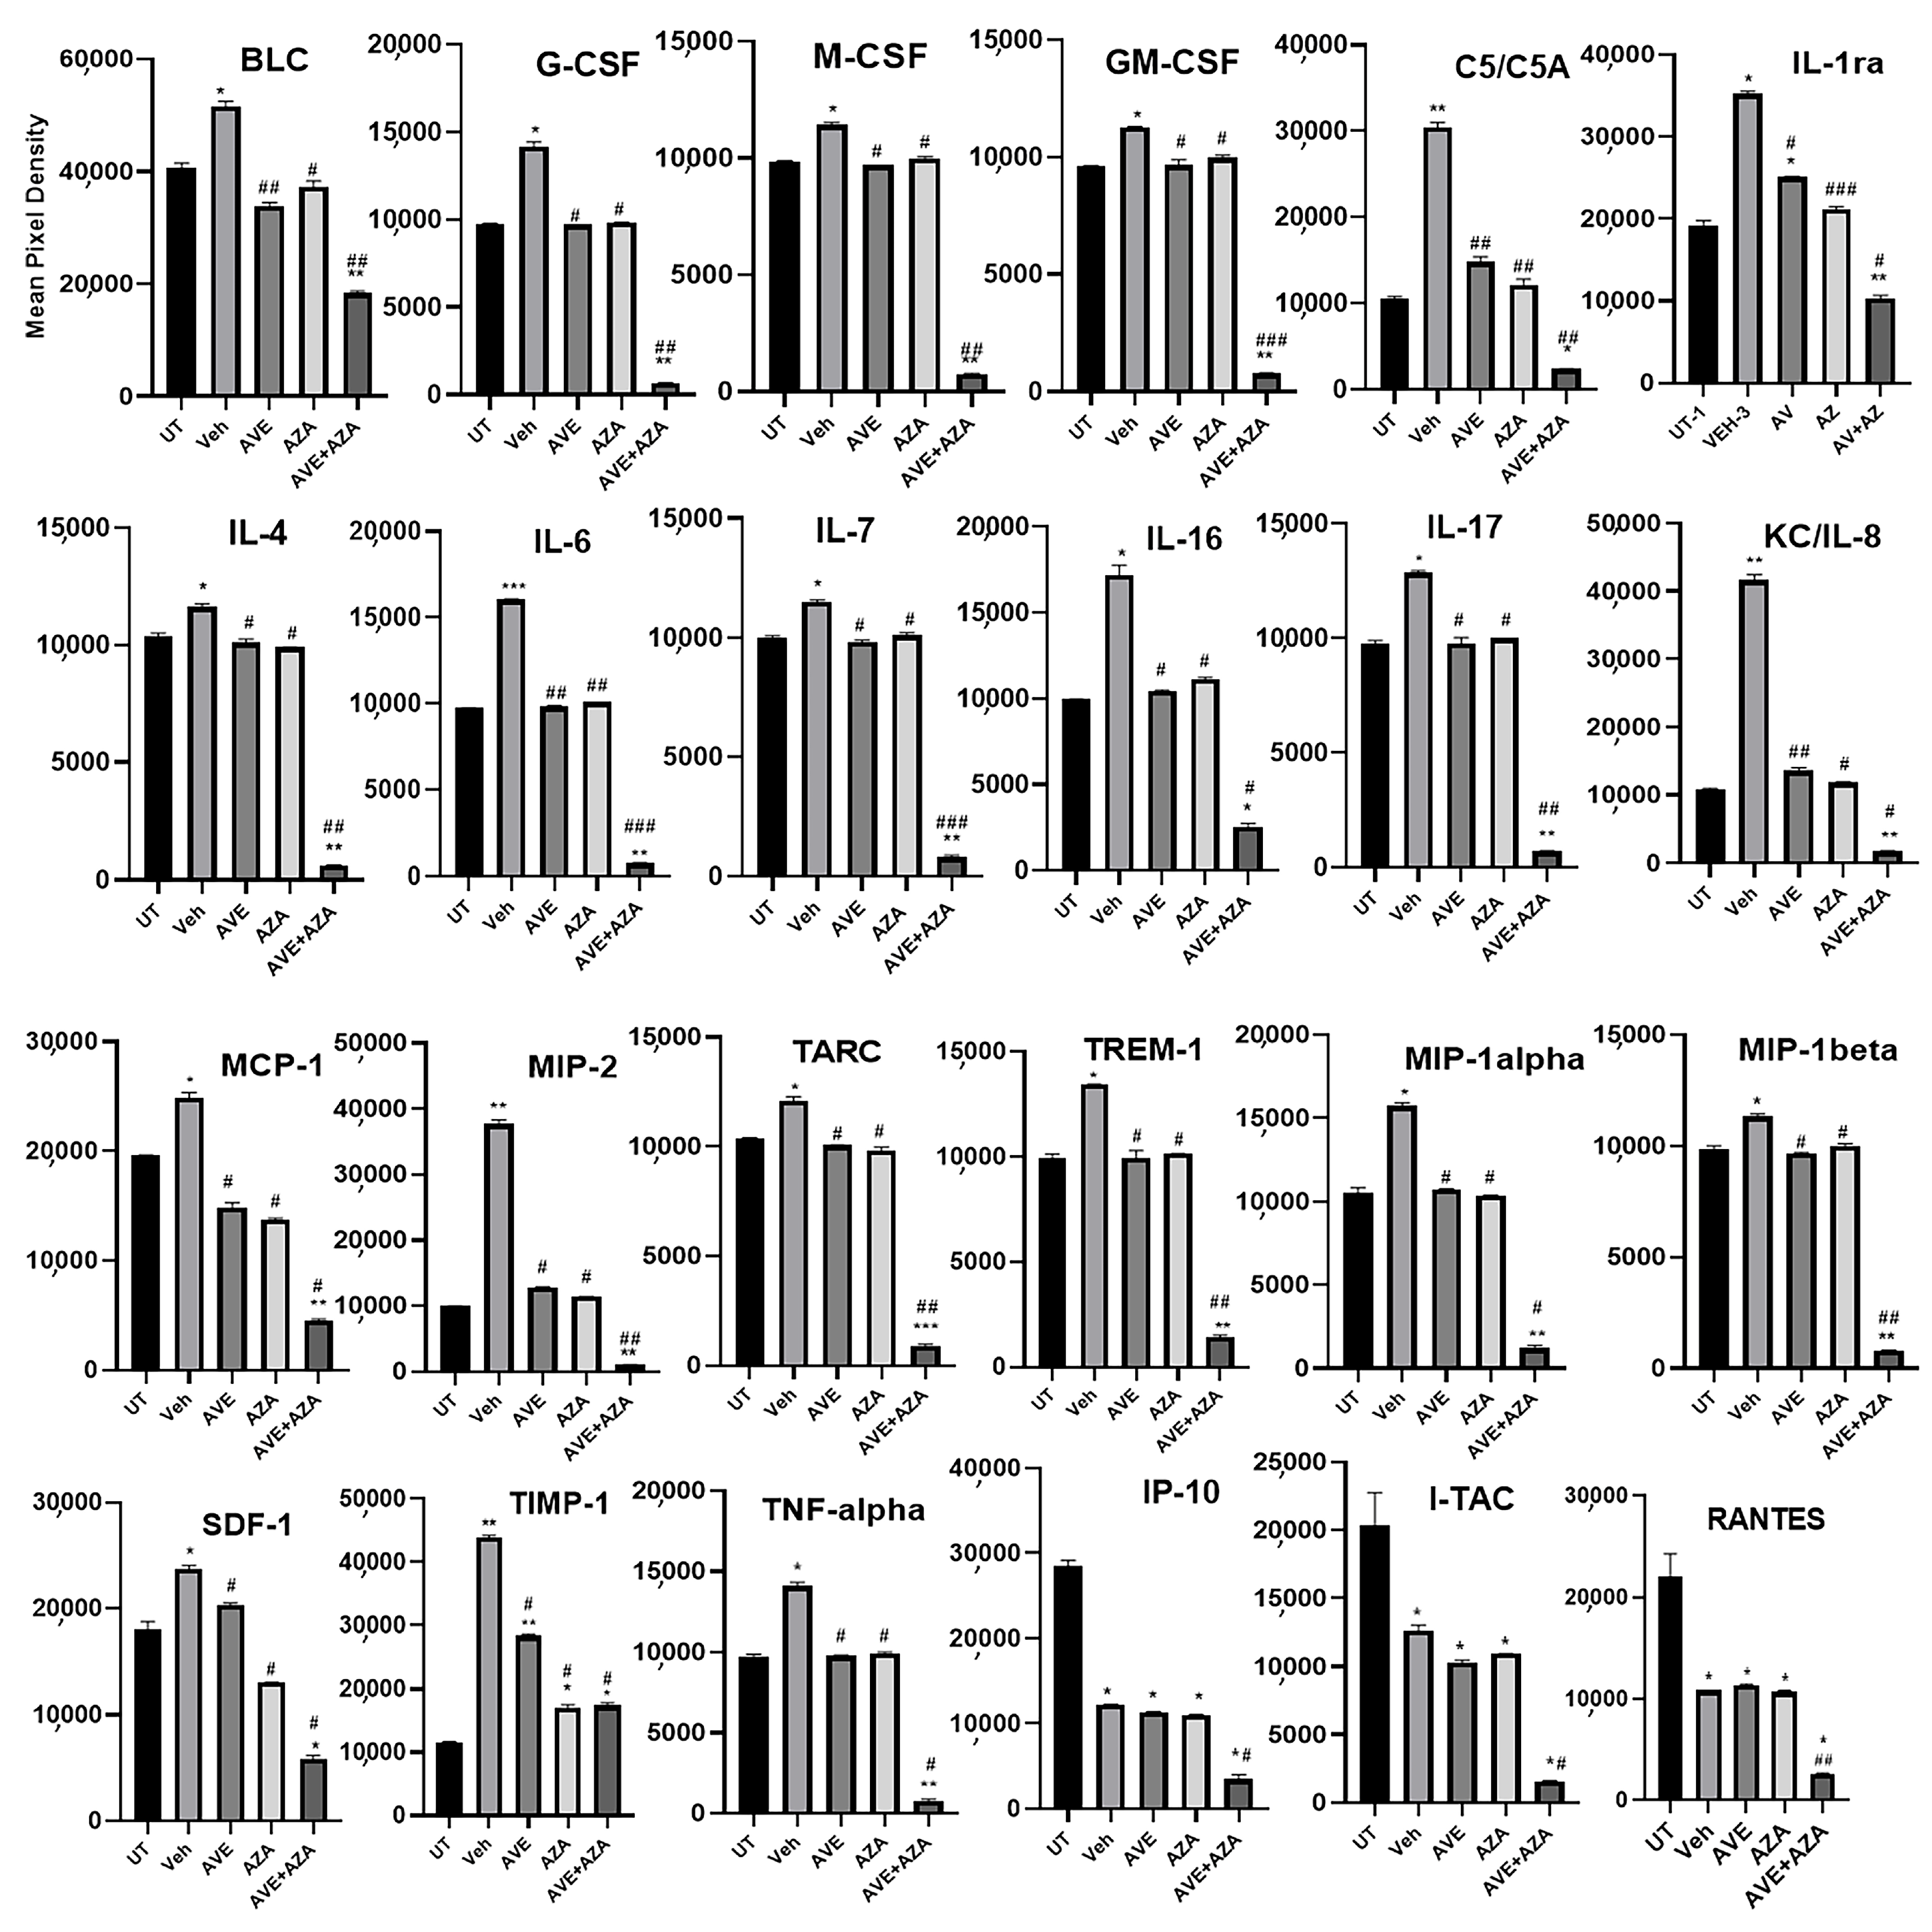
Proteomic profiling of various pro-inflammatory molecules in colon sections. Colon sections taken from UT mice or mice treated with DSS plus AVE0991 (30 mg/kg), azathioprine (1 mg/kg), a combination regimen, or vehicle were used for proteomic profiling analysis. The panels show densitometric analysis of protein profiling for the various tested targets. Asterisks denote significant differences from UT mice, with p < 0.05 (*), p < 0.001 (**), or p < 0.0001 (***). Asterkis denotes a significant difference from DSS/i.p vehicle-treated mice, with # p < 0.05, ## p < 0.001, or ### p < 0.0001 (n = 4 per group).
Figure 11.
Proteomic profiling of various pro-inflammatory molecules in colon sections. Colon sections taken from UT mice or mice treated with DSS plus AVE0991 (30 mg/kg), azathioprine (1 mg/kg), a combination regimen, or vehicle were used for proteomic profiling analysis. The panels show densitometric analysis of protein profiling for the various tested targets. Asterisks denote significant differences from UT mice, with p < 0.05 (*), p < 0.001 (**), or p < 0.0001 (***). Asterkis denotes a significant difference from DSS/i.p vehicle-treated mice, with # p < 0.05, ## p < 0.001, or ### p < 0.0001 (n = 4 per group).
Figure 12.
Model for AVE0991 anti-inflammatory properties. AVE0991 treatment reduced colitis severity in mice by modulating the expression/activity profile of various molecules involved in the inflammatory process.
Figure 12.
Model for AVE0991 anti-inflammatory properties. AVE0991 treatment reduced colitis severity in mice by modulating the expression/activity profile of various molecules involved in the inflammatory process.
Table 1.
Effect of administration of a single or double dose of AVE0991 on the macroscopic parameters of colitis severity using the prophylactic approach.
Table 1.
Effect of administration of a single or double dose of AVE0991 on the macroscopic parameters of colitis severity using the prophylactic approach.
| Group | Edema | Erythema | Diarrhea | Blood in Stool | Anorectal Bleeding | Adhesions |
|---|
| UT | 0 | 0 | 0 | 0 | 0 | 0 |
| Vehicle | 60 * | 0 | 66 * | 66 * | 0 | 66 * |
| 1 mg/kg Single dose | 0 # | 0 | 0 # | 0 # | 0 | 0 # |
| 1 mg/kg Double dose | 0 # | 0 | 0 # | 0 # | 0 | 0 # |
| 20 mg/kg Single dose | 0 # | 0 | 0 # | 0 # | 0 | 0 # |
| 20 mg/kg Double dose | 0 # | 0 | 0 # | 0 # | 0 | 0 # |
Table 2.
Effect of daily administration of AVE0991 on the macroscopic parameters of colitis severity using the prophylactic approach.
Table 2.
Effect of daily administration of AVE0991 on the macroscopic parameters of colitis severity using the prophylactic approach.
| Group | Edema | Erythema | Diarrhea | Blood in Stool | Anorectal Bleeding | Adhesions |
|---|
| UT | 0 | 0 | 0 | 0 | 0 | 0 |
| Vehicle | 100 * | 0 | 66 * | 66 * | 0 | 100 * |
| 1 mg/kg | 33 # | 0 | 0 # | 0 # | 0 | 0 # |
| 20 mg/kg | 0 # | 0 | 0 # | 0 # | 0 | 0 # |
| 40 mg/kg | 0 # | 0 | 0 # | 0 # | 0 | 0 # |
Table 3.
Effect of a single dose administration of AVE0991 on the macroscopic parameters of colitis severity using the treatment approach.
Table 3.
Effect of a single dose administration of AVE0991 on the macroscopic parameters of colitis severity using the treatment approach.
| Group | Edema | Erythema | Diarrhea | Blood in Stool | Anorectal Bleeding | Adhesions |
|---|
| UT | 0 | 0 | 0 | 0 | 0 | 0 |
| Vehicle | 0 | 0 | 66 * | 60 * | 100 * | 60 * |
| 20 mg/kg single dose | 0 | 0 | 66 * | 30 * | 100 * | 100 * |
| 40 mg/kg singe dose | 0 | 0 | 0 # | 0 # | 100 * | 100 * |
Table 4.
Effect of daily administration of AVE0991 on the macroscopic parameters of colitis severity using the treatment approach.
Table 4.
Effect of daily administration of AVE0991 on the macroscopic parameters of colitis severity using the treatment approach.
| Group | Edema | Erythema | Diarrhea | Blood in Stool | Anorectal Bleeding | Adhesions |
|---|
| UT | 0 | 0 | 0 | 0 | 0 | 0 |
| Vehicle | 100 * | 100 * | 100 * | 100 * | 100 * | 100 * |
| 0.5 mg/kg | 33 # | 33 # | 100 * | 100 * | 100 * | 100 * |
| 1 mg/kg | 33 # | 0 # | 100 * | 100 * | 100 * | 100 * |
| 10 mg/kg | 33 # | 0 # | 100 * | 100 * | 100 * | 33 # |
| 20 mg/kg | 33 # | 0 # | 100 * | 100 * | 100 * | 33 # |
| 30 mg/kg | 33 # | 0 # | 0 # | 0 # | 0 # | 0 # |
| 40 mg/kg | 0 # | 0 # | 0 # | 0 # | 0 # | 0 # |
Table 5.
Effect of daily administration of azathioprine on the macroscopic parameters of colitis severity using the treatment approach.
Table 5.
Effect of daily administration of azathioprine on the macroscopic parameters of colitis severity using the treatment approach.
| Group | Edema | Erythema | Diarrhea | Blood in Stool | Anorectal Bleeding | Adhesions |
|---|
| UT | 0 | 0 | 0 | 0 | 0 | 0 |
| Vehicle | 100 * | 100 * | 100 * | 100 * | 100 * | 100 * |
| 1 mg/kg | 100 * | 0 # | 25 # | 0 # | 50 *# | 100 * |
| 3 mg/kg | 100 * | 0 # | 25 # | 0 # | 25 # | 100 * |
| 5 mg/kg | 100 * | 0 # | 25 # | 0 # | 0 # | 25 # |
| 10 mg/kg | 100 * | 0 # | 0 # | 0 # | 0 # | 0 # |
Table 6.
Effect of daily administration of AVE0991 (low dose), methylprednisolone, budesonide, or the combination regimen on the macroscopic parameters of colitis severity using the treatment approach.
Table 6.
Effect of daily administration of AVE0991 (low dose), methylprednisolone, budesonide, or the combination regimen on the macroscopic parameters of colitis severity using the treatment approach.
| Group | Edema | Erythema | Diarrhea | Blood in Stool | Anorectal Bleeding | Adhesions |
|---|
| UT | 0 | 0 | 0 | 0 | 0 | 0 |
| Vehicle | 100 * | 100 * | 100 * | 100 * | 100 * | 100 * |
| AVE (1 mg/kg) | 100 * | 0 # | 33 # | 0 # | 33 # | 66 *# |
| MP (5 mg/kg) | 33 # | 0 # | 0 # | 0 # | 0 # | 66 *# |
| Bud (0.5 µg/kg) | 0 # | 0 # | 0 # | 33 # | 33 # | 33 # |
| AZA (1 mg/kg) | 100 | 0 # | 25 # | 0 # | 50 # | 100 |
| AVE + MP | 0 # | 0 # | 33 # | 0 # | 0 # | 0 # |
| AVE + Bud | 0 # | 0 # | 0 # | 33 # | 0 # | 0 # |
| AVE + AZA | 0 # | 0 # | 25 # | 0 # | 0 # | 0 # |
Table 7.
Effect of daily administration of AVE0991 (high dose), methylprednisolone, budesonide, or the combination regimen on the macroscopic parameters of colitis severity using the treatment approach.
Table 7.
Effect of daily administration of AVE0991 (high dose), methylprednisolone, budesonide, or the combination regimen on the macroscopic parameters of colitis severity using the treatment approach.
| Group | Edema | Erythema | Diarrhea | Blood in Stool | Anorectal Bleeding | Adhesions |
|---|
| UT | 0 | 0 | 0 | 0 | 0 | 0 |
| Vehicle | 100 * | 100 * | 100 * | 100 * | 100 * | 100 * |
| AVE (30 mg/kg) | 100 * | 0 # | 25 # | 0 # | 25 # | 100 * |
| AZA (1 mg/kg) | 100 * | 0 # | 25 # | 0 # | 50*# | 100 * |
| MP (5 mg/kg) | 33 # | 0 # | 0 # | 0 # | 0 # | 66 *# |
| Bud (0.5 µg/kg) | 0 # | 0 # | 0 # | 33 # | 33 # | 33 # |
| AVE + AZA | 0 # | 0 # | 0 # | 0 # | 0 # | 0 # |
| AVE + MP | 0 # | 0 # | 0 # | 0 # | 0 # | 0 # |
| AVE + Bud | 0 # | 0 # | 0 # | 0 # | 0 # | 0 # |


