

Metabolic and Inflammatory Biomarkers Predicting Sarcopenic Obesity and Cardiometabolic Risk in Arab Women: A Cross-Sectional Study

 ,
,  ,
,  ,
,
Abstract
1. Introduction
2. Results
2.1. Group Characteristics and Trends
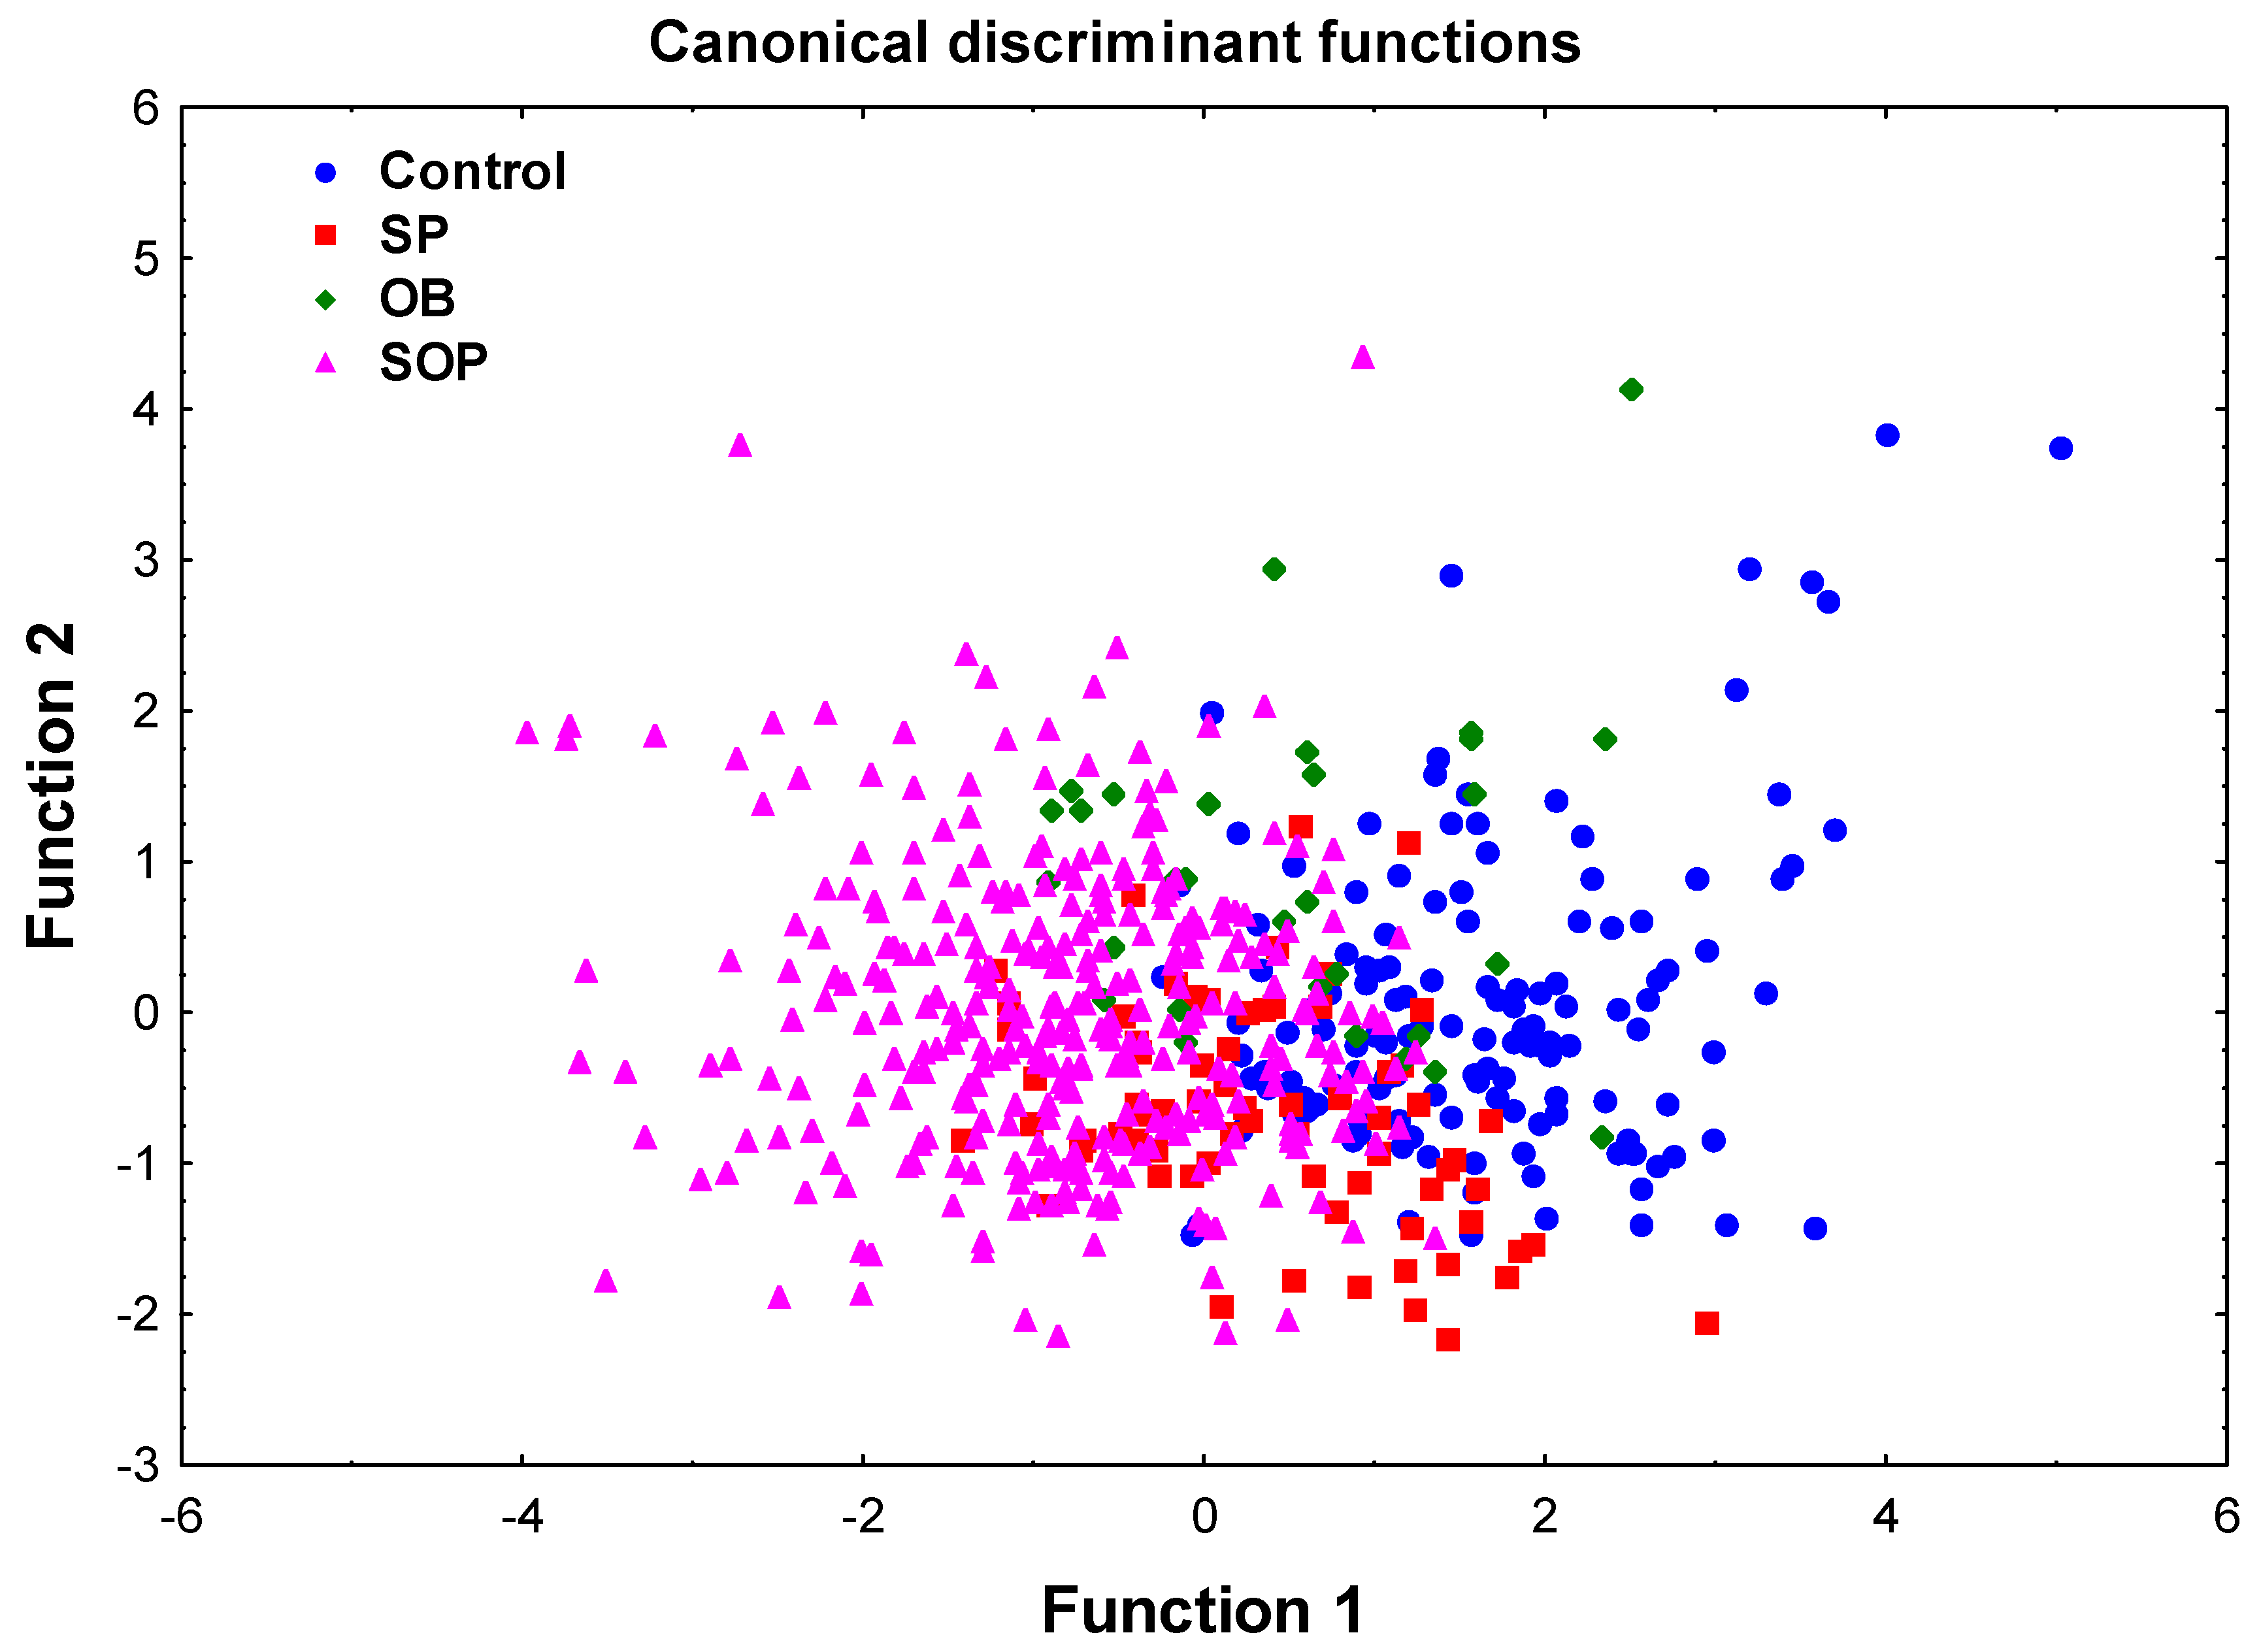
2.2. Discriminant Function Analysis (DFA)
2.3. Comparison Between the Control and SOP Groups
2.4. Multivariable Logistic Regression Analysis for SOP Risk
2.5. Comorbidity Associations
3. Discussion
4. Materials and Methods
4.1. Study Sample and Ethics
4.2. Demographic, Anthropometric, and Body Composition Assessment
4.3. Measurement of Plasma Levels of Inflammatory Biomarkers
4.4. Blood Glucose Levels, Lipid Profile, and Blood Count
4.5. Inflammatory Indices
4.6. Assessment of SOP-Related Comorbidities
4.7. Study Design and Statistical Analysis
- A comparison was conducted of all the potential covariates between the four study groups, implementing the ANCOVA method for testing the general trend and to compare SOP and control groups. The frequency of the comorbidities in the study groups was compared by the χ2 test. The association of the variable with SOP was considered significant after a multiple-comparison correction using the Bonferroni test.
- Discrimination analysis. The covariates that survived multiple testing correction using Bonferroni method were next used to simultaneously evaluate the ability of selected variables to differentiate among groups. A discriminant function analysis (DFA) was performed using a stepwise linear discrimination procedure. The extent of the variable discrimination between the groups was evaluated by Wilks’ Lambda (0 value = perfect discrimination) and associated chi-square statistics. A scatterplot of canonical scores was used to visualize the separation between groups.
- To further clarify the results, in the second stage of the study, we compared the SOP group with the control group, initially using multivariate logistic regression analysis. The independent variables were the same variables as those used in the discriminant analysis.
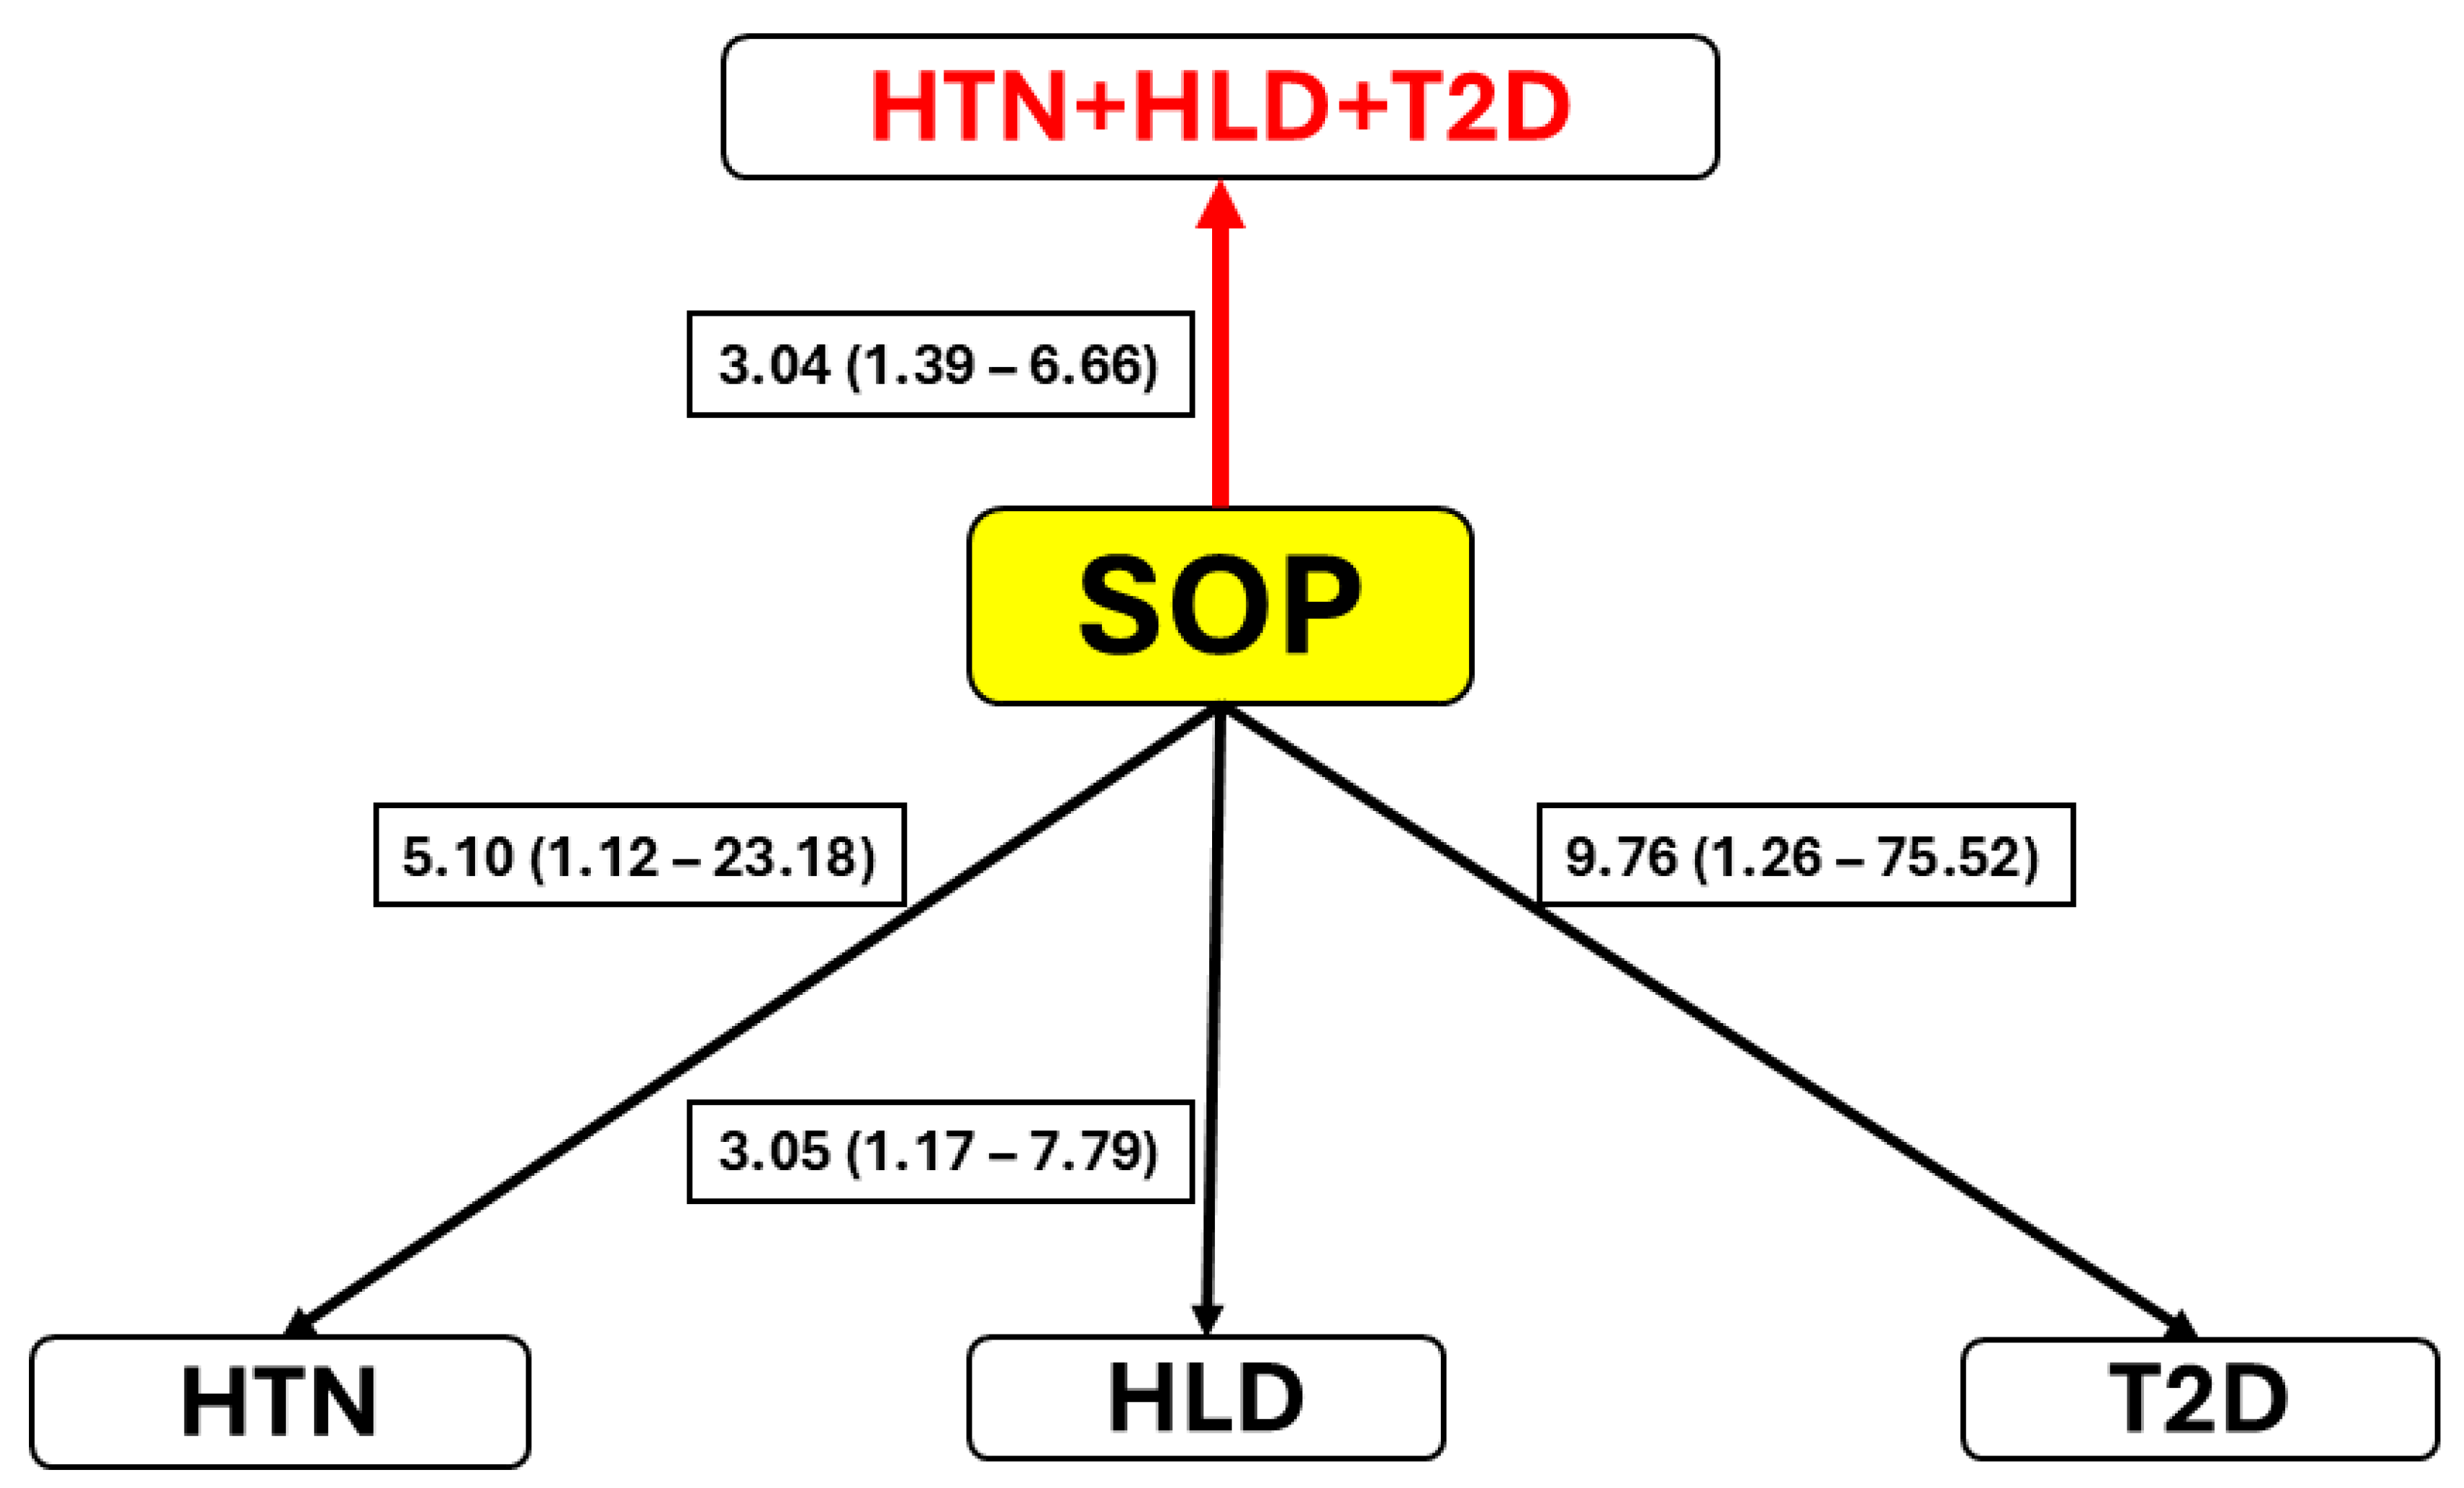
- Next, we examined the association between the SOP status and the three comorbidities, HTN, HLD, and T2D. This analysis was, in turn, conducted in a few steps. First, the association of SOP, with simultaneous adjustment for age, and each of the comorbidities (independently of others) was tested implementing binary multiple logistic regression analysis. The major deficiency of this method is that it does not take into account the non-independence of the comorbidities. However, the study comorbidities were not independent of one another. The strength and direction of their pairwise relationships were examined by chi-square tests and the corresponding Phi coefficients.
- Once non-independence was confirmed, we proceeded to a final step of the analysis: a multivariate logistic regression analysis of all three comorbidities, taking into account the extent of the associations between them, on SOP (and age). This analysis was conducted using a generalized estimating equation (GEE) approach to evaluate the association between the presence of SOP (1 = present, 0 = absent), standardized age (AGEz), and diagnosis group (any of the comorbidities, or their combination). The comparisons were made across HTN, HLD, and T2D, each of which was assessed as 1 (present) or 0 (absent). The data were restructured into a long format creating a new outcome binary variable representing presence (=1) of any of the three comorbidities (or their combination) vs. absence (=0) of all of them. An exchangeable working correlation structure was used in the GEE model to account for repeated measures within individuals. The results were expressed as ORs with 95% CIs, estimating the extent of the association of each of the predictors (SOP and age) with the comorbidity status.
Supplementary Materials
Author Contributions
Funding
Institutional Review Board Statement
Informed Consent Statement
Data Availability Statement
Acknowledgments
Conflicts of Interest
Abbreviations
| Acronym/ Abbreviation | The Full Term | Comment |
| BIA | Bioelectrical impedance analysis | Device |
| BMI | Body mass index | Body composition |
| DFA | Discriminant function analysis | Statistical analysis method |
| ECW | Extracellular water | Body composition |
| FGF-21 | Fibroblast growth factor-21 | Anti-inflammatory, Growth factor |
| FM/WT | Fat mass/weight ratio | Body composition |
| FSTL1 | Follistatin-like 1 | Pro-inflammatory, Glycoprotein |
| GDF-15 | Growth and differentiation factor-15 | Regulatory inflammatory factor |
| GEE | Generalized estimating equation | Statistical analysis method |
| HDL-C | High-density lipoprotein cholesterol | Profile lipid |
| HLD | Hyperlipidemia | Comorbidity |
| HTN | Hypertension | Comorbidity |
| MCP1 | Monocyte chemoattractant protein 1 | Pro-inflammatory, Chemokine |
| MHR | Monocyte-to-HDL-C ratio | Inflammation index |
| OB | Obesity | Body composition |
| SII | Systemic immune-inflammation index | Inflammation index |
| SIRI | Systemic inflammation response index | Inflammation index |
| SMM/WT | Skeletal muscle mass/weight ratio | Body composition |
| SOP | Sarcopenic obesity-related phenotypes | Body composition |
| SP | Sarcopenia | Body composition |
| T2D | Type 2 diabetes | Comorbidity |
| TC | Total cholesterol | Lipid |
| TC/HDL-C | Total-cholesterol-to-HDL-C ratio | Profile lipid |
| TG | Triglycerides | Profile lipid |
| TG/HDL | Triglycerides-to-HDL-C ratio | Profile lipid |
| WC | Waist circumference | Body composition |
References
- Donini, L.M.; Busetto, L.; Bischoff, S.C.; Cederholm, T.; Ballesteros-Pomar, M.D.; Batsis, J.A.; Bauer, J.M.; Boirie, Y.; Cruz-Jentoft, A.J.; Dicker, D.; et al. Definition and Diagnostic Criteria for Sarcopenic Obesity: ESPEN and EASO Consensus Statement. Clin. Nutr. 2022, 41, 990–1000. [Google Scholar] [CrossRef]
- Wannamethee, S.G.; Atkins, J.L. Muscle Loss and Obesity: The Health Implications of Sarcopenia and Sarcopenic Obesity. Proc. Nutr. Soc. 2015, 74, 405–412. [Google Scholar] [CrossRef] [PubMed]
- Koliaki, C.; Liatis, S.; Dalamaga, M.; Kokkinos, A. Sarcopenic Obesity: Epidemiologic Evidence, Pathophysiology, and Therapeutic Perspectives. Curr. Obes. Rep. 2019, 8, 458–471.e2. [Google Scholar] [CrossRef] [PubMed]
- Chen, L.K.; Woo, J.; Assantachai, P.; Auyeung, T.W.; Chou, M.Y.; Iijima, K.; Jang, H.C.; Kang, L.; Kim, M.; Kim, S.; et al. Asian Working Group for Sarcopenia: 2019 Consensus Update on Sarcopenia Diagnosis and Treatment. J. Am. Med. Dir. Assoc. 2020, 21, 300–307. [Google Scholar] [CrossRef]
- Batsis, J.A.; Barre, L.K.; Mackenzie, T.A.; Pratt, S.I.; Lopez-Jimenez, F.; Bartels, S.J. Variation in the Prevalence of Sarcopenia and Sarcopenic Obesity in Older Adults Associated with Different Research Definitions: Dual-Energy X-Ray Absorptiometry Data from the National Health and Nutrition Examination Survey 1999–2004. J. Am. Geriatr. Soc. 2013, 61, 974–980. [Google Scholar] [CrossRef] [PubMed]
- Zembura, M.; Matusik, P. Sarcopenic Obesity in Children and Adolescents: A Systematic Review. Front. Endocrinol. 2022, 13, 914740. [Google Scholar] [CrossRef]
- Gao, Q.; Mei, F.; Shang, Y.; Hu, K.; Chen, F.; Zhao, L.; Ma, B. Global Prevalence of Sarcopenic Obesity in Older Adults: A Systematic Review and Meta-Analysis. Clin. Nutr. 2021, 40, 4633–4641. [Google Scholar] [CrossRef]
- Wei, S.; Nguyen, T.T.; Zhang, Y.; Ryu, D.; Gariani, K. Sarcopenic Obesity: Epidemiology, Pathophysiology, Cardiovascular Disease, Mortality, and Management. Front. Endocrinol. 2023, 14, 1185221. [Google Scholar] [CrossRef]
- Almahmeed, W.; Alabadla, Z.; Al Awadi, F.; Alrohmaihi, D.; AlShamiri, M.; Elbadawi, H.; El-Tamimi, H.; Elzouki, A.N.; Farghaly, M.; Hafidh, K.; et al. Improving Therapeutic Adherence and Reducing Therapeutic Inertia in the Management of People with Cardiometabolic Diseases: A Call-to-Action from the Middle East. Adv. Ther. 2025, 42, 1340–1359. [Google Scholar] [CrossRef]
- Mokdad, A.H.; El Bcheraoui, C.; Afshin, A.; Charara, R.; Khalil, I.; Moradi-Lakeh, M.; Kassebaum, N.J.; Collison, M.; Daoud, F.; Krohn, K.J.; et al. Burden of Obesity in the Eastern Mediterranean Region: Findings from the Global Burden of Disease 2015 Study. Int. J. Public. Health 2018, 63, 165–176. [Google Scholar] [CrossRef]
- Kornowski, R.; Orvin, K. Current Status of Cardiovascular Medicine in Israel. Circulation 2020, 142, 17–19. [Google Scholar] [CrossRef]
- Nitzan Kaluski, D.; Berry, E.M. National Prevalence of Obesity: Prevalence of Obesity in Israel. Obes. Rev. 2005, 6, 115–116. [Google Scholar] [CrossRef]
- Kalinkovich, A.; Livshits, G. Sarcopenic Obesity or Obese Sarcopenia: A Cross Talk Between Age-Associated Adipose Tissue and Skeletal Muscle Inflammation as a Main Mechanism of the Pathogenesis. Ageing Res. Rev. 2017, 35, 200–221. [Google Scholar] [CrossRef] [PubMed]
- Unamuno, X.; Gómez-Ambrosi, J.; Rodríguez, A.; Becerril, S.; Frühbeck, G.; Catalán, V. Adipokine Dysregulation and Adipose Tissue Inflammation in Human Obesity. Eur. J. Clin. Investig. 2018, 48, e12997. [Google Scholar] [CrossRef] [PubMed]
- Deepika, F.; Bathina, S.; Armamento-Villareal, R. Novel Adipokines and Their Role in Bone Metabolism: A Narrative Review. Biomedicines 2023, 11, 644. [Google Scholar] [CrossRef]
- Ferland, D.J.; Watts, S.W. Chemerin: A Comprehensive Review Elucidating the Need for Cardiovascular Research. Pharmacol. Res. 2015, 99, 351–361. [Google Scholar] [CrossRef] [PubMed]
- Helfer, G.; Wu, Q.F. Chemerin: A Multifaceted Adipokine Involved in Metabolic Disorders. J. Endocrinol. 2018, 238, R79–R94. [Google Scholar] [CrossRef]
- Laffranchi, M.; Schioppa, T.; Sozio, F.; Piserà, A.; Tiberio, L.; Salvi, V.; Bosisio, D.; Musso, T.; Sozzani, S.; Del Prete, A. Chemerin in Immunity. J. Leukoc. Biol. 2025, 117, qiae181. [Google Scholar] [CrossRef]
- Mattiotti, A.; Prakash, S.; Barnett, P.; van den Hoff, M.J.B. Follistatin-like 1 in Development and Human Diseases. Cell Mol. Life Sci. 2018, 75, 2339–2354. [Google Scholar] [CrossRef]
- Lim, J.P.; Leung, B.P.; Ding, Y.Y.; Tay, L.; Ismail, N.H.; Yeo, A.; Yew, S.; Chong, M.S. Monocyte Chemoattractant Protein-1: A Proinflammatory Cytokine Elevated in Sarcopenic Obesity. Clin. Interv. Aging 2015, 10, 605–609. [Google Scholar] [CrossRef]
- Ren, Y.; Zhao, H.; Yin, C.; Lan, X.; Wu, L.; Du, X.; Griffiths, H.R.; Gao, D. Adipokines, Hepatokines and Myokines: Focus on Their Role and Molecular Mechanisms in Adipose Tissue Inflammation. Front. Endocrinol. 2022, 13, 873699. [Google Scholar] [CrossRef] [PubMed]
- Wang, N.; Zhao, T.; Li, S.; Sun, X.; Li, Z.; Li, Y.; Li, D.; Wang, W. Fibroblast Growth Factor 21 Exerts Its Anti-Inflammatory Effects on Multiple Cell Types of Adipose Tissue in Obesity. Obesity 2019, 27, 399–408. [Google Scholar] [CrossRef]
- Wischhusen, J.; Melero, I.; Fridman, W.H. Growth/Differentiation Factor-15 (GDF-15): From Biomarker to Novel Targetable Immune Checkpoint. Front. Immunol. 2020, 11, 951. [Google Scholar] [CrossRef]
- Jones, K.L.; Mansell, A.; Patella, S.; Scott, B.J.; Hedger, M.P.; De Kretser, D.M.; Phillips, D.J. Activin A Is a Critical Component of the Inflammatory Response, and Its Binding Protein, Follistatin, Reduces Mortality in Endotoxemia. Proc. Natl. Acad. Sci. USA 2007, 104, 16239–16244. [Google Scholar] [CrossRef] [PubMed]
- Severinsen, M.C.K.; Pedersen, B.K. Muscle-Organ Crosstalk: The Emerging Roles of Myokines. Endocr. Rev. 2020, 41, 594–609. [Google Scholar] [CrossRef] [PubMed]
- Zhao, X.; An, X.; Yang, C.; Sun, W.; Ji, H.; Lian, F. The Crucial Role and Mechanism of Insulin Resistance in Metabolic Disease. Front. Endocrinol. 2023, 14, 1149239. [Google Scholar] [CrossRef] [PubMed]
- Paris, M.T.; Bell, K.E.; Mourtzakis, M. Myokines and Adipokines in Sarcopenia: Understanding Cross-Talk Between Skeletal Muscle and Adipose Tissue and the Role of Exercise. Curr. Opin. Pharmacol. 2020, 52, 61–66. [Google Scholar] [CrossRef]
- Wan, X.; Ji, Y.; Wang, R.; Yang, H.; Cao, X.; Lu, S. Association Between Systemic Immune-Inflammation Index and Sarcopenic Obesity in Middle-Aged and Elderly Chinese Adults: A Cross-Sectional Study and Mediation Analysis. Lipids Health Dis. 2024, 23, 230. [Google Scholar] [CrossRef]
- Karanth, S.D.; Washington, C.; Cheng, T.Y.D.; Zhou, D.; Leeuwenburgh, C.; Braithwaite, D.; Zhang, D. Inflammation in Relation to Sarcopenia and Sarcopenic Obesity among Older Adults Living with Chronic Comorbidities: Results from the National Health and Nutrition Examination Survey 1999–2006. Nutrients 2021, 13, 3957. [Google Scholar] [CrossRef]
- Zubiaga, L.; Ruiz-Tovar, J. Correlation of Preoperative Neutrophil-to-Lymphocyte Ratio and Platelet-to-Lymphocyte Ratio with Metabolic Parameters in Patients Undergoing Sleeve Gastrectomy. Surg. Obes. Relat. Dis. 2020, 16, 999–1004. [Google Scholar] [CrossRef]
- Liaw, F.Y.; Huang, C.F.; Chen, W.L.; Wu, L.W.; Peng, T.C.; Chang, Y.W.; Kao, T.W. Higher Platelet-to-Lymphocyte Ratio Increased the Risk of Sarcopenia in the Community-Dwelling Older Adults. Sci. Rep. 2017, 7, 16609. [Google Scholar] [CrossRef] [PubMed]
- Liao, C.; Li, G.; Bai, Y.; Zhou, S.; Huang, L.; Yan, M.; Qiu, F.; Chen, J.; Wang, Y.; Tian, Y.; et al. Prognostic Value and Association of Sarcopenic Obesity and Systemic Inflammatory Indexes in Patients with Hepatocellular Carcinoma Following Hepatectomy and the Establishment of Novel Predictive Nomograms. J. Gastrointest. Oncol. 2021, 12, 669–693. [Google Scholar] [CrossRef] [PubMed]
- Kim, B.; Kim, G.; Lee, Y.; Taniguchi, K.; Isobe, T.; Oh, S. Triglyceride-Glucose Index as a Potential Indicator of Sarcopenic Obesity in Older People. Nutrients 2023, 15, 555. [Google Scholar] [CrossRef] [PubMed]
- Liu, X.; Hao, Q.; Yue, J.; Hou, L.; Xia, X.; Zhao, W.; Zhang, Y.; Ge, M.; Ge, N.; Dong, B. Sarcopenia, Obesity and Sarcopenia Obesity in Comparison: Prevalence, Metabolic Profile, and Key Differences: Results from WCHAT Study. J. Nutr. Health Aging 2020, 24, 429–437. [Google Scholar] [CrossRef] [PubMed]
- Zou, Y.; Ye, H.; Xu, Z.; Yang, Q.; Zhu, J.; Li, T.; Cheng, Y.; Zhu, Y.; Zhang, J.; Bo, Y.; et al. Obesity, Sarcopenia, Sarcopenic Obesity, and Hypertension: Mediating Role of Inflammation and Insulin Resistance. J. Gerontol. A Biol. Sci. Med. Sci. 2025, 80, glae284. [Google Scholar] [CrossRef]
- Guan, L.; Li, T.; Wang, X.; Yu, K.; Xiao, R.; Xi, Y. Predictive Roles of Basal Metabolic Rate and Body Water Distribution in Sarcopenia and Sarcopenic Obesity: The Link to Carbohydrates. Nutrients 2022, 14, 3911. [Google Scholar] [CrossRef]
- Tian, M.; Yuan, J.; Yu, F.; He, P.; Zhang, Q.; Zha, Y. Decreased Intracellular Water Is Associated with Sarcopenic Obesity in Chronic Haemodialysis Patients. BMC Geriatr. 2023, 23, 630. [Google Scholar] [CrossRef]
- Giri, S.; Anirvan, P.; Angadi, S.; Singh, A.; Lavekar, A. Prevalence and Outcome of Sarcopenia in Non-Alcoholic Fatty Liver Disease. World J. Gastrointest. Pathophysiol. 2024, 15, 91100. [Google Scholar] [CrossRef]
- Simões Corrêa Galendi, J.; Leite, R.G.O.F.; Banzato, L.R.; Nunes-Nogueira, V.D.S. Effectiveness of Strategies for Nutritional Therapy for Patients with Type 2 Diabetes and/or Hypertension in Primary Care: A Systematic Review and Meta-Analysis. Int. J. Env. Environ. Res. Public. Health 2022, 19, 4243. [Google Scholar] [CrossRef]
- Xu, S.; Tu, S.; Hao, X.; Chen, X.; Pan, D.; Liao, W.; Wu, R.; Yang, L.; Xia, H.; Wang, S.; et al. Exercise, Nutrition, and Neuromuscular Electrical Stimulation for Sarcopenic Obesity: A Systematic Review and Meta-Analysis of Management in Middle-Aged and Older Adults. Nutrients 2025, 17, 1504. [Google Scholar] [CrossRef]
- Rondanelli, M.; Gasparri, C.; Moroni, A.; Genovese, E.; Valentini, E.M.; Leone, G.; Perna, S.; Mazzola, G. The Effects of a Multidisciplinary Residential Program on the Risk Factors of Sarcopenic Obesity: An Open-Label Trial Study in a Cohort of Institutionalized Italian Adults with Obesity. Nutrients 2025, 17, 1511. [Google Scholar] [CrossRef] [PubMed]
- Gong, Y.; Yang, Y.; Zhang, X.; Tong, L. Comparative Efficacy of Exercise, Nutrition, and Combined Exercise and Nutritional Interventions in Older Adults with Sarcopenic Obesity: A Protocol for Systematic Review and Network Meta-Analysis. Syst. Rev. 2025, 14, 77. [Google Scholar] [CrossRef] [PubMed]
- González Arnáiz, E.; Ariadel Cobo, D.; Estébanez, B.; Barajas Galindo, D.; Pintor de la Maza, B.; Urioste Fondo, A.; Dameto Pons, C.; Cuevas, M.J.; Ballesteros Pomar, M.D. Prevalence of Sarcopenic Obesity According to Different Diagnostic Methods and Cut-off Points in Candidates for Bariatric Surgery. Clin. Nutr. 2024, 43, 1087–1093. [Google Scholar] [CrossRef]
- Zambon Azevedo, V.; Ponnaiah, M.; Bel Lassen, P.; Ratziu, V.; Oppert, J.M. A Diagnostic Proposal for Sarcopenic Obesity in Adults Based on Body Composition Phenotypes. Clin. Nutr. ESPEN 2022, 52, 119–130. [Google Scholar] [CrossRef]
- Lebiedowska, A.; Hartman-Petrycka, M.; Błońska-Fajfrowska, B. How Reliable Is BMI? Bioimpedance Analysis of Body Composition in Underweight, Normal Weight, Overweight, and Obese Women. Ir. J. Med. Sci. 2021, 190, 993–998. [Google Scholar] [CrossRef]
- Campa, F.; Toselli, S.; Mazzilli, M.; Gobbo, L.A.; Coratella, G. Assessment of Body Composition in Athletes: A Narrative Review of Available Methods with Special Reference to Quantitative and Qualitative Bioimpedance Analysis. Nutrients 2021, 13, 1620. [Google Scholar] [CrossRef]
- Price, K.L.; Earthman, C.P. Update on Body Composition Tools in Clinical Settings: Computed Tomography, Ultrasound, and Bioimpedance Applications for Assessment and Monitoring. Eur. J. Clin. Nutr. 2019, 73, 187–193. [Google Scholar] [CrossRef]
- Espinosa-Flores, A.J.; Guzman-Ortiz, E.; Melendez-Mier, G.; Ternovoy, S.K.; Bueno-Hernandez, N.; Roldan-Valadez, E. A Scoping Review of the Methods Used in Patients with Liver Cirrhosis to Assess Body Composition and Their Nutritional Findings. Eur. J. Clin. Nutr. 2023, 77, 845–854. [Google Scholar] [CrossRef] [PubMed]
- Tarabeih, N.; Kalinkovich, A.; Ashkenazi, S.; Cherny, S.S.; Shalata, A.; Livshits, G. Analysis of the Associations of Measurements of Body Composition and Inflammatory Factors with Cardiovascular Disease and Its Comorbidities in a Community-Based Study. Biomedicines 2024, 12, 1066. [Google Scholar] [CrossRef]
- Tarabeih, N.; Kalinkovich, A.; Shalata, A.; Higla, O.; Livshits, G. Pro-Inflammatory Biomarkers Combined with Body Composition Display a Strong Association with Knee Osteoarthritis in a Community-Based Study. Biomolecules 2023, 13, 1315. [Google Scholar] [CrossRef]
- Mariani, F.; Roncucci, L. Chemerin/ChemR23 Axis in Inflammation Onset and Resolution. Inflamm. Res. 2015, 64, 85–95. [Google Scholar] [CrossRef] [PubMed]
- Yue, G.; An, Q.; Xu, X.; Jin, Z.; Ding, J.; Hu, Y.; Du, Q.; Xu, J.; Xie, R. The Role of Chemerin in Human Diseases. Cytokine 2023, 162, 156089. [Google Scholar] [CrossRef]
- Eichelmann, F.; Schulze, M.B.; Wittenbecher, C.; Menzel, J.; Weikert, C.; di Giuseppe, R.; Biemann, R.; Isermann, B.; Fritsche, A.; Boeing, H.; et al. Chemerin as a Biomarker Linking Inflammation and Cardiovascular Diseases. J. Am. Coll. Cardiol. 2019, 73, 378–379. [Google Scholar] [CrossRef] [PubMed]
- Leiherer, A.; Muendlein, A.; Kinz, E.; Vonbank, A.; Rein, P.; Fraunberger, P.; Malin, C.; Saely, C.H.; Drexel, H. High Plasma Chemerin Is Associated with Renal Dysfunction and Predictive for Cardiovascular Events—Insights from Phenotype and Genotype Characterization. Vasc. Pharmacol. 2016, 77, 60–68. [Google Scholar] [CrossRef] [PubMed]
- Zhang, O.; Ji, Q.; Lin, Y.; Wang, Z.; Huang, Y.; Lu, W.; Liu, X.; Zhang, J.; Liu, Y.; Zhou, Y. jie Circulating Chemerin Levels Elevated in Dilated Cardiomyopathy Patients with Overt Heart Failure. Clin. Chim. Acta 2015, 448, 27–32. [Google Scholar] [CrossRef]
- Herová, M.; Schmid, M.; Gemperle, C.; Loretz, C.; Hersberger, M. Low Dose Aspirin Is Associated with Plasma Chemerin Levels and May Reduce Adipose Tissue Inflammation. Atherosclerosis 2014, 235, 256–262. [Google Scholar] [CrossRef]
- Xie, Q.; Deng, Y.; Huang, C.; Liu, P.; Yang, Y.; Shen, W.; Gao, P. Chemerin-Induced Mitochondrial Dysfunction in Skeletal Muscle. J. Cell Mol. Med. 2015, 19, 986–995. [Google Scholar] [CrossRef]
- Bastard, J.P.; Dridi-Brahimi, I.; Vatier, C.; Fellahi, S.; Fève, B. Biological Markers of Adipose Tissue: Adipokines. Ann. Endocrinol. 2024, 85, 171–172. [Google Scholar] [CrossRef]
- Hu, S.; Shao, Z.; Zhang, C.; Chen, L.; Al Mamun, A.; Zhao, N.; Cai, J.; Lou, Z.; Wang, X.; Chen, J. Chemerin Facilitates Intervertebral Disc Degeneration via TLR4 and CMKLR1 and Activation of NF-KB Signaling Pathway. Aging 2020, 12, 11732–11753. [Google Scholar] [CrossRef]
- Fülöp, P.; Seres, I.; Lorincz, H.; Harangi, M.; Somodi, S.; Paragh, G. Association of Chemerin with Oxidative Stress, Inflammation and Classical Adipokines in Non-Diabetic Obese Patients. J. Cell Mol. Med. 2014, 18, 1313–1320. [Google Scholar] [CrossRef]
- Lehrke, M.; Becker, A.; Greif, M.; Stark, R.; Laubender, R.P.; Von Ziegler, F.; Lebherz, C.; Tittus, J.; Reiser, M.; Becker, C.; et al. Chemerin Is Associated with Markers of Inflammation and Components of the Metabolic Syndrome but Does Not Predict Coronary Atherosclerosis. Eur. J. Endocrinol. 2009, 161, 339–344. [Google Scholar] [CrossRef] [PubMed]
- Zylla, S.; Pietzner, M.; Kühn, J.P.; Völzke, H.; Dörr, M.; Nauck, M.; Friedrich, N. Serum Chemerin Is Associated with Inflammatory and Metabolic Parameters-Results of a Population-Based Study. Obesity 2017, 25, 468–475. [Google Scholar] [CrossRef] [PubMed]
- Boesch, J.; Pierrel, E.; Lambert, C.; Doelemeyer, A.; Kreider, J.; Accart, N.; Summermatter, S. Chemokine-like Receptor 1 Plays a Critical Role in Modulating the Regenerative and Contractile Properties of Muscle Tissue. Front. Physiol. 2022, 13, 1044488. [Google Scholar] [CrossRef]
- Brocker, C.; Thompson, D.C.; Vasiliou, V. The Role of Hyperosmotic Stress in Inflammation and Disease. Biomol. Concepts 2012, 3, 345–364. [Google Scholar] [CrossRef]
- Stookey, J.D.; Barclay, D.; Arieff, A.; Popkin, B.M. The Altered Fluid Distribution in Obesity May Reflect Plasma Hypertonicity. Eur. J. Clin. Nutr. 2007, 61, 190–199. [Google Scholar] [CrossRef]
- Yoon, H.-J.; You, S.; Yoo, S.-A.; Kim, N.-H.; Kwon, H.M.; Yoon, C.-H.; Cho, C.-S.; Hwang, D.; Kim, W.-U. NF-AT5 Is a Critical Regulator of Inflammatory Arthritis. Arthritis Rheum. 2011, 63, 1843–1852. [Google Scholar] [CrossRef] [PubMed]
- Serra-Prat, M.; Lorenzo, I.; Palomera, E.; Yébenes, J.C.; Campins, L.; Cabré, M. Intracellular Water Content in Lean Mass Is Associated with Muscle Strength, Functional Capacity, and Frailty in Community-Dwelling Elderly Individuals. A Cross-Sectional Study. Nutrients 2019, 11, 661. [Google Scholar] [CrossRef]
- Yamada, Y.; Yoshida, T.; Yokoyama, K.; Watanabe, Y.; Miyake, M.; Yamagata, E.; Yamada, M.; Kimura, M. The Extracellular to Intracellular Water Ratio in Upper Legs Is Negatively Associated with Skeletal Muscle Strength and Gait Speed in Older People. J. Gerontol. A Biol. Sci. Med. Sci. 2017, 72, 293–298. [Google Scholar] [CrossRef]
- Serra-Prat, M.; Lorenzo, I.; Palomera, E.; Ramírez, S.; Yébenes, J.C. Total Body Water and Intracellular Water Relationships with Muscle Strength, Frailty and Functional Performance in an Elderly Population. A Cross-Sectional Study. J. Nutr. Health Aging 2019, 23, 96–101. [Google Scholar] [CrossRef]
- Hu, B.; Yang, X.R.; Xu, Y.; Sun, Y.F.; Sun, C.; Guo, W.; Zhang, X.; Wang, W.M.; Qiu, S.J.; Zhou, J.; et al. Systemic Immune-Inflammation Index Predicts Prognosis of Patients After Curative Resection for Hepatocellular Carcinoma. Clin. Cancer Res. 2014, 20, 6212–6222. [Google Scholar] [CrossRef]
- Ye, Z.; Hu, T.; Wang, J.; Xiao, R.; Liao, X.; Liu, M.; Sun, Z. Systemic Immune-Inflammation Index as a Potential Biomarker of Cardiovascular Diseases: A Systematic Review and Meta-Analysis. Front. Cardiovasc. Med. 2022, 9, 933913. [Google Scholar] [CrossRef] [PubMed]
- Zhang, Y.Z.; Ma, R.W.; Bhandari, S.; Xie, J.; Zhang, X.Y.; Xie, C.; Duan, H.; Meng, J.; Wu, Q.Y.; Liu, K.; et al. Association Between Systemic Immune Inflammation Index and Adolescent Obesity in a Cross-Sectional Analysis. Sci. Rep. 2025, 15, 6439. [Google Scholar] [CrossRef] [PubMed]
- De Lorenzo, A.; Itani, L.; El Ghoch, M.; Frank, G.; De Santis, G.L.; Gualtieri, P.; Di Renzo, L. The Association Between Sarcopenic Obesity and DXA-Derived Visceral Adipose Tissue (VAT) in Adults. Nutrients 2024, 16, 1645. [Google Scholar] [CrossRef] [PubMed]
- Pinel, A.; Guillet, C.; Capel, F.; Pouget, M.; De Antonio, M.; Pereira, B.; Topinkova, E.; Eglseer, D.; Barazzoni, R.; Cruz-Jentoft, A.J.; et al. Identification of Factors Associated with Sarcopenic Obesity Development: Literature Review and Expert Panel Voting. Clin. Nutr. 2024, 43, 1414–1424. [Google Scholar] [CrossRef]
- Ingelsson, E.; Schaefer, E.J.; Contois, J.H.; McNamara, J.R.; Sullivan, L.; Keyes, M.J.; Pencina, M.J.; Schoonmaker, C.; Wilson, P.W.F.; D’Agostino, R.B.; et al. Clinical Utility of Different Lipid Measures for Prediction of Coronary Heart Disease in Men and Women. JAMA 2007, 298, 776–785. [Google Scholar] [CrossRef]
- Kosmas, C.E.; Rodriguez Polanco, S.; Bousvarou, M.D.; Papakonstantinou, E.J.; Peña Genao, E.; Guzman, E.; Kostara, C.E. The Triglyceride/High-Density Lipoprotein Cholesterol (TG/HDL-C) Ratio as a Risk Marker for Metabolic Syndrome and Cardiovascular Disease. Diagnostics 2023, 13, 929. [Google Scholar] [CrossRef]
- Wang, R.; Wang, Y.; Wei, Z.; Wang, J.; Tang, H.; Gao, X.; Wang, J.; Zhang, C.; Chen, X. The Association Between HDL-c Levels and Computed Tomography-Based Osteosarcopenia in Older Adults. BMC Musculoskelet. Disord. 2024, 25, 932. [Google Scholar] [CrossRef]
- Atkins, J.L.; Wannamathee, S.G. Sarcopenic Obesity in Ageing: Cardiovascular Outcomes and Mortality. Br. J. Nutr. 2020, 124, 1102–1113. [Google Scholar] [CrossRef]
- Evans, K.; Abdelhafiz, D.; Abdelhafiz, A.H. Sarcopenic Obesity as a Determinant of Cardiovascular Disease Risk in Older People: A Systematic Review. Postgrad. Med. 2021, 133, 831–842. [Google Scholar] [CrossRef]
- Mirzai, S.; Carbone, S.; Batsis, J.A.; Kritchevsky, S.B.; Kitzman, D.W.; Shapiro, M.D. Sarcopenic Obesity and Cardiovascular Disease: An Overlooked but High-Risk Syndrome. Curr. Obes. Rep. 2024, 13, 532–544. [Google Scholar] [CrossRef]
- Benz, E.; Pinel, A.; Guillet, C.; Capel, F.; Pereira, B.; De Antonio, M.; Pouget, M.; Cruz-Jentoft, A.J.; Eglseer, D.; Topinkova, E.; et al. Sarcopenia and Sarcopenic Obesity and Mortality Among Older People. JAMA Netw. Open 2024, 7, e243604. [Google Scholar] [CrossRef] [PubMed]
- Liu, C.; Wong, P.Y.; Chung, Y.L.; Chow, S.K.H.; Cheung, W.H.; Law, S.W.; Chan, J.C.N.; Wong, R.M.Y. Deciphering the “Obesity Paradox” in the Elderly: A Systematic Review and Meta-Analysis of Sarcopenic Obesity. Obes. Rev. 2023, 24, e13534. [Google Scholar] [CrossRef] [PubMed]
- Lim, S.; Kim, J.H.; Yoon, J.W.; Kang, S.M.; Choi, S.H.; Park, Y.J.; Kim, K.W.; Lim, J.Y.; Park, K.S.; Jang, H.C. Sarcopenic Obesity: Prevalence and Association with Metabolic Syndrome in the Korean Longitudinal Study on Health and Aging (KLoSHA). Diabetes Care 2010, 33, 1652–1654. [Google Scholar] [CrossRef]
- Szeszulski, J.; Lorenzo, E.; Arriola, A.; Lee, R.E. Community-Based Measurement of Body Composition in Hispanic Women: Concurrent Validity of Dual- And Single-Frequency Bioelectrical Impedance. J. Strength. Cond. Res. 2022, 36, 577–584. [Google Scholar] [CrossRef]
- Moonen, H.P.F.X.; Van Zanten, A.R.H. Bioelectric Impedance Analysis for Body Composition Measurement and Other Potential Clinical Applications in Critical Illness. Curr. Opin. Crit. Care 2021, 27, 344–353. [Google Scholar] [CrossRef]
- Wang, M.; Tan, Y.; Shi, Y.; Wang, X.; Liao, Z.; Wei, P. Diabetes and Sarcopenic Obesity: Pathogenesis, Diagnosis, and Treatments. Front. Endocrinol. 2020, 11, 568. [Google Scholar] [CrossRef] [PubMed]
- Kim, T.N.; Choi, K.M. The Implications of Sarcopenia and Sarcopenic Obesity on Cardiometabolic Disease. J. Cell Biochem. 2015, 116, 1171–1178. [Google Scholar] [CrossRef]
- Zadgaonkar, U. The Interplay Between Adipokines and Body Composition in Obesity and Metabolic Diseases. Cureus 2025, 17, e78050. [Google Scholar] [CrossRef]
- Zhao, Z.; Zhang, X.; Sun, T.; Huang, X.; Ma, M.; Yang, S.; Zhou, Y. Prognostic Value of Systemic Immune-Inflammation Index in CAD Patients: Systematic Review and Meta-Analyses. Eur. J. Clin. Investig. 2024, 54, e14100. [Google Scholar] [CrossRef]
- Axelrod, C.L.; Dantas, W.S.; Kirwan, J.P. Sarcopenic Obesity: Emerging Mechanisms and Therapeutic Potential. Metabolism 2023, 146, 155639. [Google Scholar] [CrossRef]
- Colleluori, G.; Villareal, D.T. Aging, Obesity, Sarcopenia and the Effect of Diet and Exercise Intervention. Exp. Gerontol. 2021, 155, 111561. [Google Scholar] [CrossRef] [PubMed]
- Assyov, Y.; Nedeva, I.; Spassov, B.; Gerganova, A.; Velikov, T.; Kamenov, Z.; Velikova, T. Nutritional Management and Physical Activity in the Treatment of Sarcopenic Obesity: A Review of the Literature. Nutrients 2024, 16, 2560. [Google Scholar] [CrossRef] [PubMed]
- von Elm, E.; Altman, D.G.; Egger, M.; Pocock, S.J.; Gøtzsche, P.C.; Vandenbroucke, J.P. Strengthening the Reporting of Observational Studies in Epidemiology (STROBE) Statement: Guidelines for Reporting Observational Studies. BMJ 2007, 335, 806–808. [Google Scholar] [CrossRef]
- Tarabeih, N.; Kalinkovich, A.; Shalata, A.; Livshits, G. Circulating Levels of Visceral Adipose Tissue-Derived Serine Protease Inhibitor (Vaspin) Appear as a Marker of Musculoskeletal Pain Disability. Diagnostics 2020, 10, 797. [Google Scholar] [CrossRef] [PubMed]
- Tarabeih, N.; Masharawi, Y.; Shalata, A.; Higla, O.; Kalinkovich, A.; Livshits, G. Scoliosis and Skeletal Muscle Mass Are Strongly Associated with Low Back Pain-Related Disability in Humans: An Evolutionary Anthropology Point of View. Am. J. Hum. Biol. 2022, 34, e23757. [Google Scholar] [CrossRef]
- Achamrah, N.; Colange, G.; Delay, J.; Rimbert, A.; Folope, V.; Petit, A.; Grigioni, S.; Déchelotte, P.; Coëffier, M. Comparison of Body Composition Assessment by DXA and BIA According to the Body Mass Index: A Retrospective Study on 3655 Measures. PLoS ONE 2018, 13, e0200465. [Google Scholar] [CrossRef]
- Marra, M.; Sammarco, R.; De Lorenzo, A.; Iellamo, F.; Siervo, M.; Pietrobelli, A.; Donini, L.M.; Santarpia, L.; Cataldi, M.; Pasanisi, F.; et al. Assessment of Body Composition in Health and Disease Using Bioelectrical Impedance Analysis (BIA) and Dual Energy X-Ray Absorptiometry (DXA): A Critical Overview. Contrast Media Mol. Imaging 2019, 2019, 3548284. [Google Scholar] [CrossRef]
- Thomas, M.R.; Storey, R.F. The Role of Platelets in Inflammation. Thromb. Haemost. 2015, 114, 449–458. [Google Scholar] [CrossRef]
- Lolli, C.; Basso, U.; Derosa, L.; Scarpi, E.; Sava, T.; Santoni, M.; Crabb, S.J.; Massari, F.; Aieta, M.; Conteduca, V.; et al. Systemic Immune-Inflammation Index Predicts the Clinical Outcome in Patients with Metastatic Renal Cell Cancer Treated with Sunitinib. Oncotarget 2016, 7, 54564–54571. [Google Scholar] [CrossRef]
- Ma, M.; Wu, K.; Sun, T.; Huang, X.; Zhang, B.; Chen, Z.; Zhao, Z.; Zhao, J.; Zhou, Y. Impacts of Systemic Inflammation Response Index on the Prognosis of Patients with Ischemic Heart Failure After Percutaneous Coronary Intervention. Front. Immunol. 2024, 15, 1324890. [Google Scholar] [CrossRef]
- Jiang, M.; Yang, J.; Zou, H.; Li, M.; Sun, W.; Kong, X. Monocyte-to-High-Density Lipoprotein-Cholesterol Ratio (MHR) and the Risk of All-Cause and Cardiovascular Mortality: A Nationwide Cohort Study in the United States. Lipids Health Dis. 2022, 21, 30. [Google Scholar] [CrossRef] [PubMed]
- Villanueva, D.L.E.; Tiongson, M.D.; Ramos, J.D.; Llanes, E.J. Monocyte to High-Density Lipoprotein Ratio (MHR) as a Predictor of Mortality and Major Adverse Cardiovascular Events (MACE) among ST Elevation Myocardial Infarction (STEMI) Patients Undergoing Primary Percutaneous Coronary Intervention: A Meta-Analysis. Lipids Health Dis. 2020, 19, 55. [Google Scholar] [CrossRef] [PubMed]
- Tarabeih, N.; Kalinkovich, A.; Ashkenazi, S.; Cherny, S.S.; Shalata, A.; Livshits, G. Relationships Between Circulating Biomarkers and Body Composition Parameters in Patients with Metabolic Syndrome: A Community-Based Study. Int. J. Mol. Sci. 2024, 25, 881. [Google Scholar] [CrossRef] [PubMed]


| Study Group/ Variable | Control (n = 136) | SP (n = 70) | OB (n = 30) | SOP (n = 326) | P1 | P2 |
|---|---|---|---|---|---|---|
| Age (y) | 30.26 ± 0.736 | 39.50 ± 1.273 | 40.37 ± 1.911 | 49.47 ± 0.654 | ||
| Anthropometric and Body Composition Variables | ||||||
| BMI (kg/m2) | 21.88 ± 0.196 | 25.59 ± 0.258 | 25.84 ± 0.516 | 32.36 ± 0.259 | 0.001 # | 0.001 |
| FM/WT (kg) | 0.27 ± 0.004 | 0.35 ± 0.003 | 0.30 ± 0.007 | 0.41 ± 0.002 | 0.001 # | 0.001 |
| ECW (L) | 14.84 ± 0.147 | 15.17 ± 0.215 | 16.41 ± 0.369 | 17.70 ± 0.136 | 1.61 × 10¹⁴ # | 5.70 × 10¹⁰ |
| Biochemical Factors | ||||||
| Adiponectin (µg/mL) | 4.82 ± 0.161 | 4.50 ± 0.21 | 4.33 ± 0.278 | 4.27 ± 0.094 | 0.005 | 0.0002 |
| Adipsin (µg/mL) | 0.09 ± 0.022 | 0.13 ± 0.028 | 0.20 ± 0.057 | 0.27 ± 0.016 | NS | 0.05 |
| Activin A (pg/mL) * | 7.05 ± 0.09 | 6.89 ± 0.13 | 6.65 ± 0.26 | 6.71 ± 0.06 | NS | 0.01 |
| Follistatin (pg/mL) * | 5.85 ± 0.082 | 5.87 ± 0.190 | 5.98 ± 0.190 | 6.25 ± 0.038 | NS | NS |
| FSTL1 (ng/mL) | 13.37 ± 0.38 | 13.66 ± 0.52 | 13.83 ± 0.64 | 13.77 ± 0.25 | NS | NS |
| FGF-21 (ng/mL) | 1.49 ± 0.04 | 1.45 ± 0.05 | 1.49 ± 0.09 | 1.49 ± 0.02 | NS | NS |
| Chemerin (ng/mL) | 73.28 ± 1.719 | 83.28 ± 2.800 | 85.66 ± 4.232 | 100.75 ± 1.532 | 0.000006 # | 0.00003 |
| GDF-15 (pg/mL) * | 8.20 ± 0.046 | 8.36 ± 0.067 | 8.38 ± 0.095 | 8.89 ± 0.040 | 0.01 | NS |
| Leptin (ng/mL) * | 2.64 ± 0.060 | 3.19 ± 0.066 | 2.94 ± 0.097 | 3.59 ± 0.032 | 0.001 # | 0.001 |
| MCP1 (pg/mL) * | 3.79 ± 0.05 | 3.77 ± 0.07 | 3.98 ± 0.08 | 3.89 ± 0.03 | NS | NS |
| Vaspin (pg/mL) | 5.92 ± 0.090 | 5.82 ± 0.128 | 6.26 ± 0.254 | 6.08 ± 0.069 | NS | NS |
| Blood Cell Count and Inflammation Indexes | ||||||
| Leukocytes (×109/L) | 6.19 ± 0.13 | 6.58 ± 0.23 | 6.59 ± 0.32 | 7.05 ± 0.11 | 0.00001 # | 0.000004 |
| Neutrophils (×109/L) | 3.68 ± 0.117 | 4.79 ± 0.164 | 4.03 ± 0.261 | 4.17 ± 0.091 | 0.000002 # | 0.000001 |
| Lymphocytes (×109/L) | 1.94 ± 0.04 | 2.06 ± 0.07 | 1.83 ± 0.11 | 2.17 ± 0.03 | 0.003 | 0.001 |
| Monocytes (×109/L) | 0.41 ± 0.07 | 0.35 ± 0.01 | 0.33 ± 0.02 | 0.39 ± 0.02 | NS | NS |
| Platelets (×109/L) | 244.00 ± 4.94 | 252.91 ± 8.72 | 263.80 ± 10.46 | 255.32 ± 3.84 | NS | 0.05 |
| SII | 460.85 ± 18.63 | 485.95 ± 25.39 | 537.99 ± 44.01 | 536.44 ± 19.28 | 0.000008 # | 0.000002 |
| SIRI | 0.69 ± 0.035 | 0.69 ± 0.048 | 0.78 ± 0.09 | 0.84 ± 0.056 | NS | NS |
| MHR | 6.60 ± 0.237 | 7.10 ± 0.410 | 6.92 ± 0.469 | 8.26 ± 0.394 | NS | NS |
| Glucose and Blood Lipid Profile | ||||||
| Fasting plasma glucose (mg/dL) | 83.87 ± 0.738 | 88.10 ± 1.232 | 90.72 ± 2.330 | 102.75 ± 1.748 | 0.003 | 0.01 |
| TC (mg/dL) | 163.18 ± 2.33 | 178.68 ± 4.39 | 184.73 ± 6.68 | 185.04 ± 1.82 | 0.005 | 0.00004 |
| TG (mg/dL) | 80.31 ± 5.009 | 94.72 ± 5.509 | 98.61 ± 7.802 | 128.49 ± 3.901 | 0.0008 # | 0.0004 |
| HDL-C (mg/dL) | 54.04 ± 1.03 | 53.30 ± 1.58 | 49.95 ± 2.00 | 48.97 ± 0.63 | 0.00001 # | 0.000003 |
| LDL-C (mg/dL) | 96.22 ± 2.41 | 106.65 ± 3.80 | 114.80 ± 6.34 | 109.24 ± 1.70 | 0.008 | 0.0001 |
| TC/HDL-C (mg/dL) | 3.11 ± 0.065 | 3.49 ± 0.123 | 3.78 ± 0.160 | 3.89 ± 0.059 | 1.30 × 10⁸ # | 5.75 × 10¹¹ |
| TG/HDL-C(mg/dL) | 1.46 ± 0.078 | 1.92 ± 0.139 | 2.08 ± 0.202 | 2.90 ± 0.121 | 0.00001 # | 0.00001 |
| Comorbidities, n (%) | χ2 test | χ2 test | ||||
| HTN | 2 (1.47) | 6 (8.57) | 2 (6.66) | 125 (38.34) | <0.001 | <0.001 |
| T2D | 4 (2.94) | 2 (2.85) | 3 (10) | 87 (26.68) | <0.001 | <0.001 |
| HLD | 6 (4.41) | 10 (14.28) | 7 (23.3) | 151 (46.31) | <0.001 | <0.001 |
| Covariates | Wilks’ Lambda | p-Value |
|---|---|---|
| Age | 0.483 | 1.05 × 10¹⁵ |
| ECW | 0.427 | 9.13 × 10¹¹ |
| Chemerin | 0.427 | 0.001 |
| SII | 0.431 | 0.008 |
| TC/HDL-C | 0.450 | 8.72 × 10⁹ |
| Overall model: Wilks’ Lambda = 0.41, p < 0.00001 | ||
| SOP Status (326 Affected vs. 136 Controls) | |||
|---|---|---|---|
| Independent Covariate | OR (95% CI) | Β (SE) | p |
| Age | 6.24 (3.72–10.49) | 1.83 (0.26) | 3.86 × 10¹¹ |
| ECW | 7.77 (3.67–16.44) | 2.05 (0.38) | 0.00000007 |
| Chemerin | 2.85 (1.74–4.64) | 1.04 (0.25) | 0.00002 |
| SII | 1.87 (1.23–2.85) | 0.62 (0.21) | 0.003 |
| TC/HDL-C | 3.05 (1.80–5.17) | 1.11 (0.26) | 0.00002 |
| Comorbidity Pair | χ2 | Phi Coefficient | p-Value |
|---|---|---|---|
| HTN and HLD | 196.703 | 0.576 | <0.001 |
| HLD and T2D | 181.254 | 0.553 | <0.001 |
| T2D and HTN | 123.988 | 0.457 | <0.001 |
Disclaimer/Publisher’s Note: The statements, opinions and data contained in all publications are solely those of the individual author(s) and contributor(s) and not of MDPI and/or the editor(s). MDPI and/or the editor(s) disclaim responsibility for any injury to people or property resulting from any ideas, methods, instructions or products referred to in the content. |
© 2025 by the authors. Licensee MDPI, Basel, Switzerland. This article is an open access article distributed under the terms and conditions of the Creative Commons Attribution (CC BY) license (https://creativecommons.org/licenses/by/4.0/).
Share and Cite
Livshits, G.; Tarabeih, N.; Kalinkovich, A.; Shalata, A.; Ashkenazi, S. Metabolic and Inflammatory Biomarkers Predicting Sarcopenic Obesity and Cardiometabolic Risk in Arab Women: A Cross-Sectional Study. Int. J. Mol. Sci. 2025, 26, 5699. https://doi.org/10.3390/ijms26125699
Livshits G, Tarabeih N, Kalinkovich A, Shalata A, Ashkenazi S. Metabolic and Inflammatory Biomarkers Predicting Sarcopenic Obesity and Cardiometabolic Risk in Arab Women: A Cross-Sectional Study. International Journal of Molecular Sciences. 2025; 26(12):5699. https://doi.org/10.3390/ijms26125699
Chicago/Turabian StyleLivshits, Gregory, Nader Tarabeih, Alexander Kalinkovich, Adel Shalata, and Shai Ashkenazi. 2025. "Metabolic and Inflammatory Biomarkers Predicting Sarcopenic Obesity and Cardiometabolic Risk in Arab Women: A Cross-Sectional Study" International Journal of Molecular Sciences 26, no. 12: 5699. https://doi.org/10.3390/ijms26125699
APA StyleLivshits, G., Tarabeih, N., Kalinkovich, A., Shalata, A., & Ashkenazi, S. (2025). Metabolic and Inflammatory Biomarkers Predicting Sarcopenic Obesity and Cardiometabolic Risk in Arab Women: A Cross-Sectional Study. International Journal of Molecular Sciences, 26(12), 5699. https://doi.org/10.3390/ijms26125699