

Evaluating the Antitumor Potential of Cannabichromene, Cannabigerol, and Related Compounds from Cannabis sativa and Piper nigrum Against Malignant Glioma: An In Silico to In Vitro Approach

 ,
,  ,
,
Abstract

1. Introduction

| Compound | Chemical Structure | Effects | References |
|---|---|---|---|
| Cannabichromene (CBC) | 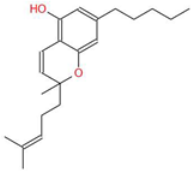 | A non-psychoactive cannabinoid with anti-inflammatory and anti-cancer properties, potentially modulating tumor cell proliferation and apoptosis. | [3,10] |
| Cannabigerol (CBG) | 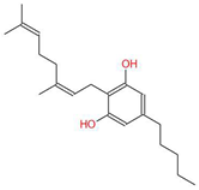 | Known as the precursor for many cannabinoids, it demonstrates anti-proliferative effects on cancer cells and modulates the endocannabinoid system. | [5,12] |
| Cannabidiolic Acid (CBDA) | 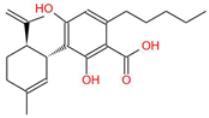 | A precursor to CBD, this compound exhibits anti-nausea and possible antitumor properties. | [13,25] |
| Piperine (P) |  | The major bioactive alkaloid in Piper nigrum, acts as a TRPV1 agonist, influencing apoptosis and oxidative stress in tumor cells. | [11,18] |
| Cannabidiol (CBD) | 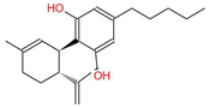 | A widely studied cannabinoid with anti-inflammatory, anti-tumor, and neuroprotective properties. | [6,13] |
| Tetrahydrocannabinol (THC) | 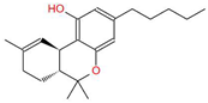 | The principal psychoactive compound in Cannabis sativa, also known to induce apoptosis in cancer cells. | [14,15,26,27] |
| Beta-caryophyllene (BCP) | 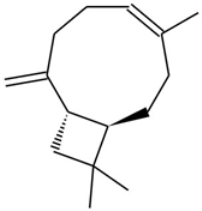 | A sesquiterpene with anti-inflammatory and potential anti-cancer activities, acting as a CB2 receptor agonist. | [12,19] |
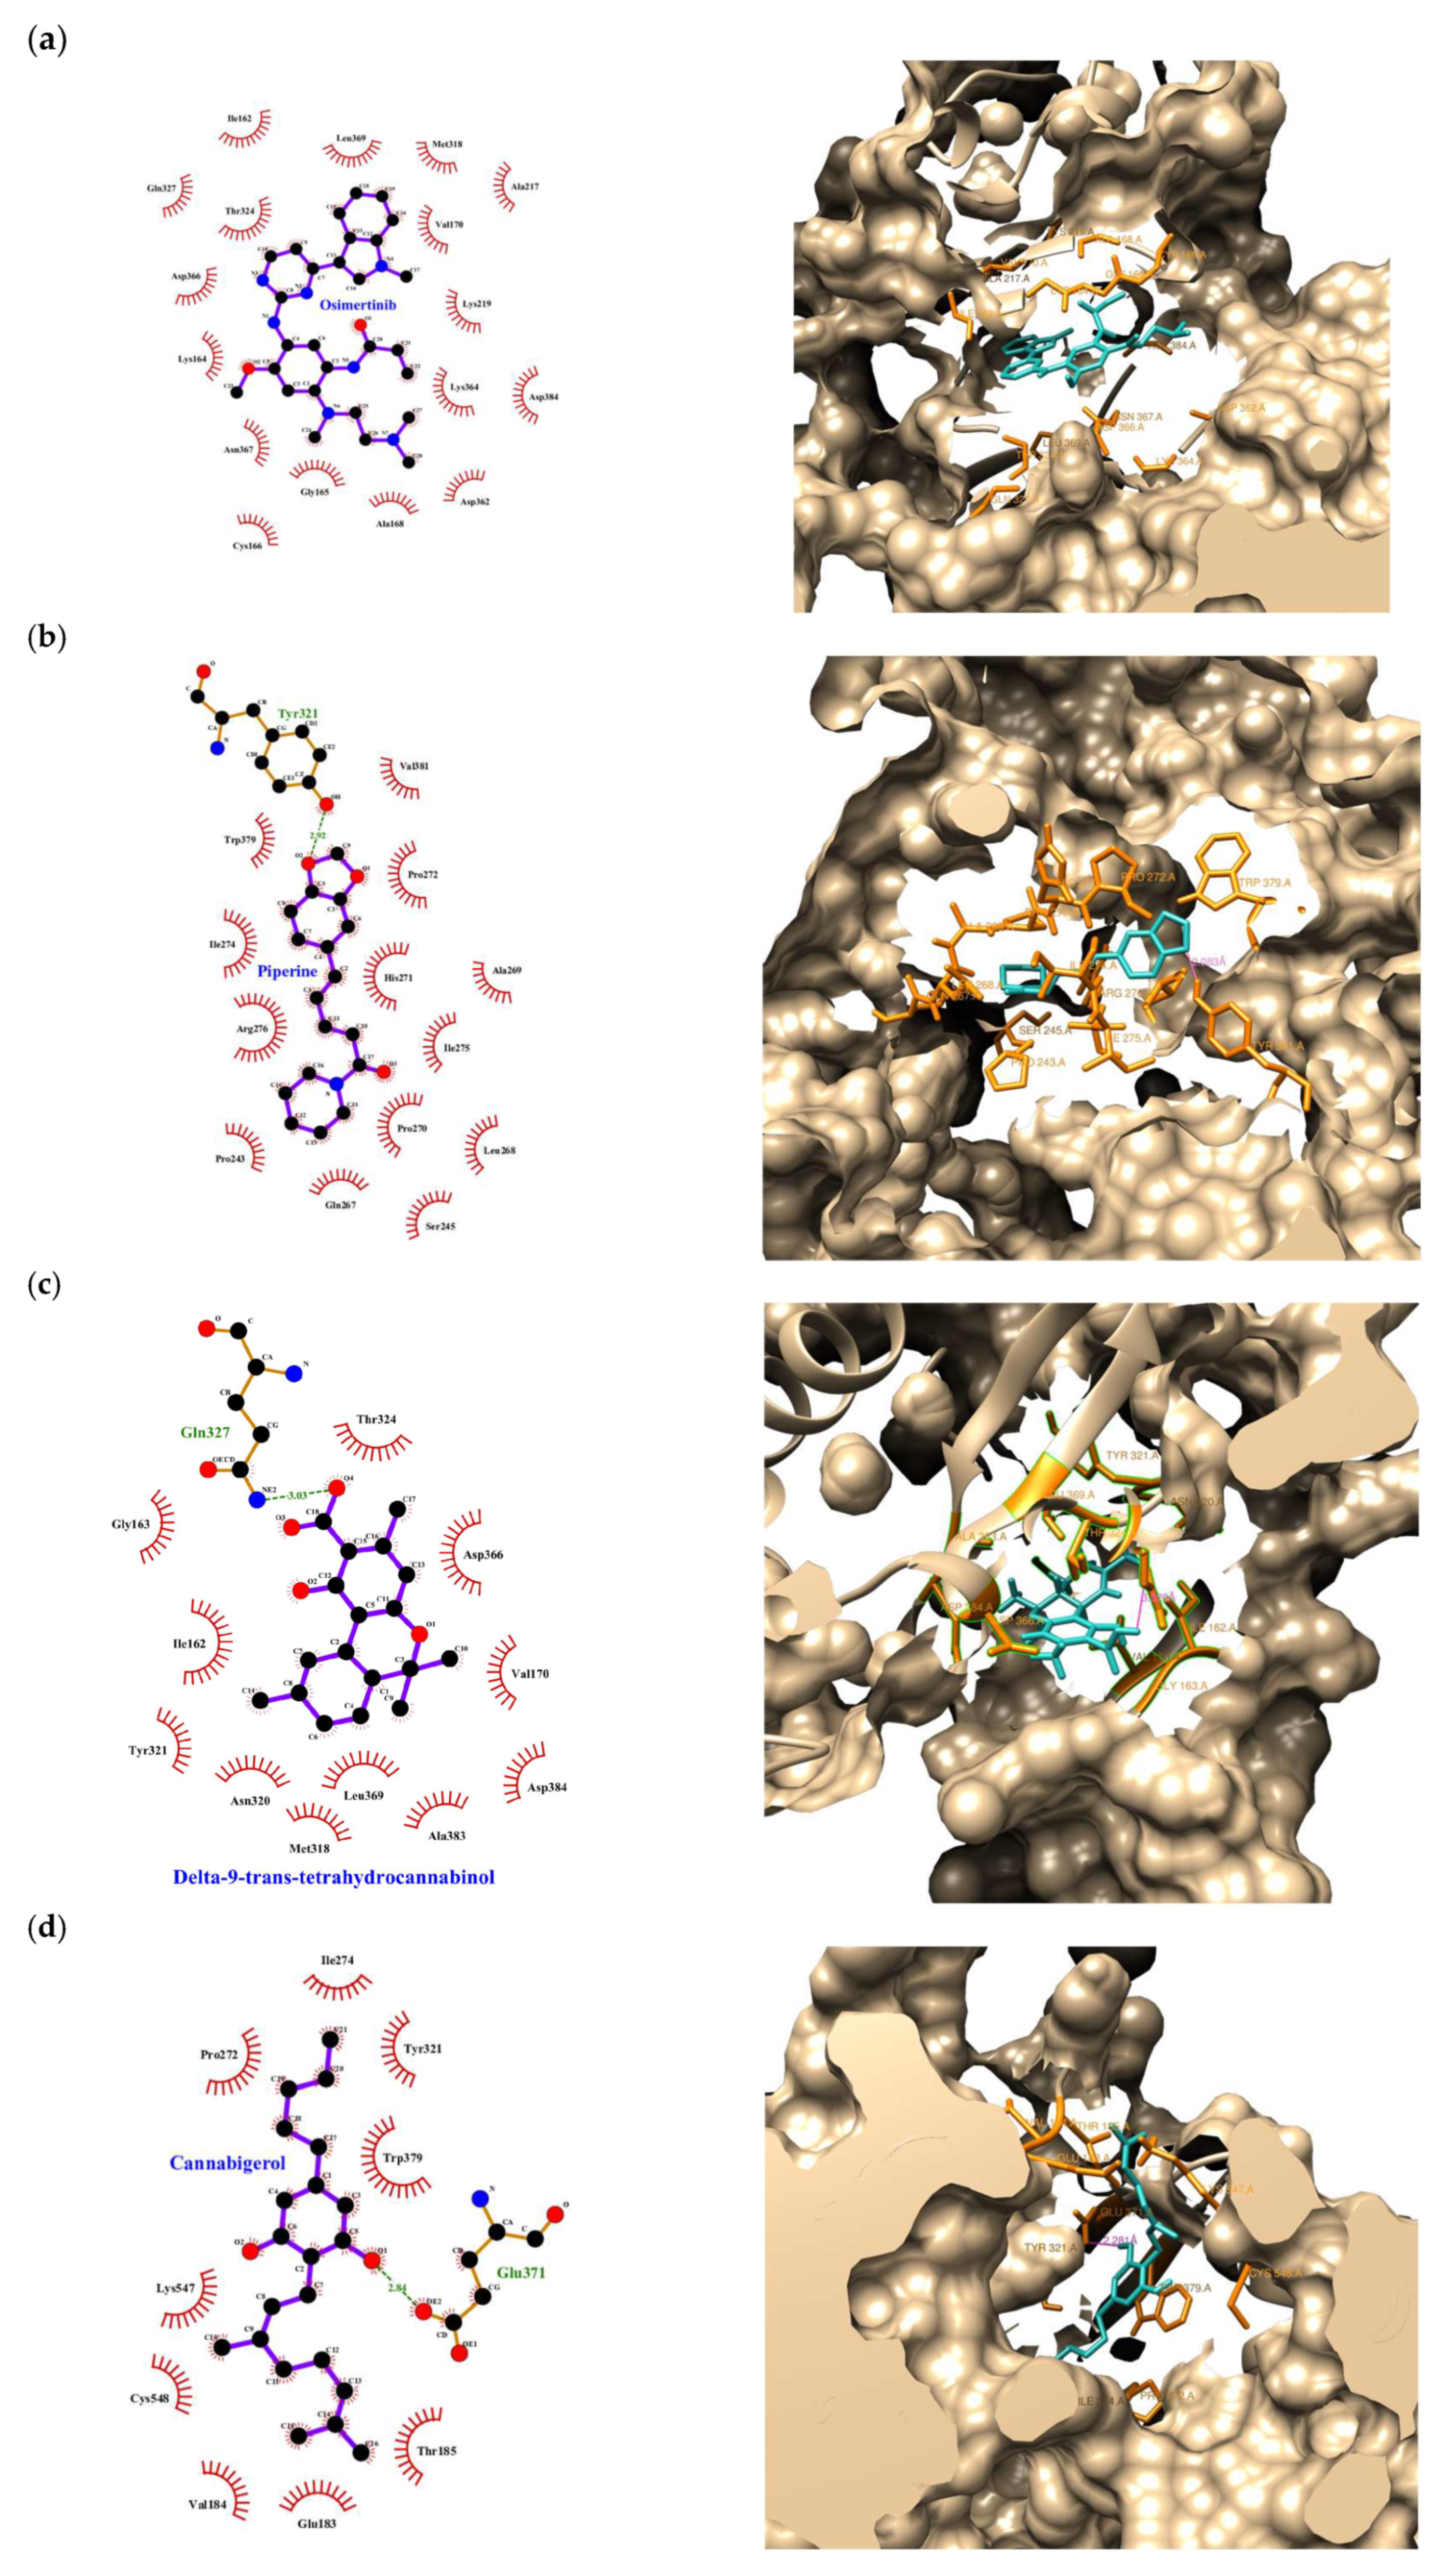
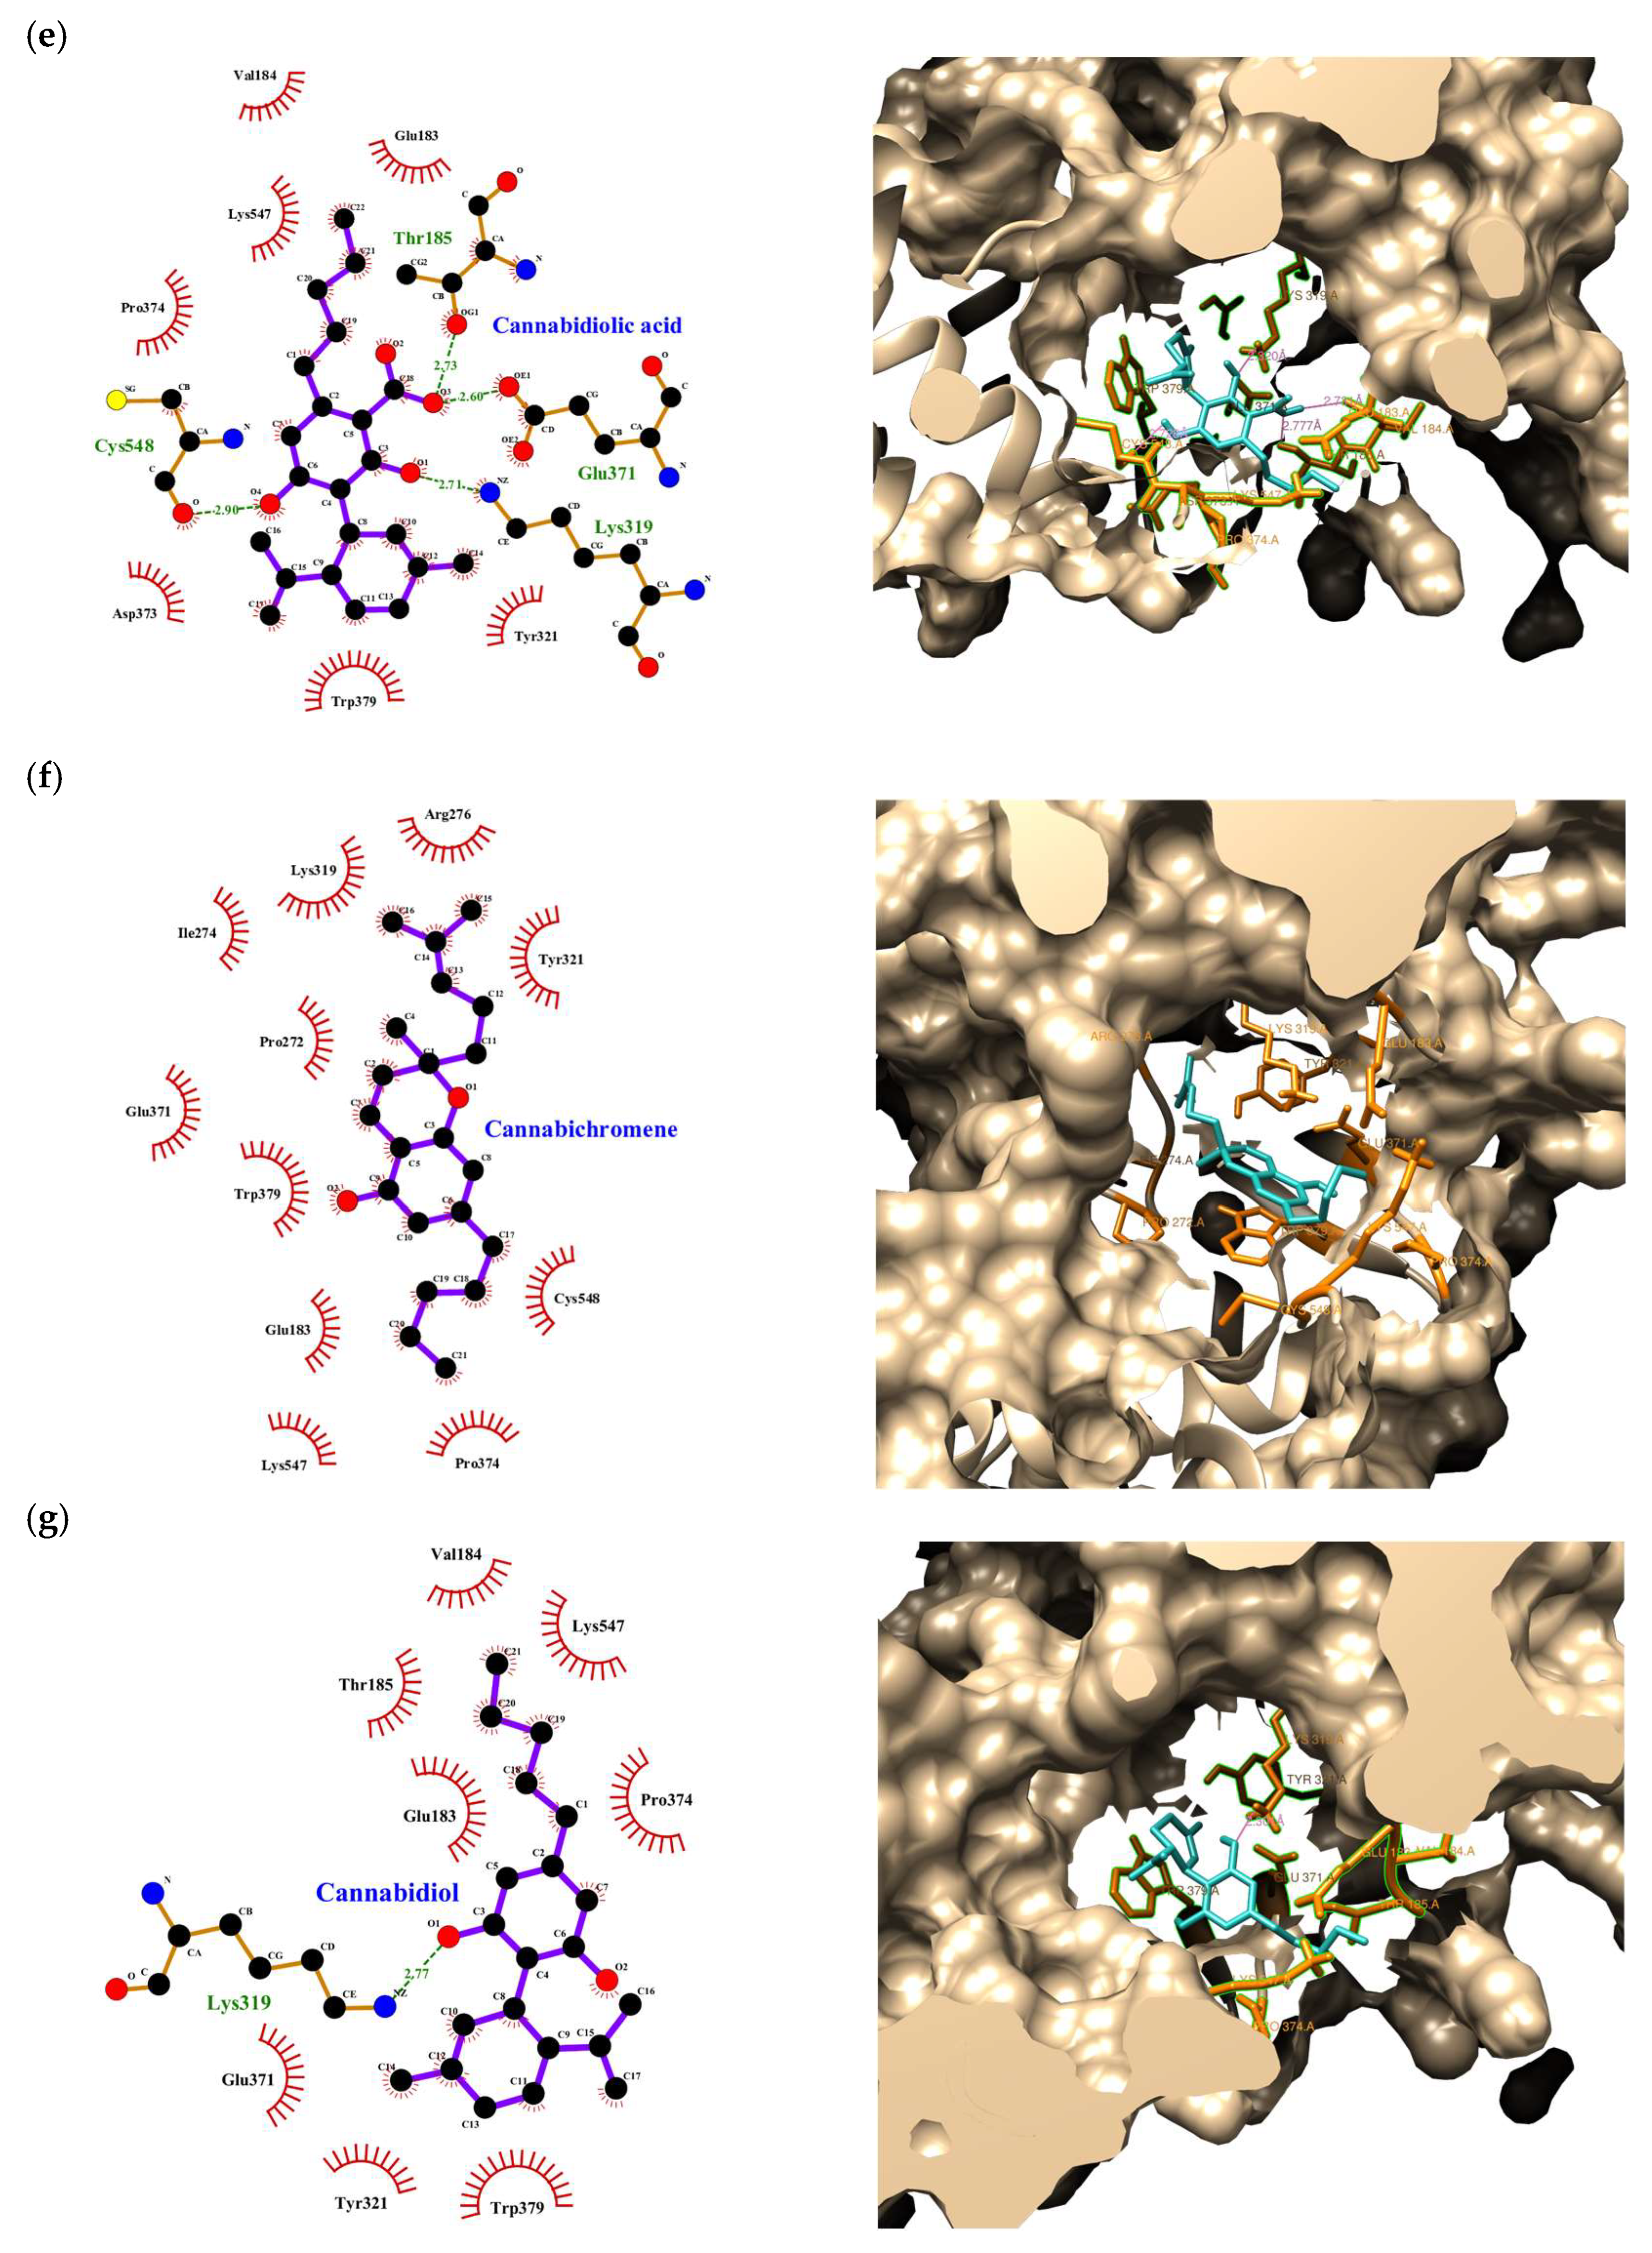
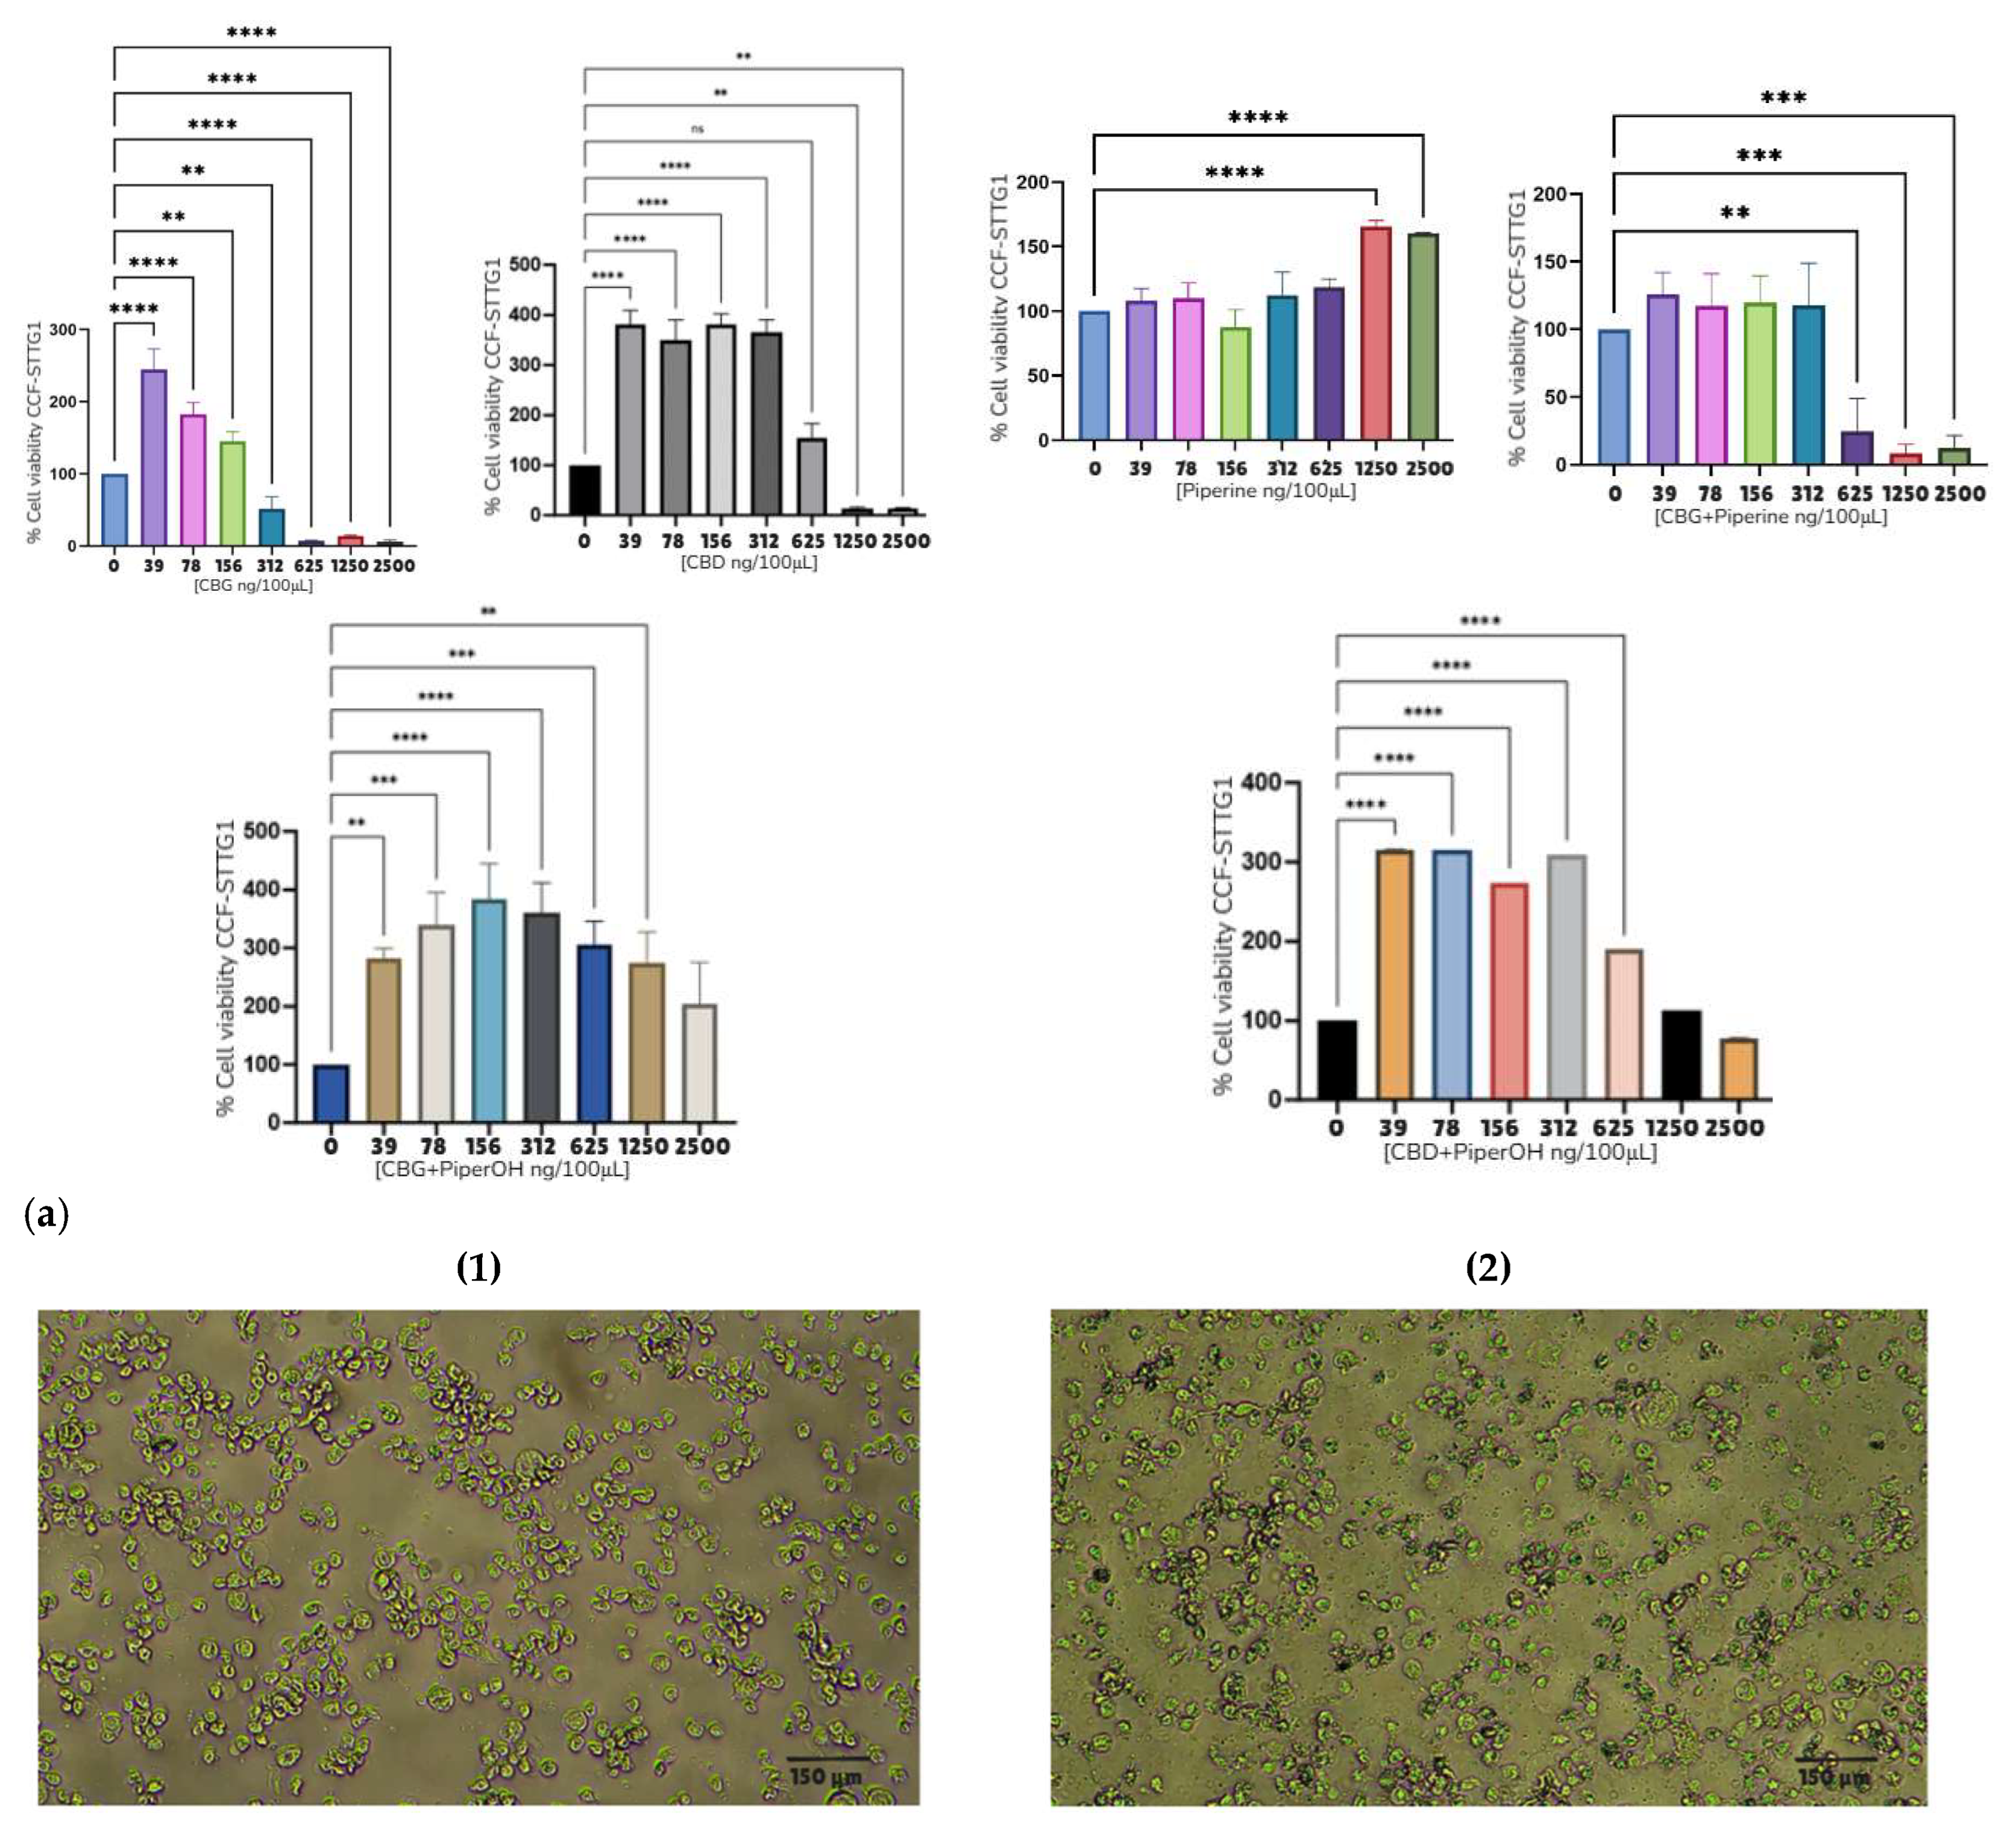
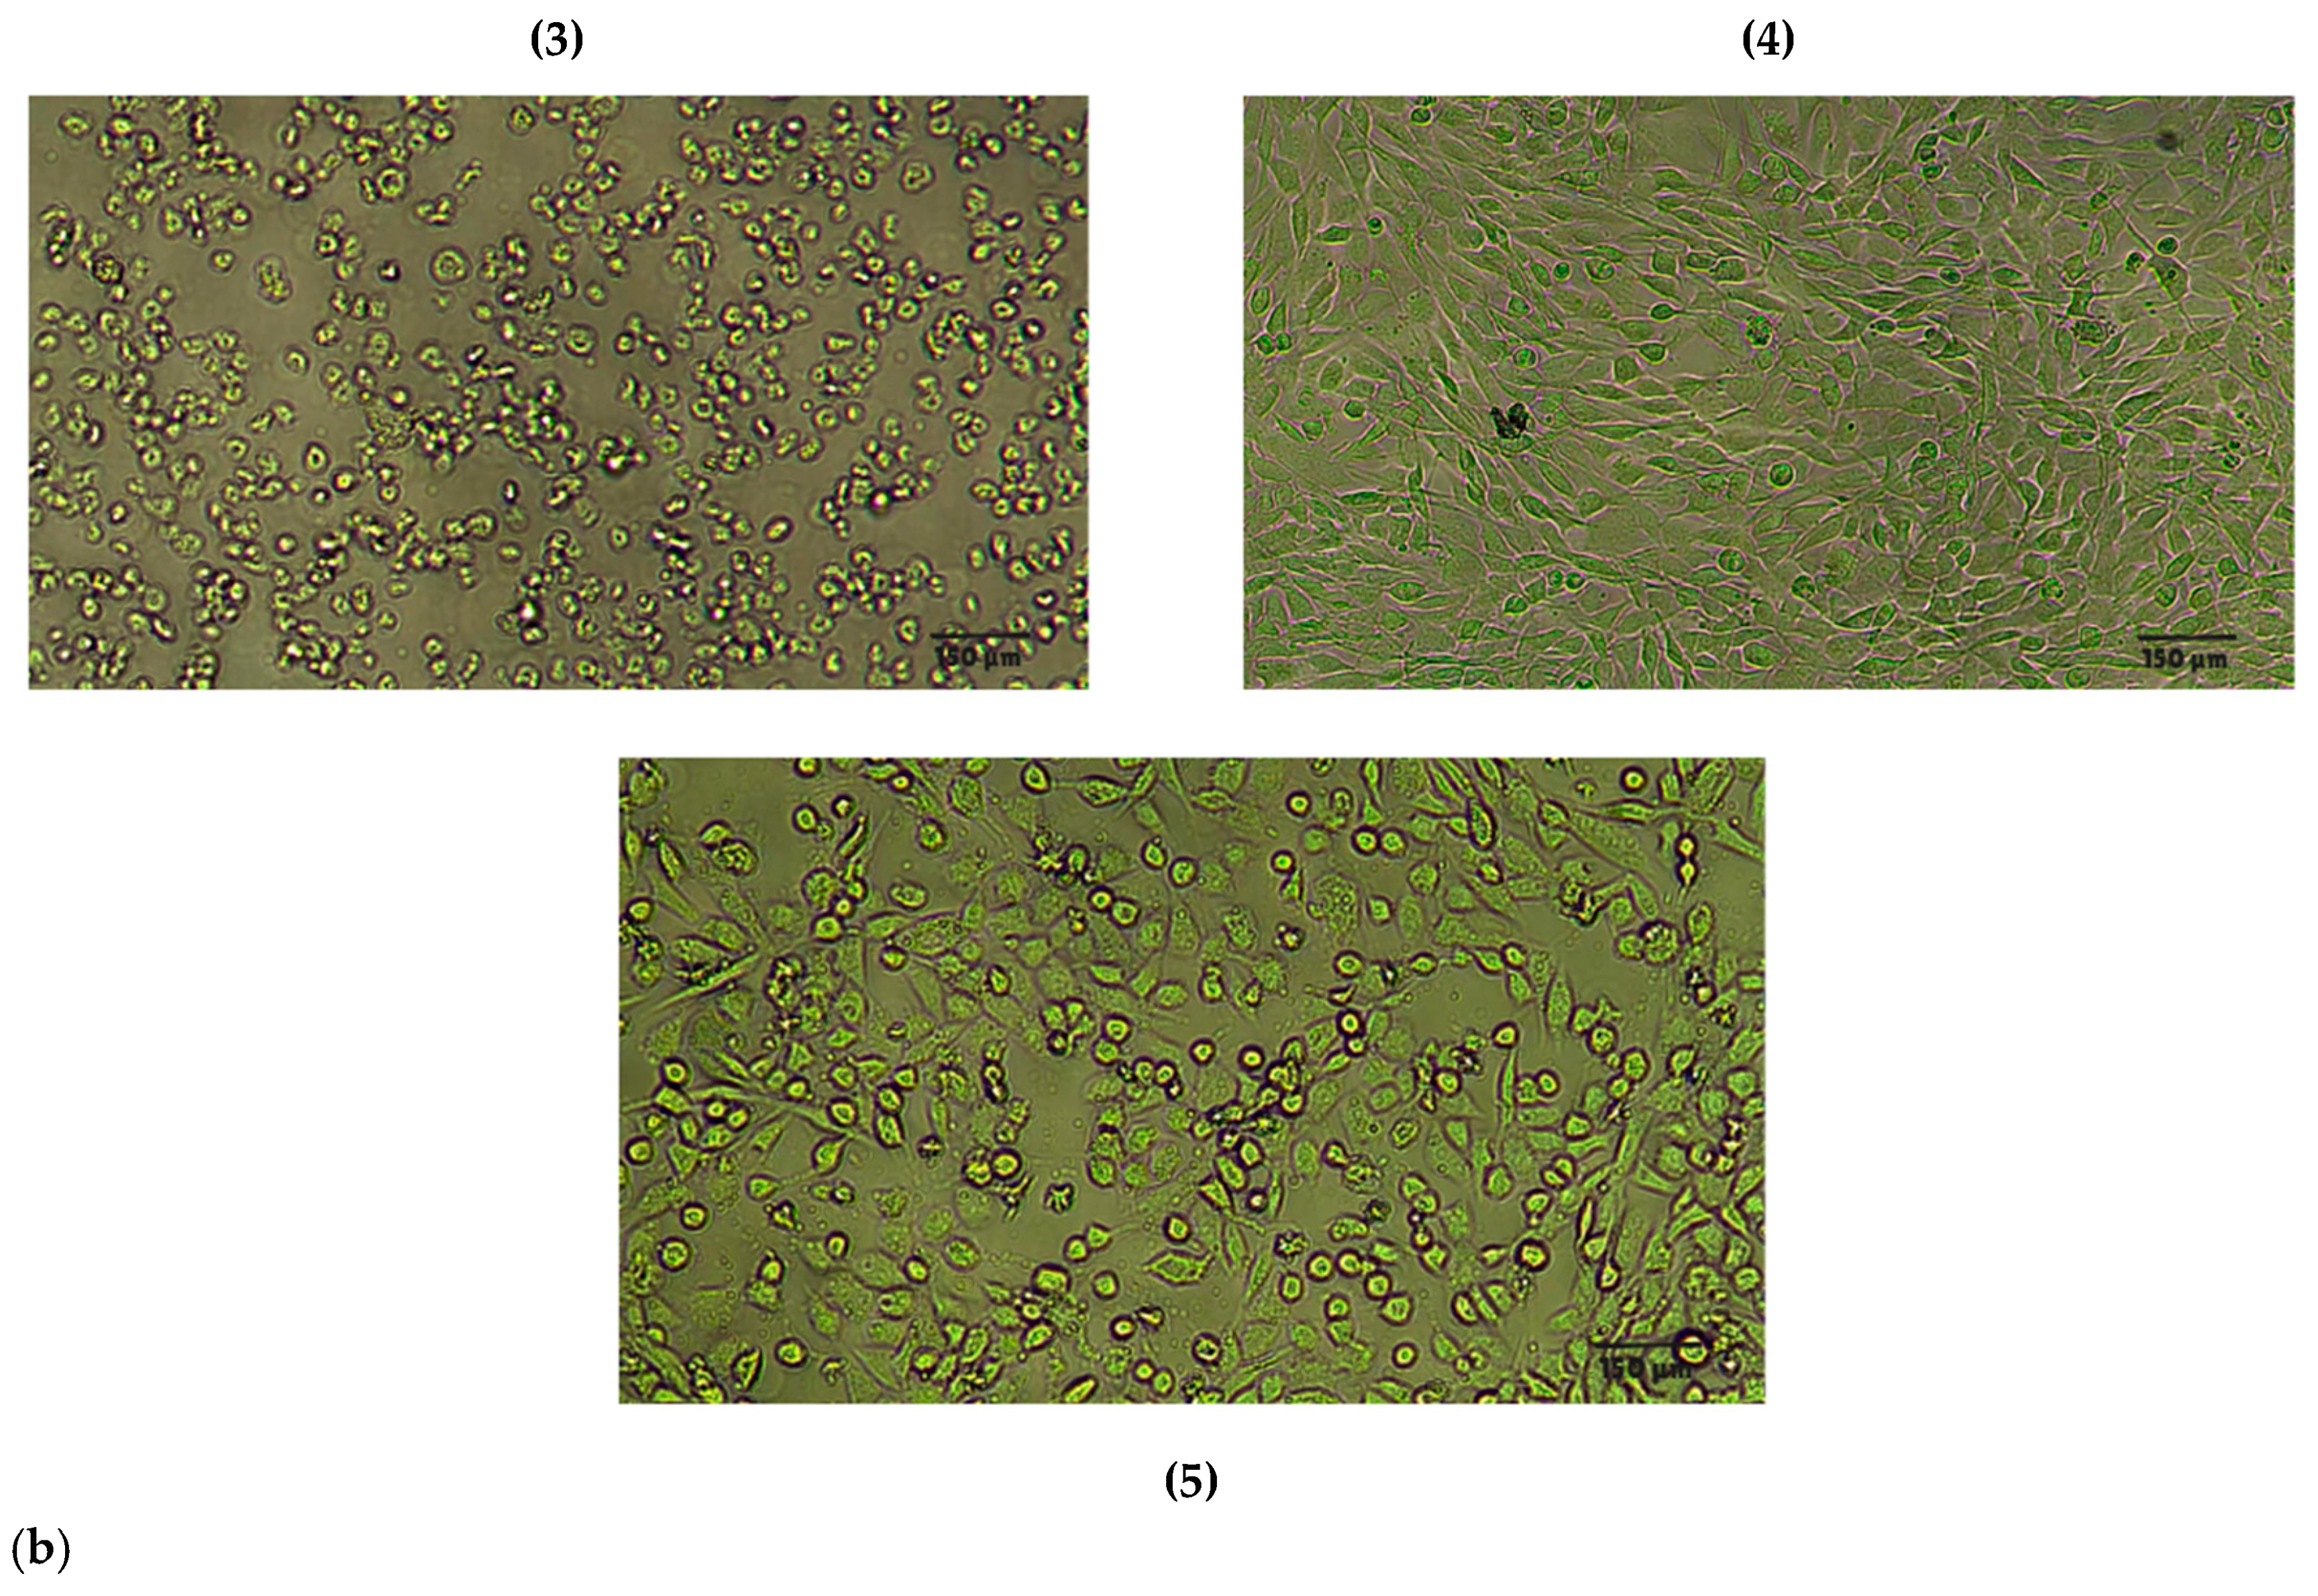
2. Results
3. Discussion
4. Materials and Methods
4.1. Compounds
4.2. Sample Preparations
4.3. Tissue Samples and Cell Lines
4.4. Immunohistochemistry
4.5. Bioinformatic Analysis and Software Used
4.5.1. Molecular Docking
4.5.2. ADMET/Pharmacokinetic Predictions and Transcriptomic Data
4.6. Cell Viability Assays
MTT Assay
4.7. Mitochondrial Potential and Immunofluorescence Assay
4.8. Statistical Analysis
4.9. Ethics Statement
5. Conclusions
Supplementary Materials
Author Contributions
Funding
Institutional Review Board Statement
Informed Consent Statement
Data Availability Statement
Acknowledgments
Conflicts of Interest
References
- Hoggarth, A.R.; Muthukumar, S.; Thomas, S.M.; Crowley, J.; Kiser, J.; Witcher, M.R. Clinical Theranostics in Recurrent Gliomas: A Review. Cancers 2024, 16, 1715. [Google Scholar] [CrossRef] [PubMed]
- Rahman, M.A.; Ali, M.M. Recent Treatment Strategies and Molecular Pathways in Resistance Mechanisms of Antiangiogenic Therapies in Glioblastoma. Cancers 2024, 16, 2975. [Google Scholar] [CrossRef] [PubMed]
- Kurdi, M.; Alkhotani, A.; Alsinani, T.; Alkhayyat, S.; Katib, Y.; Jastaniah, Z.; Sabbagh, A.J.; Butt, N.S.; Toonsi, F.A.; Alharbi, M.; et al. Effects of Radiotherapy Alone Versus Concomitant Radiotherapy with Temozolomide Chemotherapy on the Outcome of IDH-Wildtype Glioblastoma Patients. Clin. Oncol. 2025, 38, 103741. [Google Scholar] [CrossRef]
- Adhikaree, J.; Moreno-Vicente, J.; Kaur, A.P.; Jackson, A.M.; Patel, P.M. Resistance Mechanisms and Barriers to Successful Immunotherapy for Treating Glioblastoma. Cells 2020, 9, 263. [Google Scholar] [CrossRef]
- Zha, S.; Liu, H.; Li, H.; Li, H.; Wong, K.-L.; All, A.H. Functionalized Nanomaterials Capable of Crossing the Blood–Brain Barrier. ACS Nano 2024, 18, 1820–1845. [Google Scholar] [CrossRef]
- Kampers, L.F.C.; Metselaar, D.S.; Vinci, M.; Scirocchi, F.; Veldhuijzen van Zanten, S.; Eyrich, M.; Biassoni, V.; Hulleman, E.; Karremann, M.; Stücker, W.; et al. The Complexity of Malignant Glioma Treatment. Cancers 2025, 17, 879. [Google Scholar] [CrossRef] [PubMed]
- Ríos, S.A.; Oyervides, S.; Uribe, D.; Reyes, A.M.; Fanniel, V.; Vazquez, J.; Keniry, M. Emerging Therapies for Glioblastoma. Cancers 2024, 16, 1485. [Google Scholar] [CrossRef] [PubMed]
- Grochans, S.; Cybulska, A.M.; Simińska, D.; Korbecki, J.; Kojder, K.; Chlubek, D.; Baranowska-Bosiacka, I. Epidemiology of Glioblastoma Multiforme-Literature Review. Cancers 2022, 14, 2412. [Google Scholar] [CrossRef]
- Hinz, B.; Ramer, R. Cannabinoids as Anticancer Drugs: Current Status of Preclinical Research. Br. J. Cancer 2022, 127, 1–13. [Google Scholar] [CrossRef]
- Sepulveda, D.E.; Vrana, K.E.; Kellogg, J.J.; Bisanz, J.E.; Desai, D.; Graziane, N.M.; Raup-Konsavage, W.M. The Potential of Cannabichromene (CBC) as a Therapeutic Agent. J. Pharmacol. Exp. Ther. 2024, 391, 206–213. [Google Scholar] [CrossRef]
- Li, S.; Li, W.; Malhi, N.K.; Huang, J.; Li, Q.; Zhou, Z.; Wang, R.; Peng, J.; Yin, T.; Wang, H. Cannabigerol (CBG): A Comprehensive Review of Its Molecular Mechanisms and Therapeutic Potential. Molecules 2024, 29, 5471. [Google Scholar] [CrossRef]
- Lah, T.T.; Novak, M.; Pena Almidon, M.A.; Marinelli, O.; Žvar Baškovič, B.; Majc, B.; Mlinar, M.; Bošnjak, R.; Breznik, B.; Zomer, R.; et al. Cannabigerol Is a Potential Therapeutic Agent in a Novel Combined Therapy for Glioblastoma. Cells 2021, 10, 340. [Google Scholar] [CrossRef] [PubMed]
- Lah, T.T.; Majc, B.; Novak, M.; Sušnik, A.; Breznik, B.; Porčnik, A.; Bošnjak, R.; Sadikov, A.; Malavolta, M.; Halilčević, S.; et al. The Cytotoxic Effects of Cannabidiol and Cannabigerol on Glioblastoma Stem Cells May Mostly Involve GPR55 and TRPV1 Signalling. Cancers 2022, 14, 5918. [Google Scholar] [CrossRef] [PubMed]
- Turizo-Smith, A.D.; Córdoba-Hernandez, S.; Mejía-Guarnizo, L.V.; Monroy-Camacho, P.S.; Rodríguez-García, J.A. Inflammation and cancer: Friend or foe? Front. Pharmacol. 2024, 15, 1385479. [Google Scholar] [CrossRef]
- Turrini, E.; Sestili, P.; Fimognari, C. Overview of the Anticancer Potential of the “King of Spices” Piper nigrum and Its Main Constituent Piperine. Toxins 2020, 12, 747. [Google Scholar] [CrossRef]
- Bujak, J.K.; Kosmala, D.; Szopa, I.M.; Majchrzak, K.; Bednarczyk, P. Inflammation, Cancer and Immunity-Implication of TRPV1 Channel. Front. Oncol. 2019, 9, 1087. [Google Scholar] [CrossRef]
- Zadorozhna, M.; Tataranni, T.; Mangieri, D. Piperine: Role in prevention and progression of cancer. Mol. Biol. Rep. 2019, 46, 5617–5629. [Google Scholar] [CrossRef]
- Jeong, S.; Jung, S.; Park, G.S.; Shin, J.; Oh, J.W. Piperine synergistically enhances the effect of temozolomide against temozolomide-resistant human glioma cell lines. Bioengineered 2020, 11, 791–800. [Google Scholar] [CrossRef]
- Chan, H.-W.; Lin, W.-C.; Kuo, D.-Y.; Chuang, H.-Y. Beta-Caryophyllene Augments Radiotherapy Efficacy in GBM by Modulating Cell Apoptosis and DNA Damage Repair via PPARγ and NF-κB Pathways. Phytother. Res. 2024, 39, 776–788. [Google Scholar] [CrossRef]
- Dariš, B.; Tancer Verboten, M.; Knez, Ž.; Ferk, P. Cannabinoids in Cancer Treatment: Therapeutic Potential and Legislation. Bosn. J. Basic Med. Sci. 2019, 19, 14–23. [Google Scholar] [CrossRef] [PubMed]
- Lasso, P.; Rojas, L.; Arévalo, C.; Urueña, C.; Murillo, N.; Nossa, P.; Sandoval, T.; Chitiva, L.C.; Barreto, A.; Costa, G.M.; et al. Piper nigrum Extract Suppresses Tumor Growth and Enhances the Antitumor Immune Response in Murine Models of Breast Cancer and Melanoma. Cancer Immunol. Immunother. 2023, 72, 3279–3292. [Google Scholar] [CrossRef]
- Prashant, A.; Rangaswamy, C.; Yadav, A.K.; Reddy, V.; Sowmya, M.N.; Madhunapantula, S. In vitro Anticancer Activity of Ethanolic Extracts of Piper nigrum against Colorectal Carcinoma Cell Lines. Int. J. Appl. Basic Med. Res. 2017, 7, 67–72. [Google Scholar] [CrossRef] [PubMed]
- Tammina, S.K.; Mandal, B.K.; Ranjan, S.; Dasgupta, N. Cytotoxicity Study of Piper nigrum Seed-Mediated Synthesized SnO₂ Nanoparticles towards Colorectal (HCT116) and Lung Cancer (A549) Cell Lines. J. Photochem. Photobiol. B 2017, 166, 158–168. [Google Scholar] [CrossRef] [PubMed]
- Grinevicius, V.M.; Kviecinski, M.R.; Santos Mota, N.S.; Ourique, F.; Porfirio Will Castro, L.S.; Andreguetti, R.R.; Gomes Correia, J.F.; Filho, D.W.; Pich, C.T.; Pedrosa, R.C. Piper nigrum Ethanolic Extract Rich in Piperamides Causes ROS Overproduction, Oxidative Damage in DNA Leading to Cell Cycle Arrest and Apoptosis in Cancer Cells. J. Ethnopharmacol. 2016, 189, 139–147. [Google Scholar] [CrossRef]
- Formato, M.; Crescente, G.; Scognamiglio, M.; Fiorentino, A.; Pecoraro, M.T.; Piccolella, S.; Catauro, M.; Pacifico, S. (-)-Cannabidiolic Acid, a Still Overlooked Bioactive Compound: An Introductory Review and Preliminary Research. Molecules 2020, 25, 2638. [Google Scholar] [CrossRef] [PubMed]
- Kolbe, M.R.; Hohmann, T.; Hohmann, U.; Ghadban, C.; Mackie, K.; Zöller, C.; Prell, J.; Illert, J.; Strauss, C.; Dehghani, F. THC Reduces Ki67-Immunoreactive Cells Derived from Human Primary Glioblastoma in a GPR55-Dependent Manner. Cancers 2021, 13, 1064. [Google Scholar] [CrossRef]
- López-Valero, I.; Saiz-Ladera, C.; Torres, S.; Hernández-Tiedra, S.; García-Taboada, E.; Rodríguez-Fornés, F.; Barba, M.; Dávila, D.; Salvador-Tormo, N.; Guzmán, M.; et al. Targeting Glioma Initiating Cells with A combined therapy of cannabinoids and temozolomide. Biochem. Pharmacol. 2018, 157, 266–274. [Google Scholar] [CrossRef]
- Calvillo-Robledo, A.; Cervantes-Villagrana, R.D.; Morales, P.; Marichal-Cancino, B.A. The Oncogenic Lysophosphatidylinositol (LPI)/GPR55 Signaling. Life Sci. 2022, 301, 120596. [Google Scholar] [CrossRef]
- Piñeiro, R.; Maffucci, T.; Falasca, M. The Putative Cannabinoid Receptor GPR55 Defines a Novel Autocrine Loop in Cancer Cell Proliferation. Oncogene 2011, 30, 142–152. [Google Scholar] [CrossRef]
- Andradas, C.; Caffarel, M.M.; Pérez-Gómez, E.; Salazar, M.; Lorente, M.; Velasco, G.; Guzmán, M.; Sánchez, C. The Orphan G Protein-Coupled Receptor GPR55 Promotes Cancer Cell Proliferation via ERK. Oncogene 2011, 30, 245–252. [Google Scholar] [CrossRef]
- Pérez-Goméz, E.; Andradas, C.; Flores, J.M.; Quintanilla, M.; Paramio, J.M.; Guzmán, M.; Sánchez, C. The Orphan Receptor GPR55 Drives Skin Carcinogenesis and Is Upregulated in Human Squamous Cell Carcinomas. Oncogene 2013, 32, 2534–2542. [Google Scholar] [CrossRef]
- Hasenoehrl, C.; Feuersinger, D.; Sturm, E.M.; Bärnthaler, T.; Heitzer, E.; Graf, R.; Grill, M.; Pichler, M.; Beck, S.; Butcher, L.; et al. G Protein-Coupled Receptor GPR55 Promotes Colorectal Cancer and Has Opposing Effects to Cannabinoid Receptor 1. Int. J. Cancer 2018, 142, 121–132. [Google Scholar] [CrossRef]
- Wang, S.; Long, H.; Hou, L.; Feng, B.; Ma, Z.; Wu, Y.; Zeng, Y.; Cai, J.; Zhang, D.W.; Zhao, G. The mitophagy pathway and its implications in human diseases. Sig. Transduct. Target. Ther. 2023, 8, 304. [Google Scholar] [CrossRef]
- Agir, N.; Georgakopoulos-Soares, I.; Zaravinos, A. A Multi-Omics Analysis of a Mitophagy-Related Signature in Pan-Cancer. Int. J. Mol. Sci. 2025, 26, 448. [Google Scholar] [CrossRef]
- Zhu, L.; Wu, W.; Jiang, S.; Yu, S.; Yan, Y.; Wang, K.; He, J.; Ren, Y.; Wang, B. Pan-Cancer Analysis of the Mitophagy-Related Protein PINK1 as a Biomarker for the Immunological and Prognostic Role. Front. Oncol. 2020, 10, 569887. [Google Scholar] [CrossRef]
- Rugbjerg, K.; Friis, S.; Lassen, C.F.; Ritz, B.; Olsen, J.H. Malignant melanoma, breast cancer and other cancers in patients with Parkinson’s disease. Int. J. Cancer 2012, 131, 1904–1911. [Google Scholar] [CrossRef]
- Veeriah, S.; Taylor, B.S.; Meng, S.; Fang, F.; Yilmaz, E.; Vivanco, I.; Janakiraman, M.; Schultz, N.; Hanrahan, A.J.; Pao, W.; et al. Somatic mutations of the Parkinson’s disease-associated gene PARK2 in glioblastoma and other human malignancies. Nat. Genet. 2010, 42, 77–82. [Google Scholar] [CrossRef]
- Wnorowski, A.; Such, J.; Paul, R.K.; Wersto, R.P.; Indig, F.E.; Jozwiak, K.; Bernier, M.; Wainer, I.W. Concurrent activation of β2-adrenergic receptor and blockage of GPR55 disrupts pro-oncogenic signaling in glioma cells. Cell. Sign. 2017, 36, 176–188. [Google Scholar] [CrossRef]
- Akimov, M.G.; Gretskaya, N.M.; Dudina, P.V.; Sherstyanykh, G.D.; Zinchenko, G.N.; Serova, O.V.; Degtyaryova, K.O.; Deyev, I.E.; Bezuglov, V.V. The Mechanisms of GPR55 Receptor Functional Selectivity during Apoptosis and Proliferation Regulation in Cancer Cells. Int. J. Mol. Sci. 2023, 24, 5524. [Google Scholar] [CrossRef]
- Kumar, A.; Tamjar, J.; Waddell, A.D.; Woodroof, H.I.; Raimi, O.G.; Shaw, A.M.; Peggie, M.; Muqit, M.M.; van Aalten, D.M. Structure of PINK1 and mechanisms of Parkinson’s disease-associated mutations. eLife 2017, 6, e29985. [Google Scholar]
- Woodroof, H.I.; Pogson, J.H.; Begley, M.; Cantley, L.C.; Deak, M.; Campbell, D.G.; van Aalten, D.M.; Whitworth, A.J.; Alessi, D.R.; Muqit, M.M. Discovery of catalytically active orthologues of the Parkinson’s disease kinase PINK1: Analysis of substrate specificity and impact of mutations. Open Biol. 2011, 1, 110012. [Google Scholar] [CrossRef] [PubMed]
- Rasool, S.; Trempe, J.F. New insights into the structure of PINK1 and the mechanism of ubiquitin phosphorylation. Crit. Rev. Biochem. Mol. Biol. 2018, 53, 515–534. [Google Scholar] [CrossRef] [PubMed]
- Rasool, S.; Shomali, T.; Truong, L.; Croteau, N.; Veyron, S.; Bustillos, B.A.; Springer, W.; Fiesel, F.C.; Trempe, J.F. Identification and structural characterization of small molecule inhibitors of PINK1. Sci. Rep. 2024, 14, 7739. [Google Scholar] [CrossRef]
- Lingerfelt, M.A.; Zhao, P.; Sharir, H.P.; Hurst, D.P.; Reggio, P.H.; Abood, M.E. Identification of Crucial Amino Acid Residues Involved in Agonist Signaling at the GPR55 Receptor. Biochemistry 2017, 56, 473–486. [Google Scholar] [CrossRef]
- Xia, R.; Yuan, Q.; Wang, N.; Hou, L.; Abe, J.; Song, J.; Ito, Y.; Xu, H.E.; He, Y. Structural insight into GPR55 ligand recognition and G-protein coupling. Cell. Res. 2025, 35, 76–79. [Google Scholar] [CrossRef] [PubMed]
- Ceni, C.; Benko, M.J.; Mohamed, K.A.; Poli, G.; Di Stefano, M.; Tuccinardi, T.; Digiacomo, M.; Valoti, M.; Laprairie, R.B.; Macchia, M.; et al. Novel Potent and Selective Agonists of the GPR55 Receptor Based on the 3-Benzylquinolin-2(1H)-One Scaffold. Pharmaceuticals 2022, 15, 768. [Google Scholar] [CrossRef] [PubMed]
- Shore, D.M.; Reggio, P.H. The therapeutic potential of orphan GPCRs, GPR35 and GPR55. Front. Pharmacol. 2015, 15, 69. [Google Scholar] [CrossRef]
- Shukla, S.; Chen, Z.S.; Ambudkar, S.V. Tyrosine Kinase Inhibitors as Modulators of ABC Transporter-Mediated Drug Resistance. Drug Resist. Updates 2012, 15, 70–80. [Google Scholar] [CrossRef]
- Agnihotri, S.; Golbourn, B.; Huang, X.; Remke, M.; Younger, S.; Cairns, R.A.; Chalil, A.; Smith, C.A.; Krumholtz, S.L.; Mackenzie, D.; et al. PINK1 Is a Negative Regulator of Growth and the Warburg Effect in Glioblastoma. Cancer Res. 2016, 76, 4708–4719. [Google Scholar] [CrossRef] [PubMed]
- Alhouayek, M.; Masquelier, J.; Muccioli, G.G. Lysophosphatidylinositols, from Cell Membrane Constituents to GPR55 Ligands. Trends Pharmacol. Sci. 2018, 39, 586–604. [Google Scholar] [CrossRef]
- Tomko, A.M.; Whynot, E.G.; Ellis, L.D.; Dupré, D.J. Anti-Cancer Potential of Cannabinoids, Terpenes, and Flavonoids Present in Cannabis. Cancers 2020, 12, 1985. [Google Scholar] [CrossRef]
- Lal, S.; Shekher, A.; Puneet Narula, A.S.; Abrahamse, H.; Gupta, S.C. Cannabis and its constituents for cancer: History, biogenesis, chemistry and pharmacological activities. Pharmacol. Res. 2021, 163, 105302. [Google Scholar] [CrossRef] [PubMed]
- Hu, L.; Shi, J.; Shen, D.; Zhai, X.; Liang, D.; Wang, J.; Xie, C.; Xia, Z.; Cui, J.; Liu, F.; et al. Osimertinib induces paraptosis and TRIP13 confers resistance in glioblastoma cells. Cell Death Discov. 2023, 9, 333. [Google Scholar] [CrossRef]
- Herbener, V.J.; Burster, T.; Goreth, A.; Pruss, M.; von Bandemer, H.; Baisch, T.; Fitzel, R.; Siegelin, M.D.; Karpel-Massler, G.; Debatin, K.M.; et al. Considering the Experimental use of Temozolomide in Glioblastoma Research. Biomedicines 2020, 8, 151. [Google Scholar] [CrossRef]
- Lee, S.Y. Temozolomide resistance in glioblastoma multiforme. Genes Dis. 2016, 3, 198–210. [Google Scholar] [CrossRef]
- Kregielewski, K.; Fraczek, W.; Grodzik, M. Graphene Oxide Enhanced Cisplatin Cytotoxic Effect in Glioblastoma and Cervical Cancer. Molecules 2023, 28, 6253. [Google Scholar] [CrossRef] [PubMed]
- Moreno, E.; Andradas, C.; Medrano, M.; Caffarel, M.M.; Pérez-Gómez, E.; Blasco-Benito, S.; Gómez-Cañas, M.; Pazos, M.R.; Irving, A.J.; Lluís, C.; et al. Targeting CB2-GPR55 receptor heteromers modulates cancer cell signaling. J. Biol. Chem. 2014, 289, 21960–21972. [Google Scholar] [CrossRef]
- Singh, N.S.; Bernier, M.; Wainer, I.W. Selective GPR55 antagonism reduces chemoresistance in cancer cells. Pharmacol. Res. 2016, 111, 757–766. [Google Scholar] [CrossRef] [PubMed]
- Martínez-Pinilla, E.; Aguinaga, D.; Navarro, G.; Rico, A.J.; Oyarzábal, J.; Sánchez-Arias, J.A.; Lanciego, J.L.; Franco, R. Targeting CB1 and GPR55 Endocannabinoid Receptors as a Potential Neuroprotective Approach for Parkinson’s Disease. Mol. Neurobiol. 2019, 56, 5900–5910. [Google Scholar] [CrossRef]
- Burgaz, S.; García, C.; Gonzalo-Consuegra, C.; Gómez-Almería, M.; Ruiz-Pino, F.; Unciti, J.D.; Gómez-Cañas, M.; Alcalde, J.; Morales, P.; Jagerovic, N.; et al. Preclinical Investigation in Neuroprotective Effects of the GPR55 Ligand VCE-006.1 in Experimental Models of Parkinson’s Disease and Amyotrophic Lateral Sclerosis. Molecules 2021, 26, 7643. [Google Scholar] [CrossRef]
- Wang, Y.H.; Morris-Natschke, S.L.; Yang, J.; Niu, H.M.; Long, C.L.; Lee, K.H. Anticancer principles from medicinal piper (hú jiāo) plants. J. Tradit. Complement. Med. 2014, 4, 8–16. [Google Scholar] [CrossRef] [PubMed]
- Warrier, N.M.; Krishnan, R.K.; Prabhu, V.; Hariharapura, R.C.; Agarwal, P.; Kumar, P. Survivin Inhibition by Piperine Sensitizes Glioblastoma Cancer Stem Cells and Leads to Better Drug Response. Int. J. Mol. Sci. 2022, 23, 7604. [Google Scholar] [CrossRef] [PubMed]
- Leone, R.; Giussani, P.; De Palma, S.; Fania, C.; Capitanio, D.; Vasso, M.; Brioschi, L.; Riboni, L.; Viani, P.; Gelfi, C. Proteomic analysis of human glioblastoma cell lines differently resistant to a nitric oxide releasing agent. Mol. BioSyst. 2015, 11, 1612–1621. [Google Scholar] [CrossRef] [PubMed]
- Li, S.; Lei, Y.; Jia, Y.; Li, N.; Wink, M.; Ma, Y. Piperine, a piperidine alkaloid from Piper nigrum re-sensitizes P-gp, MRP1 and BCRP dependent multidrug resistant cancer cells. Phytomedicine 2011, 19, 83–87. [Google Scholar] [CrossRef] [PubMed]
- Li, H.; Krstin, S.; Wang, S.; Wink, M. Capsaicin and Piperine Can Overcome Multidrug Resistance in Cancer Cells to Doxorubicin. Molecules 2018, 23, 557. [Google Scholar] [CrossRef]
- Xi, X.; Chen, S.; Zhao, X.; Zhou, Z.; Zhu, S.; Ren, X.; Wang, X.; Wu, J.; Mu, S.; Li, X.; et al. TUBB4A Inhibits Glioma Development by Regulating ROS-PINK1/Parkin-Mitophagy Pathway. Mol. Neurobiol. 2025, 62, 3125–3142. [Google Scholar] [CrossRef] [PubMed]
- Dai, K.; Radin, D.P.; Leonardi, D. PINK1 depletion sensitizes non-small cell lung cancer to glycolytic inhibitor 3-bromopyruvate: Involvement of ROS and mitophagy. Pharmacol. Rep. PR 2019, 71, 1184–1189. [Google Scholar] [CrossRef]
- Li, J.; Xu, X.; Huang, H.; Li, L.; Chen, J.; Ding, Y.; Ping, J. Pink1 promotes cell proliferation and affects glycolysis in breast cancer. Exp. Biol. Med. 2022, 247, 985–995. [Google Scholar] [CrossRef]
- Wang, M.; Luan, S.; Fan, X.; Wang, J.; Huang, J.; Gao, X.; Han, D. The emerging multifaceted role of PINK1 in cancer biology. Cancer Sci. 2022, 113, 4037–4047. [Google Scholar] [CrossRef]
- Shen, L.; Shi, Q.; Wang, W. Double agents: Genes with both oncogenic and tumor-suppressor functions. Oncogenesis 2018, 7, 25. [Google Scholar] [CrossRef]
- Bernier, M.; Catazaro, J.; Singh, N.S.; Wnorowski, A.; Boguszewska-Czubara, A.; Jozwiak, K.; Powers, R.; Wainer, I.W. GPR55 receptor antagonist decreases glycolytic activity in PANC-1 pancreatic cancer cell line and tumor xenografts. Int. J. Cancer 2017, 141, 2131–2142. [Google Scholar] [CrossRef] [PubMed]
- Tudurí, E.; Imbernon, M.; Hernández-Bautista, R.J.; Tojo, M.; Fernø, J.; Diéguez, C.; Nogueiras, R. GPR55: A new promising target for metabolism? J. Mol. Endocrinol. 2017, 58, R191–R202. [Google Scholar] [CrossRef] [PubMed]
- Ham, S.J.; Yoo, H.; Woo, D.; Lee, D.H.; Park, K.S.; Chung, J. PINK1 and Parkin regulate IP3R-mediated ER calcium release. Nat. Commun. 2023, 14, 5202. [Google Scholar] [CrossRef] [PubMed] [PubMed Central]
- Kang, R.; Xie, Y.; Zeh, H.J.; Klionsky, D.J.; Tang, D. Mitochondrial quality control mediated by PINK1 and PRKN: Links to iron metabolism and tumor immunity. Autophagy 2019, 15, 172–173. [Google Scholar] [CrossRef] [PubMed] [PubMed Central]
- Triplett, J.C.; Zhang, Z.; Sultana, R.; Cai, J.; Klein, J.B.; Büeler, H.; Butterfield, D.A. Quantitative expression proteomics and phosphoproteomics profile of brain from PINK1 knockout mice: Insights into mechanisms of familial Parkinson’s disease. J. Neurochem. 2015, 133, 750–765. [Google Scholar] [CrossRef] [PubMed]
- Dai, X.; Liu, J.; Wei, W. Mitochondrial PD-L1 modulates cancer immunotherapy. Cell Res. 2023, 33, 335–336. [Google Scholar] [CrossRef] [PubMed] [PubMed Central]
- Datta, S.; Luthra, R.; Bharadvaja, N. Medicinal Plants for Glioblastoma Treatment. Anti-Cancer Agents Med. Chem. 2022, 22, 2367–2384. [Google Scholar] [CrossRef]
- Giammona, A.; Commisso, M.; Bonanomi, M.; Remedia, S.; Avesani, L.; Porro, D.; Gaglio, D.; Bertoli, G.; Lo Dico, A. A Novel Strategy for Glioblastoma Treatment by Natural Bioactive Molecules Showed a Highly Effective Anti-Cancer Potential. Nutrients 2024, 16, 2389. [Google Scholar] [CrossRef]
- Cai, J.; Zhu, P.; Zhang, C.; Li, Q.; Wang, Z.; Li, G.; Wang, G.; Yang, P.; Li, J.; Han, B.; et al. Detection of ATRX and IDH1-R132H immunohistochemistry in the progression of 211 paired gliomas. Oncotarget 2016, 7, 16384–16395. [Google Scholar] [CrossRef] [PubMed]
- Hanwell, M.D.; Curtis, D.E.; Lonie, D.C.; Vandermeersch, T.; Zurek, E.; Hutchison, G.R. Avogadro: An advanced semantic chemical editor, visualization, and analysis platform. J. Cheminform. 2012, 4, 17. [Google Scholar] [CrossRef]
- Halgren, T.A. Merck molecular force field. I. Basis, form, scope, parameterization, and performance of MMFF94. J. Comput. Chem. 1996, 17, 490–519. [Google Scholar] [CrossRef]
- Morris, G.M.; Huey, R.; Lindstrom, W.; Sanner, M.F.; Belew, R.K.; Goodsell, D.S.; Olson, A.J. AutoDock4 and AutoDockTools4: Automated docking with selective receptor flexibility. J. Comput. Chem. 2009, 30, 2785–2791. [Google Scholar] [CrossRef]
- Trott, O.; Olson, A.J. AutoDock Vina: Improving the speed and accuracy of docking with a new scoring function, efficient optimization, and multithreading. J. Comput. Chem. 2010, 31, 455–461. [Google Scholar] [CrossRef]
- Palacio-Rodríguez, K.; Lans, I.; Cavasotto, C.N.; Cossio, P. Exponential consensus ranking improves the outcome in docking and receptor ensemble docking. Sci. Rep. 2019, 9, 5142. [Google Scholar] [CrossRef]
- Quiroga, R.; Villarreal, M.A. Vinardo: A Scoring Function Based on Autodock Vina Improves Scoring, Docking, and Virtual Screening. PLoS ONE 2016, 11, e0155183. [Google Scholar] [CrossRef]
- Daina, A.; Michielin, O.; Zoete, V. SwissADME: A free web tool to evaluate pharmacokinetics, drug-likeness and medicinal chemistry friendliness of small molecules. Sci. Rep. 2017, 7, 42717. [Google Scholar] [CrossRef]
- Daina, A.; Zoete, V. A BOILED-Egg to predict gastrointestinal absorption and brain penetration of small molecules. ChemMedChem 2016, 11, 1117–1121. [Google Scholar] [CrossRef]
- Pires, D.E.V.; Blundell, T.L.; Ascher, D.B. pkCSM: Predicting small-molecule pharmacokinetic and toxicity properties using graph-based signatures. J. Med. Chem. 2015, 58, 4066–4072. [Google Scholar] [CrossRef]
- Yang, H.; Lou, C.; Sun, L.; Li, J.; Cai, Y.; Wang, Z. admetSAR 2.0: Web-service for prediction and optimization of chemical ADMET properties. Bioinformatics 2019, 35, 1067–1069. [Google Scholar] [CrossRef]
- Uhlen, M.; Zhang, C.; Lee, S.; Sjöstedt, E.; Fagerberg, L.; Bidkhori, G.; Benfeitas, R.; Arif, M.; Liu, Z.; Edfors, F.; et al. A pathology atlas of the human cancer transcriptome. Science 2017, 357, eaan2507. [Google Scholar] [CrossRef]
- Uhlén, M.; Fagerberg, L.; Hallström, B.M.; Lindskog, C.; Oksvold, P.; Mardinoglu, A.; Sivertsson, Å.; Kampf, C.; Sjöstedt, E.; Asplund, A.; et al. Tissue-based map of the human proteome. Science 2015, 347, 1260419. [Google Scholar] [CrossRef] [PubMed]
- Chandrashekar, D.S.; Karthikeyan, S.K.; Korla, P.K.; Patel, H.; Shovon, A.R.; Athar, M.; Netto, G.J.; Qin, Z.S.; Kumar, S.; Manne, U.; et al. UALCAN: An update to the integrated cancer data analysis platform. Neoplasia 2022, 25, 18–27. [Google Scholar] [CrossRef] [PubMed]
- Chandrashekar, D.S.; Bashel, B.; Balasubramanya, S.A.H.; Creighton, C.J.; Rodriguez, I.P.; Chakravarthi, B.V.S.K.; Varambally, S. UALCAN: A portal for facilitating tumor subgroup gene expression and survival analyses. Neoplasia 2017, 19, 649–658. [Google Scholar] [CrossRef] [PubMed]
- Bowman, R.L.; Wang, Q.; Carro, A.; Verhaak, R.G.; Squatrito, M. GlioVis data portal for visualization and analysis of brain tumor expression datasets. Neuro-Oncology 2017, 19, 139–141. [Google Scholar] [CrossRef]
- Tang, Z.; Li, C.; Kang, B.; Gao, G.; Li, C.; Zhang, Z. GEPIA: A web server for cancer and normal gene expression profiling and interactive analyses. Nucleic Acids Res. 2017, 45, W98–W102. [Google Scholar] [CrossRef]
- Sivandzade, F.; Bhalerao, A.; Cucullo, L. Analysis of the Mitochondrial Membrane Potential Using the Cationic JC-1 Dye as a Sensitive Fluorescent Probe. Bio-Protocol 2019, 9, e3128. [Google Scholar] [CrossRef] [PubMed] [PubMed Central]
- Zorova, L.D.; Popkov, V.A.; Plotnikov, E.Y.; Silachev, D.N.; Pevzner, I.B.; Jankauskas, S.S.; Babenko, V.A.; Zorov, S.D.; Balakireva, A.V.; Juhaszova, M.; et al. Mitochondrial membrane potential. Anal. Biochem. 2018, 552, 50–59. [Google Scholar] [CrossRef] [PubMed] [PubMed Central]
- Im, K.; Mareninov, S.; Diaz, M.F.P.; Yong, W.H. An Introduction to Performing Immunofluorescence Staining. Methods Mol. Biol. 2019, 1897, 299–311. [Google Scholar] [CrossRef] [PubMed] [PubMed Central]
- Zheng, F.; Zhong, J.; Chen, K.; Shi, Y.; Wang, F.; Wang, S.; Tang, S.; Yuan, X.; Shen, Z.; Tang, S.; et al. PINK1-PTEN axis promotes metastasis and chemoresistance in ovarian cancer via non-canonical pathway. J. Exp. Clin. Cancer Res. 2023, 42, 295. [Google Scholar] [CrossRef] [PubMed] [PubMed Central]
- Wei, Y.; Xiao, G.; Xu, H.; Sun, X.; Shi, Y.; Wang, F.; Kang, J.; Peng, J.; Zhou, F. Radiation resistance of cancer cells caused by mitochondrial dysfunction depends on SIRT3-mediated mitophagy. FEBS J. 2023, 290, 3629–3645. [Google Scholar] [CrossRef] [PubMed]
- Bar-Sela, G.; Cohen, I.; Campisi-Pinto, S.; Lewitus, G.M.; Oz-Ari, L.; Jehassi, A.; Peer, A.; Turgeman, I.; Vernicova, O.; Berman, P.; et al. Cannabis Consumption Used by Cancer Patients during Immunotherapy Correlates with Poor Clinical Outcome. Cancers 2020, 12, 2447. [Google Scholar] [CrossRef] [PubMed]


| Compound | Rank Vina | Vina Affinity kcal/mol | Rank Vinardo | Vinardo Affinity kcal/mol | Rank Autodock | Autodock Affinity kcal/mol | ECR |
|---|---|---|---|---|---|---|---|
| Osimertinib (OSI) | 1 | −9.30 | 3 | −9.00 | 2 | −7.49 | 0.53 |
| Piperine (P) | 3 | −8.00 | 6 | −7.80 | 1 | −9.75 | 0.41 |
| Tetrahydrocannabinol (THC) | 2 | −8.70 | 7 | −7.70 | 3 | −7.35 | 0.33 |
| Cannabigerol (CBG) | 8 | −7.00 | 1 | −9.20 | 7 | −6.86 | 0.29 |
| Cannabidiolic acid (CBDA) | 6 | −7.40 | 2 | −9.10 | 9 | −6.37 | 0.23 |
| Cannabichromene (CBC) | 5 | −7.50 | 4 | −8.40 | 5 | −7.04 | 0.21 |
| Cannabidiol (CBD) | 4 | −7.60 | 5 | −8.10 | 8 | −6.62 | 0.17 |
| β-Caryophyllene (BCP) | 7 | −7.20 | 8 | −5.50 | 4 | −7.14 | 0.14 |
| Compound | Rank Vina | Vina Affinity kcal/mol | Rank Vinardo | Vinardo Affinity kcal/mol | Rank Autodock | Autodock Affinity kcal/mol | ECR |
|---|---|---|---|---|---|---|---|
| Cannabichromene (CBC) | 1 | −9.20 | 6 | −7.30 | 2 | −9.40 | 0.46 |
| Osimertinib (OSI) | 6 | −7.90 | 3 | −8.60 | 1 | −9.46 | 0.41 |
| Piperine (P) | 2 | −8.50 | 5 | −7.80 | 3 | −8.36 | 0.36 |
| Cannabigerol (CBG) | 3 | −8.30 | 2 | −8.80 | 5 | −7.81 | 0.36 |
| Cannabidiolic acid (CBDA) | 7 | −7.70 | 1 | −9.50 | 7 | −7.73 | 0.30 |
| Tetrahydrocannabinol (THC) | 4 | −8.20 | 7 | −7.10 | 4 | −7.96 | 0.21 |
| Cannabidiol (CBD) | 5 | −8.10 | 4 | −8.50 | 6 | −7.77 | 0.20 |
| β-Caryophyllene (BCP) | 8 | −7.50 | 9 | −5.80 | 8 | −7.26 | 0.06 |
| Compounds Analyzed | |||||||||
|---|---|---|---|---|---|---|---|---|---|
| Toxicity properties | CBC | CBG | CBD | CBDA | P | BCP | THC | OSI | TMZ |
| AMES toxicity | No | No | No | No | No | No | No | No | Yes |
| hERG I inhibitor | No | No | No | No | No | No | No | No | No |
| Carcinogenicity | No | No | No | No | No | No | No | No | Yes |
| Hepatotoxicity | No | No | No | No | Yes | No | No | Yes | Yes |
| Skin sensitization | No | Yes | No | No | No | Yes | No | No | No |
| Compounds Analyzed | |||||||
|---|---|---|---|---|---|---|---|
| Cell Line | CBC | CBG | CBD | CBDA | PiperOH | PiperEO | P |
| U87MG | 470 ng/100 μL | 470 ng/100 μL | 470 ng/100 μL | 938 ng/100 μL | 1250 ng/100 μL | — | — |
| 4.7 ng/μL | 4.7 ng/μL | 4.7 ng/μL | 9.3 ng/μL | 12.5 ng/μL | — | — | |
| — | 14.8 µM | 14.9 µM | — | — | — | — | |
| T98G | 312 ng/100 μL | 156 ng/100 μL | 156 ng/100 μL | — | 625 ng/100 μL | — | — |
| 3.12 ng/μL | 1.56 ng/μL | 1.56 ng/μL | — | 6.25 ng/μL | — | — | |
| — | 4.93 μM | 4.96 μM | — | — | — | — | |
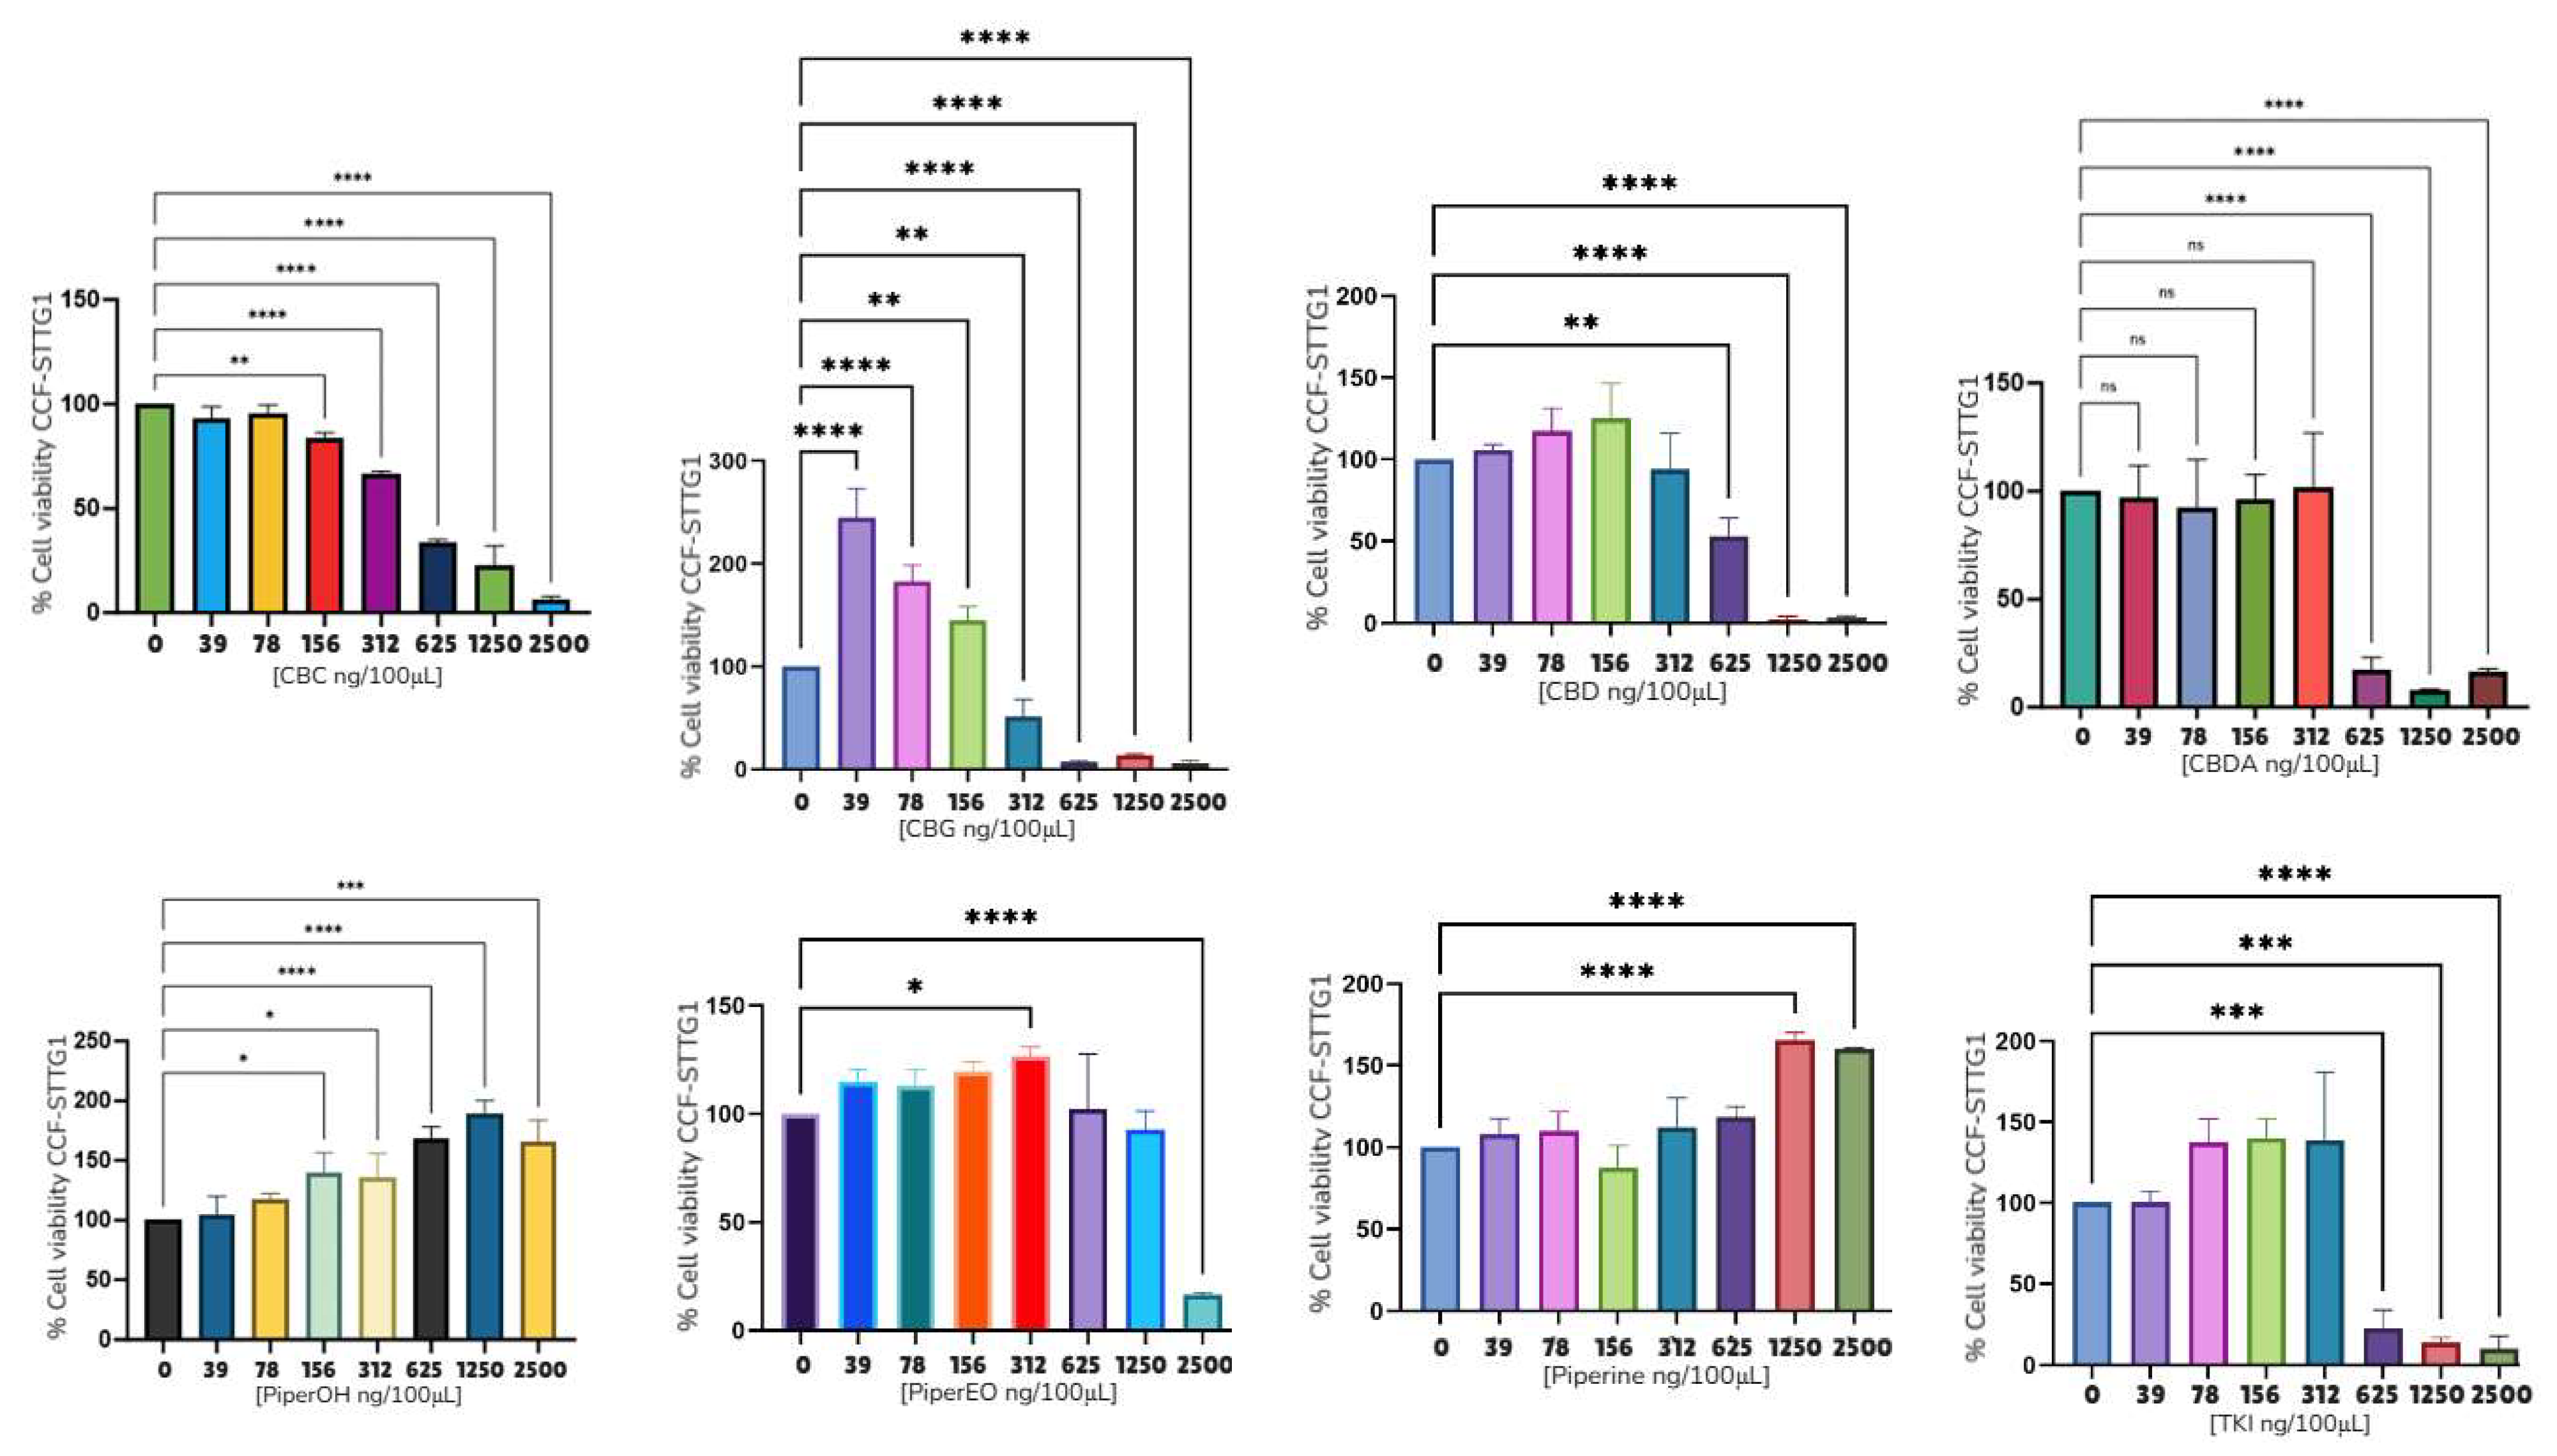
| CCF-STGG1 | 312 ng/100 μL | 312 ng/100 μL | 625 ng/100 μL | 470 ng/100 μL | NC* | 2500 ng/100 μL | NC* |
| 3.12 ng/μL | 3.12 ng/μL | 6.25 ng/μL | 4.70 ng/μL | NC* | 25 ng/μL | NC* | |
| — | 9.91 μM | 19.87 μM | — | NC* | —- | NC* | |
| Mean ± S.E.M. Astrocytoma cell lines | — | 9.88 ± 2.8 μM | 13.24 ± 4.3 μM | — | — | —- | — |
| SH-SY5Y | 625 ng/100 μL | 312 ng/100 μL | 940 ng/100 μL | 312 ng/100 μL | 1000 ng/100 μL | 940 ng/100 μL | — |
| 6.25 ng/μL | 3.12 ng/μL | 9.4 ng/μL | 3.12 ng/μL | 10 ng/μL | 9.4 ng/μL | — | |
| — | 9.91 μM | 29.9 μM | — | — | — | — | |
| MO3.13 | 156 ng/100 μL | 312 ng/100 μL | 625 ng/100 μL | 312 ng/100 μL | 2500 ng/100 μL | — | — |
| 3.12 ng/μL | 3.12 ng/μL | 6.25 ng/μL | 3.12 ng/μL | 25 ng/μL | — | — | |
| — | 9.91 μM | 19.87 μM | — | — | — | — | |
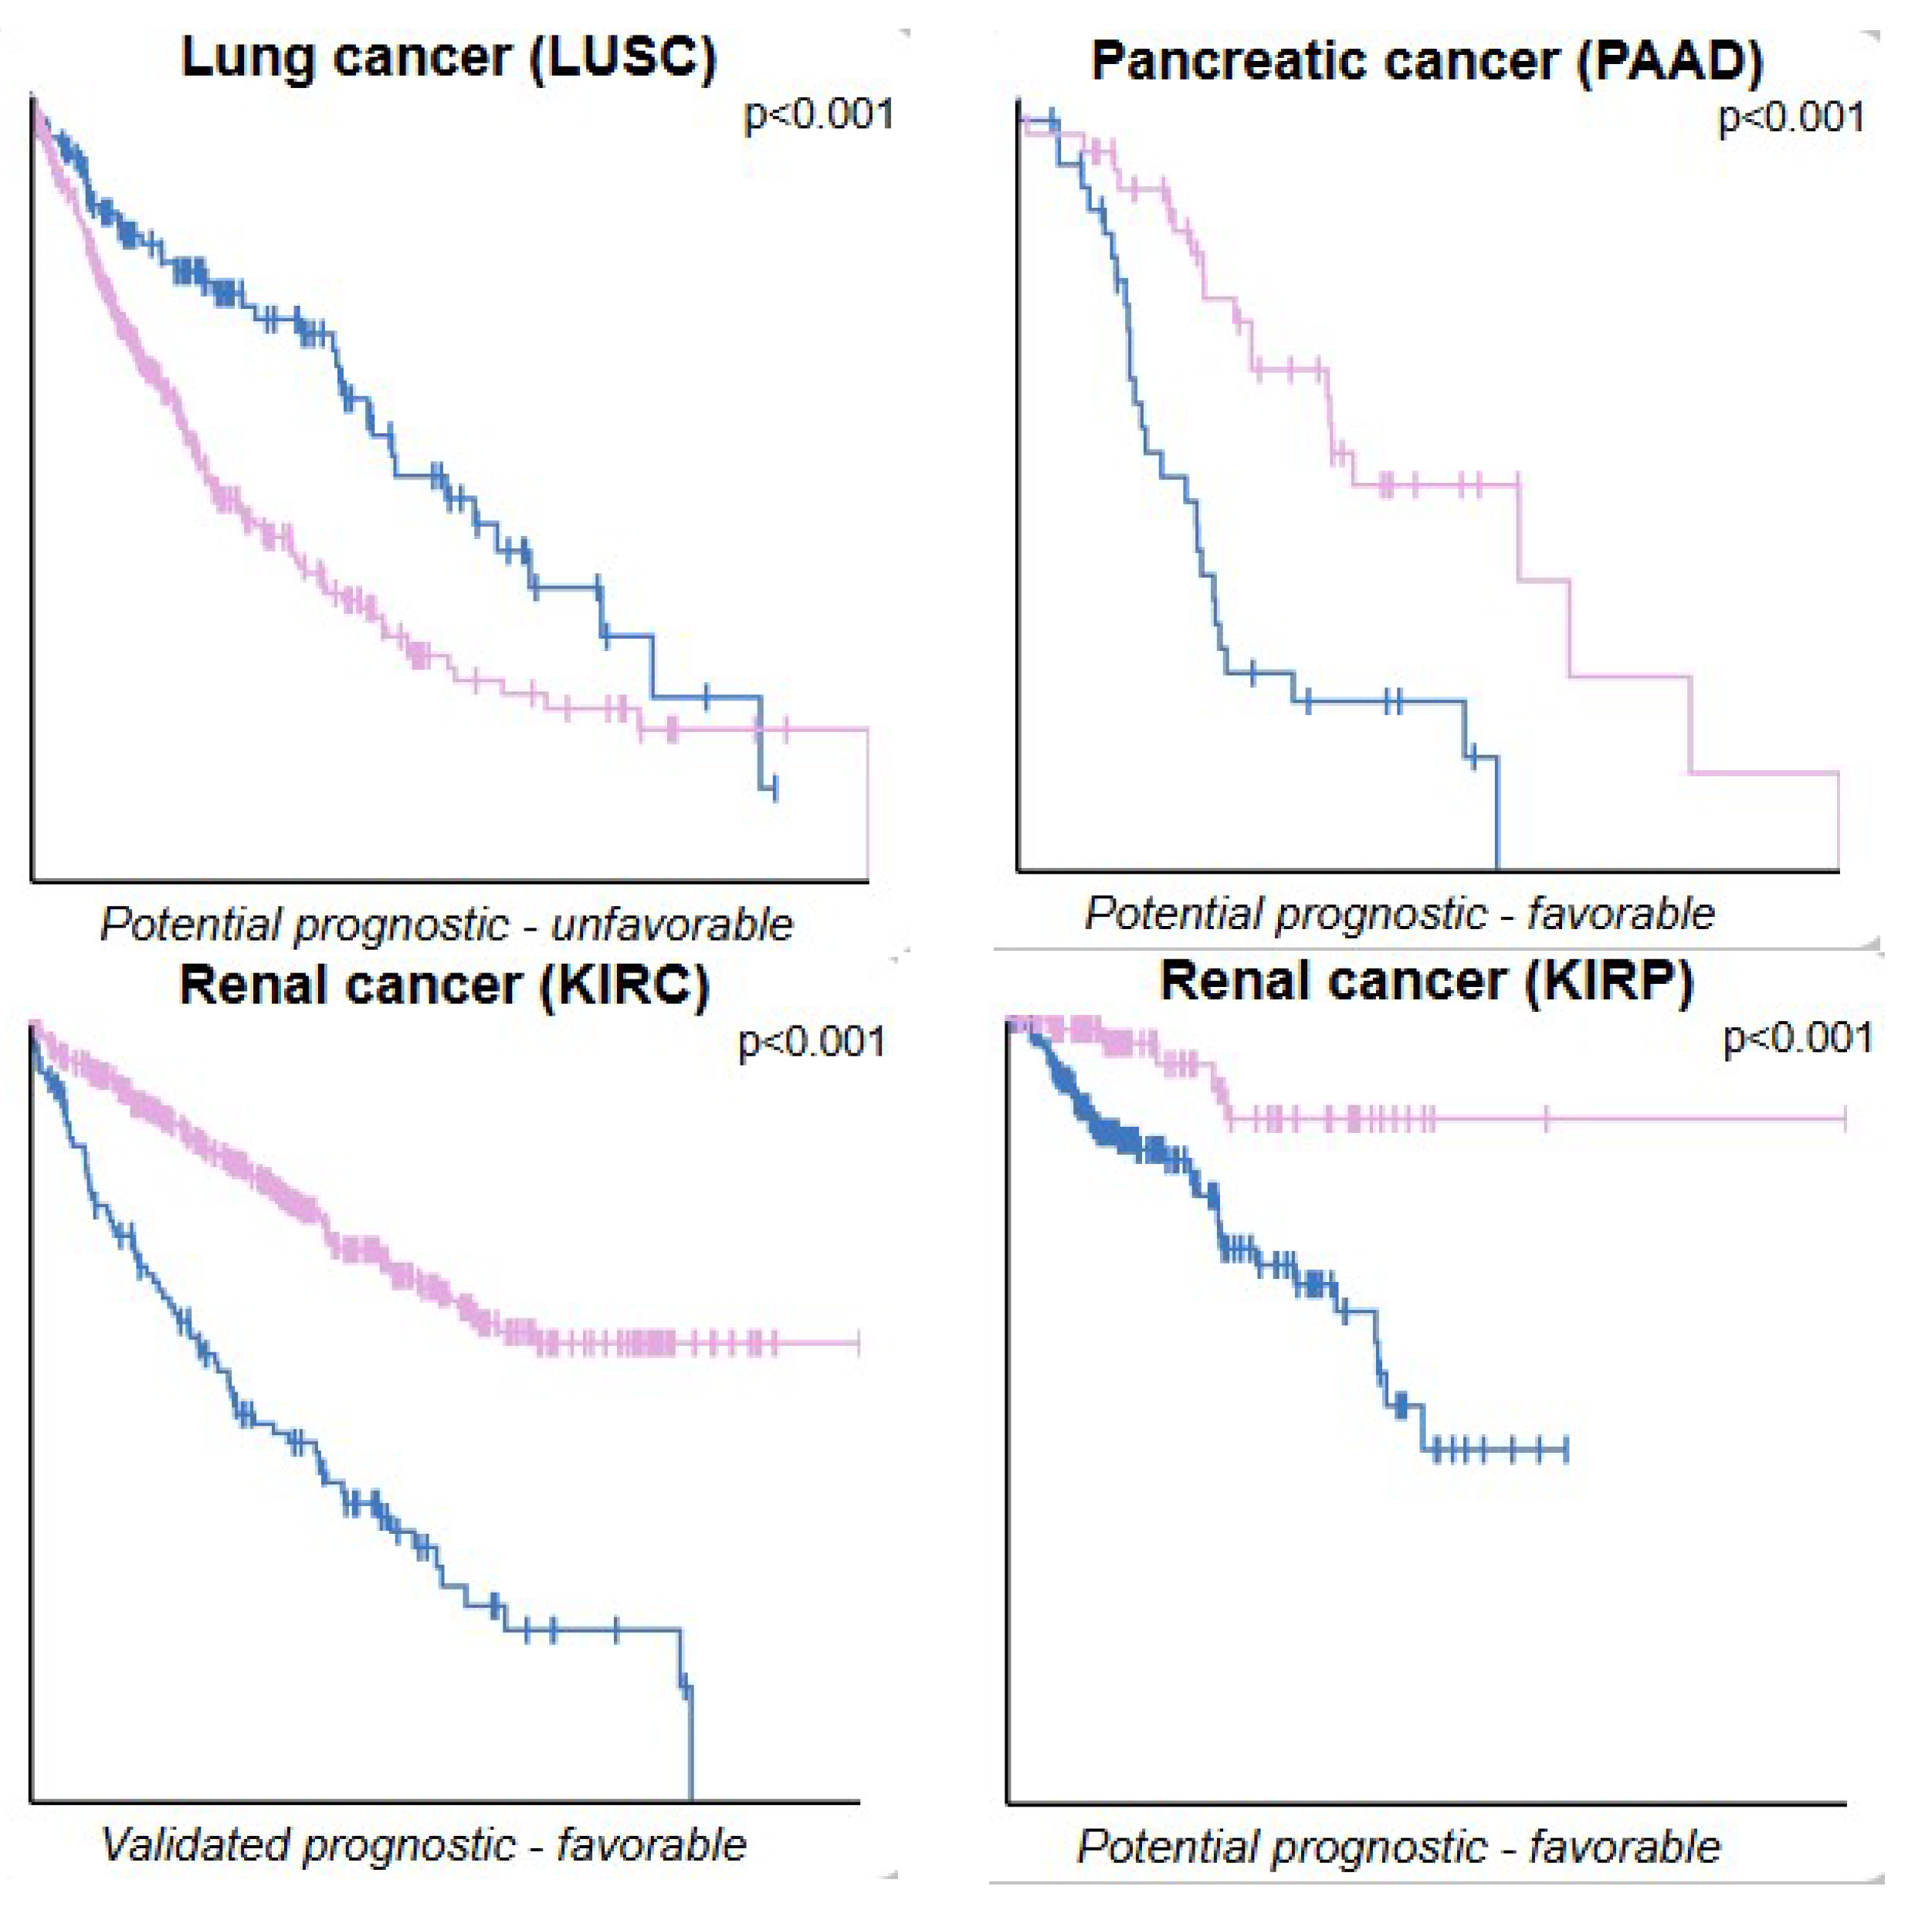
| Type of Cancer | n Low-Expression mRNA (Blue) | n High-Expression mRNA (Lilac) | p Score | Median Follow-Up Time (Years) | 5-Year Survival Low | 5-Year Survival High |
|---|---|---|---|---|---|---|
| Lung squamous cell carcinoma | 137 | 352 | 0.00027 | 1.81 | 70% | 39% |
| Pancreatic Adenocarcinoma | 36 | 44 | 0.00014 | 1.15 | 0% | 12% |
| Kidney Renal Clear Cell Carcinoma | 114 | 407 | 3.7 × 10⁻¹⁴ | 3.29 | 38% | 71% |
| Kidney Renal Papillary Cell Carcinoma | 182 | 100 | 0.001 | 2.11 | 69% | 87% |
Disclaimer/Publisher’s Note: The statements, opinions and data contained in all publications are solely those of the individual author(s) and contributor(s) and not of MDPI and/or the editor(s). MDPI and/or the editor(s) disclaim responsibility for any injury to people or property resulting from any ideas, methods, instructions or products referred to in the content. |
© 2025 by the authors. Licensee MDPI, Basel, Switzerland. This article is an open access article distributed under the terms and conditions of the Creative Commons Attribution (CC BY) license (https://creativecommons.org/licenses/by/4.0/).
Share and Cite
Turizo Smith, A.D.; Montoya Moreno, N.; Rodríguez-García, J.A.; Marín-Loaiza, J.C.; Arboleda Bustos, G. Evaluating the Antitumor Potential of Cannabichromene, Cannabigerol, and Related Compounds from Cannabis sativa and Piper nigrum Against Malignant Glioma: An In Silico to In Vitro Approach. Int. J. Mol. Sci. 2025, 26, 5688. https://doi.org/10.3390/ijms26125688
Turizo Smith AD, Montoya Moreno N, Rodríguez-García JA, Marín-Loaiza JC, Arboleda Bustos G. Evaluating the Antitumor Potential of Cannabichromene, Cannabigerol, and Related Compounds from Cannabis sativa and Piper nigrum Against Malignant Glioma: An In Silico to In Vitro Approach. International Journal of Molecular Sciences. 2025; 26(12):5688. https://doi.org/10.3390/ijms26125688
Chicago/Turabian StyleTurizo Smith, Andrés David, Nicolás Montoya Moreno, Josefa Antonia Rodríguez-García, Juan Camilo Marín-Loaiza, and Gonzalo Arboleda Bustos. 2025. "Evaluating the Antitumor Potential of Cannabichromene, Cannabigerol, and Related Compounds from Cannabis sativa and Piper nigrum Against Malignant Glioma: An In Silico to In Vitro Approach" International Journal of Molecular Sciences 26, no. 12: 5688. https://doi.org/10.3390/ijms26125688
APA StyleTurizo Smith, A. D., Montoya Moreno, N., Rodríguez-García, J. A., Marín-Loaiza, J. C., & Arboleda Bustos, G. (2025). Evaluating the Antitumor Potential of Cannabichromene, Cannabigerol, and Related Compounds from Cannabis sativa and Piper nigrum Against Malignant Glioma: An In Silico to In Vitro Approach. International Journal of Molecular Sciences, 26(12), 5688. https://doi.org/10.3390/ijms26125688