
XGB-BIF: An XGBoost-Driven Biomarker Identification Framework for Detecting Cancer Using Human Genomic Data


Abstract

1. Introduction
2. Results
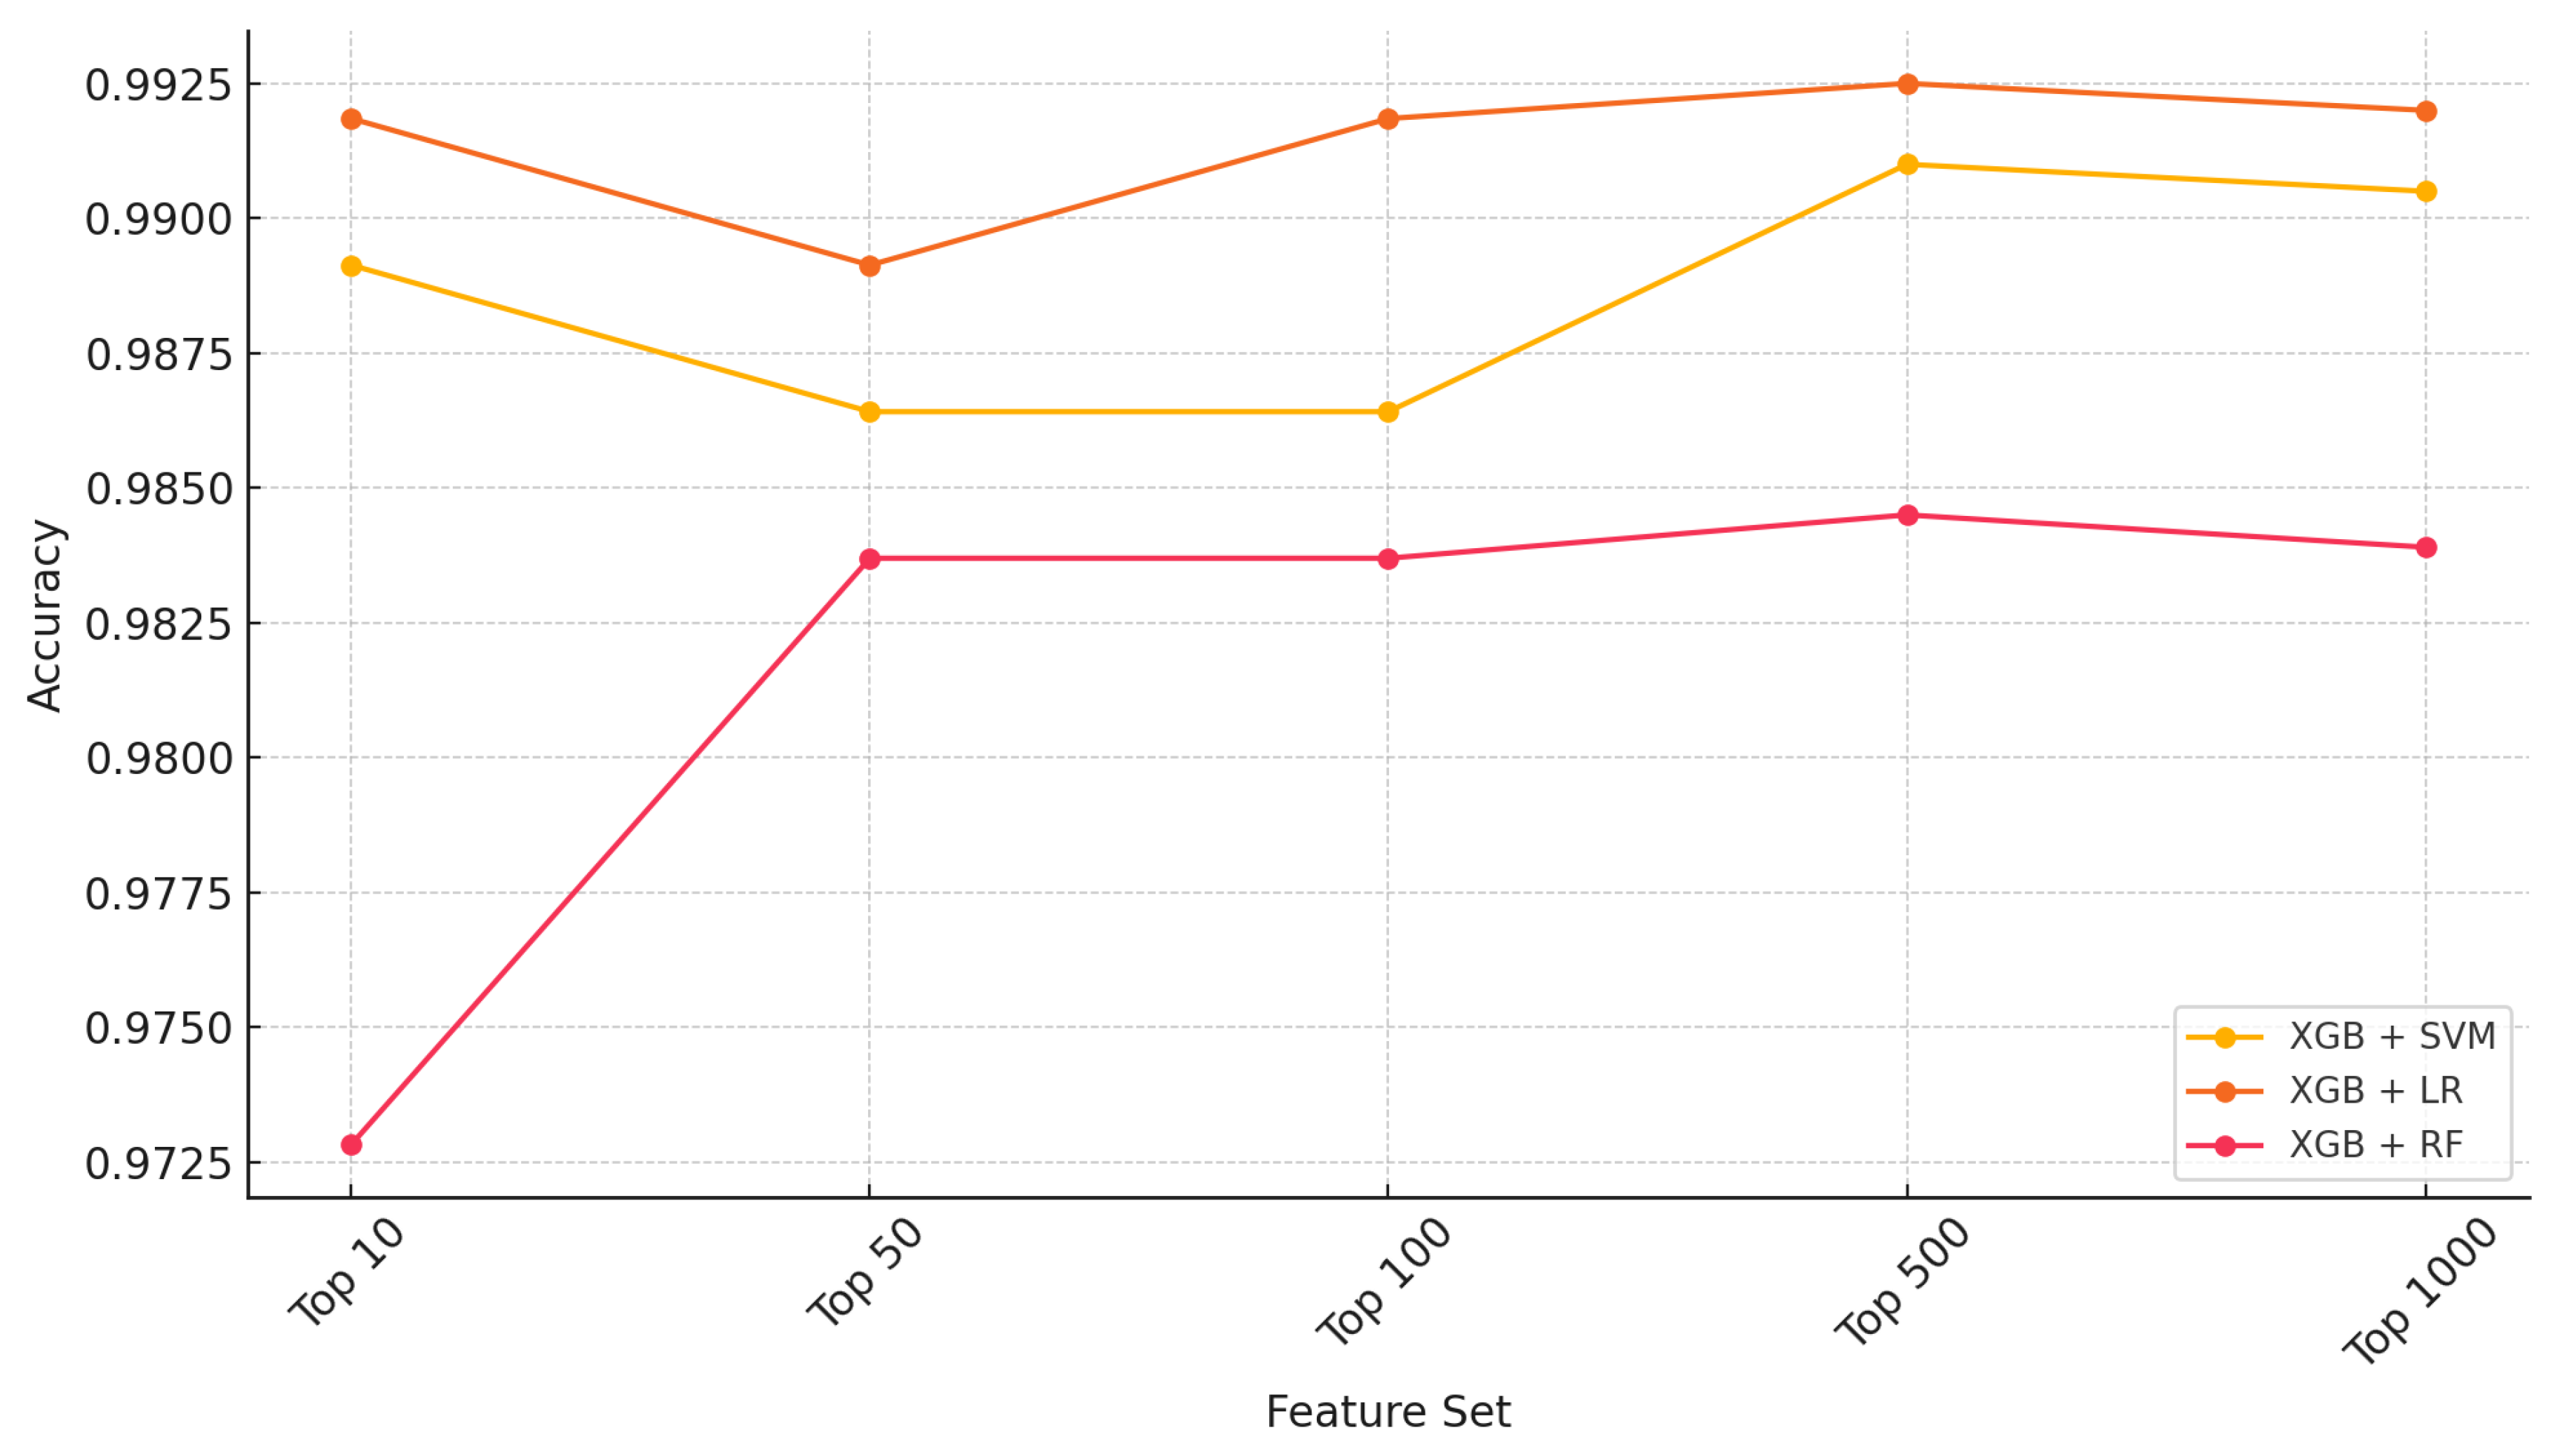
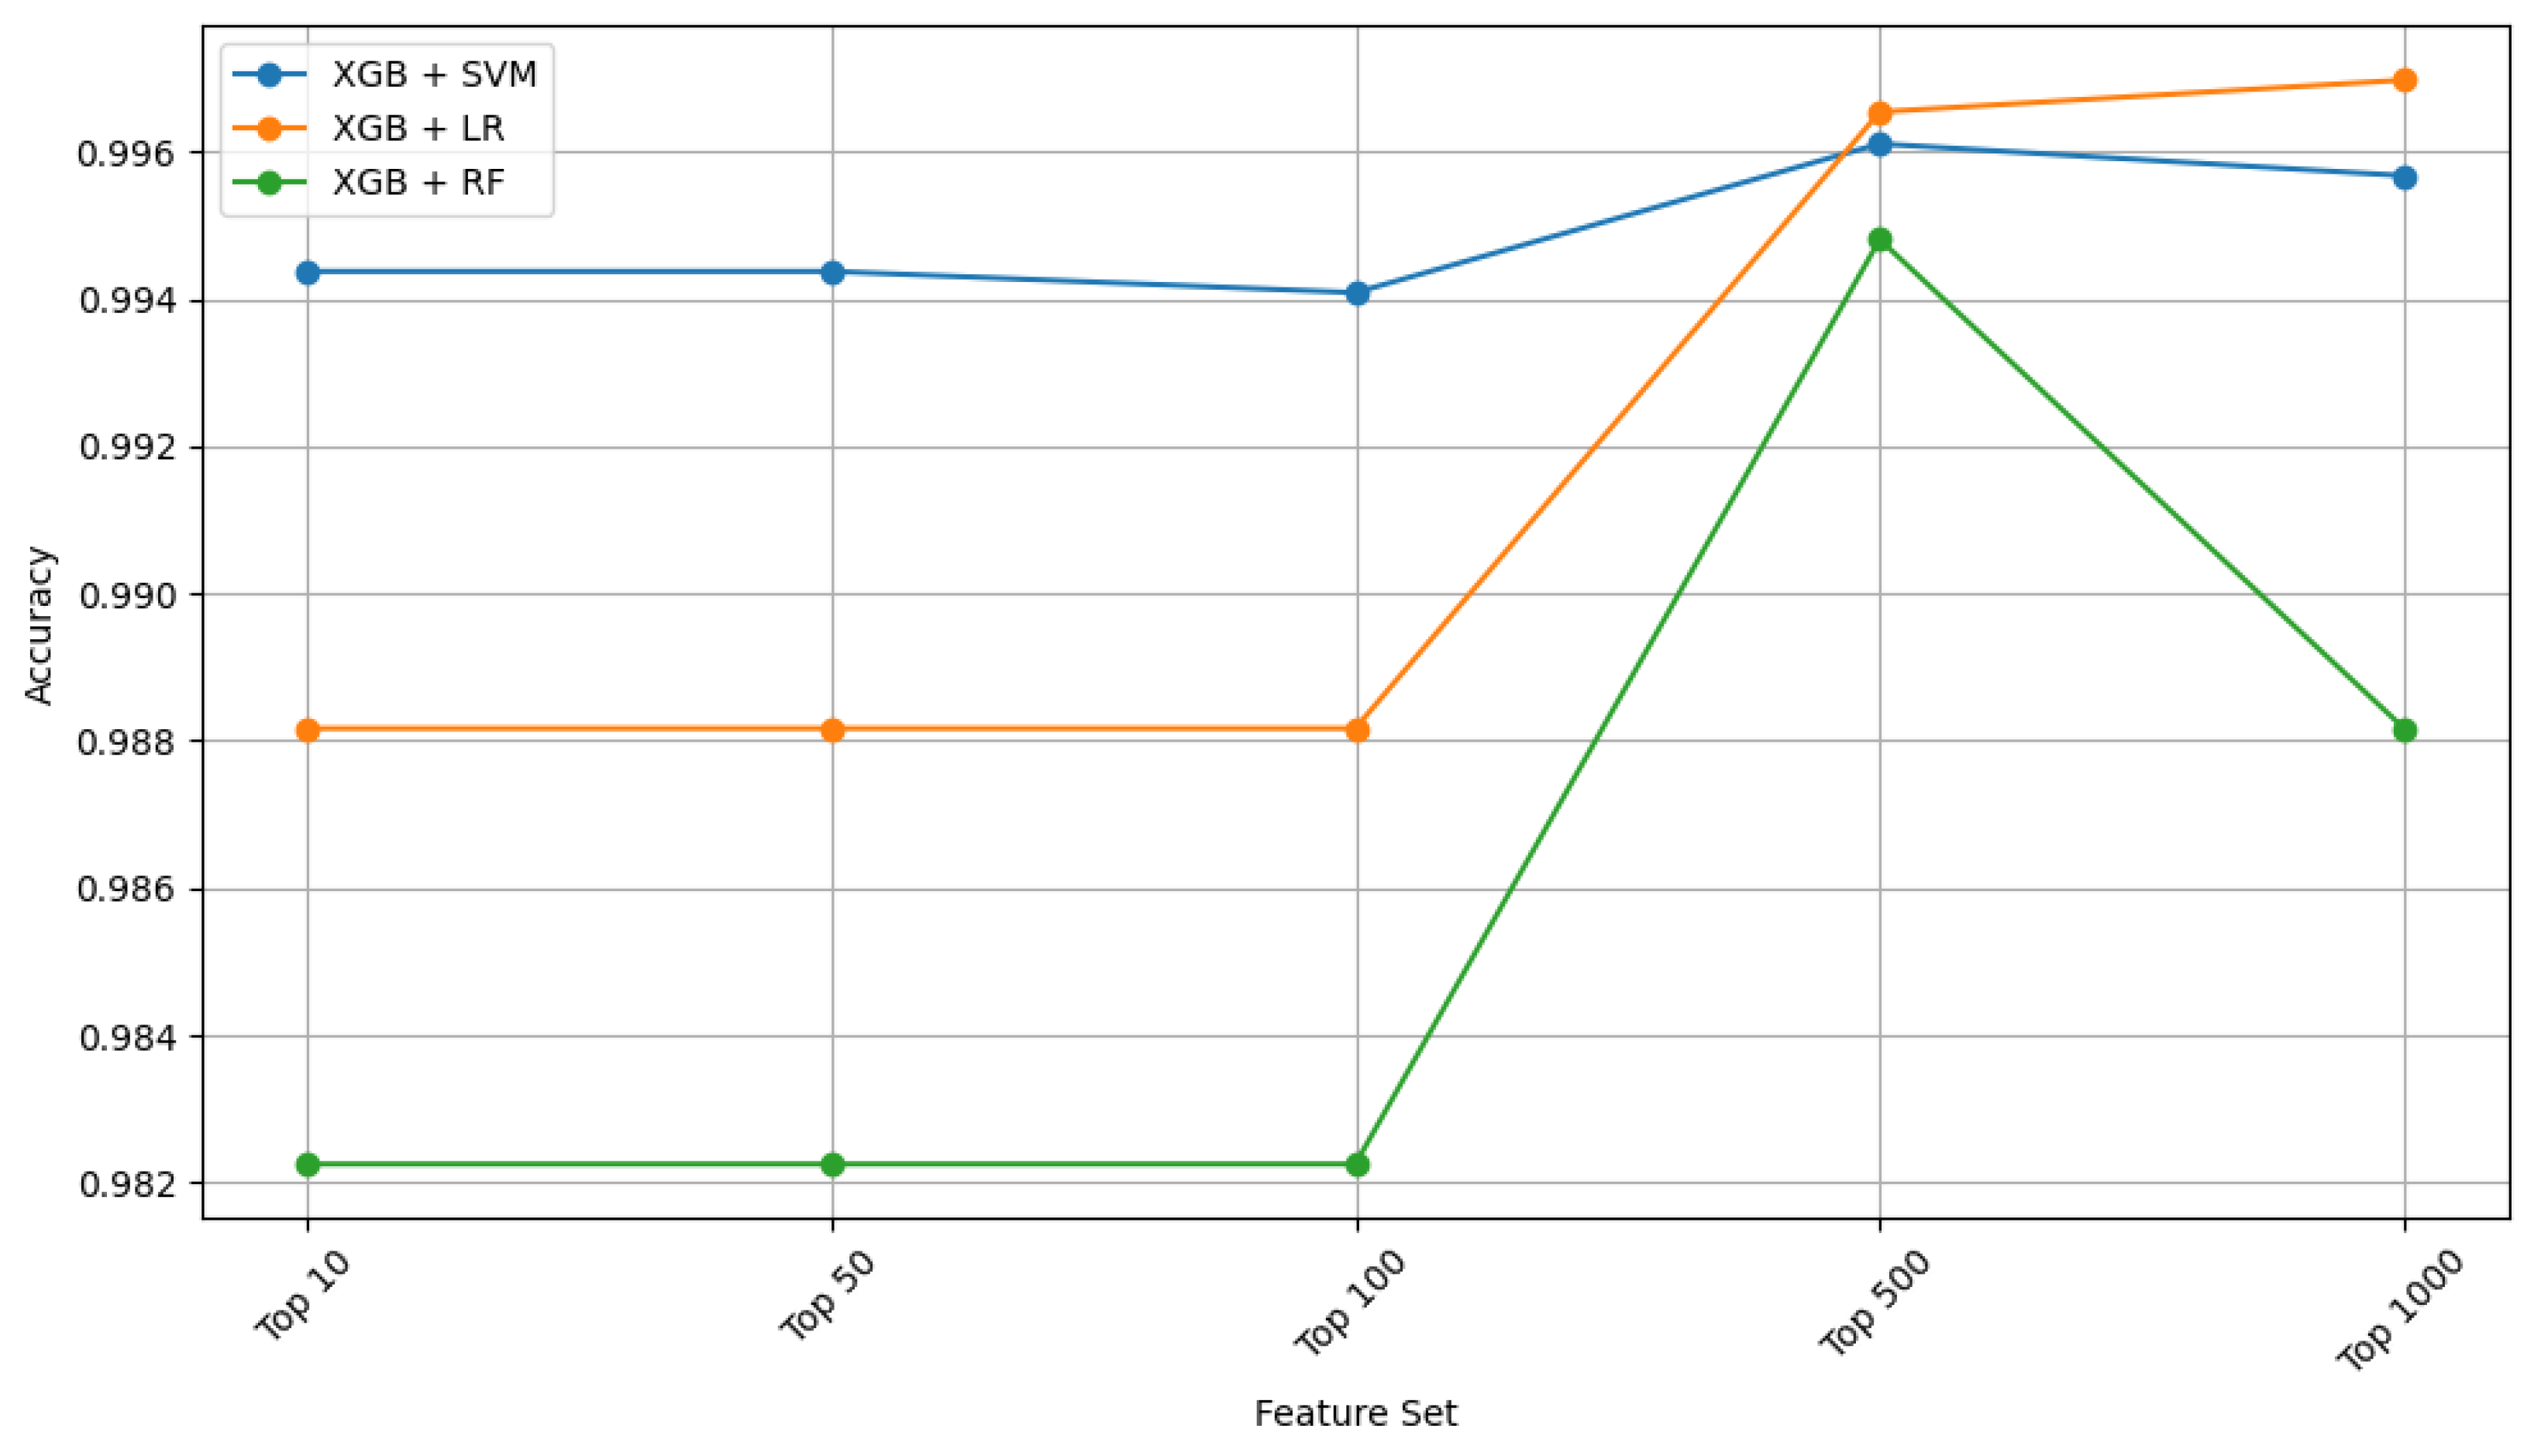
2.1. Ensemble Performance
2.2. External Validation Using the METABRIC Dataset
2.3. Pathway Analysis

| EntrezID | Gene | Pathway | Role in Breast Cancer |
|---|---|---|---|
| 11096 | ADAMTS5 | Extracellular matrix disassembly | Degrades ECM, aiding tumor invasion and metastasis [59]. |
| 8436 | CAVIN2 | Plasma membrane tubulation | Plays a role in membrane remodeling linked to cancer progression [60]. |
| 4320 | MMP11 | Extracellular matrix disassembly | Breaks down ECM, promoting metastasis in breast cancer [61]. |
| 286133 | SCARA5 | Iron ion transmembrane transport | Tumor suppressor regulates iron homeostasis and oxidative stress [62,63]. |
| 1958 | EGR1 | Temperature homeostasis | Tumor suppressor regulates apoptosis and cell cycle [64,65]. |
| Cell proliferation involved in metanephros development | Involved in breast cancer cell growth and proliferation [66]. | ||
| Regulation of glomerular mesangial cell proliferation | Regulates tumor microenvironment and immune response [67]. | ||
| Positive regulation of gene expression via chromosomal CpG island demethylation | Epigenetic regulation, affecting tumor suppressor activation [68]. | ||
| Positive regulation of hormone metabolic process | Influences hormone-driven breast cancer via estrogen receptor signaling [69]. |
| EntrezID | Gene | Pathway | Role in Lung Cancer |
|---|---|---|---|
| 361 | AQP4 | Vasopressin-regulated water reabsorption | Regulates water homeostasis; implicated in lung cancer metastasis and brain edema [70]. |
| Bile secretion | Regulates water homeostasis; implicated in lung cancer metastasis and brain edema [70]. | ||
| 443 | ASPA | Histidine metabolism | May play a role in metabolic reprogramming in lung cancer cells [71] |
| Alanine, aspartate and glutamate metabolism | May play a role in metabolic reprogramming in lung cancer cells [71]. | ||
| 51208 | CLDN18 | Virion-Hepatitis viruses | Tight junction protein; associated with lung adenocarcinoma and gastric tumors [72]. |
| Leukocyte transendothelial migration | Tight junction protein; associated with lung adenocarcinoma and gastric tumors [72]. | ||
| Hepatitis C | Tight junction protein; associated with lung adenocarcinoma and gastric tumors [72]. | ||
| Cell adhesion molecules | Tight junction protein; associated with lung adenocarcinoma and gastric tumors [73]. | ||
| Tight junction | Tight junction protein; associated with lung adenocarcinoma and gastric tumors [73]. | ||
| Pathogenic Escherichia coli infection | Tight junction protein; associated with lung adenocarcinoma and gastric tumors [74]. | ||
| 2348 | FOLR1 | Antifolate resistance | Overexpressed in lung cancer; involved in folate metabolism, supporting tumor growth [75]. |
| Folate transport and metabolism | Overexpressed in lung cancer; involved in folate metabolism, supporting tumor growth [76]. | ||
| Endocytosis | Overexpressed in lung cancer; involved in folate metabolism, supporting tumor growth [77]. | ||
| 4605 | MYBL2 | Cellular senescence | Drives cell cycle progression; upregulated in lung cancer promoting proliferation [78]. |
| 64116 | SLC39A8 | Ferroptosis | Involved in metal ion transport; linked to altered zinc homeostasis in lung tumors [79]. |
| Parkinson disease | Involved in metal ion transport; linked to altered zinc homeostasis in lung tumors [79]. | ||
| Alzheimer disease | Involved in metal ion transport; linked to altered zinc homeostasis in lung tumors [79]. |
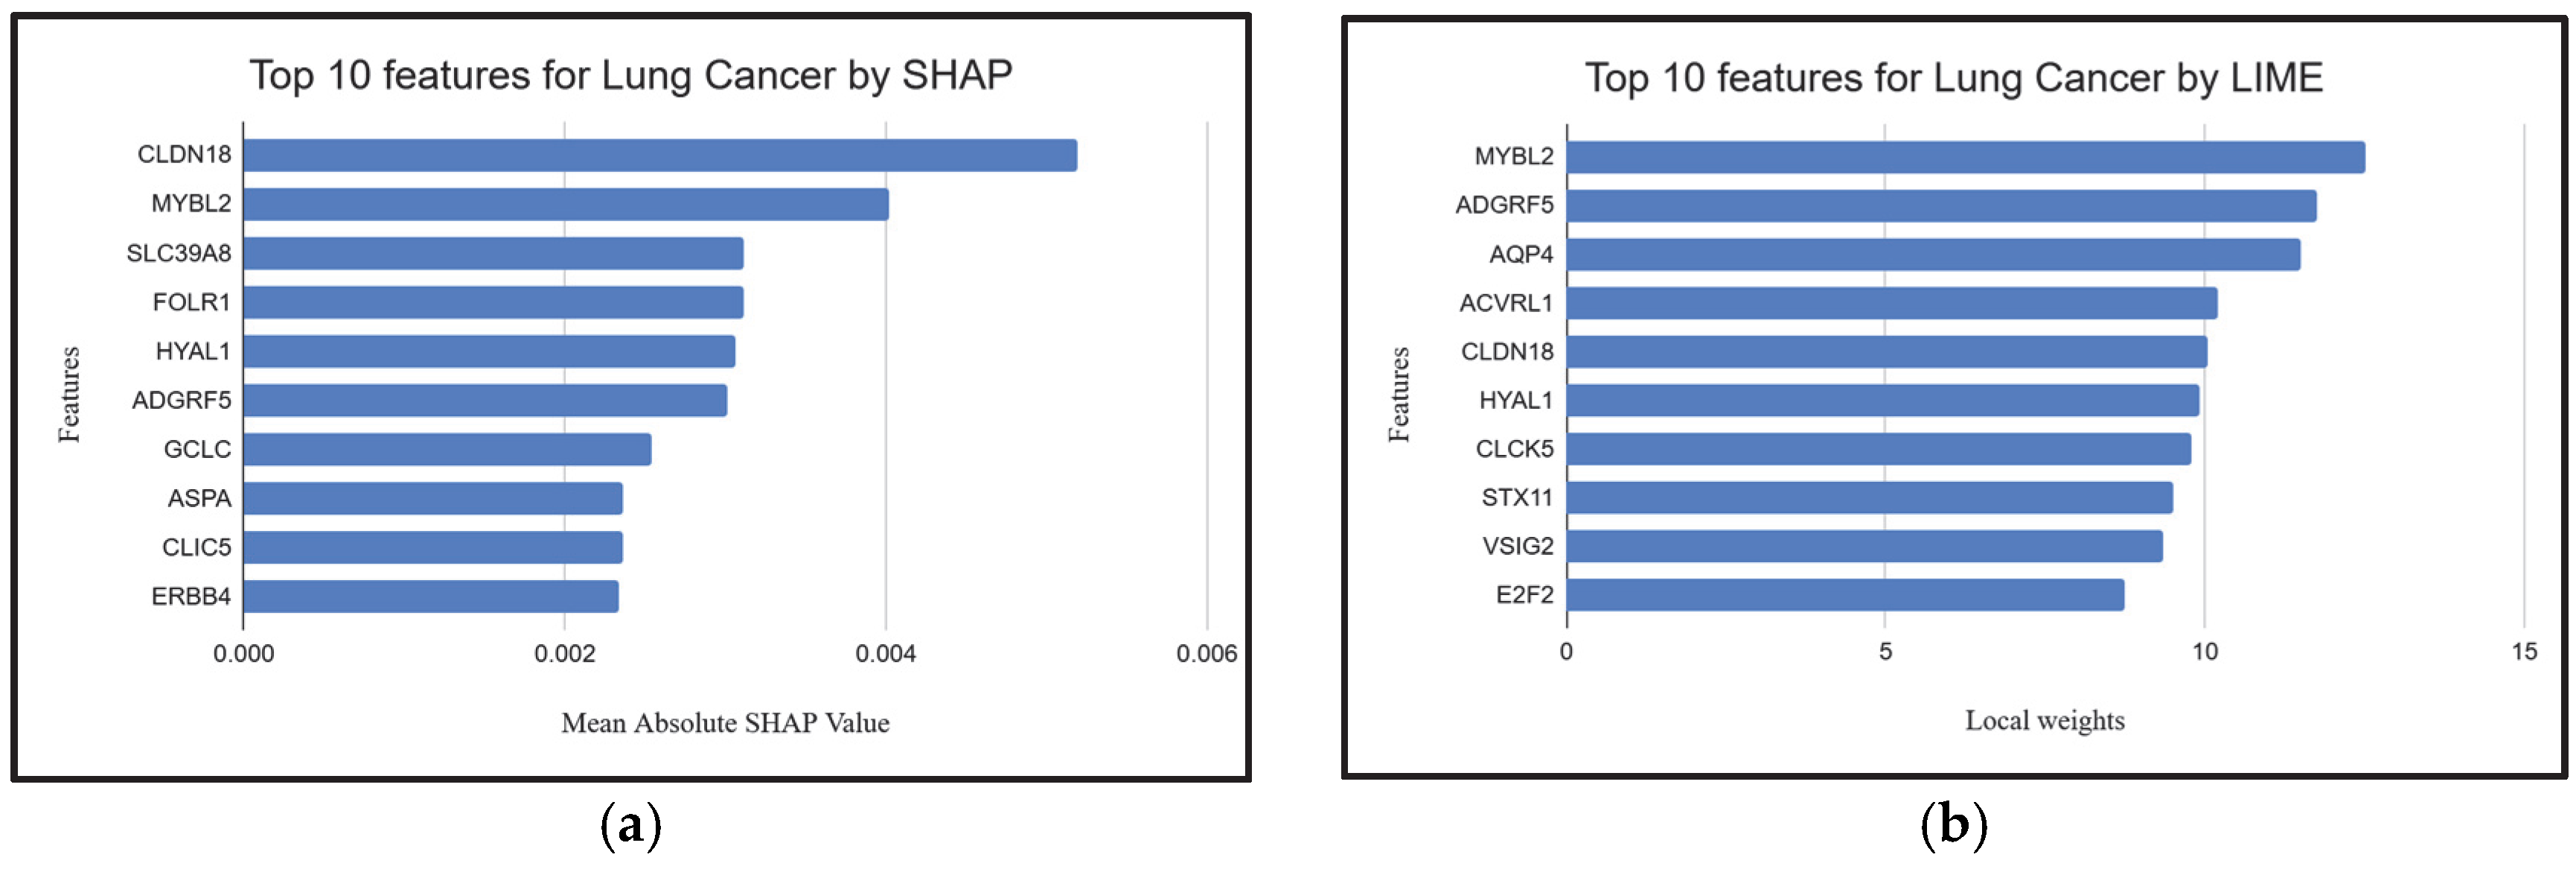
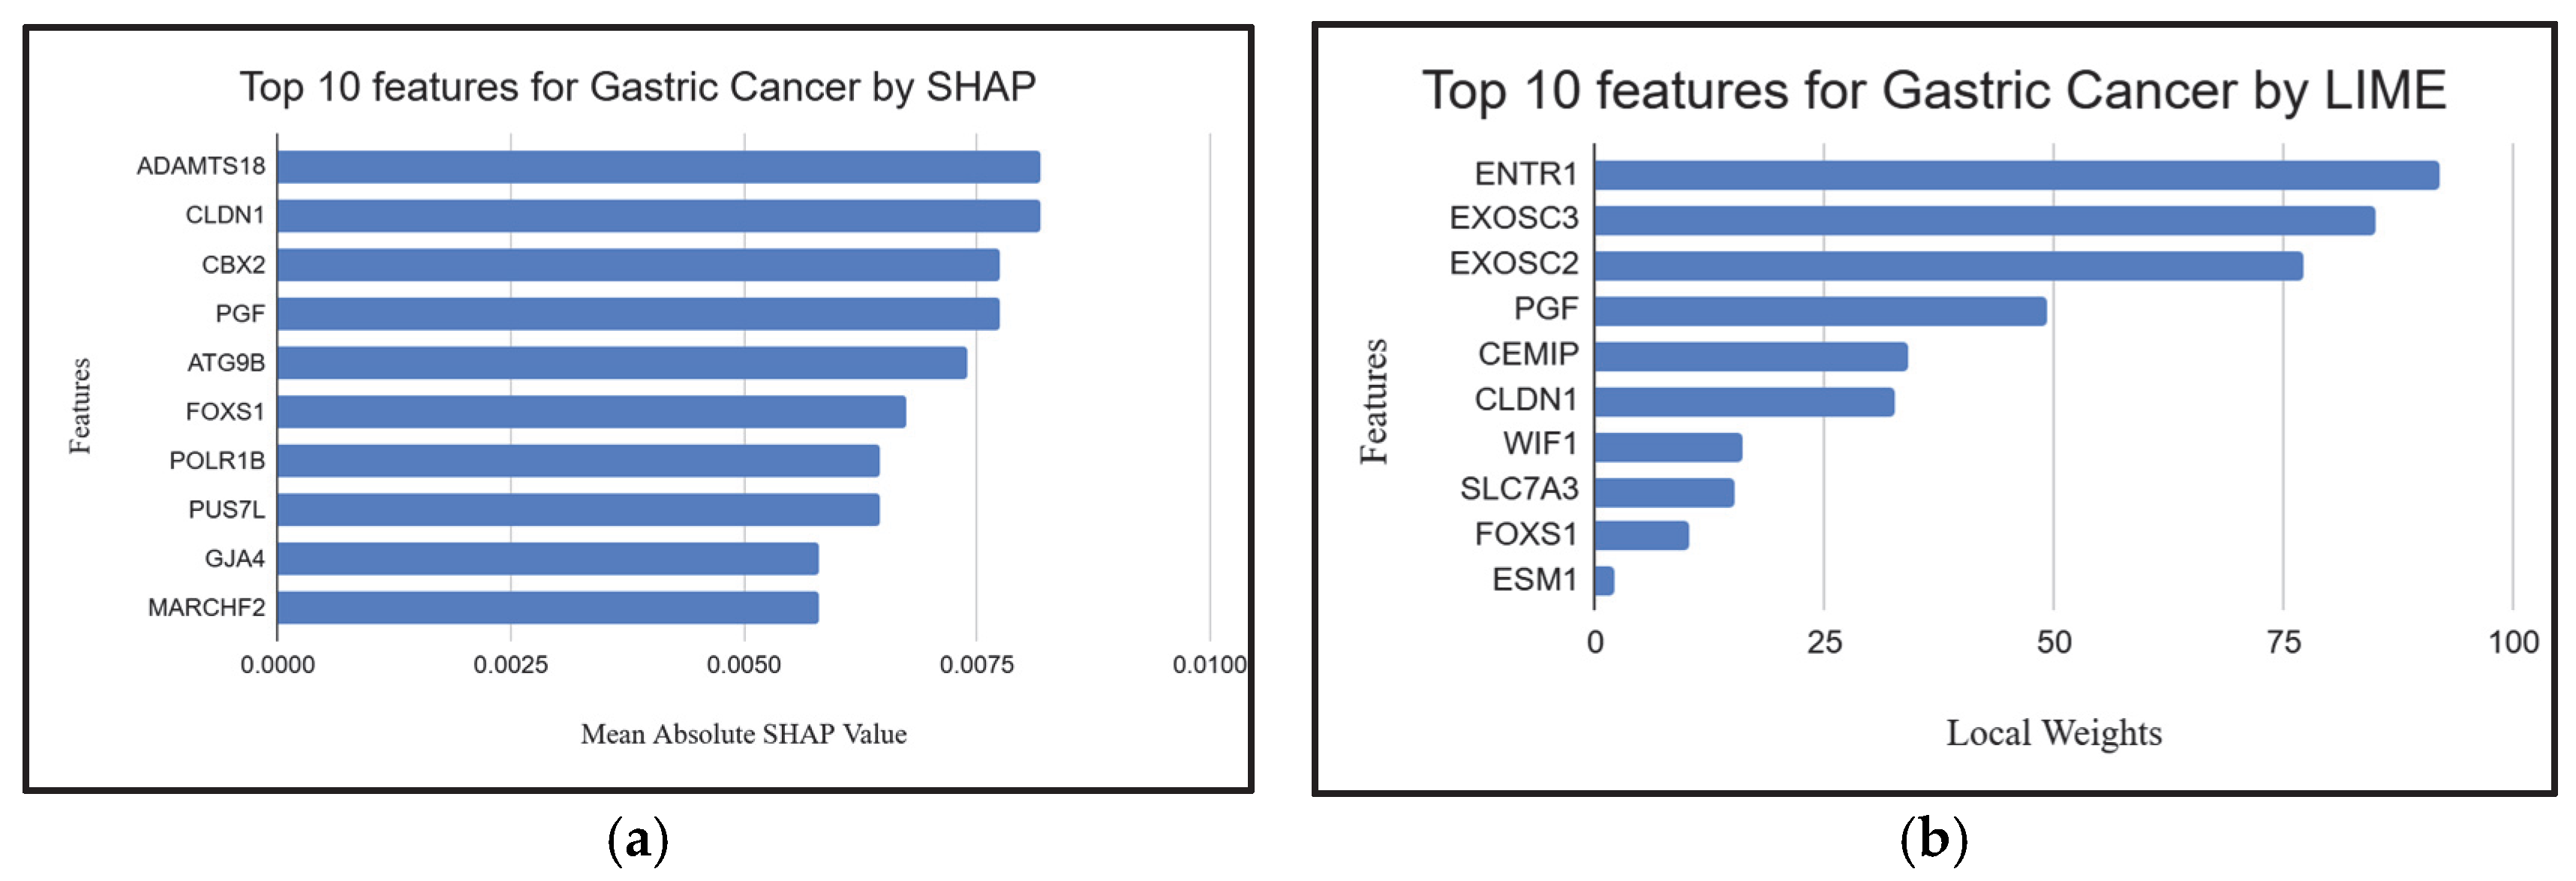
2.4. Explainable AI Techniques to Demonstrate the Influence of Individual Genes
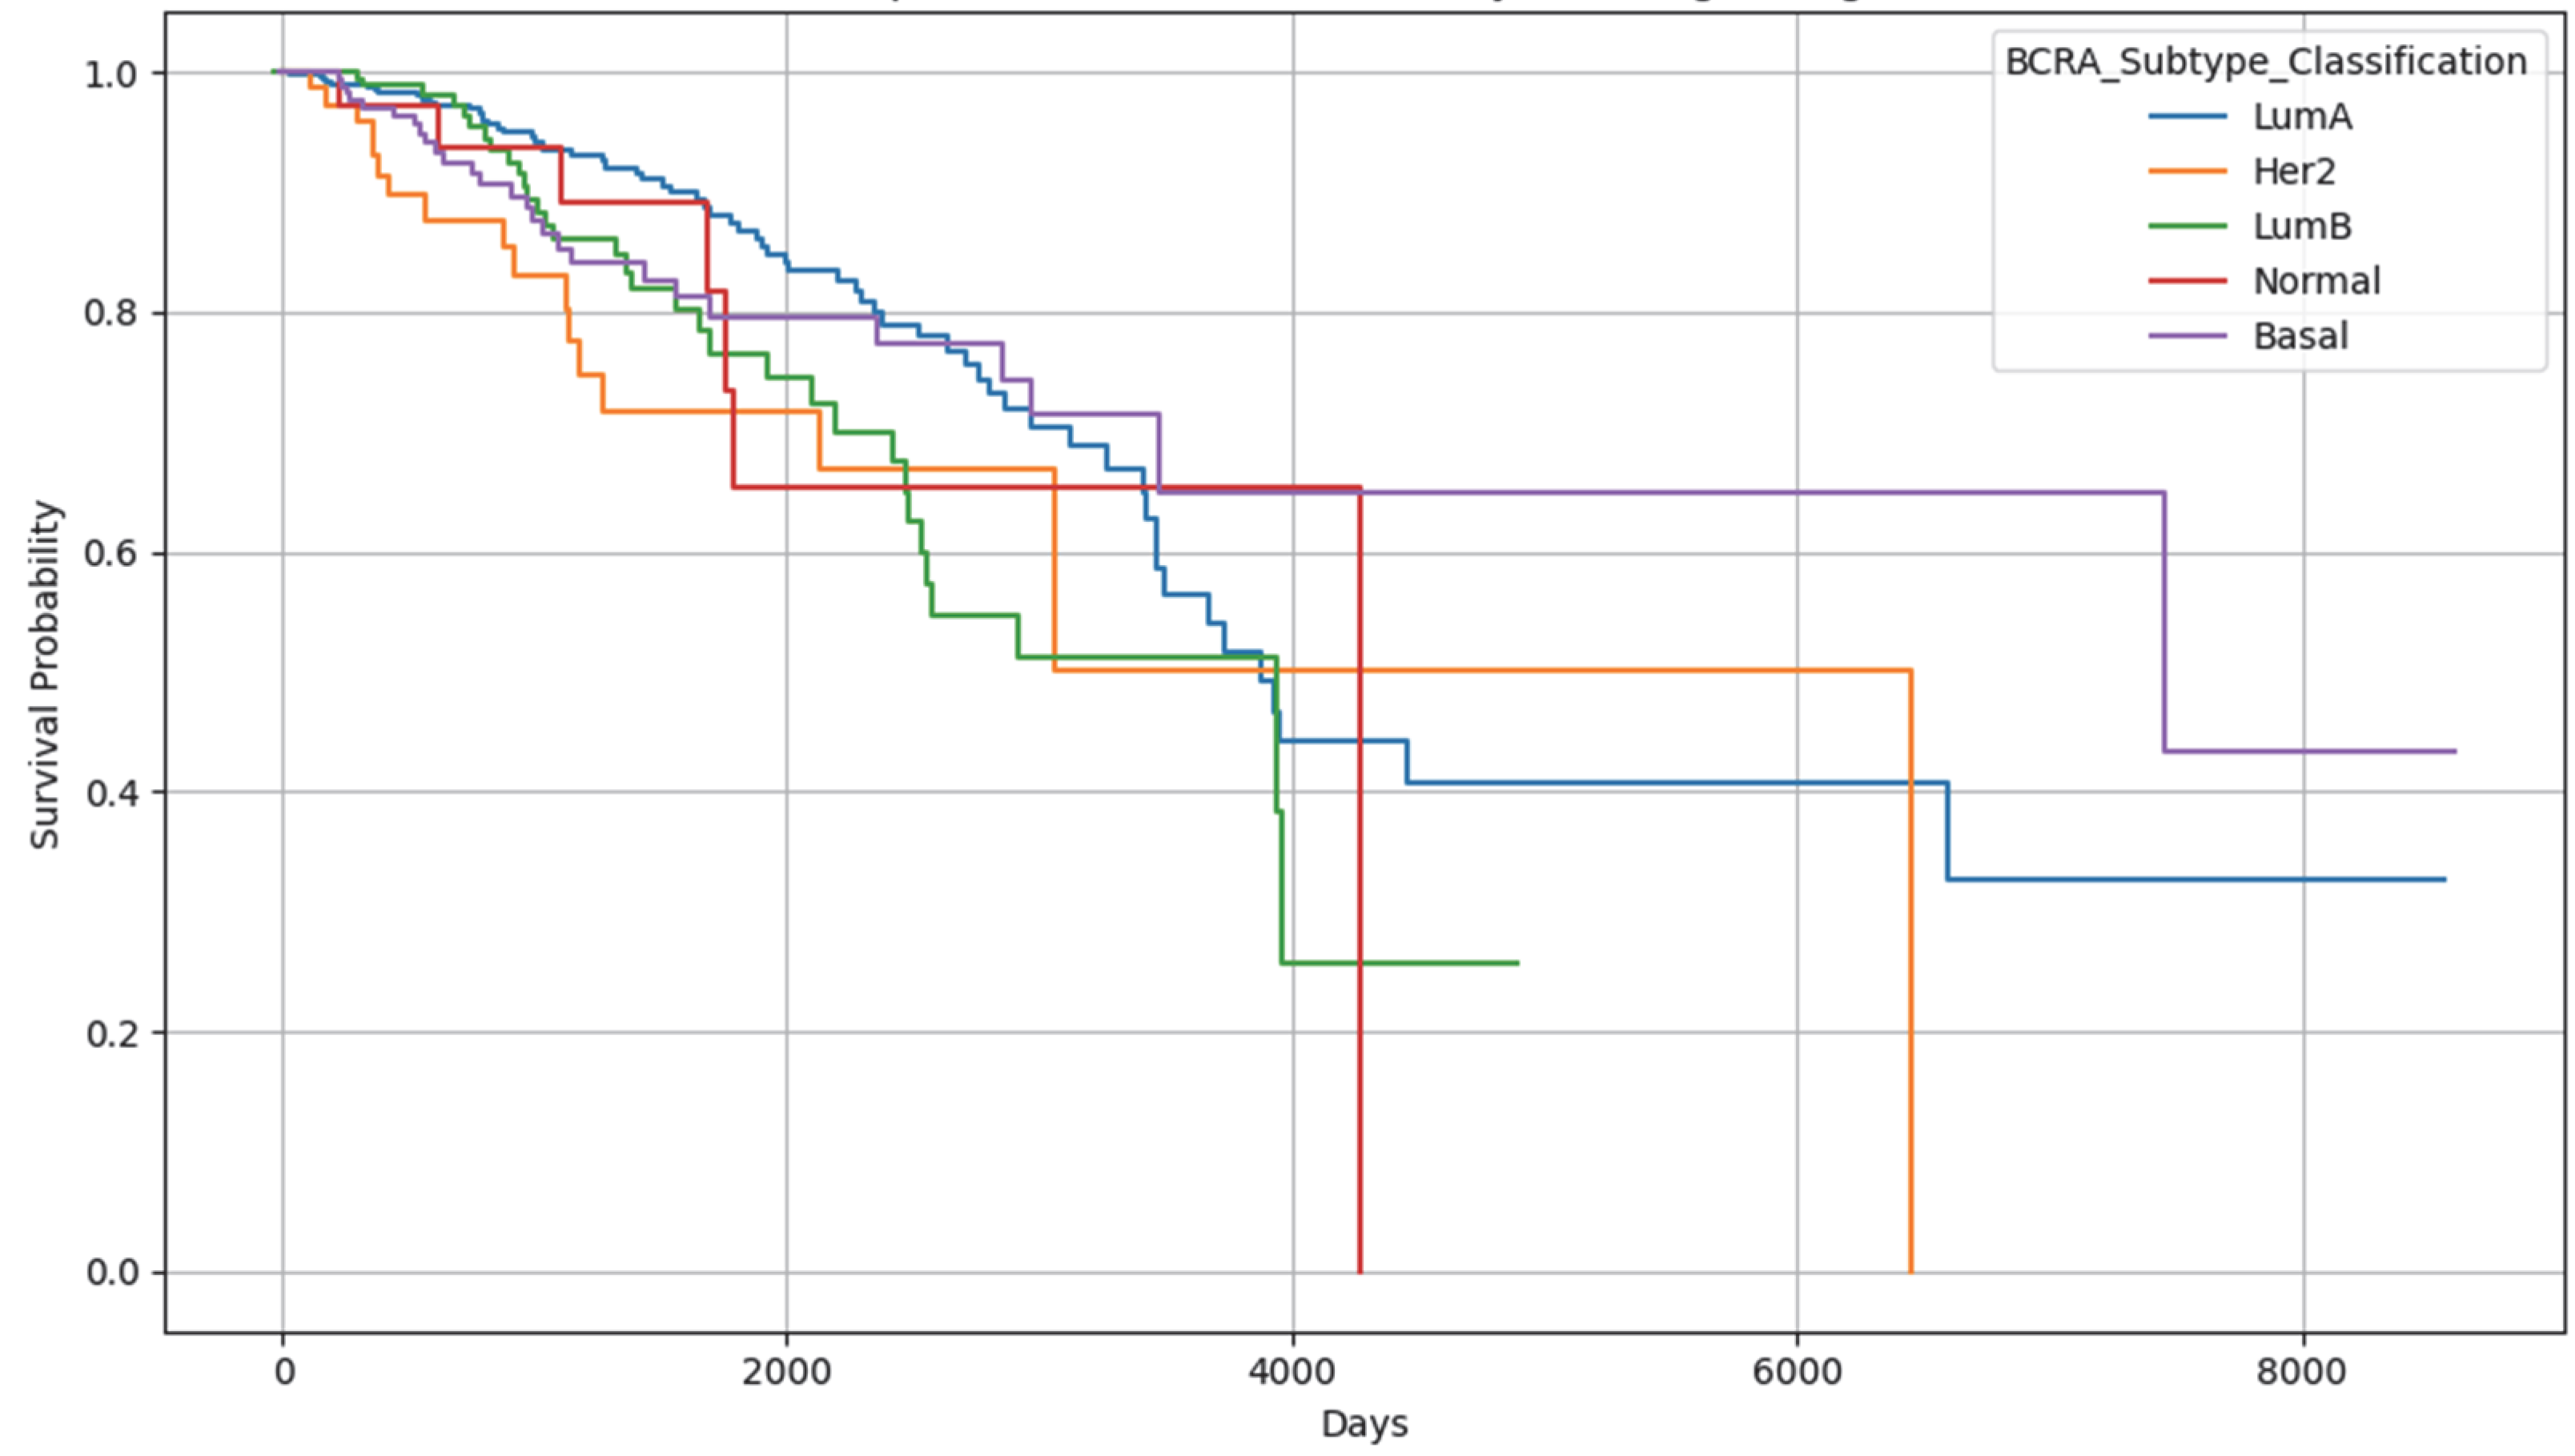
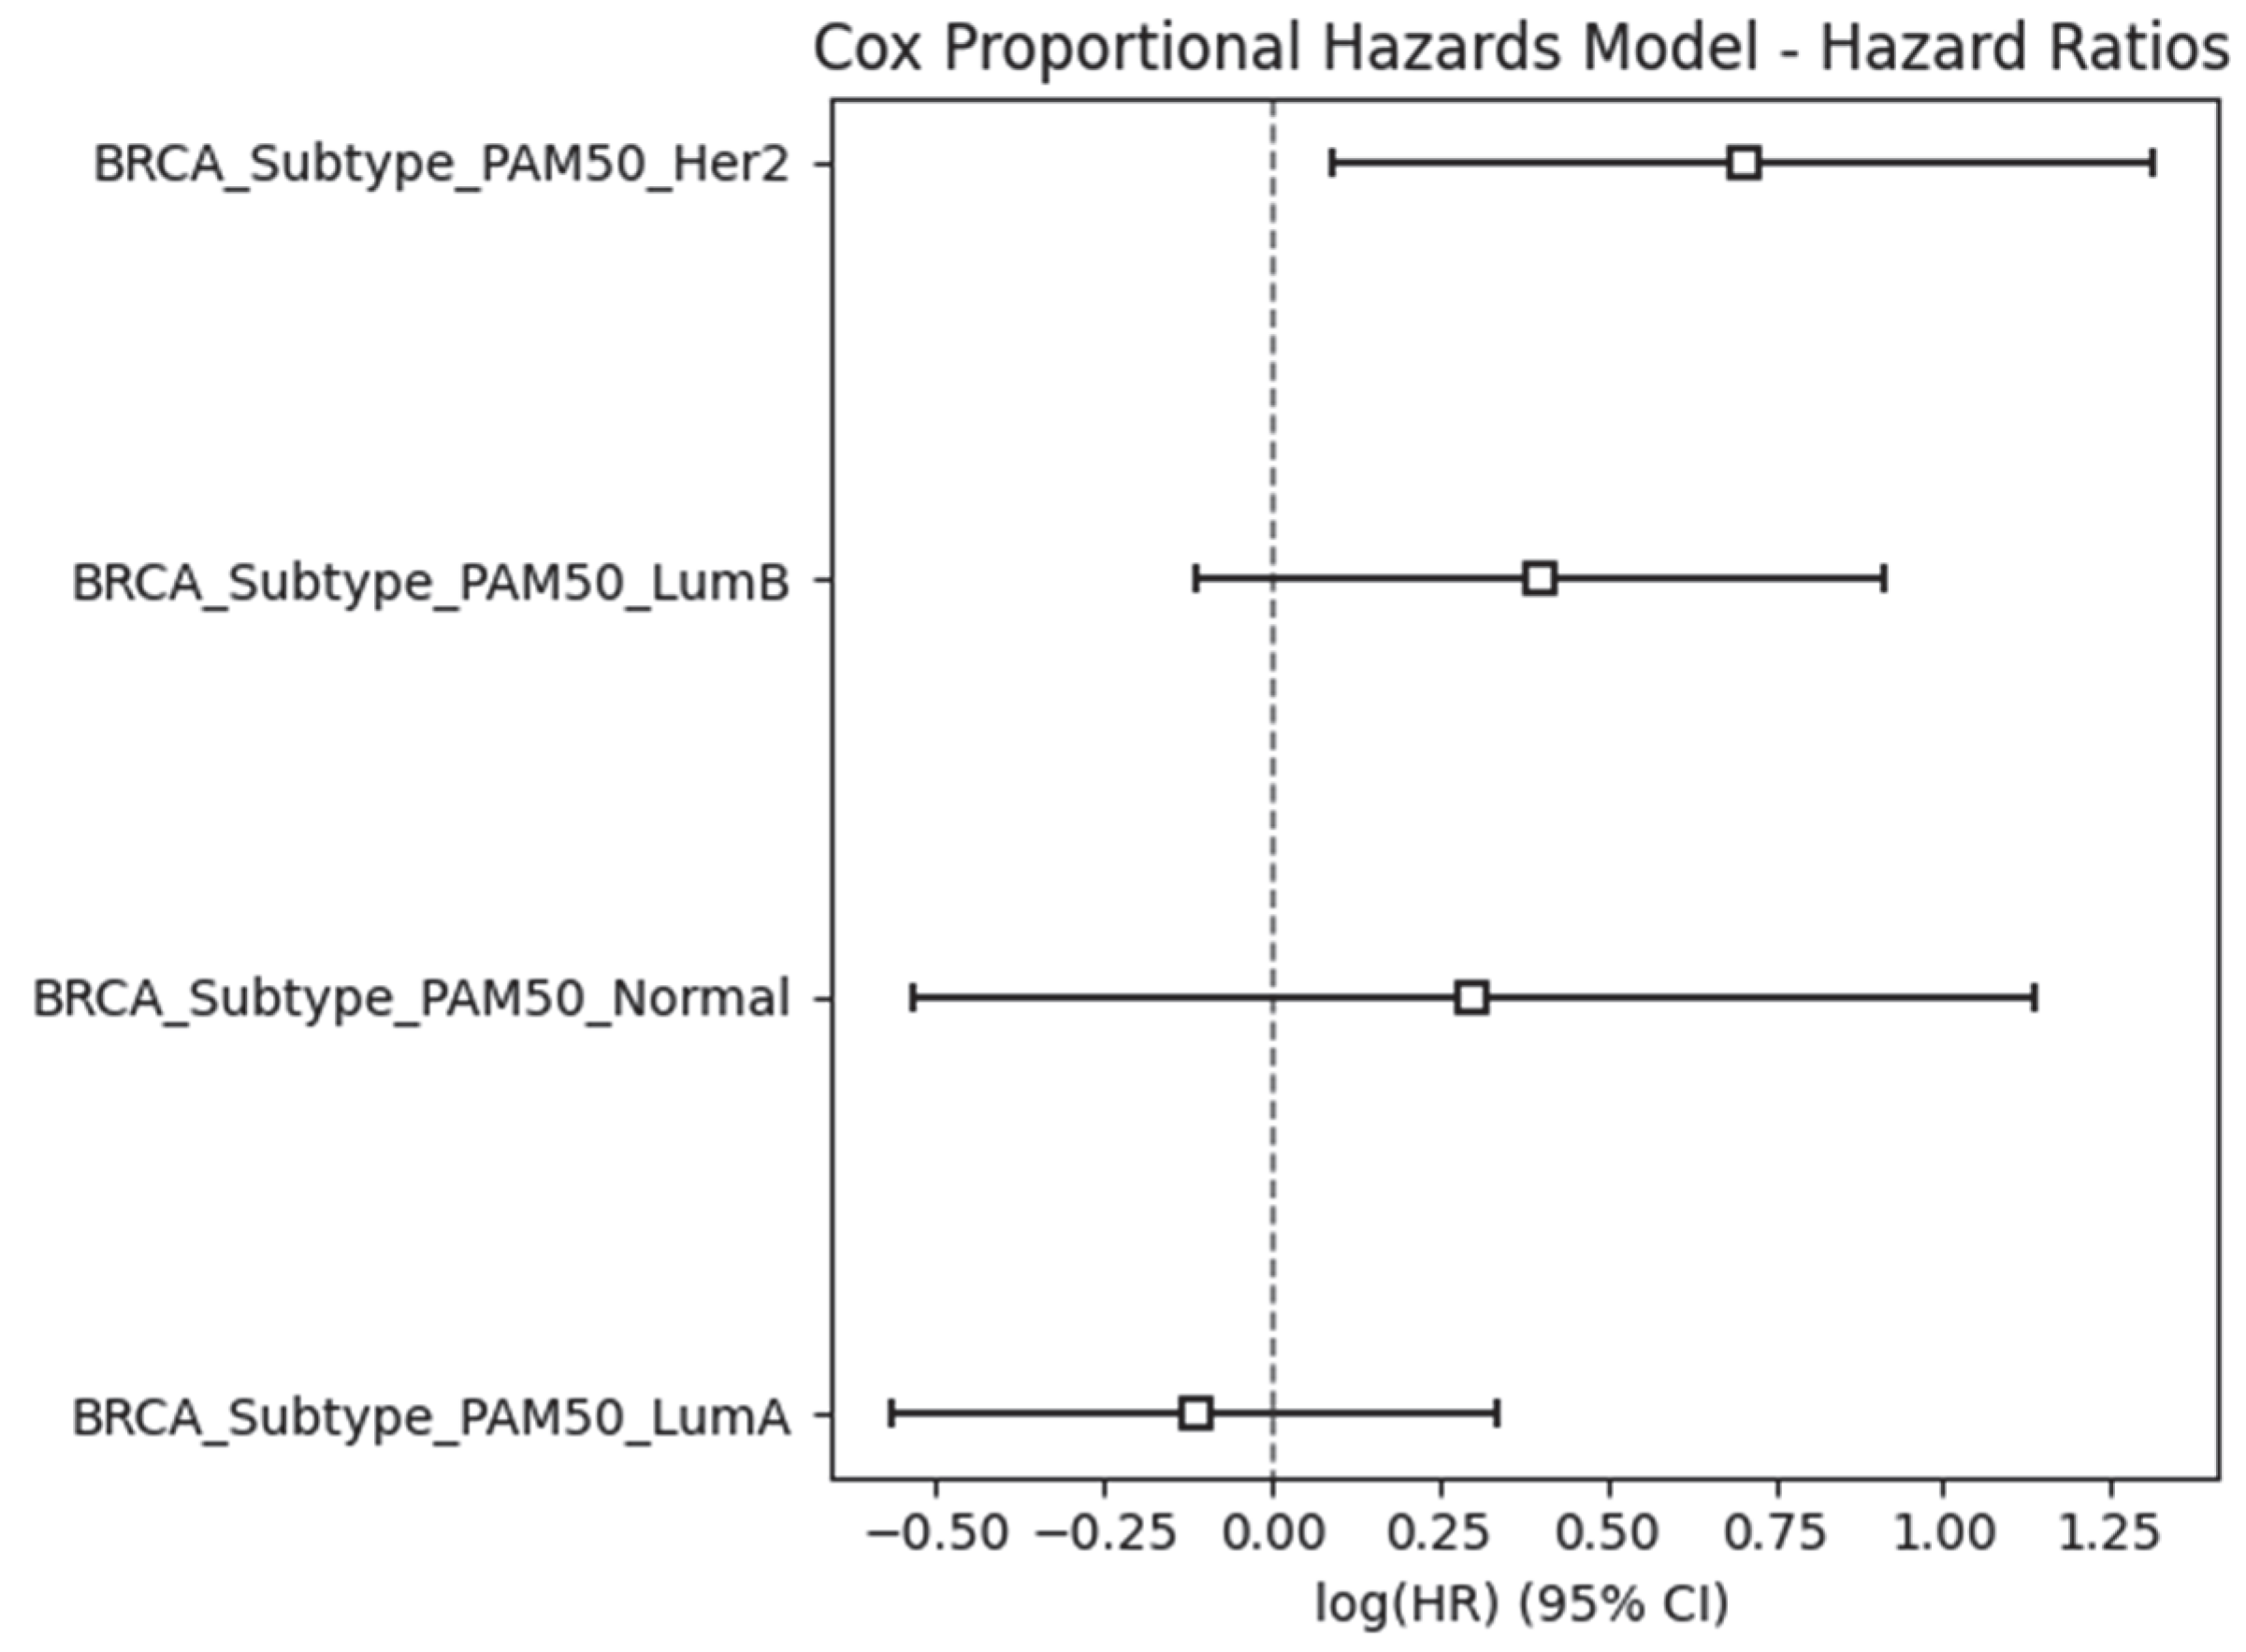
2.5. Results Obtained from the Survival Analysis
3. Discussion
4. Materials and Methods
4.1. Materials
- I.
- Gastric Cancer:
- II.
- Breast Cancer:
- III.
- Lung Cancer:
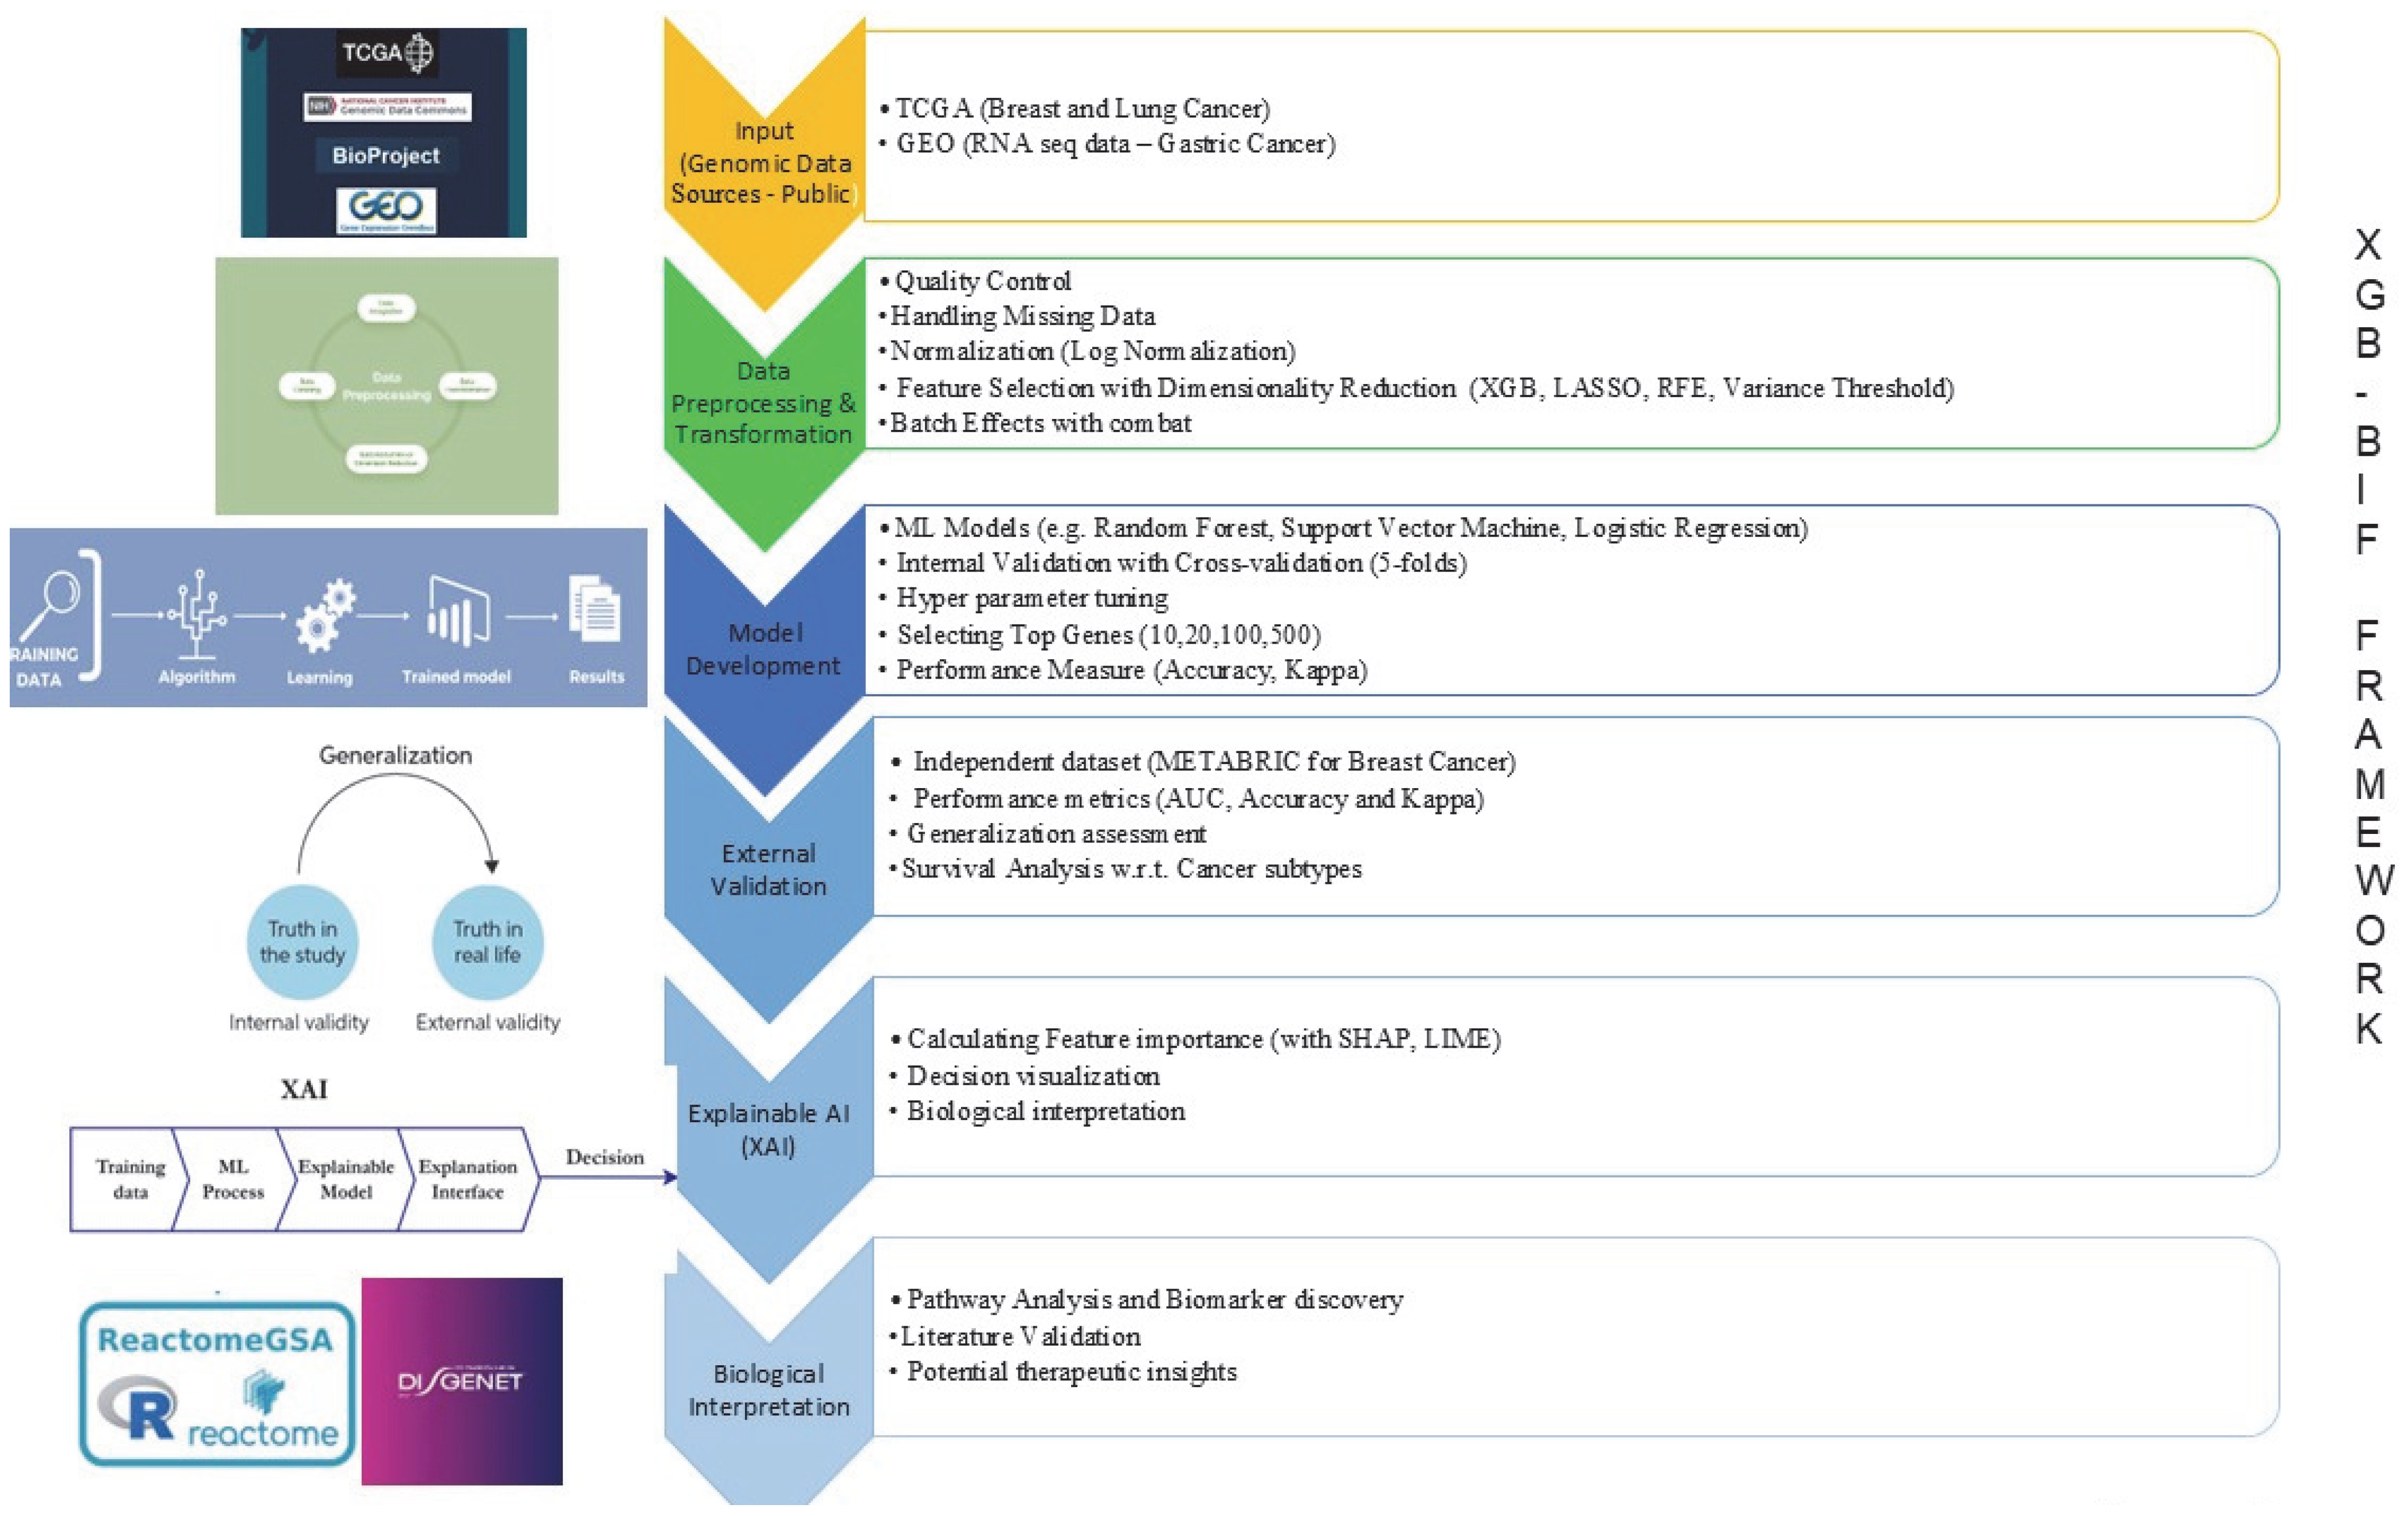
4.2. Methods
4.2.1. Data Collection and Preprocessing
- Dealing with Missing Data: To keep the dataset clean and reliable, any genes or samples with too many missing expression values were removed based on set cutoffs. This helped reduce unnecessary noise without losing important information.
- Scaling Gene Expression Values: A log transformation was applied to the datasets to values to smooth out the data, making gene expression levels easier to compare and improving how well the models could learn from the data.
- Balancing Sample Groups: Since there were differences in the number of healthy and diseased samples, we used stratified splitting when dividing the data into training and test sets. This ensured both groups were fairly represented in each set.
- Clinical Data Integration: We also gathered clinical details for all samples. This not only helped in clearly separating disease and control groups but also allowed us to include useful phenotypic traits in our analysis.
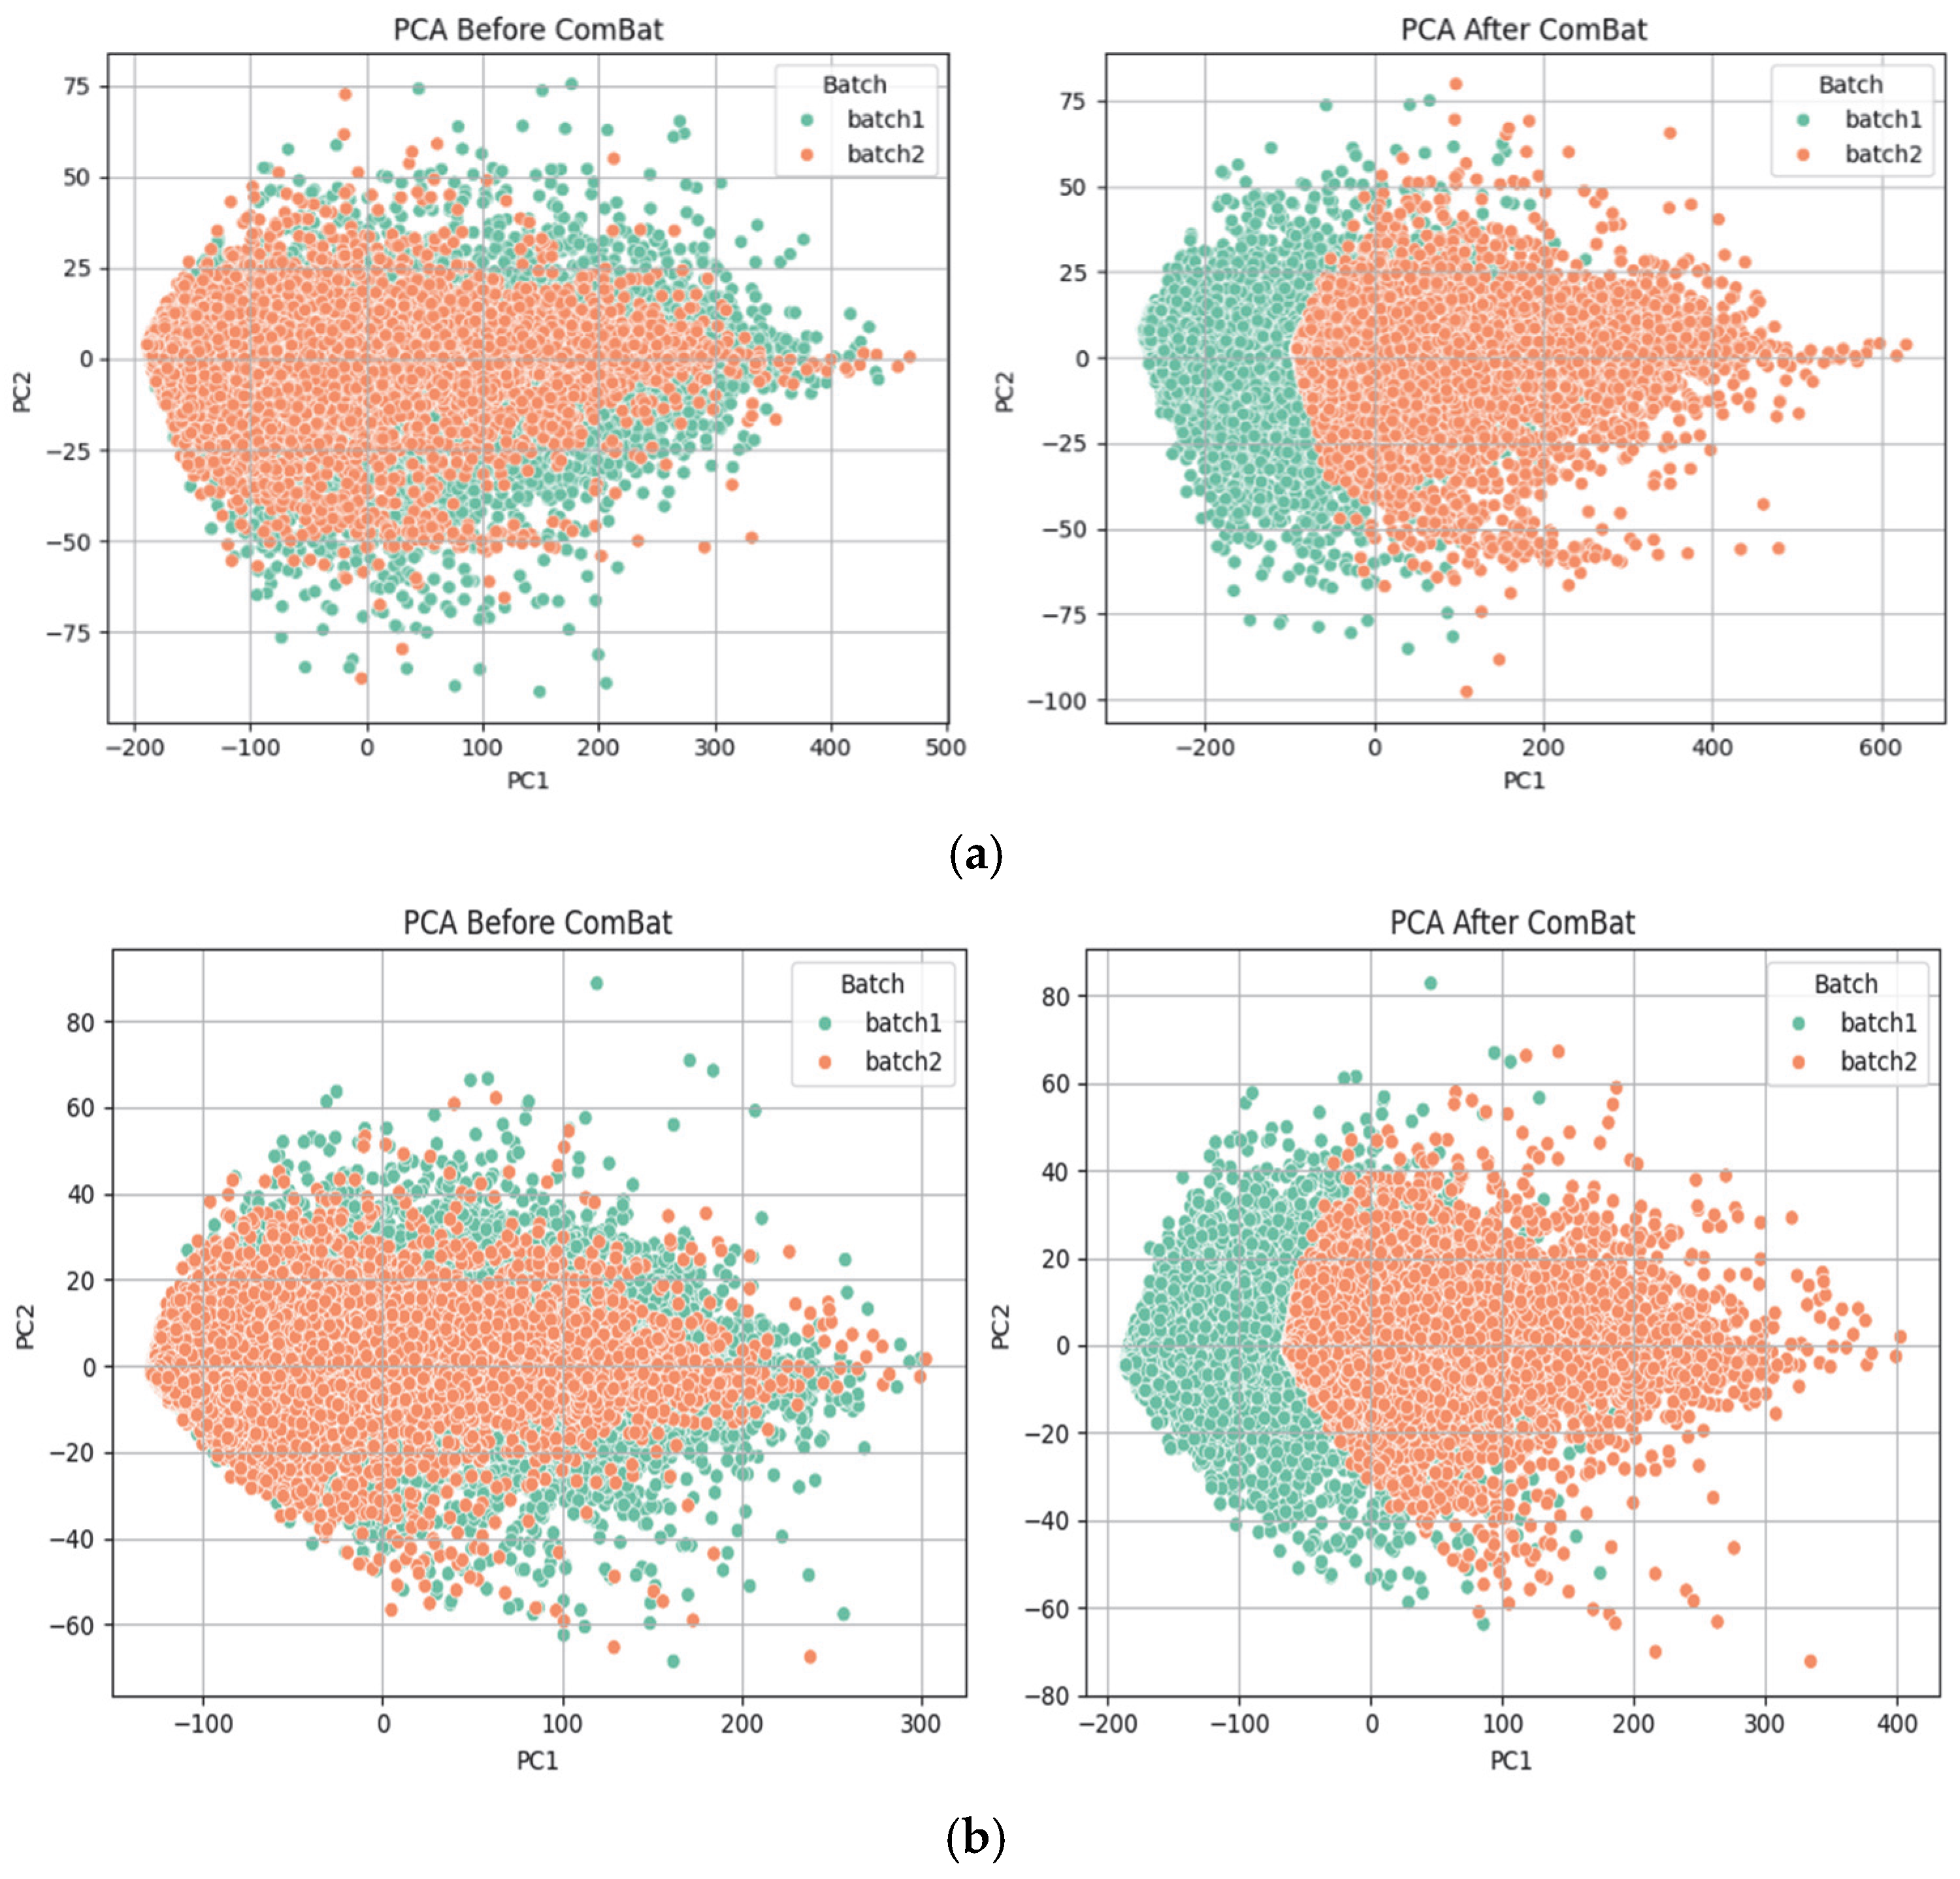
- Batch effects were removed using the ComBat method implemented in Python (pycombat library), which adjusts for both mean and variance across batches while preserving biological variability.
4.2.2. Feature Selection Using XGB
4.2.3. Classification Models
- SVM
- LR
- RF
- n_estimators: The number of decision trees in the RF. We explored values between 100 and 500 to find the right balance between accuracy and computational efficiency.
- max_depth: The number of splits that each decision tree is allowed to make. If the number of splits is too low, the model underfits the data, and if it is too high, the model overfits. In this study, the tree depth was tuned between 5 and 20, allowing the model to learn meaningful patterns without becoming overly complex.
- max_features: The number of columns that are shown to each decision tree. The specific features that are passed to each decision tree can vary between each decision tree.
- Bootstrap sampling: A bootstrapped model takes only a select subset of columns and rows to train each decision tree. This way, each tree sees a slightly different subset of the data, which adds diversity to the model and helps prevent overfitting. This sampling approach also allows the algorithm to perform a kind of built-in feature selection since each tree is trained on a different subset of features.
4.2.4. Model Training and Evaluation
- Cross-Validation
- Performance Metrics
- 1.
- Accuracy: Accuracy [90] is one of the most commonly used metrics for classification problems. It reflects how often the model’s predictions align with the true labels. In simple terms, it is the proportion of correct predictions out of all the predictions made, and it is calculated as in Equation (3):
- TP (True Positives): Cases where the model correctly predicted the positive class
- TN (True Negatives): Cases where the model correctly predicted the negative class
- FP (False Positives): Cases where the model incorrectly predicted the positive class
- FN (False Negatives): Cases where the model incorrectly predicted the negative class
- 2.
- Kappa: Cohen’s Kappa [90] is a statistical measure used to evaluate the agreement between predicted and actual classifications, adjusting for agreement that could occur by chance. This is especially valuable in imbalanced classification problems, where relying on accuracy alone may be misleading. The Kappa statistic is defined as Equation (4):
- Hyperparameter Optimization
4.2.5. External Validation
4.2.6. Explainable AI Methods
4.2.7. Methods for Survival Analysis
4.2.8. Software and Tools
- Programming Language: Python 3.9, R 4.4.0
- Libraries: sci-kit-learn, XGBoost, imbalanced-learn, NumPy, pandas, TCGABiolinks, SummarizedExperiment, dplyr, AnnotationDbi, org.Hs.eg.db, tidyverse
- The code and the data are available at https://github.com/MaitreyiComputationalBiology/XGB-BIF accessed on 3 June 2025.
4.2.9. Biological Relevance Assessment
- To validate the biological significance of the selected features, pathway analysis was conducted using publicly available databases such as KEGG (Kyoto Encyclopedia of Genes and Genomes) and Reactome. The identified genes were mapped to known biological pathways to assess their functional roles in disease mechanisms. Additionally, a comprehensive literature review was performed using databases such as PubMed and Google Scholar to cross-reference the selected genetic markers with previously published studies. This helped in confirming whether the selected genes had been previously associated with the studied condition, ensuring the robustness of our feature selection in XGB-BIF.
- Given XGB’s outstanding predictive performance, we utilized its feature importance ranking to identify the top 10 most influential biomarkers (genes).
- Gene Ontology (GO) enrichment analysis was conducted using the enrichGO() function from the clusterProfiler package, specifically focusing on the Biological Process (BP) category, with an adjusted p-value threshold of 0.05.
- GO terms were filtered to retain only the most statistically significant pathways associated with each gene, ensuring biological relevance. Each gene was then annotated based on its established role in breast, gastric, and lung cancer, with supporting evidence gathered from literature and genomic databases.
5. Conclusions
Supplementary Materials
Author Contributions
Funding
Institutional Review Board Statement
Informed Consent Statement
Data Availability Statement
Acknowledgments
Conflicts of Interest
References
- D’Argenio, V.; Dittfeld, L.; Lazzeri, P.; Tomaiuolo, R.; Tasciotti, E. Unraveling the Balance between Genes, Microbes, Lifestyle and the Environment to Improve Healthy Reproduction. Genes 2021, 12, 605. [Google Scholar] [CrossRef] [PubMed]
- Weischenfeldt, J.; Symmons, O.; Spitz, F.; Korbel, J.O. Phenotypic impact of genomic structural variation: Insights from and for human disease. Nat. Rev. Genet. 2013, 14, 125–138. [Google Scholar] [CrossRef] [PubMed]
- Feuk, L.; Carson, A.R.; Scherer, S.W. Structural variation in the human genome. Nat. Rev. Genet. 2006, 7, 85–97. [Google Scholar] [CrossRef] [PubMed]
- Cao, W.; Chen, H.-D.; Yu, Y.-W.; Li, N.; Chen, W.-Q. Changing profiles of cancer burden worldwide and in China: A secondary analysis of the global cancer statistics 2020. Chin. Med. J. 2021, 134, 783–791. [Google Scholar] [CrossRef]
- Sulkowska, U.; Mańczuk, M.; Łobaszewski, J.; Zatoński, W.A. Lung cancer, the leading cause of cancer deaths among women in Europe. Nowotwory. J. Oncol. 2015, 65, 395–403. [Google Scholar] [CrossRef]
- Yang, W.-J.; Zhao, H.P.; Yu, Y.; Wang, J.H.; Guo, L.; Liu, J.Y.; Pu, J.; Lv, J. Updates on global epidemiology, risk and prognostic factors of gastric cancer. World J. Gastroenterol. 2023, 29, 2452–2468. [Google Scholar] [CrossRef]
- Tao, Z.; Shi, A.; Lu, C.; Song, T.; Zhang, Z.; Zhao, J. Breast Cancer: Epidemiology and Etiology. Cell Biochem. Biophys. 2015, 72, 333–338. [Google Scholar] [CrossRef]
- Rattray, N.J.W.; Charkoftaki, G.; Rattray, Z.; Hansen, J.E.; Vasiliou, V.; Johnson, C.H. Environmental Influences in the Etiology of Colorectal Cancer: The Premise of Metabolomics. Curr. Pharmacol. Rep. 2017, 3, 114–125. [Google Scholar] [CrossRef]
- Boyault, S.; Drouet, Y.; Navarro, C.; Bachelot, T.; Lasset, C.; Treilleux, I.; Tabone, E.; Puisieux, A.; Wang, Q. Mutational characterization of individual breast tumors: TP53 and PI3K pathway genes are frequently and distinctively mutated in different subtypes. Breast Cancer Res. Treat. 2012, 132, 29–39. [Google Scholar] [CrossRef]
- Testa, U.; Castelli, G.; Pelosi, E. Lung Cancers: Molecular Characterization, Clonal Heterogeneity and Evolution, and Cancer Stem Cells. Cancers 2018, 10, 248. [Google Scholar] [CrossRef]
- Skoulidis, F.; Heymach, J.V. Co-occurring genomic alterations in non-small-cell lung cancer biology and therapy. Nat. Rev. Cancer 2019, 19, 495–509. [Google Scholar] [CrossRef] [PubMed]
- Hayashi, R.; Inomata, M. Small cell lung cancer; recent advances of its biology and therapeutic perspective. Respir. Investig. 2022, 60, 197–204. [Google Scholar] [CrossRef] [PubMed]
- Wang, R.C.; Wang, Z. Precision Medicine: Disease Subtyping and Tailored Treatment. Cancers 2023, 15, 3837. [Google Scholar] [CrossRef] [PubMed]
- Weitzel, J.N.; Blazer, K.R.; MacDonald, D.J.; Culver, J.O.; Offit, K. Genetics, genomics, and cancer risk assessment: State of the Art and Future Directions in the Era of Personalized Medicine. CA A Cancer J. Clin. 2011, 61, 327–359. [Google Scholar] [CrossRef]
- Nagaraj, A. COVID-19—Monitoring with IoT Devices; Bentham Science Publishers: Sharjah, United Arab Emirates, 2023. [Google Scholar] [CrossRef]
- Wang, Z.; Gao, X.; Zeng, R.; Wu, Q.; Sun, H.; Wu, W.; Zhang, X.; Sun, G.; Yan, B.; Wu, L.; et al. Changes of the Gastric Mucosal Microbiome Associated with Histological Stages of Gastric Carcinogenesis. Front. Microbiol. 2020, 11, 997. [Google Scholar] [CrossRef]
- Sterbini, F.P.; Palladini, A.; Masucci, L.; Cannistraci, C.V.; Pastorino, R.; Ianiro, G.; Bugli, F.; Martini, C.; Ricciardi, W.; Gasbarrini, A.; et al. Effects of Proton Pump Inhibitors on the Gastric Mucosa-Associated Microbiota in Dyspeptic Patients. Appl. Environ. Microbiol. 2016, 82, 6633–6644. [Google Scholar] [CrossRef]
- Qi, G.-J.; Luo, J. Small Data Challenges in Big Data Era: A Survey of Recent Progress on Unsupervised and Semi-Supervised Methods. IEEE Trans. Pattern Anal. Mach. Intell. 2020, 44, 2168–2187. [Google Scholar] [CrossRef]
- You, L.; Dou, Y.; Zhang, Y.; Xiao, H.; Lv, H.; Wei, G.H.; Xu, D. SDC2 Stabilization by USP14 Promotes Gastric Cancer Progression through Co-option of PDK1. Int. J. Biol. Sci. 2023, 19, 3483–3498. [Google Scholar] [CrossRef]
- Huang, J.; Zhang, L.; He, C.; Qu, Y.; Li, J.; Zhang, J.; Du, T.; Chen, X.; Yu, Y.; Liu, B.; et al. Claudin-1 enhances tumor proliferation and metastasis by regulating cell anoikis in gastric cancer. Oncotarget 2014, 6, 1652–1665. [Google Scholar] [CrossRef]
- Yang, Y.; Zufu, J.; Weizhou, W.; Libin, R.; Chengyang, Y.; Yuning, X.; Liling, W.; Kunpeng, W.; Jinggang, M.; Shankun, Z. Chronic Hepatitis Virus Infection Are Associated with High Risk of Gastric Cancer: A Systematic Review and Cumulative Analysis. Front. Oncol. 2021, 11, 703558. [Google Scholar] [CrossRef]
- Ma, R.; Zhang, Y.; Sun, T.; Cheng, B. Epigenetic regulation by polycomb group complexes: Focus on roles of CBX proteins. J. Zhejiang Univ. Sci. B 2014, 15, 412–428. [Google Scholar] [CrossRef] [PubMed]
- Morgos, D.-T.; Stefani, C.; Miricescu, D.; Greabu, M.; Stanciu, S.; Nica, S.; Stanescu, S.; Balan, D.G.; Balcangiu, S.; Coculescu, E.C.; et al. Targeting PI3K/AKT/mTOR and MAPK Signaling Pathways in Gastric Cancer. Int. J. Mol. Sci. 2024, 25, 1848. [Google Scholar] [CrossRef] [PubMed]
- Wang, M.; Zhang, C.; Song, Y.; Wang, Z.; Wang, Y.; Luo, F.; Xu, Y.; Zhao, Y.; Wu, Z.; Xu, Y. Mechanism of immune evasion in breast cancer. OncoTargets Ther. 2017, 10, 1561–1573. [Google Scholar] [CrossRef] [PubMed]
- Gilmore, E.; McCabe, N.; Kennedy, R.D.; Parkes, E.E. DNA Repair Deficiency in Breast Cancer: Opportunities for Immunotherapy. J. Oncol. 2019, 2019, 4325105. [Google Scholar] [CrossRef]
- Miller, T.W. Initiating breast cancer by PIK3CA mutation. Breast Cancer Res. 2012, 14, 301. [Google Scholar] [CrossRef]
- Theng, D.; Bhoyar, K.K. Feature selection techniques for machine learning: A survey of more than two decades of research. Knowl. Inf. Syst. 2024, 66, 1575–1637. [Google Scholar] [CrossRef]
- Muthukrishnan, R.; Rohini, R. LASSO: A Feature Selection Technique in Predictive Modeling for Machine Learning. In Proceedings of the 2016 IEEE International Conference on Advances in Computer Applications (ICACA), Coimbatore, India, 24 October 2016; IEEE: New York, NY, USA, 2016; pp. 18–20. [Google Scholar] [CrossRef]
- Rani, P.; Kumar, R.; Jain, A.; Chawla, S.K. A Hybrid Approach for Feature Selection Based on Genetic Algorithm and Recursive Feature Elimination. Int. J. Inf. Syst. Model. Des. 2021, 12, 17–38. [Google Scholar] [CrossRef]
- Curtis, C.; Shah, S.P.; Chin, S.-F.; Turashvili, G.; Rueda, O.M.; Dunning, M.J.; Speed, D.; Lynch, A.G.; Samarajiwa, S.; Yuan, Y.; et al. The genomic and transcriptomic architecture of 2,000 breast tumours reveals novel subgroups. Nature 2012, 486, 346–352. [Google Scholar] [CrossRef]
- Eftang, L.L.; Esbensen, Y.; Tannæs, T.M.; Blom, G.P.; Bukholm, I.R.; Bukholm, G. Up-regulation of CLDN1 in gastric cancer is correlated with reduced survival. BMC Cancer 2013, 13, 586. [Google Scholar] [CrossRef]
- Niedźwiedzka-Rystwej, P.; Grywalska, E.; Hrynkiewicz, R.; Wołącewicz, M.; Becht, R.; Roliński, J. The Double-Edged Sword Role of Viruses in Gastric Cancer. Cancers 2020, 12, 1680. [Google Scholar] [CrossRef]
- Sekhar, V.; Pollicino, T.; Diaz, G.; Engle, R.E.; Alayli, F.; Melis, M.; Kabat, J.; Tice, A.; Pomerenke, A.; Altan-Bonnet, N.; et al. Infection with hepatitis C virus depends on TACSTD2, a regulator of claudin-1 and occludin highly downregulated in hepatocellular carcinoma. PLoS Pathog. 2018, 14, e1006916. [Google Scholar] [CrossRef] [PubMed]
- Bhat, A.A.; Syed, N.; Therachiyil, L.; Nisar, S.; Hashem, S.; Macha, M.A.; Yadav, S.K.; Krishnankutty, R.; Muralitharan, S.; Al-Naemi, H.; et al. Claudin-1, A Double-Edged Sword in Cancer. Int. J. Mol. Sci. 2020, 21, 569. [Google Scholar] [CrossRef] [PubMed]
- Gong, Y.; Jin, X.; Yuan, B.; Lv, Y.; Yan, G.; Liu, M.; Xie, C.; Liu, J.; Tang, Y.; Gao, H.; et al. G Protein-Coupled Receptor 109A Maintains the Intestinal Integrity and Protects Against ETEC Mucosal Infection by Promoting IgA Secretion. Front. Immunol. 2021, 11, 583652. [Google Scholar] [CrossRef] [PubMed]
- Menter, D.G.; DuBois, R.N. Prostaglandins in Cancer Cell Adhesion, Migration, and Invasion. Int. J. Cell Biol. 2012, 2012, 723419. [Google Scholar] [CrossRef]
- Lai, I.-R.; Chu, P.Y.; Lin, H.S.; Liou, J.Y.; Jan, Y.J.; Lee, J.C.; Shen, T.L. Phosphorylation of Focal Adhesion Kinase at Tyr397 in Gastric Carcinomas and its Clinical Significance. Am. J. Pathol. 2010, 177, 1629–1637. [Google Scholar] [CrossRef]
- Yang, Y.; Zhang, J.; Yan, Y.; Cai, H.; Li, M.; Sun, K.; Wang, J.; Liu, X.; Wang, J.; Duan, X. Low expression of Rap1GAP is associated with epithelial-mesenchymal transition (EMT) and poor prognosis in gastric cancer. Oncotarget 2017, 8, 8057–8068. [Google Scholar] [CrossRef]
- Fujita, K.; Ohuchi, N.; Yao, T.; Okumura, M.; Fukushima, Y.; Kanakura, Y.; Kitamura, Y.; Fujita, J. Frequent overexpression, but not activation by point mutation, of ras genes in primary human gastric cancers. Gastroenterology 1987, 93, 1339–1345. [Google Scholar] [CrossRef]
- Magnelli, L.; Schiavone, N.; Staderini, F.; Biagioni, A.; Papucci, L. MAP Kinases Pathways in Gastric Cancer. Int. J. Mol. Sci. 2020, 21, 2893. [Google Scholar] [CrossRef]
- Matsuoka, T.; Yashiro, M. The Role of PI3K/Akt/mTOR Signaling in Gastric Carcinoma. Cancers 2014, 6, 1441–1463. [Google Scholar] [CrossRef]
- Yang, Q.; Hong, K.; Li, Y.; Shi, P.; Yan, F.; Zhang, P. Receptor-interacting protein kinase 2 is associated with tumor immune infiltration, immunotherapy-related biomarkers, and affects gastric cancer cells growth in vivo. J. Cancer 2024, 15, 176–191. [Google Scholar] [CrossRef]
- Yang, Q.; Tian, S.; Liu, Z.; Dong, W. Knockdown of RIPK2 Inhibits Proliferation and Migration, and Induces Apoptosis via the NF-κB Signaling Pathway in Gastric Cancer. Front. Genet. 2021, 12, 627464. [Google Scholar] [CrossRef] [PubMed]
- Zhou, Y.; Yu, S.; Zhang, W. NOD-like Receptor Signaling Pathway in Gastrointestinal Inflammatory Diseases and Cancers. Int. J. Mol. Sci. 2023, 24, 14511. [Google Scholar] [CrossRef] [PubMed]
- Philpott, D.J.; Sorbara, M.T.; Robertson, S.J.; Croitoru, K.; Girardin, S.E. NOD proteins: Regulators of inflammation in health and disease. Nat. Rev. Immunol. 2014, 14, 9–23. [Google Scholar] [CrossRef] [PubMed]
- Negroni, A.; Colantoni, E.; Cucchiara, S.; Stronati, L. Necroptosis in Intestinal Inflammation and Cancer: New Concepts and Therapeutic Perspectives. Biomolecules 2020, 10, 1431. [Google Scholar] [CrossRef]
- Liao, S.; Liu, C.; Zhu, G.; Wang, K.; Yang, Y.; Wang, C. Relationship between SDC1 and cadherin signalling activation in cancer. Pathol.-Res. Pract. 2020, 216, 152756. [Google Scholar] [CrossRef]
- Wu, S.; Nie, Q.; Tan, S.; Liao, G.; Lv, Y.; Lv, C.; Chen, G.; Liu, S. The immunity modulation of transforming growth factor-β in malaria and other pathological process. Int. Immunopharmacol. 2023, 122, 110658. [Google Scholar] [CrossRef]
- Zhang, R.; Song, B.; Hong, X.; Shen, Z.; Sui, L.; Wang, S. microRNA-9 Inhibits Vulnerable Plaque Formation and Vascular Remodeling via Suppression of the SDC2-Dependent FAK/ERK Signaling Pathway in Mice with Atherosclerosis. Front. Physiol. 2020, 11, 804. [Google Scholar] [CrossRef]
- De Pasquale, V.; Pavone, L.M. Heparan Sulfate Proteoglycan Signaling in Tumor Microenvironment. Int. J. Mol. Sci. 2020, 21, 6588. [Google Scholar] [CrossRef]
- Hashimoto, I.; Oshima, T. Claudins and Gastric Cancer: An Overview. Cancers 2022, 14, 290. [Google Scholar] [CrossRef]
- Zhou, Y.; Xiang, Y.; Liu, S.; Li, C.; Dong, J.; Kong, X.; Ji, X.; Cheng, X.; Zhang, L. RIPK3 signaling and its role in regulated cell death and diseases. Cell Death Discov. 2024, 10, 200. [Google Scholar] [CrossRef]
- Xu, X.; Guo, Y.; Liu, M.; Hu, Y.; Li, S. Advancements in the clinical application of gene methylation for early cancer detection. Front. Epigenet. Epigenom. 2024, 2, 1430294. [Google Scholar] [CrossRef]
- Souza, M.C.; Nunes, S.; Figuerêdo, S.H.S.; de Almeida, B.S.; Santos, I.P.C.; Cassali, G.D.; Arruda, S.M.; Cardoso, T.M.S.; Estrela-Lima, A.; Damasceno, K.A. Versican Proteolysis by ADAMTS: Understanding Versikine Expression in Canine Spontaneous Mammary Carcinomas. Cancers 2024, 16, 4057. [Google Scholar] [CrossRef] [PubMed]
- Mou, K.; Wang, H.; Zhu, S.; Luo, J.; Wang, J.; Peng, L.; Lei, Y.; Zhang, Y.; Huang, S.; Zhao, H.; et al. Comprehensive analysis of the prognostic and immunological role of cavins in non-small cell lung cancer. BMC Cancer 2024, 24, 1525. [Google Scholar] [CrossRef] [PubMed]
- Kang, S.U.; Cho, S.Y.; Jeong, H.; Han, J.; Chae, H.Y.; Yang, H.; Sung, C.O.; Choi, Y.-L.; Shin, Y.K.; Kwon, M.J. Matrix Metalloproteinase 11 (MMP11) in Macrophages Promotes the Migration of HER2-Positive Breast Cancer Cells and Monocyte Recruitment through CCL2–CCR2 Signaling. Lab. Investig. 2022, 102, 376–390. [Google Scholar] [CrossRef]
- You, K.; Su, F.; Liu, L.; Lv, X.; Zhang, J.; Zhang, Y.; Liu, B. SCARA5 Plays a Critical Role in the Progression and Metastasis of Breast Cancer by Inactivating the ERK1/2, STAT3, and AKT Signaling Pathways. Mol. Cell. Biochem. 2017, 435, 47–58. [Google Scholar] [CrossRef]
- Rasras, S.; Akade, E.; Mohammadianinejad, S.E.; Barahman, M.; Bahadoram, M. Early growth response 1 transcription factor and its context-dependent functions in glioblastoma. Contemp. Oncol. 2024, 28, 91–97. [Google Scholar] [CrossRef]
- Fontanil, T.; Álvarez-Teijeiro, S.; Villaronga, M.Á.; Mohamedi, Y.; Solares, L.; Moncada-Pazos, A.; Vega, J.A.; García-Suárez, O.; Pérez-Basterrechea, M.; García-Pedrero, J.M.; et al. Cleavage of Fibulin-2 by the aggrecanases ADAMTS-4 and ADAMTS-5 contributes to the tumorigenic potential of breast cancer cells. Oncotarget 2017, 8, 13716–13729. [Google Scholar] [CrossRef]
- Han, Q.; Qiu, S.; Hu, H.; Li, W.; Li, X. Role of Caveolae family-related proteins in the development of breast cancer. Front. Mol. Biosci. 2023, 10, 1242426. [Google Scholar] [CrossRef]
- De Vega, R.G.; Clases, D.; Fernández-Sánchez, M.L.; Eiró, N.; González, L.O.; Vizoso, F.J.; Doble, P.A.; Sanz-Medel, A. MMP-11 as a biomarker for metastatic breast cancer by immunohistochemical-assisted imaging mass spectrometry. Anal. Bioanal. Chem. 2018, 411, 639–646. [Google Scholar] [CrossRef]
- SCARA5 Scavenger Receptor Class A Member 5. National Center of Biotechnology Information. 2025. Available online: https://www.ncbi.nlm.nih.gov/gene/?term=286133 (accessed on 30 May 2025).
- Ni, Q.; Li, X.; Huang, H.; Ge, Z. Decreased expression of SCARA5 predicts a poor prognosis in melanoma using bioinformatics analysis. Front. Oncol. 2023, 13, 1015358. [Google Scholar] [CrossRef]
- Inoue, K.; Fry, E.A. Tumor suppression by the EGR1, DMP1, ARF, p53, and PTEN Network. Cancer Investig. 2018, 36, 520–536. [Google Scholar] [CrossRef] [PubMed]
- EGR1 Early Growth Response 1. National Center of Biotechnology Information. 2025. Available online: https://www.ncbi.nlm.nih.gov/gene?Cmd=DetailsSearch&Db=gene&Term=1958&utm_source=chatgpt.com (accessed on 30 May 2025).
- Hansson, M.L.; Behmer, S.; Ceder, R.; Mohammadi, S.; Preta, G.; Grafström, R.C.; Fadeel, B.; Wallberg, A.E. MAML1 Acts Cooperatively with EGR1 to Activate EGR1-Regulated Promoters: Implications for Nephrogenesis and the Development of Renal Cancer. PLoS ONE 2012, 7, e46001. [Google Scholar] [CrossRef] [PubMed]
- Ho, L.-C.; Sung, J.M.; Shen, Y.T.; Jheng, H.F.; Chen, S.H.; Tsai, P.J.; Tsai, Y.S. Egr-1 deficiency protects from renal inflammation and fibrosis. J. Mol. Med. 2016, 94, 933–942. [Google Scholar] [CrossRef] [PubMed]
- Xie, H. The Epigenetic Role of EGR1 During Postnatal Brain Development and in Neuronal Activity. Ph.D. Thesis, Virginia Polytechnic Institute and State University, Blacksburg, VA, USA, 2020. Available online: https://grantome.com/grant/NIH/R01-NS094574-05?utm_source=chatgpt.com (accessed on 30 May 2025).
- Shajahan-Haq, A.N.; Boca, S.M.; Jin, L.; Bhuvaneshwar, K.; Gusev, Y.; Cheema, A.K.; Demas, D.D.; Raghavan, K.S.; Michalek, R.; Madhavan, S.; et al. EGR1 regulates cellular metabolism and survival in endocrine resistant breast cancer. Oncotarget 2017, 8, 96865–96884. [Google Scholar] [CrossRef]
- Xie, Y.; Wen, X.; Jiang, Z.; Fu, H.Q.; Han, H.; Dai, L. Aquaporin 1 and aquaporin 4 are involved in invasion of lung cancer cells. Clin. Lab. 2012, 58, 75–80. [Google Scholar]
- Hu, Q.; Li, Y.; Li, D.; Yuan, Y.; Wang, K.; Yao, L.; Cheng, Z.; Han, T. Amino acid metabolism regulated by lncRNAs: The propellant behind cancer metabolic reprogramming. Cell Commun. Signal. 2023, 21, 87. [Google Scholar] [CrossRef]
- Yang, W.; Qiu, C.; Biswas, N.; Jin, J.; Watkins, S.C.; Montelaro, R.C.; Coyne, C.B.; Wang, T. Correlation of the Tight Junction-like Distribution of Claudin-1 to the Cellular Tropism of Hepatitis C Virus. J. Biol. Chem. 2008, 283, 8643–8653. [Google Scholar] [CrossRef]
- Soini, Y. Tight junctions in lung cancer and lung metastasis: A review. Int. J. Clin. Exp. Pathol. 2012, 5, 126–136. [Google Scholar]
- Li, Q.; Zhang, Q.; Wang, C.; Li, N.; Li, J. Invasion of enteropathogenic Escherichia coli into host cells through epithelial tight junctions. FEBS J. 2008, 275, 6022–6032. [Google Scholar] [CrossRef]
- Walter, R.F.H.; Walter, R.F.; Mairinger, F.D.; Werner, R.; Vollbrecht, C.; Hager, T.; Schmid, K.W.; Wohlschlaeger, J.; Christoph, D.C. Folic-acid metabolism and DNA-repair phenotypes differ between neuroendocrine lung tumors and associate with aggressive subtypes, therapy resistance and outcome. Oncotarget 2016, 7, 20166–20179. [Google Scholar] [CrossRef]
- Han, X.; Chen, L.; Hu, Z.; Chen, L.; Sun, P.; Wang, Y.; Liu, Y. Identification of proteins related with pemetrexed resistance by iTRAQ and PRM-based comparative proteomic analysis and exploration of IGF2BP2 and FOLR1 functions in non-small cell lung cancer cells. J. Proteom. 2021, 237, 104122. [Google Scholar] [CrossRef] [PubMed]
- Nawaz, F.Z.; Kipreos, E.T. Emerging roles for folate receptor FOLR1 in signaling and cancer. Trends Endocrinol. Metab. 2022, 33, 159–174. [Google Scholar] [CrossRef] [PubMed]
- Ahmed, F. Integrated Network Analysis Reveals FOXM1 and MYBL2 as Key Regulators of Cell Proliferation in Non-small Cell Lung Cancer. Front. Oncol. 2019, 9, 1011. [Google Scholar] [CrossRef] [PubMed]
- Nebert, D.W.; Liu, Z. SLC39A8 gene encoding a metal ion transporter: Discovery and bench to bedside. Hum. Genom. 2019, 13, 51. [Google Scholar] [CrossRef]
- Li, J.; Yang, D.; Lin, L.; Yu, L.; Chen, L.; Lu, K.; Lan, J.; Zeng, Y.; Xu, Y. Important functions and molecular mechanisms of aquaporins family on respiratory diseases: Potential translational values. J. Cancer 2024, 15, 6073–6085. [Google Scholar] [CrossRef]
- Lin, G.; Chen, L.; Lin, L.; Lin, H.; Guo, Z.; Xu, Y.; Hu, C.; Fu, J.; Lin, Q.; Chen, W.; et al. Comprehensive Analysis of Aquaporin Superfamily in Lung Adenocarcinoma. Front. Mol. Biosci. 2021, 8, 736367. [Google Scholar] [CrossRef]
- Han, Y.; Wang, X.; Xu, M.; Teng, Z.; Qin, R.; Tan, G.; Li, P.; Sun, P.; Liu, H.; Chen, L.; et al. Aspartoacylase promotes the process of tumour development and is associated with immune infiltrates in gastric cancer. BMC Cancer 2023, 23, 604. [Google Scholar] [CrossRef]
- Liu, J.; Yang, H.; Yin, D.; Jia, Y.; Li, S.; Liu, Y. Expression and prognostic analysis of CLDN18 and Claudin18.2 in lung adenocarcinoma. Pathol.-Res. Pract. 2022, 238, 154068. [Google Scholar] [CrossRef]
- Varaganti, P.; Buddolla, V.; Lakshmi, B.A.; Kim, Y.-J. Recent advances in using folate receptor 1 (FOLR1) for cancer diagnosis and treatment, with an emphasis on cancers that affect women. Life Sci. 2023, 326, 121802. [Google Scholar] [CrossRef]
- Lee, Y.; Wu, Z.; Yang, S.; Schreiner, S.M.; Gonzalez-Smith, L.D.; Rhie, S.K. Characterizing and Targeting Genes Regulated by Transcription Factor MYBL2 in Lung Adenocarcinoma Cells. Cancers 2022, 14, 4979. [Google Scholar] [CrossRef]
- Zhou, H.; Zhu, Y.; Qi, H.; Liang, L.; Wu, H.; Yuan, J.; Hu, Q. Evaluation of the prognostic values of solute carrier (SLC) family 39 genes for patients with lung adenocarcinoma. Aging 2021, 13, 5312–5331. [Google Scholar] [CrossRef] [PubMed]
- Holzinger, A.; Saranti, A.; Molnar, C.; Biecek, P.; Samek, W. Explainable AI Methods—A Brief Overview. In xxAI-Beyond Explainable AI; Holzinger, A., Goebel, R., Fong, R., Moon, T., Müller, K.-R., Samek, W., Eds.; Lecture Notes in Computer Science; Springer International Publishing: Cham, Switzerland, 2022; Volume 13200, pp. 13–38. [Google Scholar] [CrossRef]
- Zhang, Y.; Parmigiani, G.; Johnson, W.E. ComBat-seq: Batch effect adjustment for RNA-seq count data. NAR Genom. Bioinform. 2020, 2, lqaa078. [Google Scholar] [CrossRef] [PubMed]
- GEO Accession Viewer. Available online: https://www.ncbi.nlm.nih.gov/geo/query/acc.cgi?acc=GSE184336 (accessed on 30 May 2025).
- Naidu, G.; Zuva, T.; Sibanda, E.M. A Review of Evaluation Metrics in Machine Learning Algorithms. In Artificial Intelligence Application in Networks and Systems, Proceedings of the 12th Computer Science Online Conference 2023, Online, 3–5 April 2023; Silhavy, R., Silhavy, P., Eds.; Lecture Notes in Networks and Systems; Springer: Cham, Switzerland, 2023; Volume 724. [Google Scholar] [CrossRef]
- Schober, P.; Vetter, T.R. Kaplan-Meier curves, log-rank tests, and cox regression for time-to-event data. Anesth. Analg. 2021, 132, 969–970. [Google Scholar] [CrossRef] [PubMed]


| Feature Ranking | Classifier | Settings | Accuracy | Kappa |
|---|---|---|---|---|
| None | LR | Default | 0.8817 | 0.7636 |
| None | RF | Default | 0.9355 | 0.8712 |
| None | SVM | Default | 0.8387 | 0.6781 |
| XGB | LR | Top 500 features | 0.9247 | 0.8496 |
| XGB | RF | Top 500 features | 0.9462 | 0.8924 |
| XGB | SVM | Top 500 features | 0.9354 | 0.8710 |
| LASSO | RF | Default | 0.9234 | 0.8312 |
| LASSO | SVM | Default | 0.9125 | 0.8516 |
| RFE | RF | RFE with estimator RF | 0.9218 | 0.8200 |
| RFE | SVM | RFE with an estimator SVM | 0.9213 | 0.8010 |
| Variance Threshold | RF | Default with threshold value 0.05 | 0.9351 | 0.8700 |
| Feature Ranking | Classifier | Settings | Accuracy | Kappa |
|---|---|---|---|---|
| None | LR | Default | 0.9864 | 0.9212 |
| None | RF | Default | 0.9755 | 0.8482 |
| None | SVM | Default | 0.9764 | 0.9079 |
| XGB | LR | Top 500 features | 0.9918 | 0.9532 |
| XGB | RF | Top 500 features | 0.9837 | 0.9201 |
| XGB | SVM | Top 500 features | 0.9864 | 0.9179 |
| LASSO | RF | Default | 0.9861 | 0.9168 |
| LASSO | SVM | Default | 0.9723 | 0.9126 |
| RFE | RF | RFE with estimator RF | 0.9771 | 0.8902 |
| RFE | SVM | RFE with an estimator SVM | 0.9674 | 0.9072 |
| Variance threshold | RF | Default with threshold value 0.05 | 0.9882 | 0.92684 |
| Feature Ranking | Classifier | Settings | Accuracy | Kappa |
|---|---|---|---|---|
| None | LR | Default | 0.9705 | 0.9412 |
| None | RF | Default | 0.9710 | 0.9405 |
| None | SVM | Default | 0.9712 | 0.9423 |
| XGB | LR | Top 500 features | 0.9882 | 0.9509 |
| XGB | RF | Top 500 features | 0.9822 | 0.9868 |
| XGB | SVM | Top 500 features | 0.9941 | 0.9645 |
| LASSO | RF | Default | 0.9861 | 0.9568 |
| LASSO | SVM | Default | 0.9723 | 0.9626 |
| RFE | RF | RFE with estimator RF | 0.9771 | 0.9432 |
| RFE | SVM | RFE with an estimator SVM | 0.9712 | 0.9412 |
| Variance Threshold | RF | Default with threshold value 0.05 | 0.9687 | 0.9126 |
| Feature Ranking | Classifier | Settings | AUC-ROC | Accuracy | Kappa |
|---|---|---|---|---|---|
| None | LR | Default | 0.908 | 0.722 | 0.665 |
| None | RF | Default | 0.890 | 0.747 | 0.701 |
| None | SVM | Default | 0.920 | 0.723 | 0.721 |
| XGB | LR | Top 500 features | 0.924 | 0.750 | 0.690 |
| XGB | RF | Top 500 features | 0.924 | 0.782 | 0.721 |
| XGB | SVM | Top 500 features | 0.935 | 0.786 | 0.740 |
| EntrezID | Gene | Pathway | Role in Gastric Cancer |
|---|---|---|---|
| 84733 | CBX2 | Polycomb repressive complex | Epigenetic silencing of tumor suppressor genes in gastric cancer [22]. |
| 9076 | CLDN1 | Cell adhesion molecules | Regulates gastric tumor cell adhesion, invasion, and metastasis [31]. |
| Virion-Hepatitis viruses | Hepatitis viruses may contribute to gastric cancer via chronic inflammation [32]. | ||
| Leukocyte transendothelial migration | Regulates immune infiltration in gastric tumor microenvironment [33]. | ||
| Hepatitis C | Chronic infection may promote gastric carcinogenesis [34]. | ||
| Tight junction | Dysfunction promotes gastric cancer cell invasion and metastasis [35]. | ||
| Pathogenic Escherichia coli infection | Chronic infection may alter gastric epithelial integrity [36]. | ||
| 5228 | PGF | Focal adhesion | Mediates gastric cancer cell migration and invasion [37]. |
| Rap1 signaling pathway | Regulates gastric cancer cell adhesion and proliferation [38]. | ||
| Ras signaling pathway | Frequently mutated in gastric cancer, promoting cell proliferation [39]. | ||
| MAPK signaling pathway | Key driver of gastric cancer proliferation and survival [40]. | ||
| PI3K-Akt signaling pathway | Promotes gastric cancer growth and resistance to apoptosis [41]. | ||
| 8767 | RIPK2 | Neurotrophin signaling pathway | Involved in gastric cancer cell survival and proliferation [42]. |
| Tuberculosis | Chronic inflammation may contribute to gastric tumorigenesis [43]. | ||
| NOD-like receptor signaling pathway | Regulates inflammation-associated gastric carcinogenesis [44]. | ||
| Shigellosis | Infection-induced inflammation linked to gastric cancer risk [45]. | ||
| Salmonella infection | May contribute to gastric carcinogenesis via inflammation [46]. | ||
| 6383 | SDC2 | Cell adhesion molecules | Regulates gastric tumor cell adhesion, invasion, and metastasis [47]. |
| Malaria | Endothelial dysfunction linked to gastric disease progression [48]. | ||
| Fluid shear stress and atherosclerosis | Gastric cancer angiogenesis and microenvironment remodeling [49]. | ||
| Proteoglycans in cancer | Involved in gastric tumor progression and microenvironment interactions [50]. |
| Datasets | Genes | Samples | No. of Classes | Categories |
|---|---|---|---|---|
| Gastric cancer | 58736 | 461 | 2 | Gastric tumor (231) Paired normal tissue (230) |
| Breast cancer | 31576 | 1224 | 2 | Primary tumor (1111) Normal solid tissue (113) |
| Lung cancer | 31507 | 562 | 2 | Primary tumor (511) Normal solid tissue (51) |
Disclaimer/Publisher’s Note: The statements, opinions and data contained in all publications are solely those of the individual author(s) and contributor(s) and not of MDPI and/or the editor(s). MDPI and/or the editor(s) disclaim responsibility for any injury to people or property resulting from any ideas, methods, instructions or products referred to in the content. |
© 2025 by the authors. Licensee MDPI, Basel, Switzerland. This article is an open access article distributed under the terms and conditions of the Creative Commons Attribution (CC BY) license (https://creativecommons.org/licenses/by/4.0/).
Share and Cite
Ghuriani, V.; Wassan, J.T.; Tripathi, P.; Chauhan, A. XGB-BIF: An XGBoost-Driven Biomarker Identification Framework for Detecting Cancer Using Human Genomic Data. Int. J. Mol. Sci. 2025, 26, 5590. https://doi.org/10.3390/ijms26125590
Ghuriani V, Wassan JT, Tripathi P, Chauhan A. XGB-BIF: An XGBoost-Driven Biomarker Identification Framework for Detecting Cancer Using Human Genomic Data. International Journal of Molecular Sciences. 2025; 26(12):5590. https://doi.org/10.3390/ijms26125590
Chicago/Turabian StyleGhuriani, Veena, Jyotsna Talreja Wassan, Priyal Tripathi, and Anshika Chauhan. 2025. "XGB-BIF: An XGBoost-Driven Biomarker Identification Framework for Detecting Cancer Using Human Genomic Data" International Journal of Molecular Sciences 26, no. 12: 5590. https://doi.org/10.3390/ijms26125590
APA StyleGhuriani, V., Wassan, J. T., Tripathi, P., & Chauhan, A. (2025). XGB-BIF: An XGBoost-Driven Biomarker Identification Framework for Detecting Cancer Using Human Genomic Data. International Journal of Molecular Sciences, 26(12), 5590. https://doi.org/10.3390/ijms26125590