

DPPPRED-IV: An Ensembled QSAR-Based Web Server for the Prediction of Dipeptidyl Peptidase 4 Inhibitors

 , ,
, ,  , , and
Abstract
1. Introduction
2. Results
2.1. Feature Selection, Classification Model Development, and Optimization for Predicting DPP4 Inhibition
2.2. Feature Selection, Regression Model Development, and Optimization for Predicting DPP4 Inhibition (IC50)
2.3. DPPPRED-IV Web Server
2.4. Case Study: Application of DPPPRED-IV to the MolPort Database
3. Discussion
4. Materials and Methods
4.1. Data Collection and Curation
- a.
- Removal of salts and waters: All associated salts and water molecules were removed to ensure chemical consistency and eliminate confounding molecular components.
- b.
- Duplicate handling: A comprehensive check for duplicates was performed to prevent redundancy and bias:
- i.
- For duplicates with identical response values (binary classification or IC50) values, only one entry was retained.
- In the case of the regression dataset, for duplicates with slightly different IC50 values (within a predefined threshold of standard deviation/mean < 0.2), the geometric mean was calculated and used to represent the compound’s activity. Moreover, a log transformation is performed in order to obtain pIC50.
- i.
- If the variation between IC50 values exceeded the threshold, the corresponding entries were excluded from the dataset to preserve data integrity.
4.2. Feature Calculation
4.3. Initial Feature Reduction
- Removal of constant and infinite values: Descriptors with constant values across all compounds or containing infinite values were removed, as they do not contribute to compound differentiation and may compromise model robustness.
- Elimination of highly correlated descriptors: To reduce redundancy and mitigate multicollinearity, pairwise Pearson correlation coefficients were computed across all descriptors. When two descriptors showed a correlation greater than 0.90, only one was retained.
4.4. Train and Validation Set Splits
4.5. Feature Selection and Model Generation
4.6. Hyperparameter Tunning
4.7. QSAR Performance Evaluation
4.8. Ensemble Expert System
4.9. Applicability Domain
4.10. Web Server Development
4.11. DPP4 Enzymatic Activity Assay
5. Conclusions
Supplementary Materials
Author Contributions
Funding
Institutional Review Board Statement
Informed Consent Statement
Data Availability Statement
Conflicts of Interest
Abbreviations
| AD | Applicability Domain |
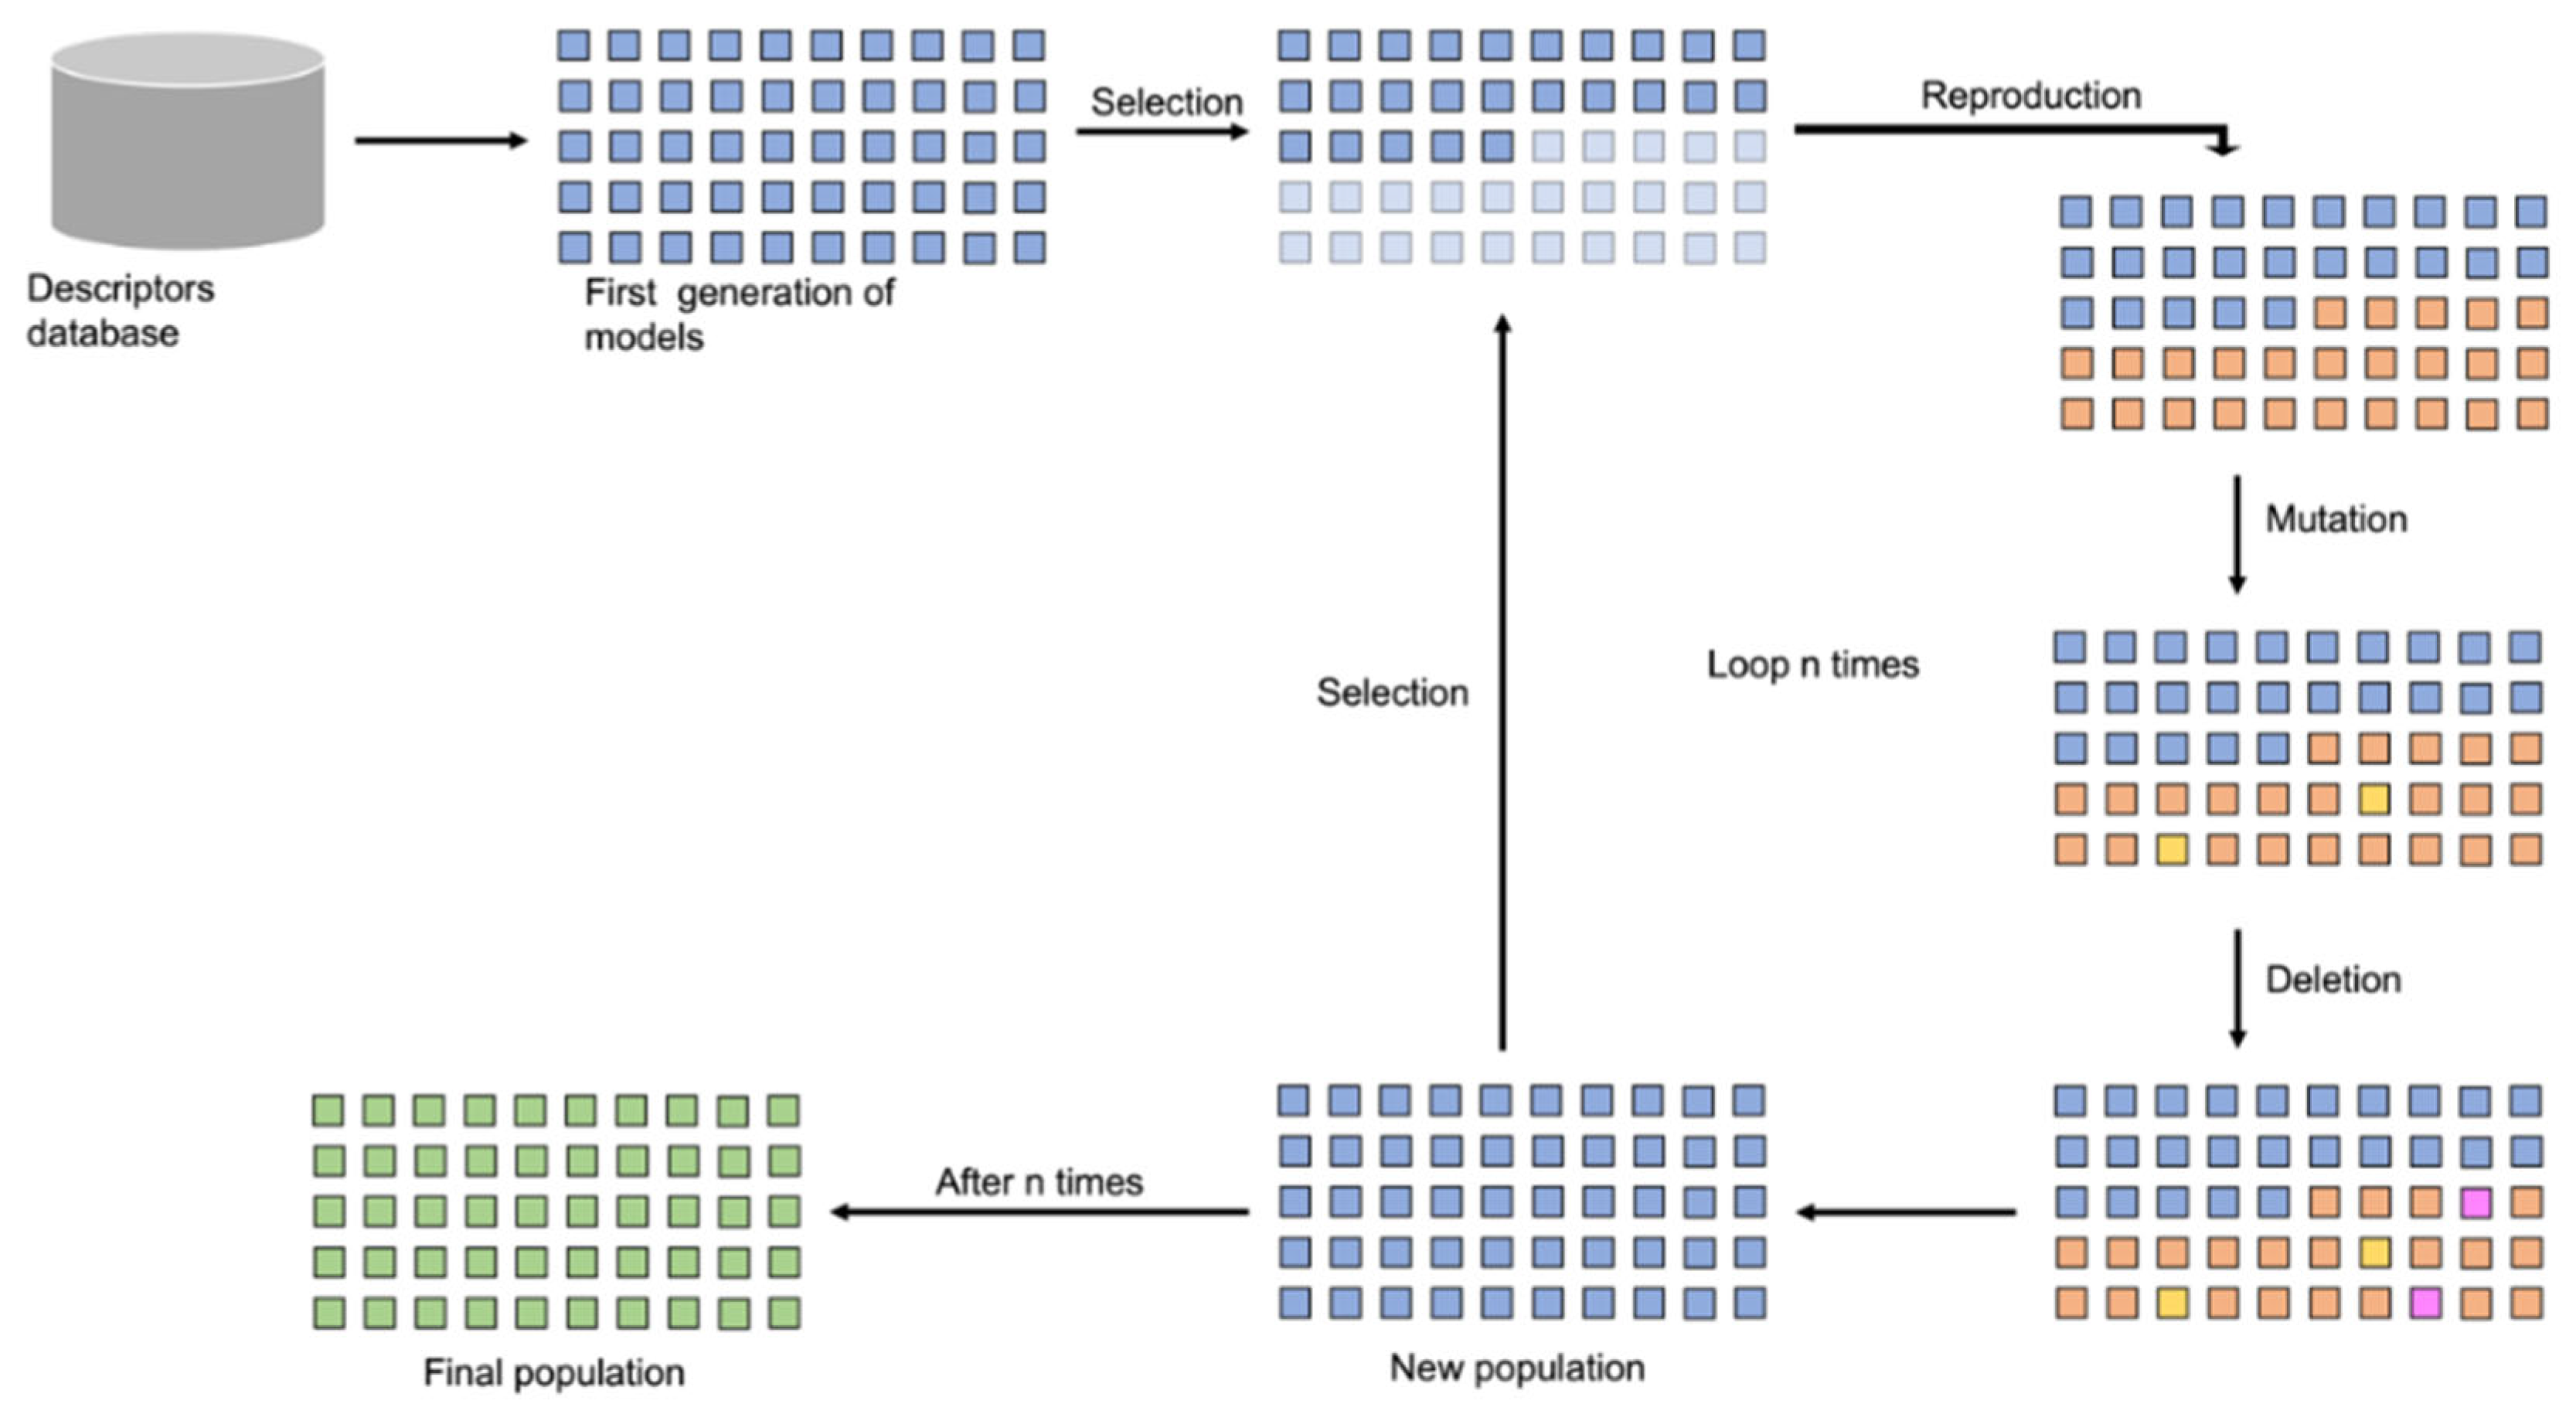
| GA | Genetic algorithm |
| HV | Hard voting |
| DPP4 | Dipeptidyl peptidase-4 |
| DPP4is | DPP4 inhibitors |
| FNR | False Negative Rate |
| FPR | False Positive Rate |
| GIP | Glucose-dependent insulinotropic polypeptide |
| GLP-1 | Glucagon-like peptide-1 |
| kNN | k-Nearest Neighbors |
| MCC | Matthews Correlation Coefficient |
| ML | Machine learning |
| PPV | Positive Predicted Value |
| PYY | Peptide Tyrosine-Tyrosine |
| QSAR | Quantitative Structure–Activity Relationship |
| SGLT2 | Sodium-glucose transport protein 2 |
| SV | Soft voting |
| T1DM | Type 1 diabetes mellitus |
| T2DM | Type 2 diabetes mellitus |
| TS | Training set |
| VS | Validation set |
References
- IDF Diabetes Atlas | Global Diabetes Data & Statistics. Available online: https://diabetesatlas.org/ (accessed on 8 April 2025).
- IDF Diabetes Atlas, 10th ed.; International Diabetes Federation: Brussels, Belgium, 2021.
- Defronzo, R.A. From the Triumvirate to the Ominous Octet: A New Paradigm for the Treatment of Type 2 Diabetes Mellitus. Diabetes 2009, 58, 773. [Google Scholar] [CrossRef] [PubMed]
- Solis-Herrera, C.; Triplitt, C.; Reasner, C.; DeFronzo, R.A.; Cersosimo, E. Classification of Diabetes Mellitus. In Endotext [Internet]; Feingold, K.R., Ahmed, S.F., Anawalt, B., Blackman, M.R., Boyce, A., Chrousos, G., Corpas, E., de Herder, W.W., Dhatariya, K., Dungan, K., et al., Eds.; MDText.com, Inc.: South Dartmouth, MA, USA, 2000. Available online: https://www.ncbi.nlm.nih.gov/books/NBK279119/ (accessed on 10 March 2023).
- Zheng, Y.; Ley, S.H.; Hu, F.B. Global Aetiology and Epidemiology of Type 2 Diabetes Mellitus and Its Complications. Nat. Rev. Endocrinol. 2018, 14, 88–98. [Google Scholar] [CrossRef] [PubMed]
- DeFronzo, R.A.; Ferrannini, E.; Groop, L.; Henry, R.R.; Herman, W.H.; Holst, J.J.; Hu, F.B.; Kahn, C.R.; Raz, I.; Shulman, G.I.; et al. Type 2 Diabetes Mellitus. Nat. Rev. Dis. Primers 2015, 1, 15019. [Google Scholar] [CrossRef]
- Stumvoll, M.; Goldstein, B.J.; Van Haeften, T.W. Type 2 Diabetes: Principles of Pathogenesis and Therapy. Lancet 2005, 365, 1333–1346. [Google Scholar] [CrossRef]
- Reaven, G.M. Banting Lecture 1988. Role of Insulin Resistance in Human Disease. Diabetes 1988, 37, 1595–1607. [Google Scholar] [CrossRef]
- Kasuga, M. Insulin Resistance and Pancreatic Beta Cell Failure. J. Clin. Investig. 2006, 116, 1756–1760. [Google Scholar] [CrossRef]
- Fujisaka, S.; Ussar, S.; Clish, C.; Devkota, S.; Dreyfuss, J.M.; Sakaguchi, M.; Soto, M.; Konishi, M.; Softic, S.; Altindis, E.; et al. Antibiotic Effects on Gut Microbiota and Metabolism Are Host Dependent. J. Clin. Investig. 2016, 126, 4430–4443. [Google Scholar] [CrossRef] [PubMed]
- Bornfeldt, K.E.; Tabas, I. Insulin Resistance, Hyperglycemia, and Atherosclerosis. Cell Metab. 2011, 14, 575–585. [Google Scholar] [CrossRef]
- Hopsu-Havu, V.K.; Glenner, G.G. A New Dipeptide Naphthylamidase Hydrolyzing Glycyl-Prolyl-Beta-Naphthylamide. Histochemie 1966, 7, 197–201. [Google Scholar] [CrossRef]
- Mentlein, R. Dipeptidyl-Peptidase IV (CD26)-Role in the Inactivation of Regulatory Peptides. Regul. Pept. 1999, 85, 9–24. [Google Scholar] [CrossRef]
- Demuth, H.U.; McIntosh, C.H.S.; Pederson, R.A. Type 2 Diabetes—Therapy with Dipeptidyl Peptidase IV Inhibitors. Biochim. Biophys. Acta (BBA)—Proteins Proteom. 2005, 1751, 33–44. [Google Scholar] [CrossRef] [PubMed]
- Yu, D.M.T.; Yao, T.W.; Chowdhury, S.; Nadvi, N.A.; Osborne, B.; Church, W.B.; McCaughan, G.W.; Gorrell, M.D. The Dipeptidyl Peptidase IV Family in Cancer and Cell Biology. FEBS J. 2010, 277, 1126–1144. [Google Scholar] [CrossRef]
- Lambeir, A.M.; Durinx, C.; Scharpé, S.; De Meester, I. Dipeptidyl-Peptidase IV from Bench to Bedside: An Update on Structural Properties, Functions, and Clinical Aspects of the Enzyme DPP IV. Crit. Rev. Clin. Lab. Sci. 2008, 40, 209–294. [Google Scholar] [CrossRef] [PubMed]
- Olivares, M.; Schüppel, V.; Hassan, A.M.; Beaumont, M.; Neyrinck, A.M.; Bindels, L.B.; Benítez-Páez, A.; Sanz, Y.; Haller, D.; Holzer, P.; et al. The Potential Role of the Dipeptidyl Peptidase-4-like Activity from the Gut Microbiota on the Host Health. Front. Microbiol. 2018, 9, 1900. [Google Scholar] [CrossRef]
- Ohnuma, K.; Dang, N.H.; Morimoto, C. Revisiting an Old Acquaintance: CD26 and Its Molecular Mechanisms in T Cell Function. Trends Immunol. 2008, 29, 295–301. [Google Scholar] [CrossRef]
- Bell, G.I.; Santerre, R.F.; Mullenbach, G.T. Hamster Preproglucagon Contains the Sequence of Glucagon and Two Related Peptides. Nature 1983, 302, 716–718. [Google Scholar] [CrossRef] [PubMed]
- Ørskov, C.; Holst, J.J.; Knuhtsen, S.; Baldissera, F.G.A.; Poulsen, S.S.; Nielsen, O.V. Glucagon-Like Peptides GLP-1 and GLP-2, Predicted Products of the Glucagon Gene, Are Secreted Separately from Pig Small Intestine but Not Pancreas. Endocrinology 1986, 119, 1467–1475. [Google Scholar] [CrossRef]
- Mojsov, S.; Weir, G.C.; Habener, J.F. Insulinotropin: Glucagon-like Peptide I (7-37) Co-Encoded in the Glucagon Gene Is a Potent Stimulator of Insulin Release in the Perfused Rat Pancreas. J. Clin. Investig. 1987, 79, 616–619. [Google Scholar] [CrossRef]
- Holst, J.J.; Ørskov, C.; Vagn Nielsen, O.; Schwartz, T.W. Truncated Glucagon-like Peptide I, an Insulin-Releasing Hormone from the Distal Gut. FEBS Lett. 1987, 211, 169–174. [Google Scholar] [CrossRef]
- Ørskov, C.; Holst, J.J.; Nielsen, O.V. Effect of Truncated Glucagon-Like Peptide-1 [Proglucagon-(78–107) Amide] on Endocrine Secretion from Pig Pancreas, Antrum, and Nonantral Stomach. Endocrinology 1988, 123, 2009–2013. [Google Scholar] [CrossRef]
- Kreymann, B.; Ghatei, M.A.; Williams, G.; Bloom, S.R. Glucagon-like peptide-1 7-36: A physiological incretin in man. Lancet 1987, 330, 1300–1304. [Google Scholar] [CrossRef]
- Mentlein, R.; Gallwitz, B.; Schmidt, W.E. Dipeptidyl-Peptidase IV Hydrolyses Gastric Inhibitory Polypeptide, Glucagon-like Peptide-1(7–36)Amide, Peptide Histidine Methionine and Is Responsible for Their Degradation in Human Serum. Eur. J. Biochem. 1993, 214, 829–835. [Google Scholar] [CrossRef]
- Deacon, C.F.; Johnsen, A.H.; Holst, J.J. Degradation of Glucagon-like Peptide-1 by Human Plasma in Vitro Yields an N-Terminally Truncated Peptide That Is a Major Endogenous Metabolite in Vivo. J. Clin. Endocrinol. Metab. 1995, 80, 952–957. [Google Scholar] [CrossRef] [PubMed]
- Kieffer, T.J.; Mc Intosh, C.H.S.; Pederson, R.A. Degradation of Glucose-Dependent Insulinotropic Polypeptide and Truncated Glucagon-like Peptide 1 in Vitro and in Vivo by Dipeptidyl Peptidase IV. Endocrinology 1995, 136, 3585–3596. [Google Scholar] [CrossRef] [PubMed]
- Hühn, J.; Ehrlich, S.; Fleischer, B.; Von Bonin, A. Molecular Analysis of CD26-Mediated Signal Transduction in T Cells. Immunol. Lett. 2000, 72, 127–132. [Google Scholar] [CrossRef] [PubMed]
- Mentlein, R. Proline Residues in the Maturation and Degradation of Peptide Hormones and Neuropeptides. FEBS Lett. 1988, 234, 251–256. [Google Scholar] [CrossRef]
- Villhauer, E.B.; Brinkman, J.A.; Naderi, G.B.; Burkey, B.F.; Dunning, B.E.; Prasad, K.; Mangold, B.L.; Russell, M.E.; Hughes, T.E. 1-[[(3-Hydroxy-1-Adamantyl)Amino]Acetyl]-2-Cyano-(S)-Pyrrolidine: A Potent, Selective, and Orally Bioavailable Dipeptidyl Peptidase IV Inhibitor with Antihyperglycemic Properties. J. Med. Chem. 2003, 46, 2774–2789. [Google Scholar] [CrossRef]
- Augeri, D.J.; Robl, J.A.; Betebenner, D.A.; Magnin, D.R.; Khanna, A.; Robertson, J.G.; Wang, A.; Simpkins, L.M.; Taunk, P.; Huang, Q.; et al. Discovery and Preclinical Profile of Saxagliptin (BMS-477118): A Highly Potent, Long-Acting, Orally Active Dipeptidyl Peptidase IV Inhibitor for the Treatment of Type 2 Diabetes. J. Med. Chem. 2005, 48, 5025–5037. [Google Scholar] [CrossRef]
- Rasmussen, H.B.; Branner, S.; Wiberg, F.C.; Wagtmann, N. Crystal Structure of Human Dipeptidyl Peptidase IV/CD26 in Complex with a Substrate Analog. Nat. Struct. Biol. 2003, 10, 19–25. [Google Scholar] [CrossRef]
- Kim, D.; Wang, L.; Beconi, M.; Eiermann, G.J.; Fisher, M.H.; He, H.; Hickey, G.J.; Kowalchick, J.E.; Leiting, B.; Lyons, K.; et al. (2R)-4-Oxo-4-[3-(Trifluoromethyl)-5,6-Dihydro[1,2,4]Triazolo[4,3-a] Pyrazin-7(8H)-Yl]-1-(2,4,5-Trifluorophenyl)Butan-2-Amine: A Potent, Orally Active Dipeptidyl Peptidase IV Inhibitor for the Treatment of Type 2 Diabetes. J. Med. Chem. 2005, 48, 141–151. [Google Scholar] [CrossRef]
- Feng, J.; Zhang, Z.; Wallace, M.B.; Stafford, J.A.; Kaldor, S.W.; Kassel, D.B.; Navre, M.; Shi, L.; Skene, R.J.; Asakawa, T.; et al. Discovery of Alogliptin: A Potent, Selective, Bioavailable, and Efficacious Inhibitor of Dipeptidyl Peptidase IV. J. Med. Chem. 2007, 50, 2297–2300. [Google Scholar] [CrossRef] [PubMed]
- Eckhardt, M.; Langkopf, E.; Mark, M.; Tadayyon, M.; Thomas, L.; Nar, H.; Pfrengle, W.; Guth, B.; Lotz, R.; Sieger, P.; et al. 8-(3-(R)-Aminopiperidin-1-Yl)-7-but-2-Ynyl-3-Methyl-1-(4-Methyl-Quinazolin-2-Ylmethyl)-3,7-Dihydropurine-2,6-Dione (BI 1356), a Highly Potent, Selective, Long-Acting, and Orally Bioavailable DPP-4 Inhibitor for the Treatment of Type 2 Diabetes. J. Med. Chem. 2007, 50, 6450–6453. [Google Scholar] [CrossRef] [PubMed]
- Gu, N.; Park, S.I.; Chung, H.; Jin, X.; Lee, S.; Kim, T.E. Possibility of Pharmacokinetic Drug Interaction between a DPP-4 Inhibitor and a SGLT2 Inhibitor. Transl. Clin. Pharmacol. 2020, 28, 17. [Google Scholar] [CrossRef]
- Biftu, T.; SinhaRoy, R. DPP-4 Inhibitors. In Comprehensive Medicinal Chemistry III; Elsevier: Amsterdam, The Netherlands, 2017; pp. 512–555. [Google Scholar] [CrossRef]
- U.S. Food and Drug Administration. Center for Drug Evaluation and Research. In NDA 209091Orig1s000: Pharmaceutical Review; U.S. FDA: Silver Spring, MD, USA, 2017. Available online: https://www.accessdata.fda.gov/drugsatfda_docs/nda/2017/209091Orig1s000PharmR.pdf (accessed on 10 March 2023).
- Kishimoto, M. Teneligliptin: A DPP-4 Inhibitor for the Treatment of Type 2 Diabetes. Diabetes Metab. Syndr. Obes. 2013, 6, 187. [Google Scholar] [CrossRef]
- Deacon, C.F. Dipeptidyl Peptidase-4 Inhibitors in the Treatment of Type 2 Diabetes: A Comparative Review. Diabetes Obes. Metab. 2011, 13, 7–18. [Google Scholar] [CrossRef]
- Mulvihill, E.E.; Drucker, D.J. Pharmacology, Physiology, and Mechanisms of Action of Dipeptidyl Peptidase-4 Inhibitors. Endocr. Rev. 2014, 35, 992–1019. [Google Scholar] [CrossRef] [PubMed]
- Morimoto, C.; Schlossman, S.F. The Structure and Function of CD26 in the T-Cell Immune Response. Immunol. Rev. 1998, 161, 55–70. [Google Scholar] [CrossRef]
- Wu, S.; Chai, S.; Yang, J.; Cai, T.; Xu, Y.; Yang, Z.; Zhang, Y.; Ji, L.; Sun, F.; Zhan, S. Gastrointestinal Adverse Events of Dipeptidyl Peptidase 4 Inhibitors in Type 2 Diabetes: A Systematic Review and Network Meta-Analysis. Clin. Ther. 2017, 39, 1780–1789.e33. [Google Scholar] [CrossRef]
- Xu, J.; Hagler, A. Chemoinformatics and Drug Discovery. Molecules 2002, 7, 566–600. [Google Scholar] [CrossRef]
- Wishart, D.S. Introduction to Cheminformatics. Curr. Protoc. Bioinform. 2007, 18, 1–9. [Google Scholar] [CrossRef]
- Brown, A.C.; Fraser, T.R. V.—On the Connection between Chemical Constitution and Physiological Action. Part. I.—On the Physiological Action of the Salts of the Ammonium Bases, Derived from Strychnia, Brucia, Thebaia, Codeia, Morphia, and Nicotia. Trans. R. Soc. Edinb. 1867, 25, 151–203. [Google Scholar] [CrossRef]
- Cai, J.; Li, C.; Liu, Z.; Du, J.; Ye, J.; Gu, Q.; Xu, J. Predicting DPP-IV Inhibitors with Machine Learning Approaches. J. Comput. Aided Mol. Des. 2017, 31, 393–402. [Google Scholar] [CrossRef] [PubMed]
- Gong, J.N.; Zhao, L.; Chen, G.; Chen, X.; Chen, Z.D.; Chen, C.Y.C. A Novel Artificial Intelligence Protocol to Investigate Potential Leads for Diabetes Mellitus. Mol. Divers. 2021, 25, 1375–1393. [Google Scholar] [CrossRef]
- Al-Fakih, A.M.; Algamal, Z.Y.; Lee, M.H.; Aziz, M.; Ali, H.T.M. A QSAR Model for Predicting Antidiabetic Activity of Dipeptidyl Peptidase-IV Inhibitors by Enhanced Binary Gravitational Search Algorithm. SAR QSAR Environ. Res. 2019, 30, 403–416. [Google Scholar] [CrossRef]
- Ma, J.; Sheridan, R.P.; Liaw, A.; Dahl, G.E.; Svetnik, V. Deep Neural Nets as a Method for Quantitative Structure-Activity Relationships. J. Chem. Inf. Model. 2015, 55, 263–274. [Google Scholar] [CrossRef]
- Buiu, C.; Avram, S.; Duda-Seiman, D.; Milac, A.L.; Duda-Seiman, C.; Pacureanu, L.; Borcan, F. More Effective DPP4 Inhibitors as Antidiabetics Based on Sitagliptin Applied QSAR and Clinical Methods. Curr. Comput. Aided-Drug Des. 2015, 10, 237–249. [Google Scholar] [CrossRef] [PubMed]
- Kahn, S.E.; Cooper, M.E.; Del Prato, S. Pathophysiology and Treatment of Type 2 Diabetes: Perspectives on the Past, Present, and Future. Lancet 2014, 383, 1068–1083. [Google Scholar] [CrossRef]
- De Vos, W.M.; Tilg, H.; Van Hul, M.; Cani, P.D. Gut Microbiome and Health: Mechanistic Insights. Gut 2022, 71, 1020–1032. [Google Scholar] [CrossRef]
- Olivares, M.; Hernández-Calderón, P.; Cárdenas-Brito, S.; Liébana-García, R.; Sanz, Y.; Benítez-Páez, A. Gut Microbiota DPP4-like Enzymes Are Increased in Type-2 Diabetes and Contribute to Incretin Inactivation. Genome Biol. 2024, 25, 174. [Google Scholar] [CrossRef]
- Carpio, L.E.; Olivares, M.; Benítez-Paez, A.; Serrano-Candelas, E.; Barigye, S.J.; Sanz, Y.; Gozalbes, R. Comparative Binding Study of Gliptins to Bacterial DPP4-like Enzymes for the Treatment of Type 2 Diabetes Mellitus (T2DM). Int. J. Mol. Sci. 2024, 25, 5744. [Google Scholar] [CrossRef]
- Aljumaah, M.R.; Roach, J.; Hu, Y.; Gunstad, J.; Azcarate-Peril, M.A. Microbial Dipeptidyl Peptidases of the S9B Family as Host-Microbe Isozymes. Sci. Adv. 2025, 11, 5721. [Google Scholar] [CrossRef] [PubMed]
- Wang, K.; Zhang, Z.; Hang, J.; Liu, J.; Guo, F.; Ding, Y.; Li, M.; Nie, Q.; Lin, J.; Zhuo, Y.; et al. Microbial-Host-Isozyme Analyses Reveal Microbial DPP4 as a Potential Antidiabetic Target. Science (1979) 2023, 381, eadd5787. [Google Scholar] [CrossRef]
- Arulmozhiraja, S.; Matsuo, N.; Ishitsubo, E.; Okazaki, S.; Shimano, H.; Tokiwa, H. Comparative Binding Analysis of Dipeptidyl Peptidase IV (DPP-4) with Antidiabetic Drugs -An Ab Initio Fragment Molecular Orbital Study. PLoS ONE 2016, 11, e0166275. [Google Scholar] [CrossRef] [PubMed]
- Batra, A.; Nandi, S.; Bagchi, M.C. QSAR and Pharmacophore Modeling of Indole-Based C-3 Pyridone Compounds as HCV NS5B Polymerase Inhibitors Utilizing Computed Molecular Descriptors. Med. Chem. Res. 2015, 24, 2432–2440. [Google Scholar] [CrossRef]
- Schiffler, M.A.; Antonysamy, S.; Bhattachar, S.N.; Campanale, K.M.; Chandrasekhar, S.; Condon, B.; Desai, P.V.; Fisher, M.J.; Groshong, C.; Harvey, A.; et al. Discovery and Characterization of 2-Acylaminoimidazole Microsomal Prostaglandin e Synthase-1 Inhibitors. J. Med. Chem. 2016, 59, 194–205. [Google Scholar] [CrossRef]
- Wigglesworth, M.; Hodder, P. Hit Discovery Methodology. SLAS Discov. 2021, 26, 165–167. [Google Scholar] [CrossRef] [PubMed]
- Byeon, J.-J.; Park, M.-H.; Shin, S.-H.; Shin, Y.G. Novel Lead Optimization Strategy of BACE I Inhibitors for the Treatment of Alzheimer’s Disease by Quantitative Structure-Activity Relationship (QSAR) and Physiologically-Based Pharmacokinetics (PBPK) Modeling [Poster Presentation]; Korea Pharmaceutical & Bioscience Society Conference, January 2017. Available online: https://cdn.technologynetworks.com/tn/resources/pdf/novel-lead-optimization-strategy-of-bace-i-inhibitors-for-the-treatment-of-alzheimers-disease-by.pdf (accessed on 17 April 2023).
- Cruz, S.; Gomes, S.E.; Borralho, P.M.; Rodrigues, C.M.P.; Gaudêncio, S.P.; Pereira, F. In Silico HCT116 Human Colon Cancer Cell-Based Models En Route to the Discovery of Lead-Like Anticancer Drugs. Biomolecules 2018, 8, 56. [Google Scholar] [CrossRef]
- Li, C.; Lu, W.; Lu, C.; Xiao, W.; Shen, X.; Huang, J.; Liu, G.; Tang, Y. Identification of Diverse Dipeptidyl Peptidase IV Inhibitors via Structure-Based Virtual Screening. J. Mol. Model. 2012, 18, 4033–4042. [Google Scholar] [CrossRef]
- Montes, M.J.O. Computational Approaches for the Characterization of the Dipeptidyl Peptidase IV Inhibition: Applications to Drug Discovery, Drug Design and Binding Site Similarity. Ph.D. Thesis, Universitat Rovira i Virgili, Tarragona, Spain, 2017. [Google Scholar]
- Mendez, D.; Gaulton, A.; Patrícia Bento, A.; Chambers, J.; De Veij, M.; Paula MagariñosMagari, M.; Mosquera, J.F.; Mutowo, P.; Nowotka, M.; Gordillo-Marã, M.; et al. ChEMBL: Towards Direct Deposition of Bioassay Data. Nucleic Acids Res. 2019, 47, D930–D940. [Google Scholar] [CrossRef]
- Martelli, A. Python: Guía de Referencia; Anaya Multimedia, D.L.: Madrid, Spain, 2007. [Google Scholar]
- Landrum, G.; Tosco, P.; Kelley, B.; Sriniker; Ric; Gedeck; Vianello, R.; Schneider, N.; Dalke, A.; N, D.; et al. rdkit/rdkit: 2021_03_2 (Q1 2021) Release (Release_2021_03_2). Zenodo 2021. [Google Scholar] [CrossRef]
- Moriwaki, H.; Tian, Y.S.; Kawashita, N.; Takagi, T. Mordred: A Molecular Descriptor Calculator. J. Cheminform. 2018, 10, 4. [Google Scholar] [CrossRef] [PubMed]
- Todeschini, R.; Consonni, V. Molecular Descriptors for Chemoinformatics; Wiley: Hoboken, NJ, USA, 2010; Volume 2, pp. 1–252. [Google Scholar] [CrossRef]
- Sklearn.Impute.KNNImputer—Scikit-Learn 1.1.1 Documentation. Available online: https://scikit-learn.org/stable/modules/generated/sklearn.impute.KNNImputer.html (accessed on 14 June 2022).
- Sklearn.Preprocessing.StandardScaler—Scikit-Learn 1.3.1 Documentation. Available online: https://scikit-learn.org/stable/modules/generated/sklearn.preprocessing.StandardScaler.html (accessed on 22 September 2023).
- Sklearn.Cluster.KMeans—Scikit-Learn 1.3.1 Documentation. Available online: https://scikit-learn.org/stable/modules/generated/sklearn.cluster.KMeans.html#sklearn.cluster.KMeans (accessed on 22 September 2023).
- Pedregosa, F.; Varoquaux, G.; Gramfort, A.; Michel, V.; Thirion, B.; Grisel, O.; Blondel, M.; Prettenhofer, P.; Weiss, R.; Dubourg, V.; et al. Scikit-Learn: Machine Learning in Python. J. Mach. Learn. Res. 2011, 12, 2825–2830. [Google Scholar]
- Sklearn.Model_selection.GridSearchCV—Scikit-Learn 1.1.1 Documentation. Available online: https://scikit-learn.org/stable/modules/generated/sklearn.model_selection.GridSearchCV.html?highlight=gridsearchcv#sklearn.model_selection.GridSearchCV (accessed on 14 June 2022).
- Sahigara, F.; Ballabio, D.; Todeschini, R.; Consonni, V. Defining a Novel K-Nearest Neighbours Approach to Assess the Applicability Domain of a QSAR Model for Reliable Predictions. J. Cheminform. 2013, 5, 27. [Google Scholar] [CrossRef] [PubMed]
- Django. Django (Version 1.5). Available online: https://www.djangoproject.com/ (accessed on 21 November 2021).


| DPP4i Name | Structure | Half-Life (h) | Absolute Bioavailability (%) | Dose | Plasma Protein Binding (%) | Metabolism | Elimination Route |
|---|---|---|---|---|---|---|---|
| Sitagliptin | 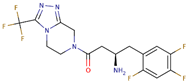 | 12.5 | 87 | 100 mg once daily | 38 | Minimal | Predominantly renal |
| Saxagliptin |  | 2.5 | 75 | 5 mg once daily | Negligible | Hydrolysis | Metabolism |
| Vildagliptin |  | 2 | 85 | 50 mg twice daily | 9 | Hydrolysis | Metabolism |
| Linagliptin | 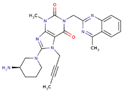 | 12 | 30 | 5 mg once daily | 90 | Minimal | Predominantly biliary |
| Alogliptin |  | 20 | 100 | 25 mg once daily | 30 | Minimal | Predominantly renal |
| Teneligliptin | 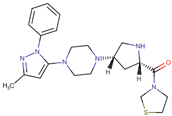 | 24.2 | 74 | 20 mg once daily | 78 | Minimal | Predominantly renal |
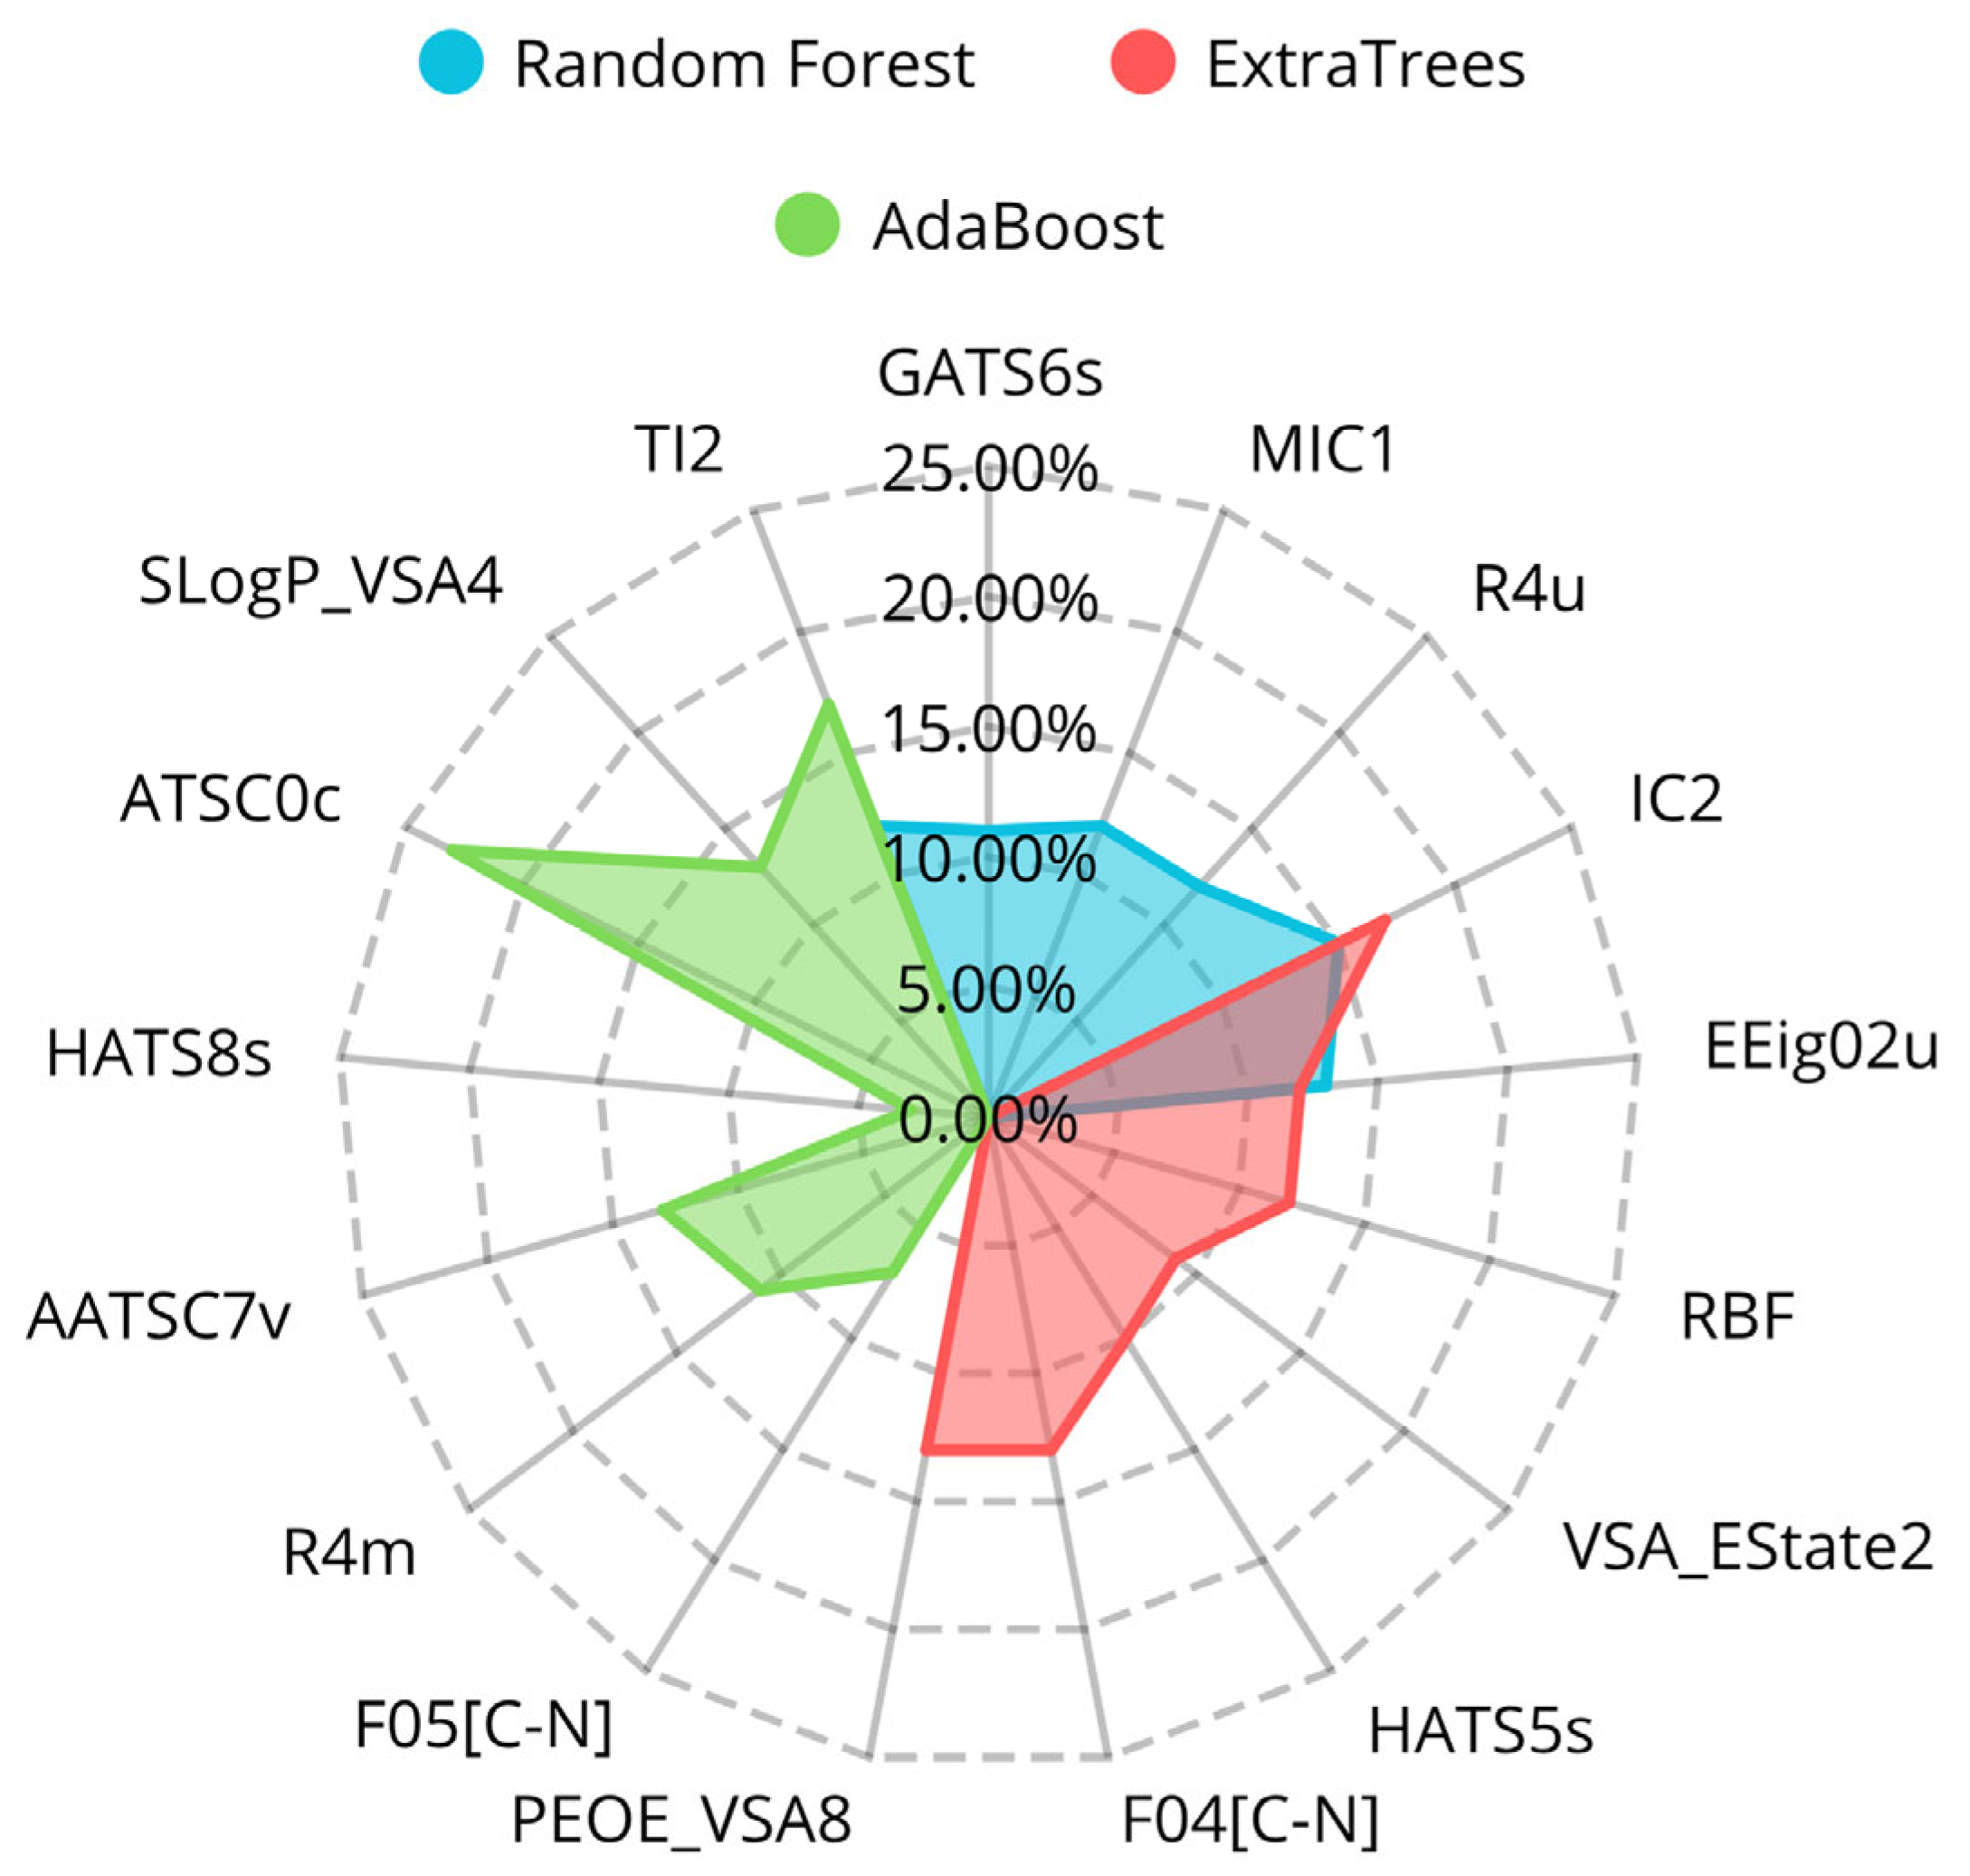
| Model | Descriptor | Feature Importance (%) | Description |
|---|---|---|---|
| Random Forest | GATS6s | 11% | Geary autocorrelation of lag 6 weighted by I-state. |
| MIC1 | 12% | 1-ordered modified information content. | |
| R4u | 12% | R autocorrelation of lag 4/unweighted. | |
| IC2 | 15% | Information Content index (neighborhood symmetry of 2-order). | |
| SLogP_VSA2 | 12% | MOE logP VSA Descriptor 2 (−0.40 ≤ x < −0.20). | |
| EEig02u | 13% | Eigenvalue of order 2 from the edge adjacency matrix unweighted. | |
| TI2 | 12% | Second Mohar index. | |
| Extra Trees | RBF | 12% | Rotatable bond fraction |
| VSA_EState2 | 9% | VSA EState Descriptor 2 (4.78 ≤ x < 5.00) | |
| HATS5s | 10% | leverage-weighted autocorrelation of lag 5/weighted by I-state | |
| IC2 | 17% | Information Content index (neighborhood symmetry of 2-order) | |
| SLogP_VSA2 | 13% | MOE logP VSA Descriptor 2 (−0.40 ≤ x < −0.20) | |
| EEig02u | 12% | Eigenvalue of order 2 from the edge adjacency matrix unweighted | |
| F04[C-N] | 13% | Frequency of C-N at topological distance 4 | |
| PEOE_VSA8 | 13% | MOE Charge VSA Descriptor 8 (0.00 ≤ x < 0.05) | |
| AdaBoost | F05[C-N] | 7% | Frequency of C-N at topological distance 5 |
| R4m | 11% | R autocorrelation of lag 4/weighted by mass | |
| AATSC7v | 13% | Averaged and centered Moreau-Broto autocorrelation of lag 7 weighted by vdw volume | |
| SLogP_VSA2 | 13% | MOE logP VSA Descriptor 2 (−0.40 ≤ x < −0.20) | |
| HATS8s | 3% | Leverage-weighted autocorrelation of lag 8/weighted by I-state | |
| ATSC0c | 23% | Centered Moreau-Broto autocorrelation of lag 0 weighted by gasteiger charge | |
| TI2 | 17% | Second Mohar index | |
| SLogP_VSA4 | 13% | MOE logP VSA Descriptor 4 (0.00 ≤ x < 0.10) |
| ML Algorithm | Accuracy (%) | Recall (%) | Precision (%) | Specificity (%) | FPR (%) | FNR (%) | F1-Score | MCC | |
|---|---|---|---|---|---|---|---|---|---|
| TS (2945 compounds) | AdaBoost | 81 ± 0.3 | 71 ± 0.9 | 78 ± 0.1 | 87 ± 0.1 | 13 ± 0.1 | 29 ± 0.9 | 0.74 ± 0.006 | 0.59 ± 0.007 |
| Extra Trees | 94 ± 0.4 | 90 ± 0.6 | 93 ± 0.5 | 96 ± 0.3 | 4 ± 0.3 | 10 ± 0.6 | 0.92 ± 0.005 | 0.87 ± 0.009 | |
| Random Forest | 87 ± 0.4 | 82 ± 0.5 | 84 ± 0.9 | 91 ± 0.6 | 9 ± 0.6 | 18 ± 0.5 | 0.83 ± 0.005 | 0.73 ± 0.009 | |
| HV | 89 ± 0.3 | 84 ± 0.4 | 87 ± 0.4 | 92 ± 0.3 | 8 ± 0.3 | 16 ± 096 | 0.85 ± 0.004 | 0.76 ± 0.006 | |
| SV | 92 ± 0.2 | 88 ± 0.6 | 90 ± 0.3 | 94 ± 0.2 | 6 ± 0.2 | 12 ± 0.6 | 0.89 ± 0.003 | 0.83 ± 0.005 | |
| VS (984 compounds) | AdaBoost | 73 ± 1 | 60 ± 2.4 | 66 ± 1.2 | 81 ± 0.8 | 19 ± 0.8 | 40 ± 2.4 | 0.63 ± 0.02 | 0.42 ± 0.022 |
| Extra Trees | 80 ± 0.6 | 69 ± 1.6 | 77 ± 1.1 | 87 ± 0.9 | 13 ± 0.9 | 31 ± 1.6 | 0.73 ± 0.009 | 0.57 ± 0.012 | |
| Random Forest | 77 ± 1 | 69 ± 3.1 | 71 ± 0.6 | 82 ± 0.8 | 18 ± 0.8 | 31 ± 3.1 | 0.70 ± 0.02 | 0.51 ± 0.021 | |
| HV | 79 ± 2 | 68 ± 3 | 75 ± 3 | 86 ± 2 | 14 ± 2 | 32 ± 3 | 0.71 ± 0.02 | 0.55 ± 0.037 | |
| SV | 80 ± 1 | 69 ± 3 | 76 ± 3 | 87 ± 2 | 13 ± 2 | 31 ± 3 | 0.73 ± 0.01 | 0.57 ± 0.02 |
| Model | Descriptor | Feature Importance (%) | Description |
|---|---|---|---|
| Extra Trees | IC2 | 7.9% | Information Content index (neighborhood symmetry of 2-order) |
| F05[C-N] | 7.4% | Frequency of C–N atom pairs at topological distance 5 | |
| B05[O-O] | 7.0% | Presence/absence of O–O atom pairs at topological distance 5 (burden matrix) | |
| F06[C-N] | 6.3% | Frequency of C–N atom pairs at topological distance 6 | |
| C-008 | 6.2% | Atom-centered fragment: sp2 carbon connected to electronegative atoms | |
| B04[N-O] | 6.0% | Presence/absence of N–O atom pairs at topological distance 4 | |
| N-066 | 5.5% | Atom type E-state index for tertiary amine nitrogen | |
| B06[N-N] | 5.2% | Presence/absence of N–N atom pairs at topological distance 6 | |
| GGI1 | 5.0% | Topological charge index of order 1 | |
| SIC2 | 4.9% | Structural information content index of order 2 | |
| nR_5_False_False_False_True | 4.7% | Number of 5-membered rings matching specific structural criteria | |
| MIC1 | 4.5% | 1-ordered modified information content | |
| SLogP_VSA4 | 4.4% | MOE logP VSA Descriptor 4 (interval defined by logP contribution) | |
| ATS0d | 4.0% | Autocorrelation of lag 0 weighted by sigma electrons | |
| IC3 | 4.2% | Information Content index (neighborhood symmetry of 3-order) | |
| nR_5_False_False_None_True | 4.2% | Number of 5-membered rings with specific heteroatom and aromaticity pattern | |
| NsssCH | 3.6% | Atom type E-state: carbon with three single bonds to saturated atoms | |
| B10[C-N] | 3.6% | Presence/absence of C–N atom pairs at topological distance 10 (burden matrix) | |
| PEOE_VSA8 | 3.5% | MOE Charge VSA Descriptor 8 (0.00 ≤ x < 0.05) | |
| F05[O-O] | 1.9% | Frequency of O–O atom pairs at topological distance 5 |
| Type | Model | Performance for the Test Set | Dataset Size |
|---|---|---|---|
| Classification | DPPPRED-IV | Accuracy: 80% | 3929 compounds |
| Cai et al. [47] | Accuracy: 87% | 1743 compounds | |
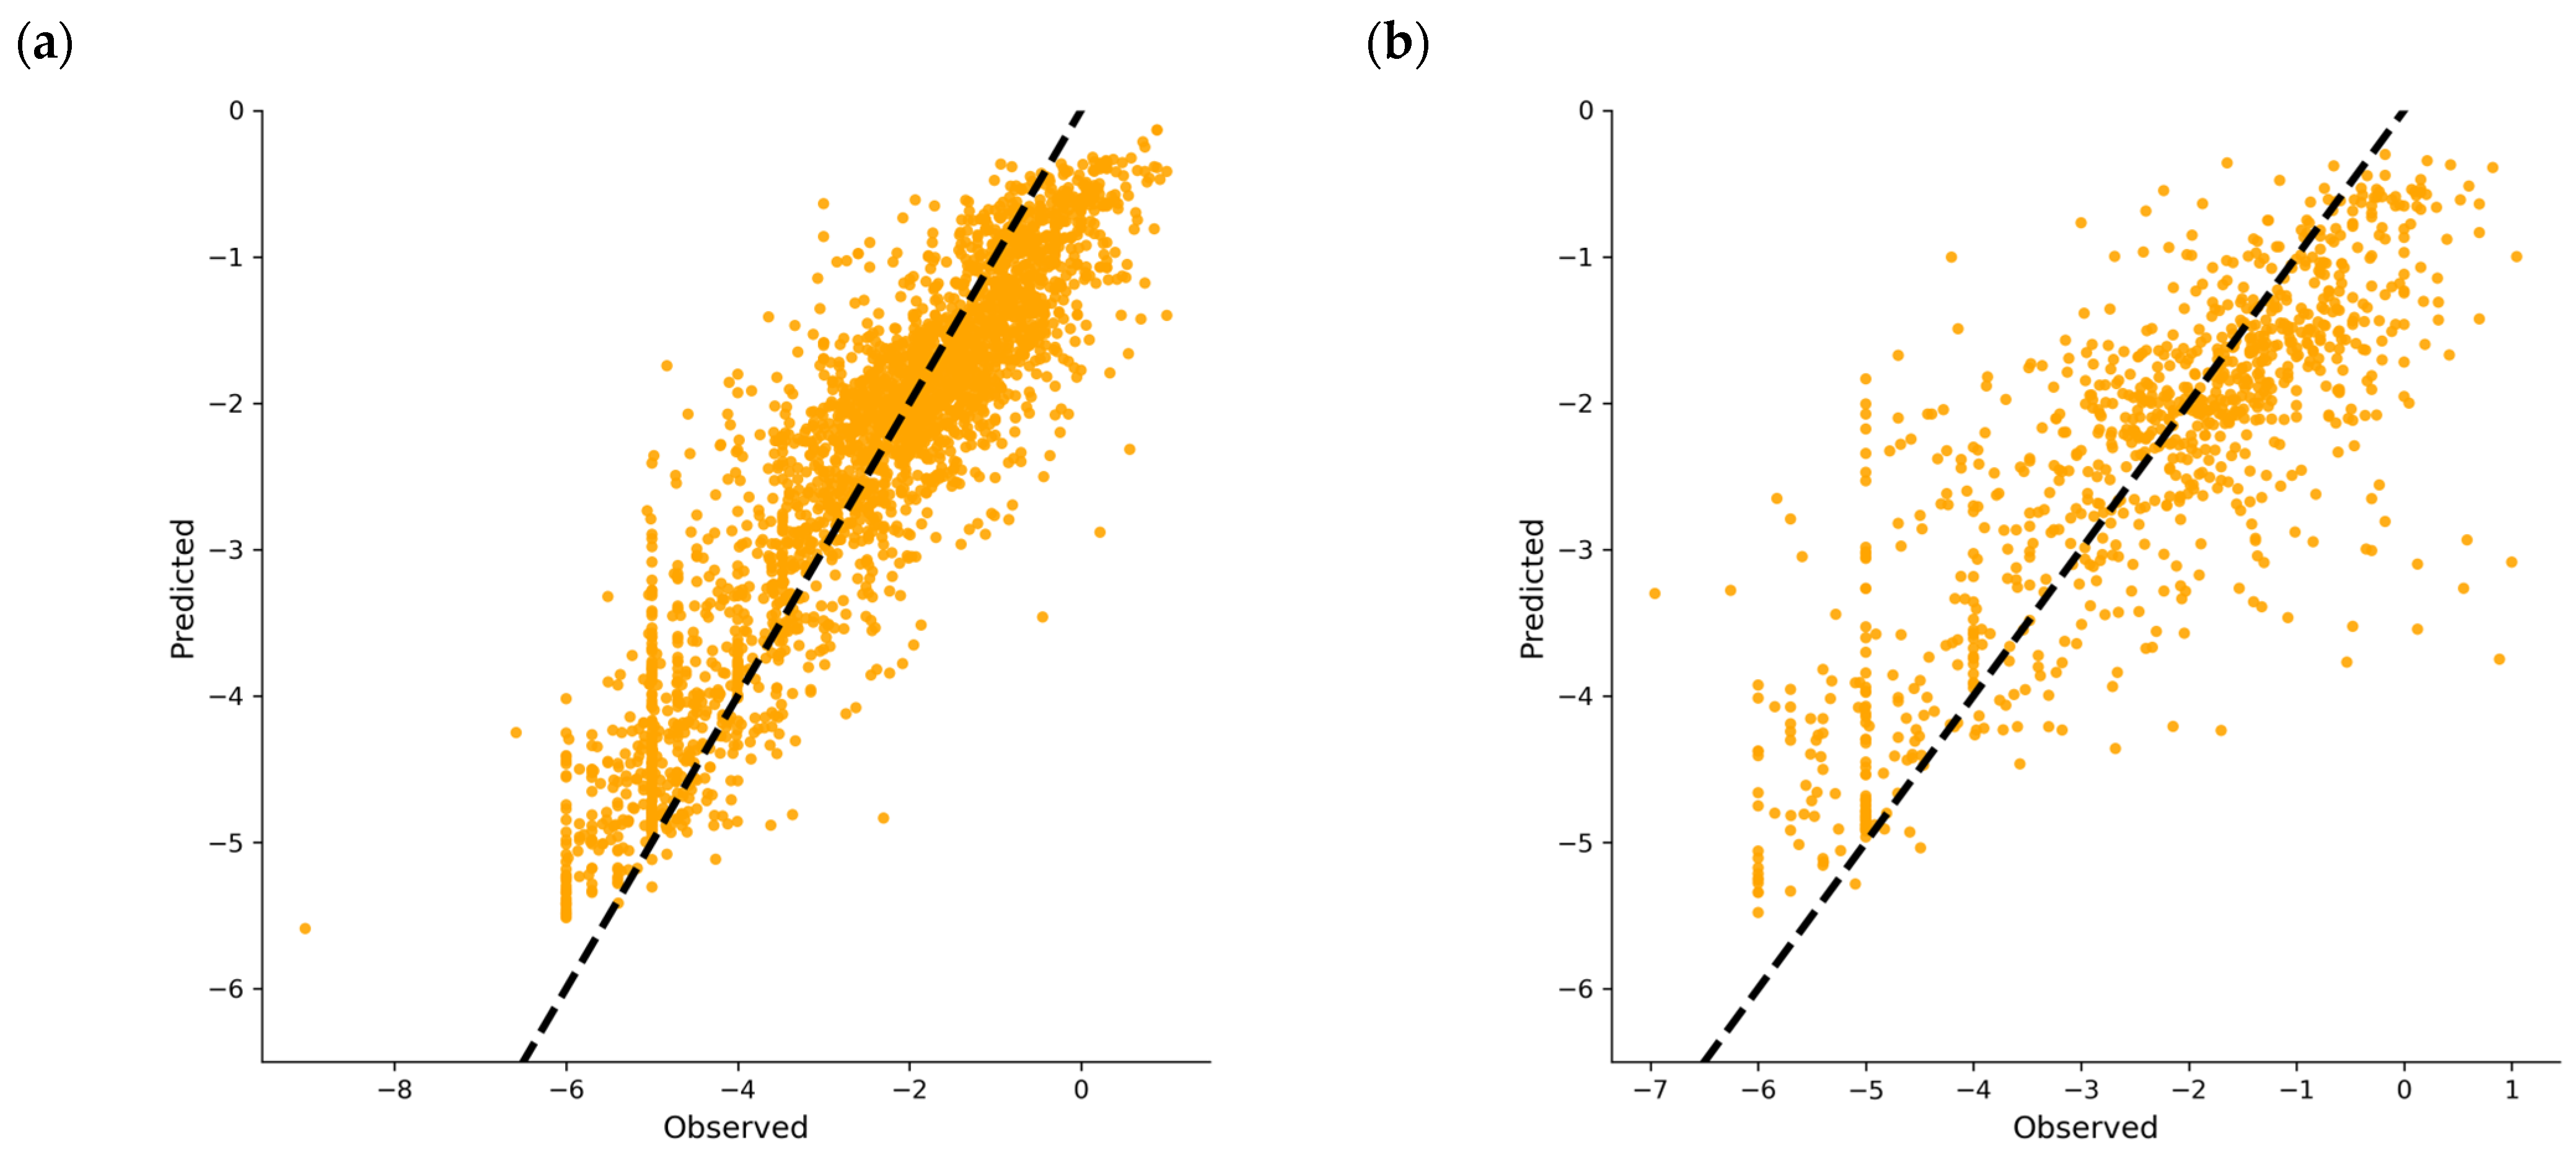
| Regression | DPPPRED-IV | R2: 0.67 | 3834 compounds |
| Gong et al. [48] | R2: 0.90 | 61 compounds | |
| Al-Fakih et al. [49] | R2: 0.94 | 134 compounds | |
| Ma et al. [50] | R2: 0.23 | 8327 compounds | |
| Buiu et al. [51] | R2: 0.85 | 35 compounds |
| Descriptors Groups in WOTAN | |
|---|---|
| Autocorrelations | Functional Groups |
| Bidimensional | Connectivity indexes |
| Topological charge | Information indexes |
| Atom centered | Molecular properties |
| Constitutionals | Rdkit 3D |
| CPSA (Charged Partial Surface Area) | Type MOE |
| Edge Adjacency | Topological |
| Electro topological estate | Burden Eigenvalues |
| Physicochemical | Eigenvalues |
| Getaway | Walk Path Counts |
Disclaimer/Publisher’s Note: The statements, opinions and data contained in all publications are solely those of the individual author(s) and contributor(s) and not of MDPI and/or the editor(s). MDPI and/or the editor(s) disclaim responsibility for any injury to people or property resulting from any ideas, methods, instructions or products referred to in the content. |
© 2025 by the authors. Licensee MDPI, Basel, Switzerland. This article is an open access article distributed under the terms and conditions of the Creative Commons Attribution (CC BY) license (https://creativecommons.org/licenses/by/4.0/).
Share and Cite
Carpio, L.E.; Olivares, M.; Ortega-Vallbona, R.; Serrano-Candelas, E.; Sanz, Y.; Gozalbes, R. DPPPRED-IV: An Ensembled QSAR-Based Web Server for the Prediction of Dipeptidyl Peptidase 4 Inhibitors. Int. J. Mol. Sci. 2025, 26, 5579. https://doi.org/10.3390/ijms26125579
Carpio LE, Olivares M, Ortega-Vallbona R, Serrano-Candelas E, Sanz Y, Gozalbes R. DPPPRED-IV: An Ensembled QSAR-Based Web Server for the Prediction of Dipeptidyl Peptidase 4 Inhibitors. International Journal of Molecular Sciences. 2025; 26(12):5579. https://doi.org/10.3390/ijms26125579
Chicago/Turabian StyleCarpio, Laureano E., Marta Olivares, Rita Ortega-Vallbona, Eva Serrano-Candelas, Yolanda Sanz, and Rafael Gozalbes. 2025. "DPPPRED-IV: An Ensembled QSAR-Based Web Server for the Prediction of Dipeptidyl Peptidase 4 Inhibitors" International Journal of Molecular Sciences 26, no. 12: 5579. https://doi.org/10.3390/ijms26125579
APA StyleCarpio, L. E., Olivares, M., Ortega-Vallbona, R., Serrano-Candelas, E., Sanz, Y., & Gozalbes, R. (2025). DPPPRED-IV: An Ensembled QSAR-Based Web Server for the Prediction of Dipeptidyl Peptidase 4 Inhibitors. International Journal of Molecular Sciences, 26(12), 5579. https://doi.org/10.3390/ijms26125579