
Therapeutic Efficacy of Silymarin, Vitamin E, and Essential Phospholipid Combination Therapy on Hepatic Steatosis, Fibrosis, and Metabolic Parameters in MASLD Patients: A Prospective Clinical Study

 ,
,  ,
,  ,
,  and
and
Abstract
1. Introduction
2. Results
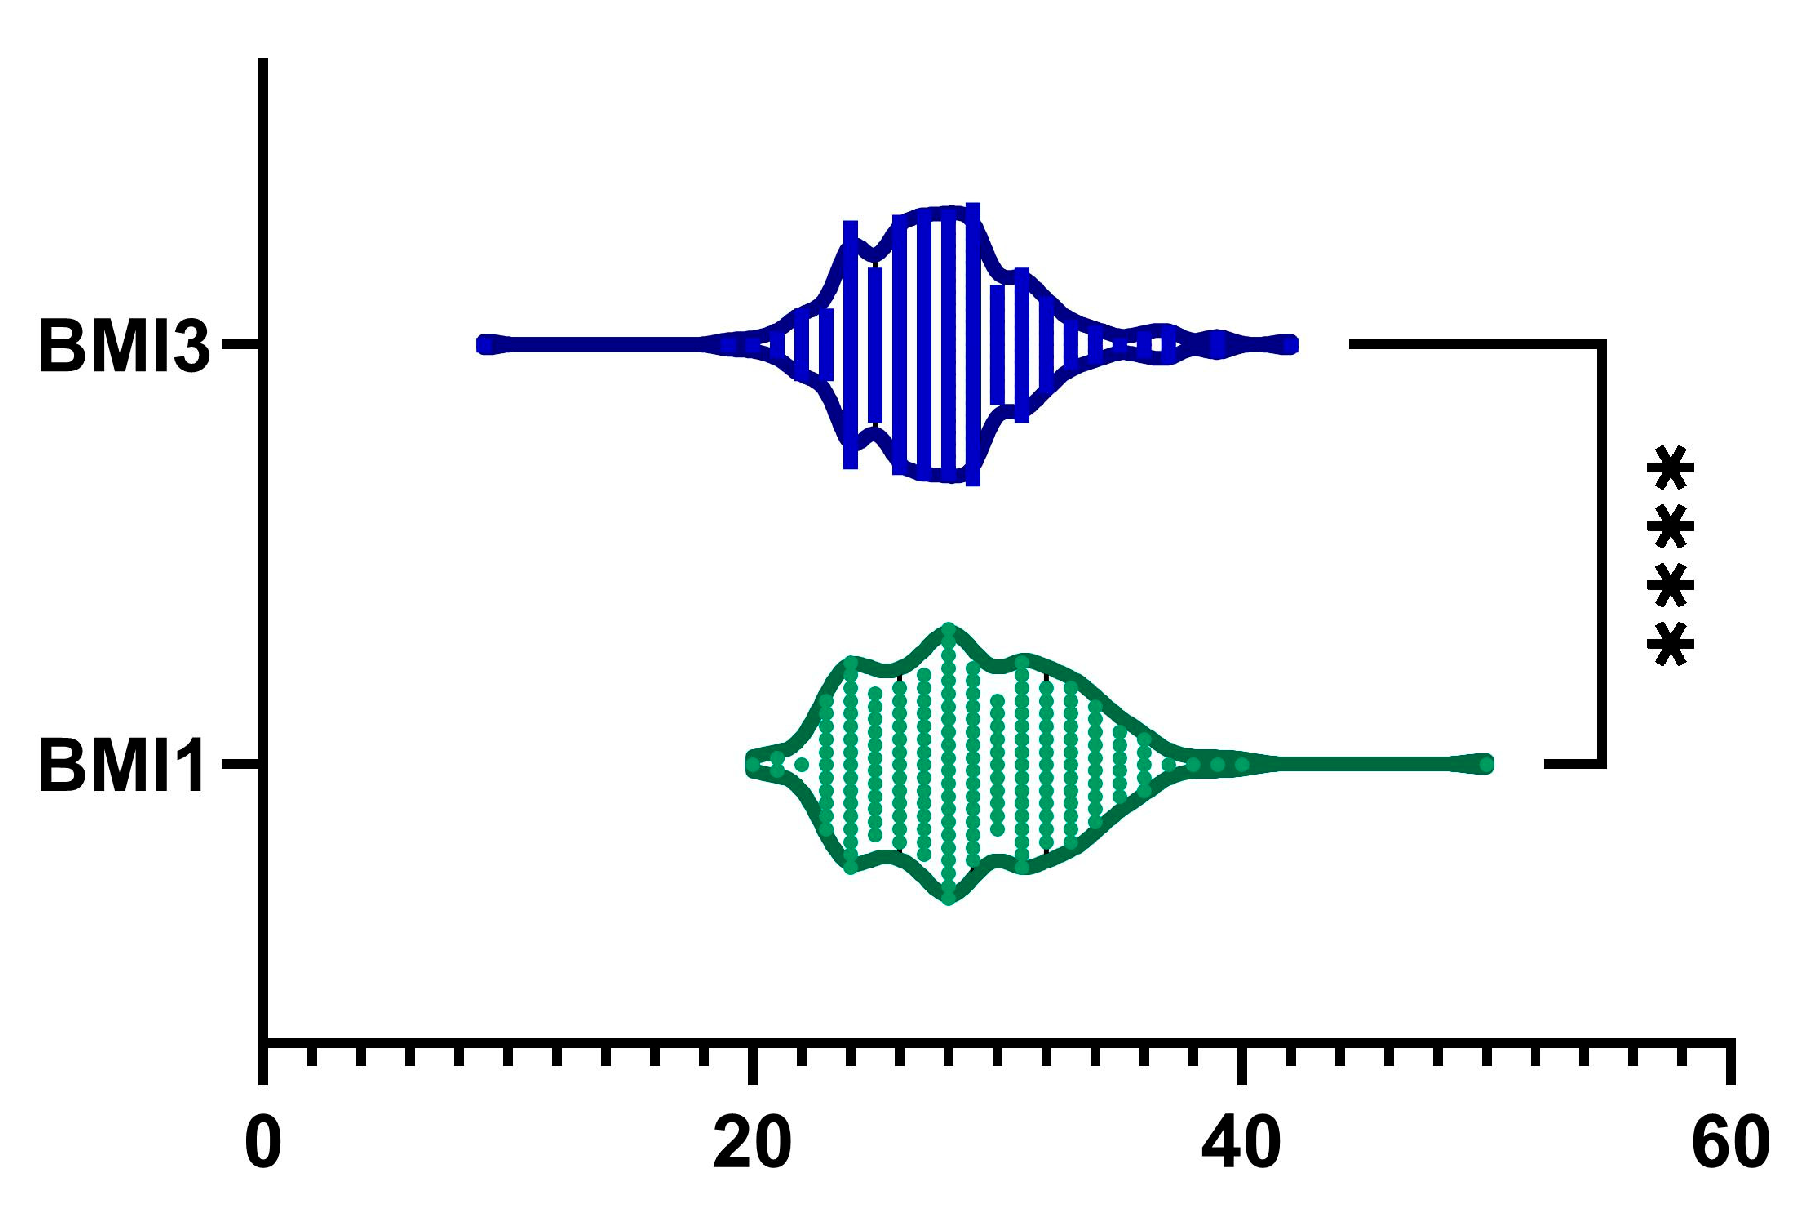
2.1. BMI
2.2. ALT
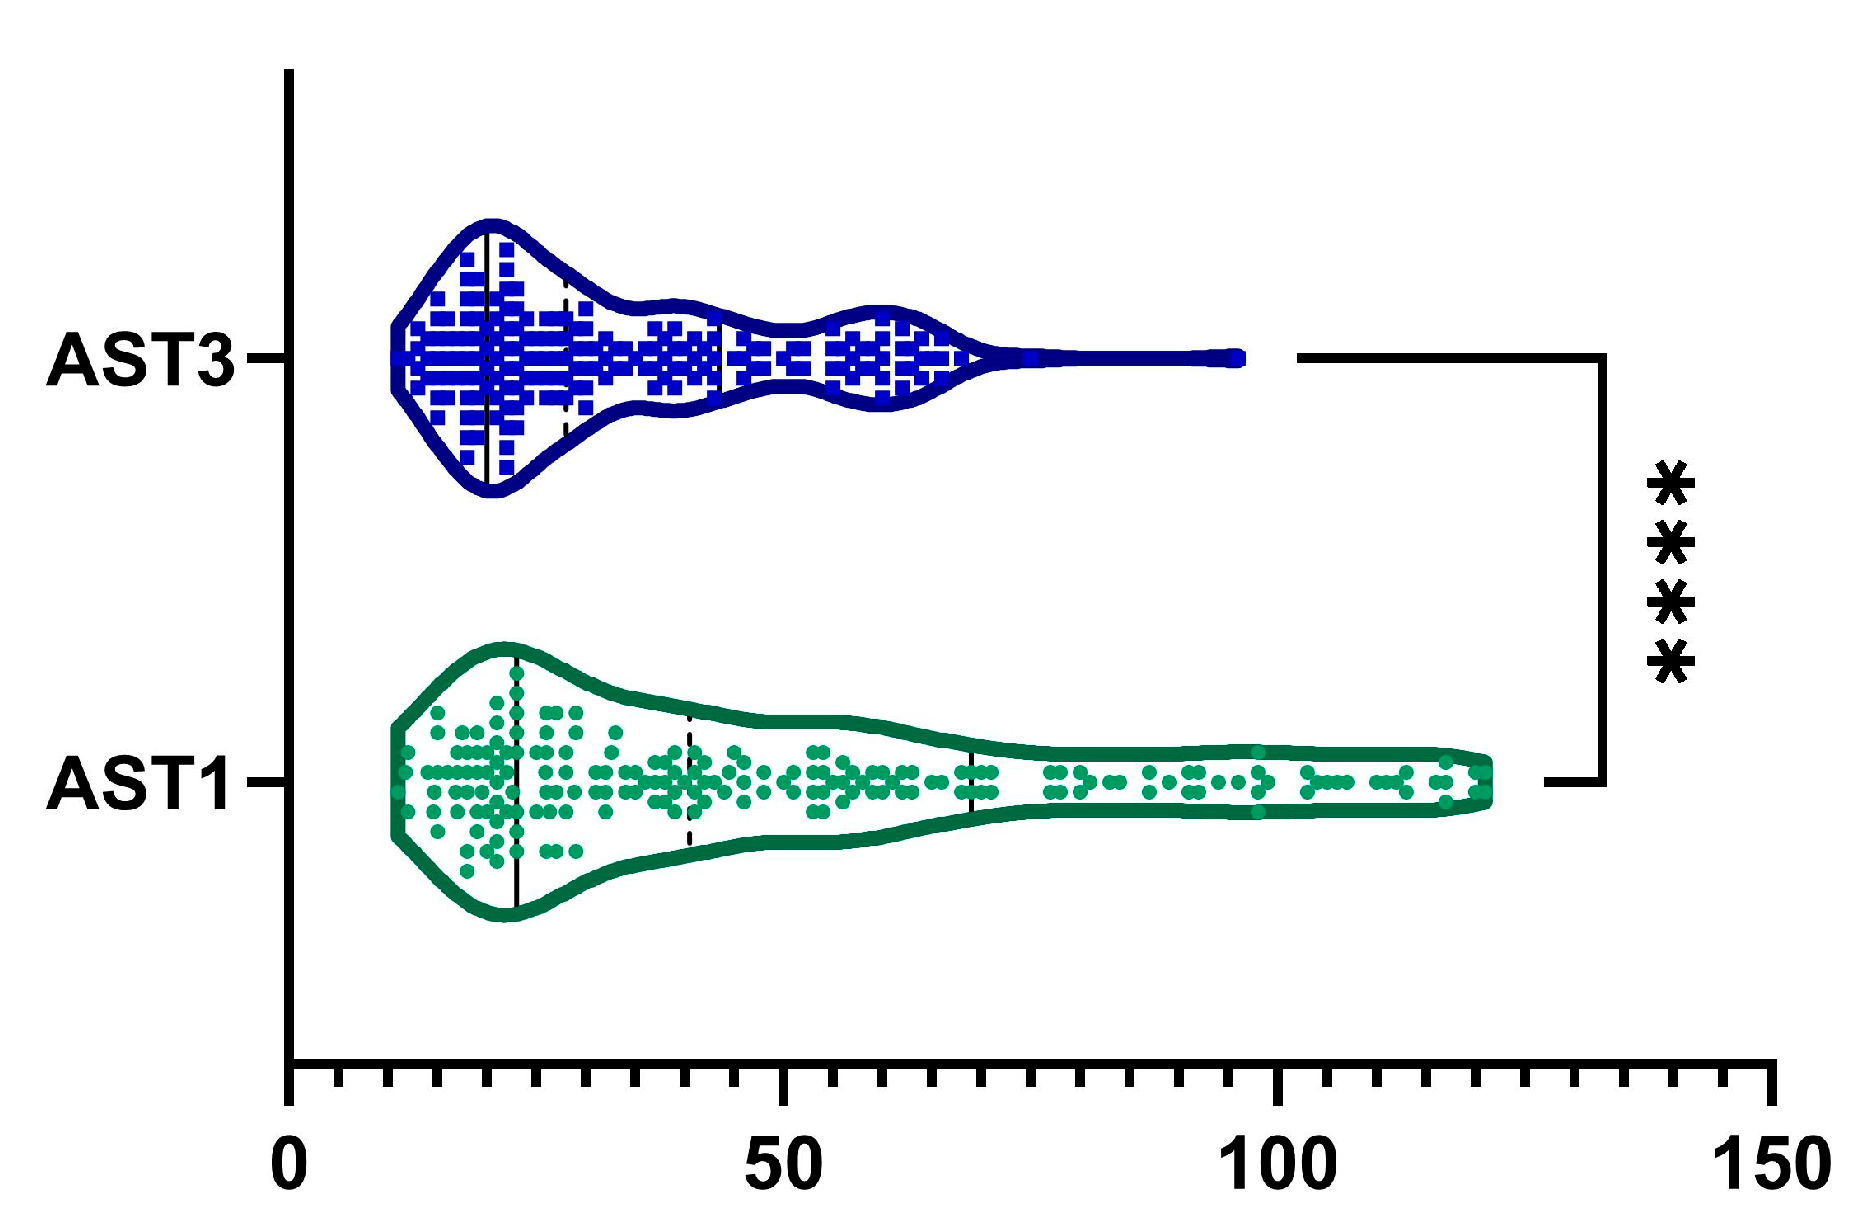
2.3. AST
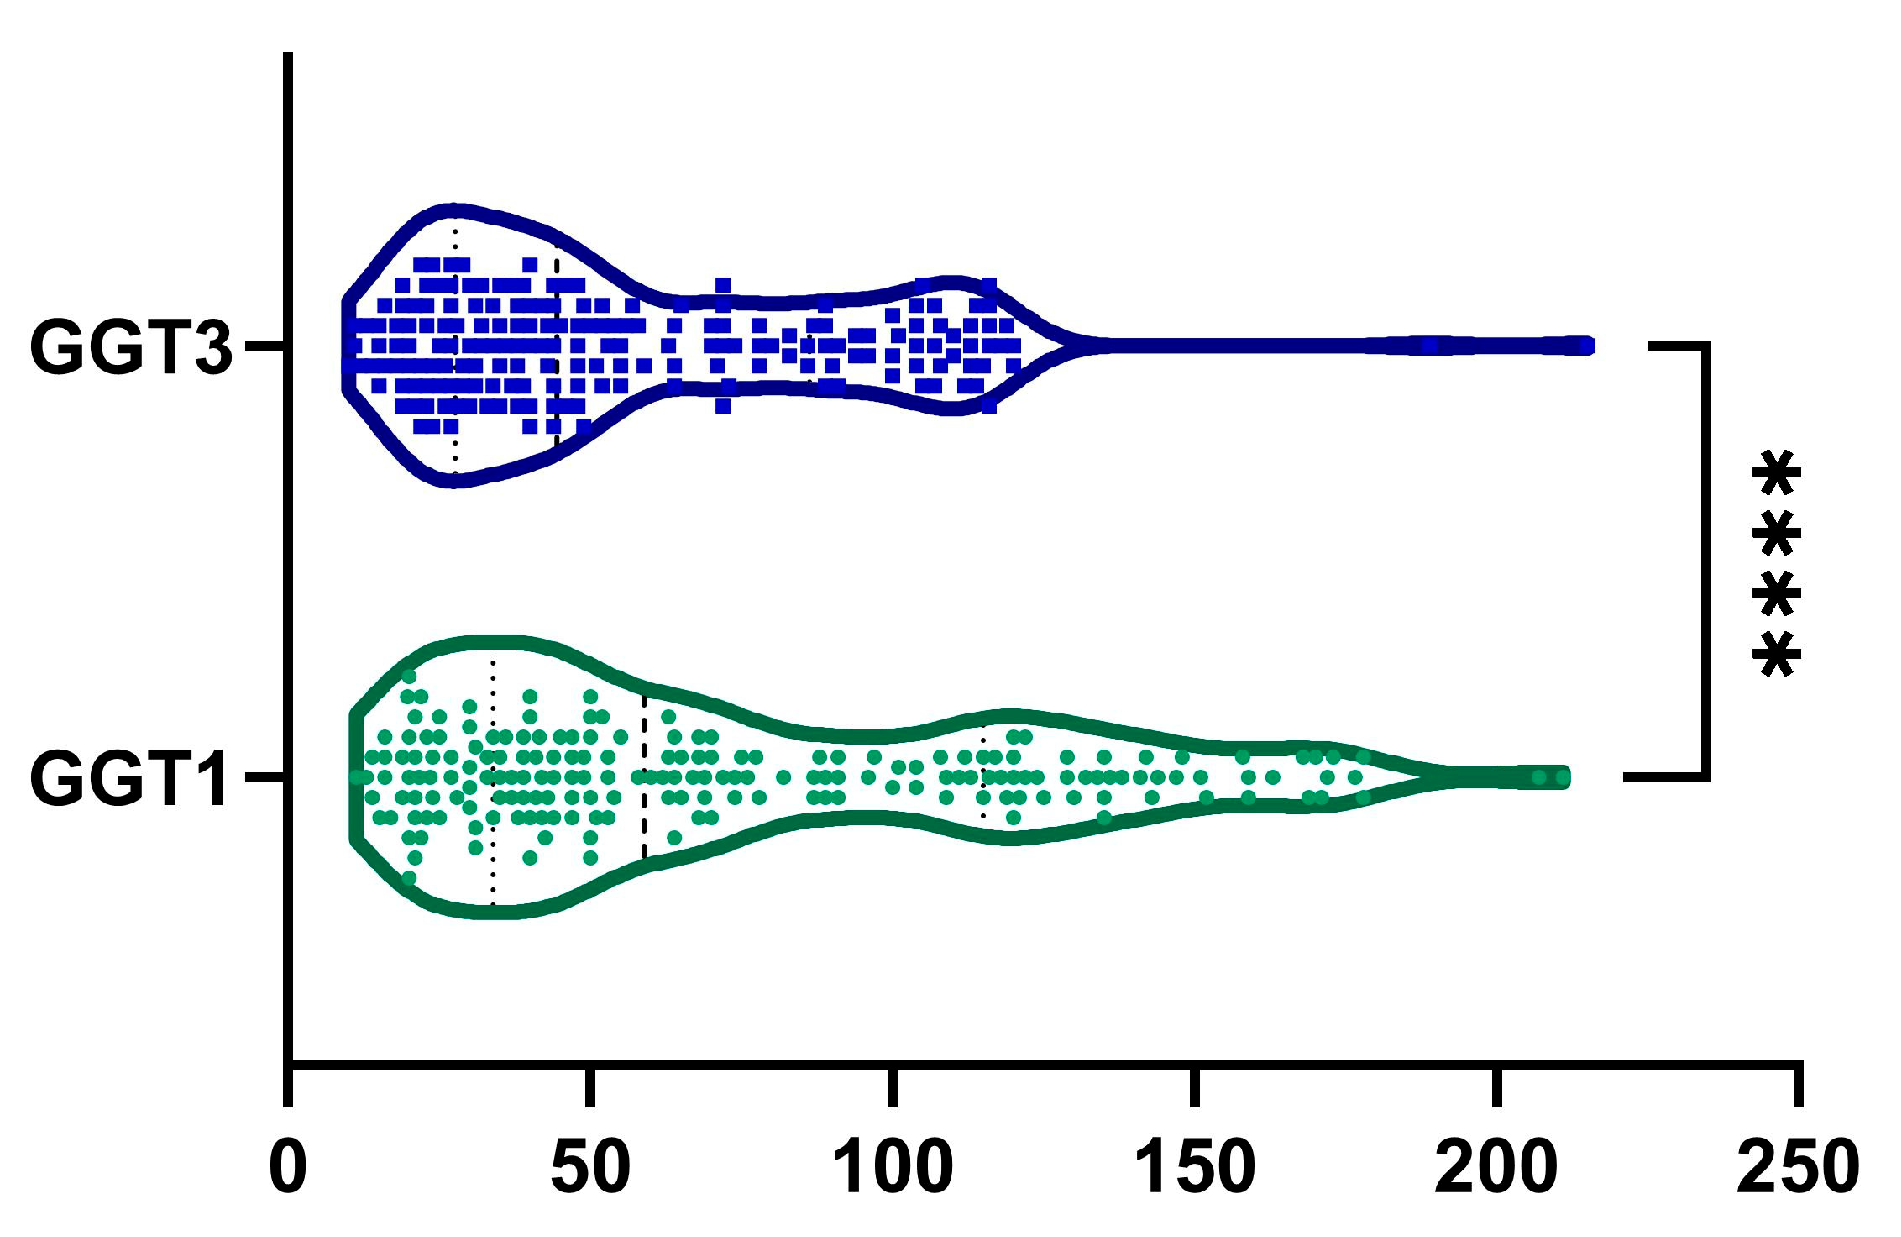
2.4. GGT
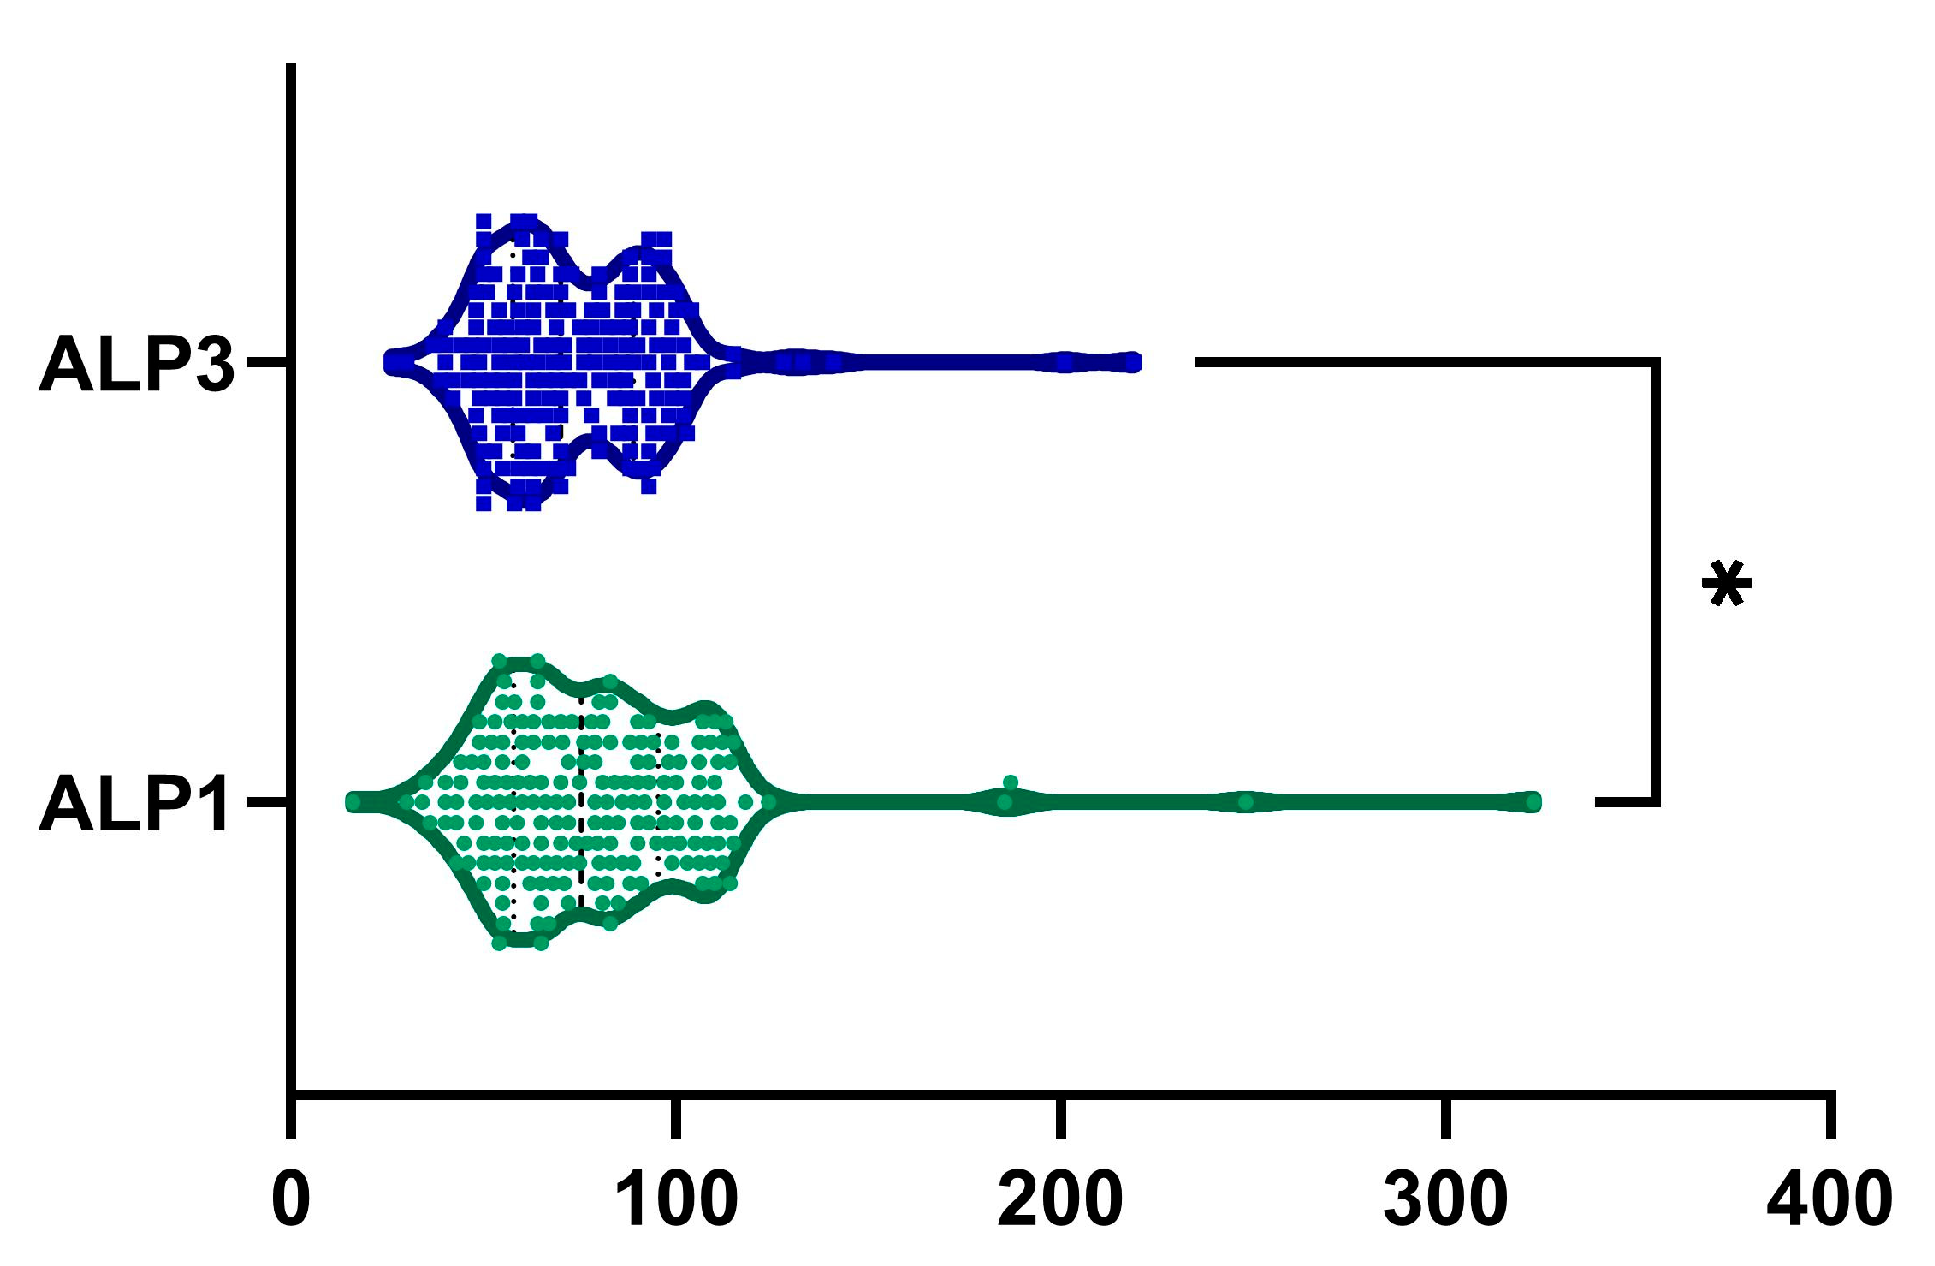
2.5. ALP
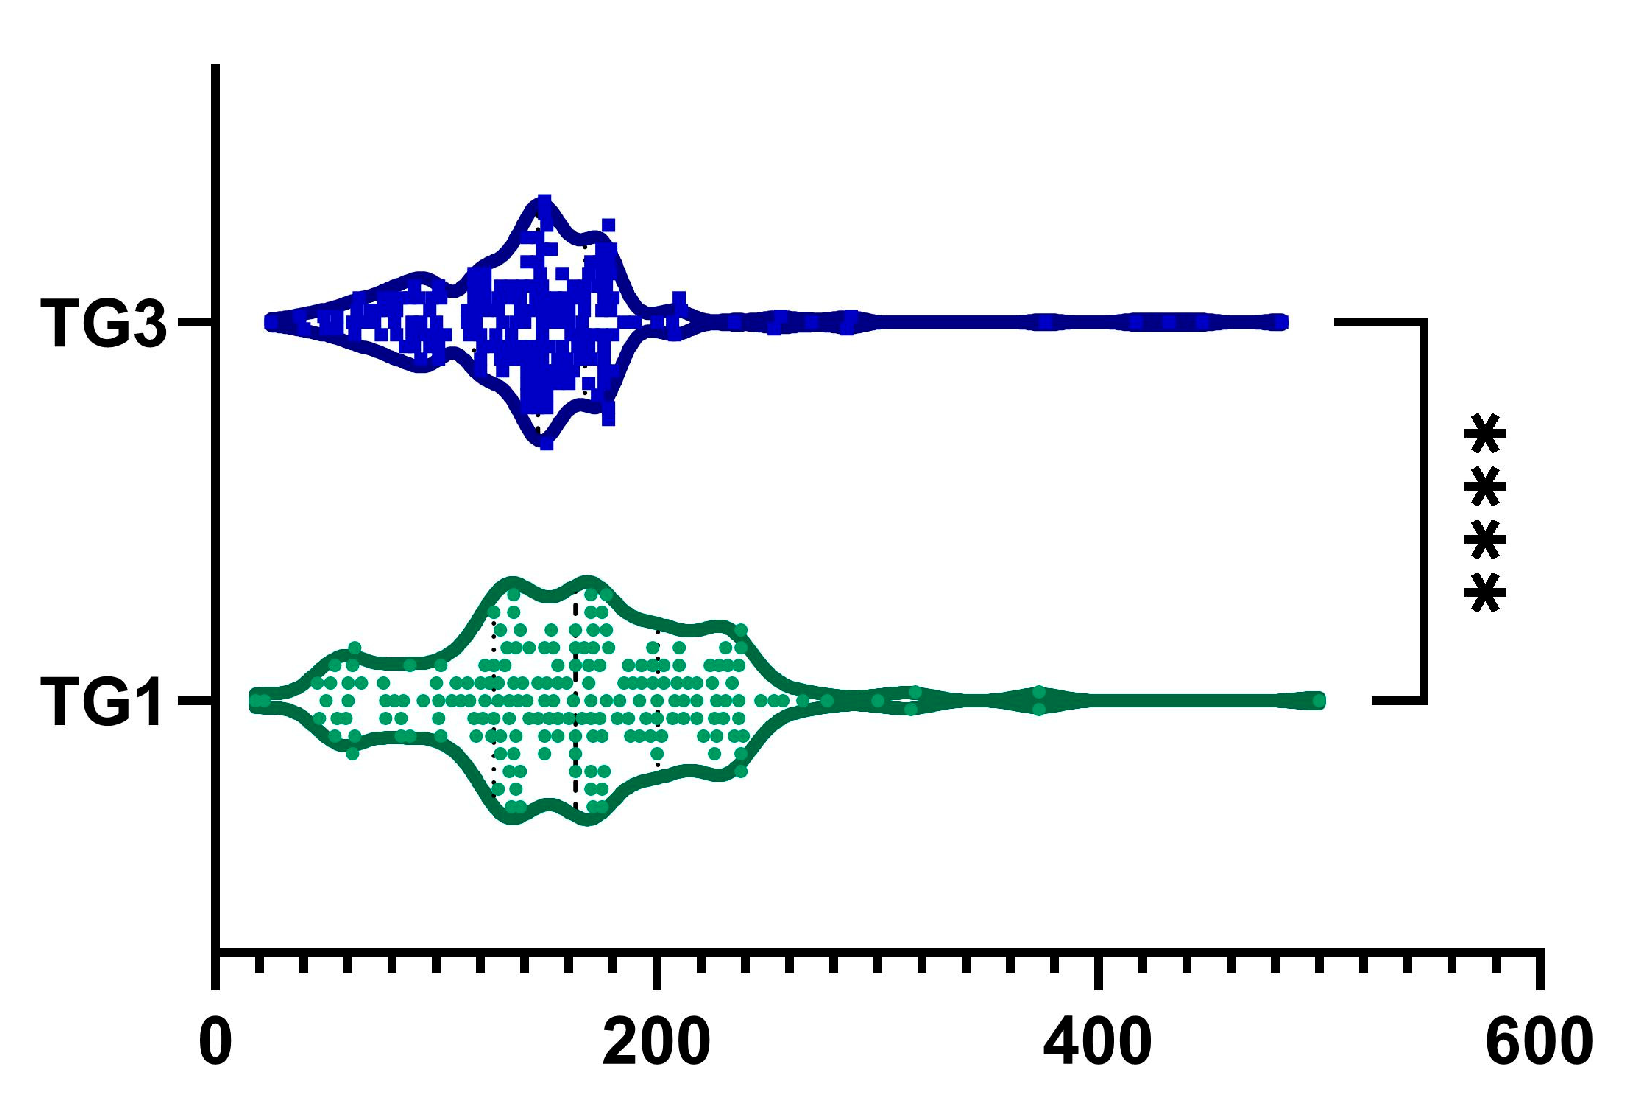
2.6. TG
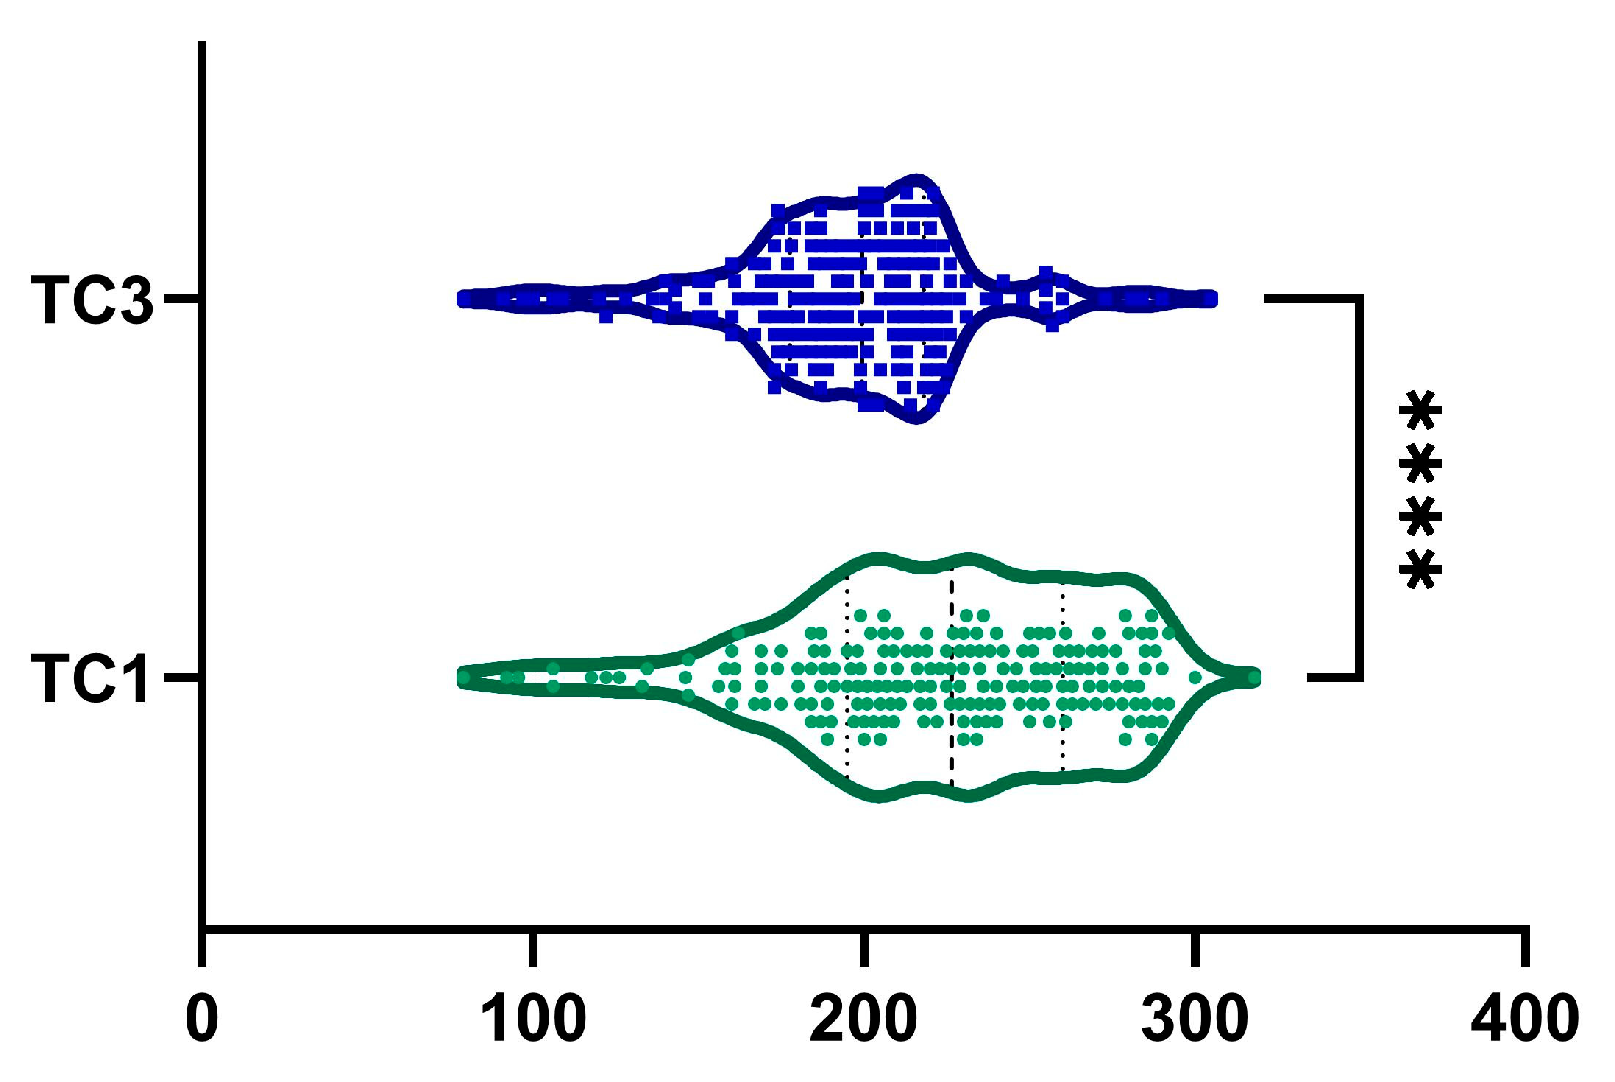
2.7. Total Cholesterol
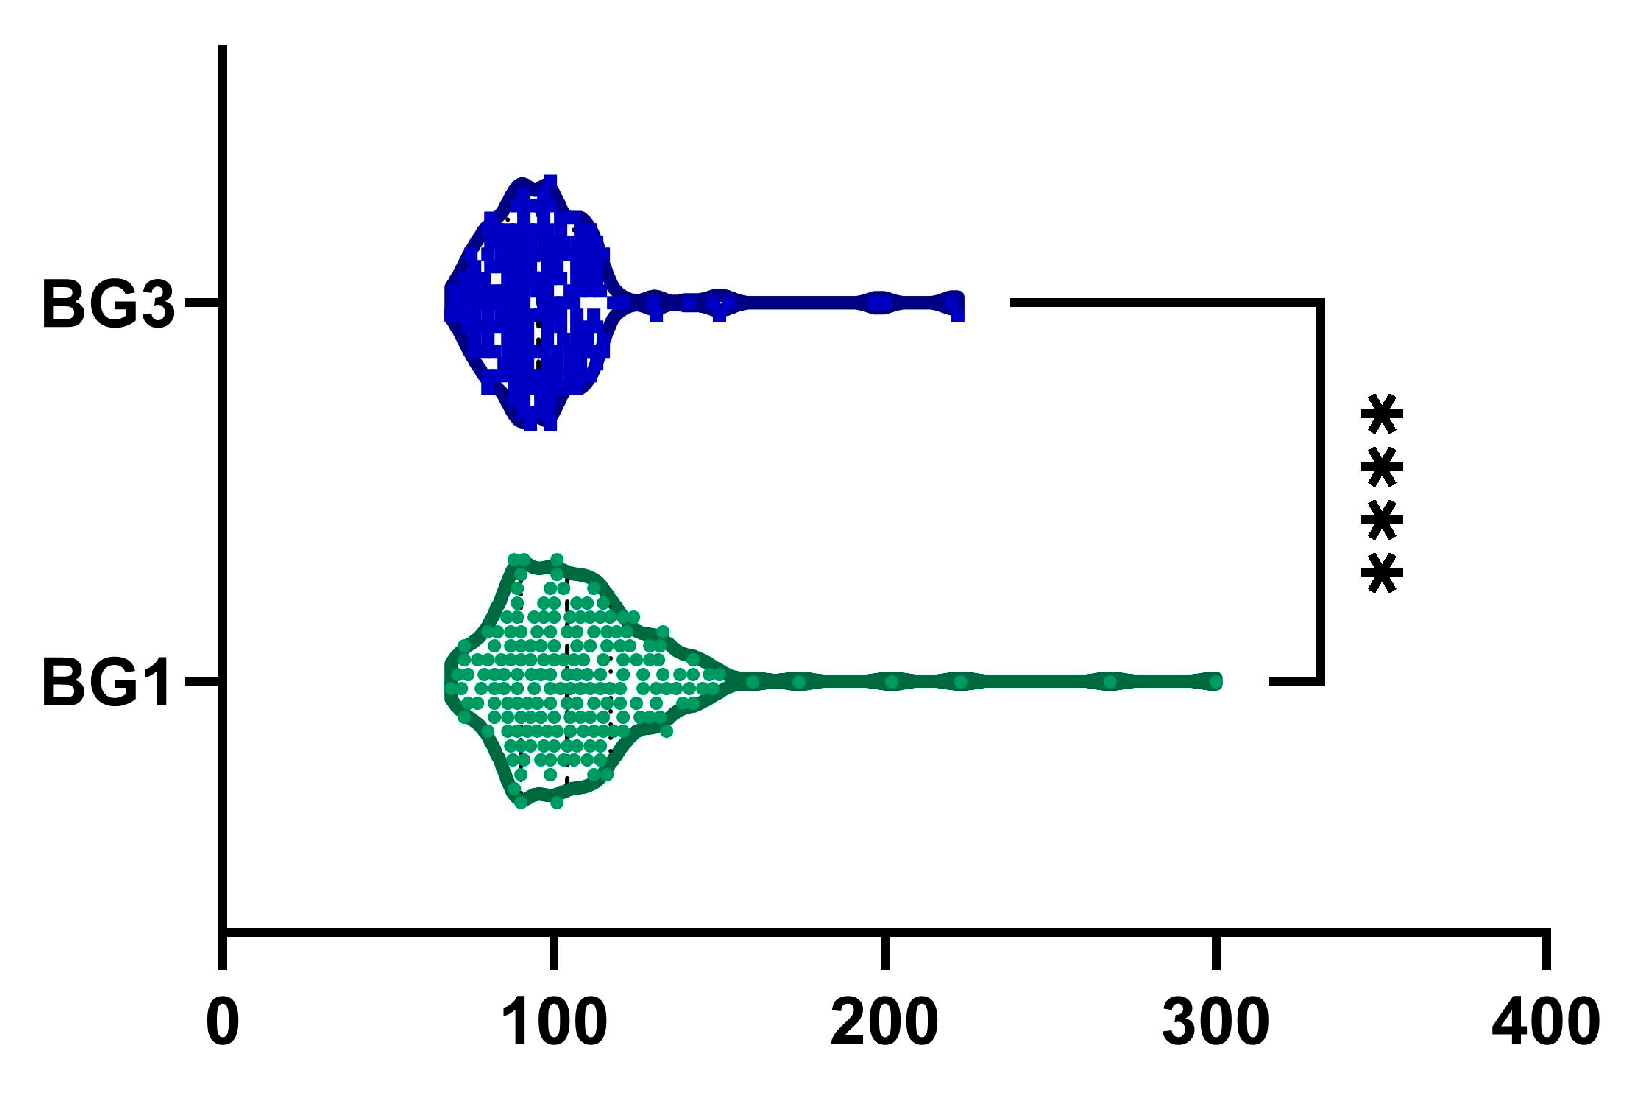
2.8. Blood Glucose
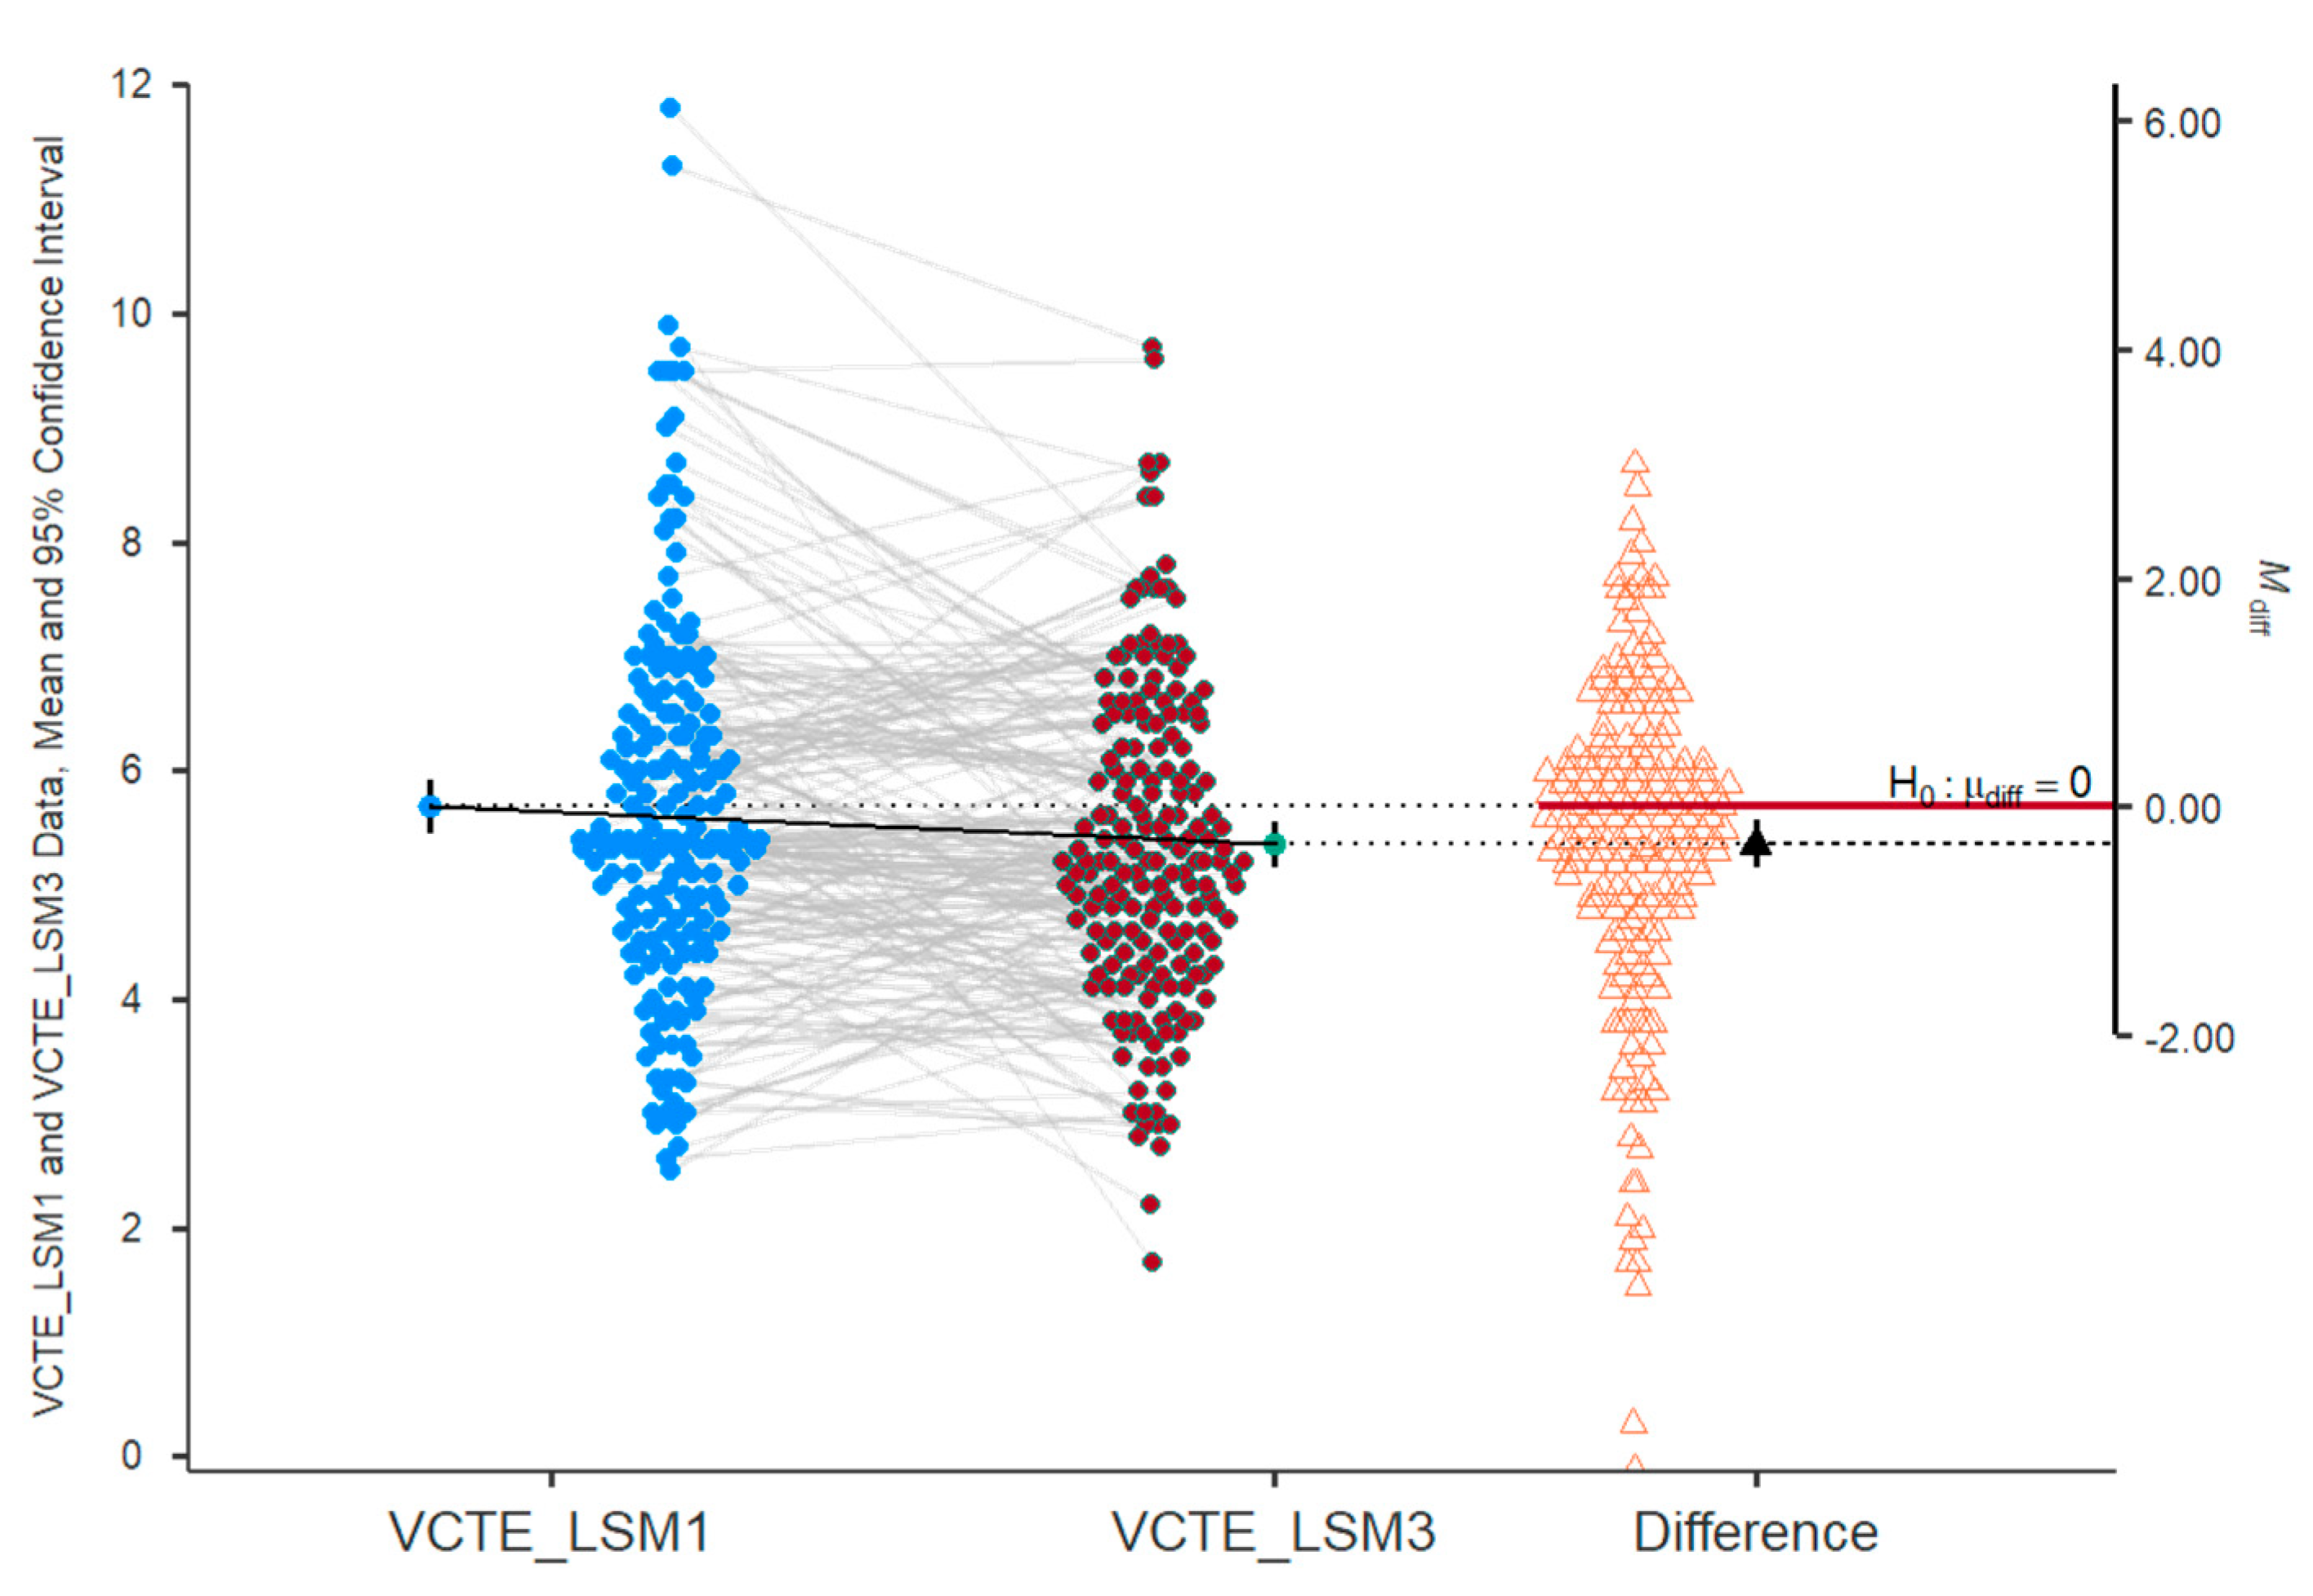
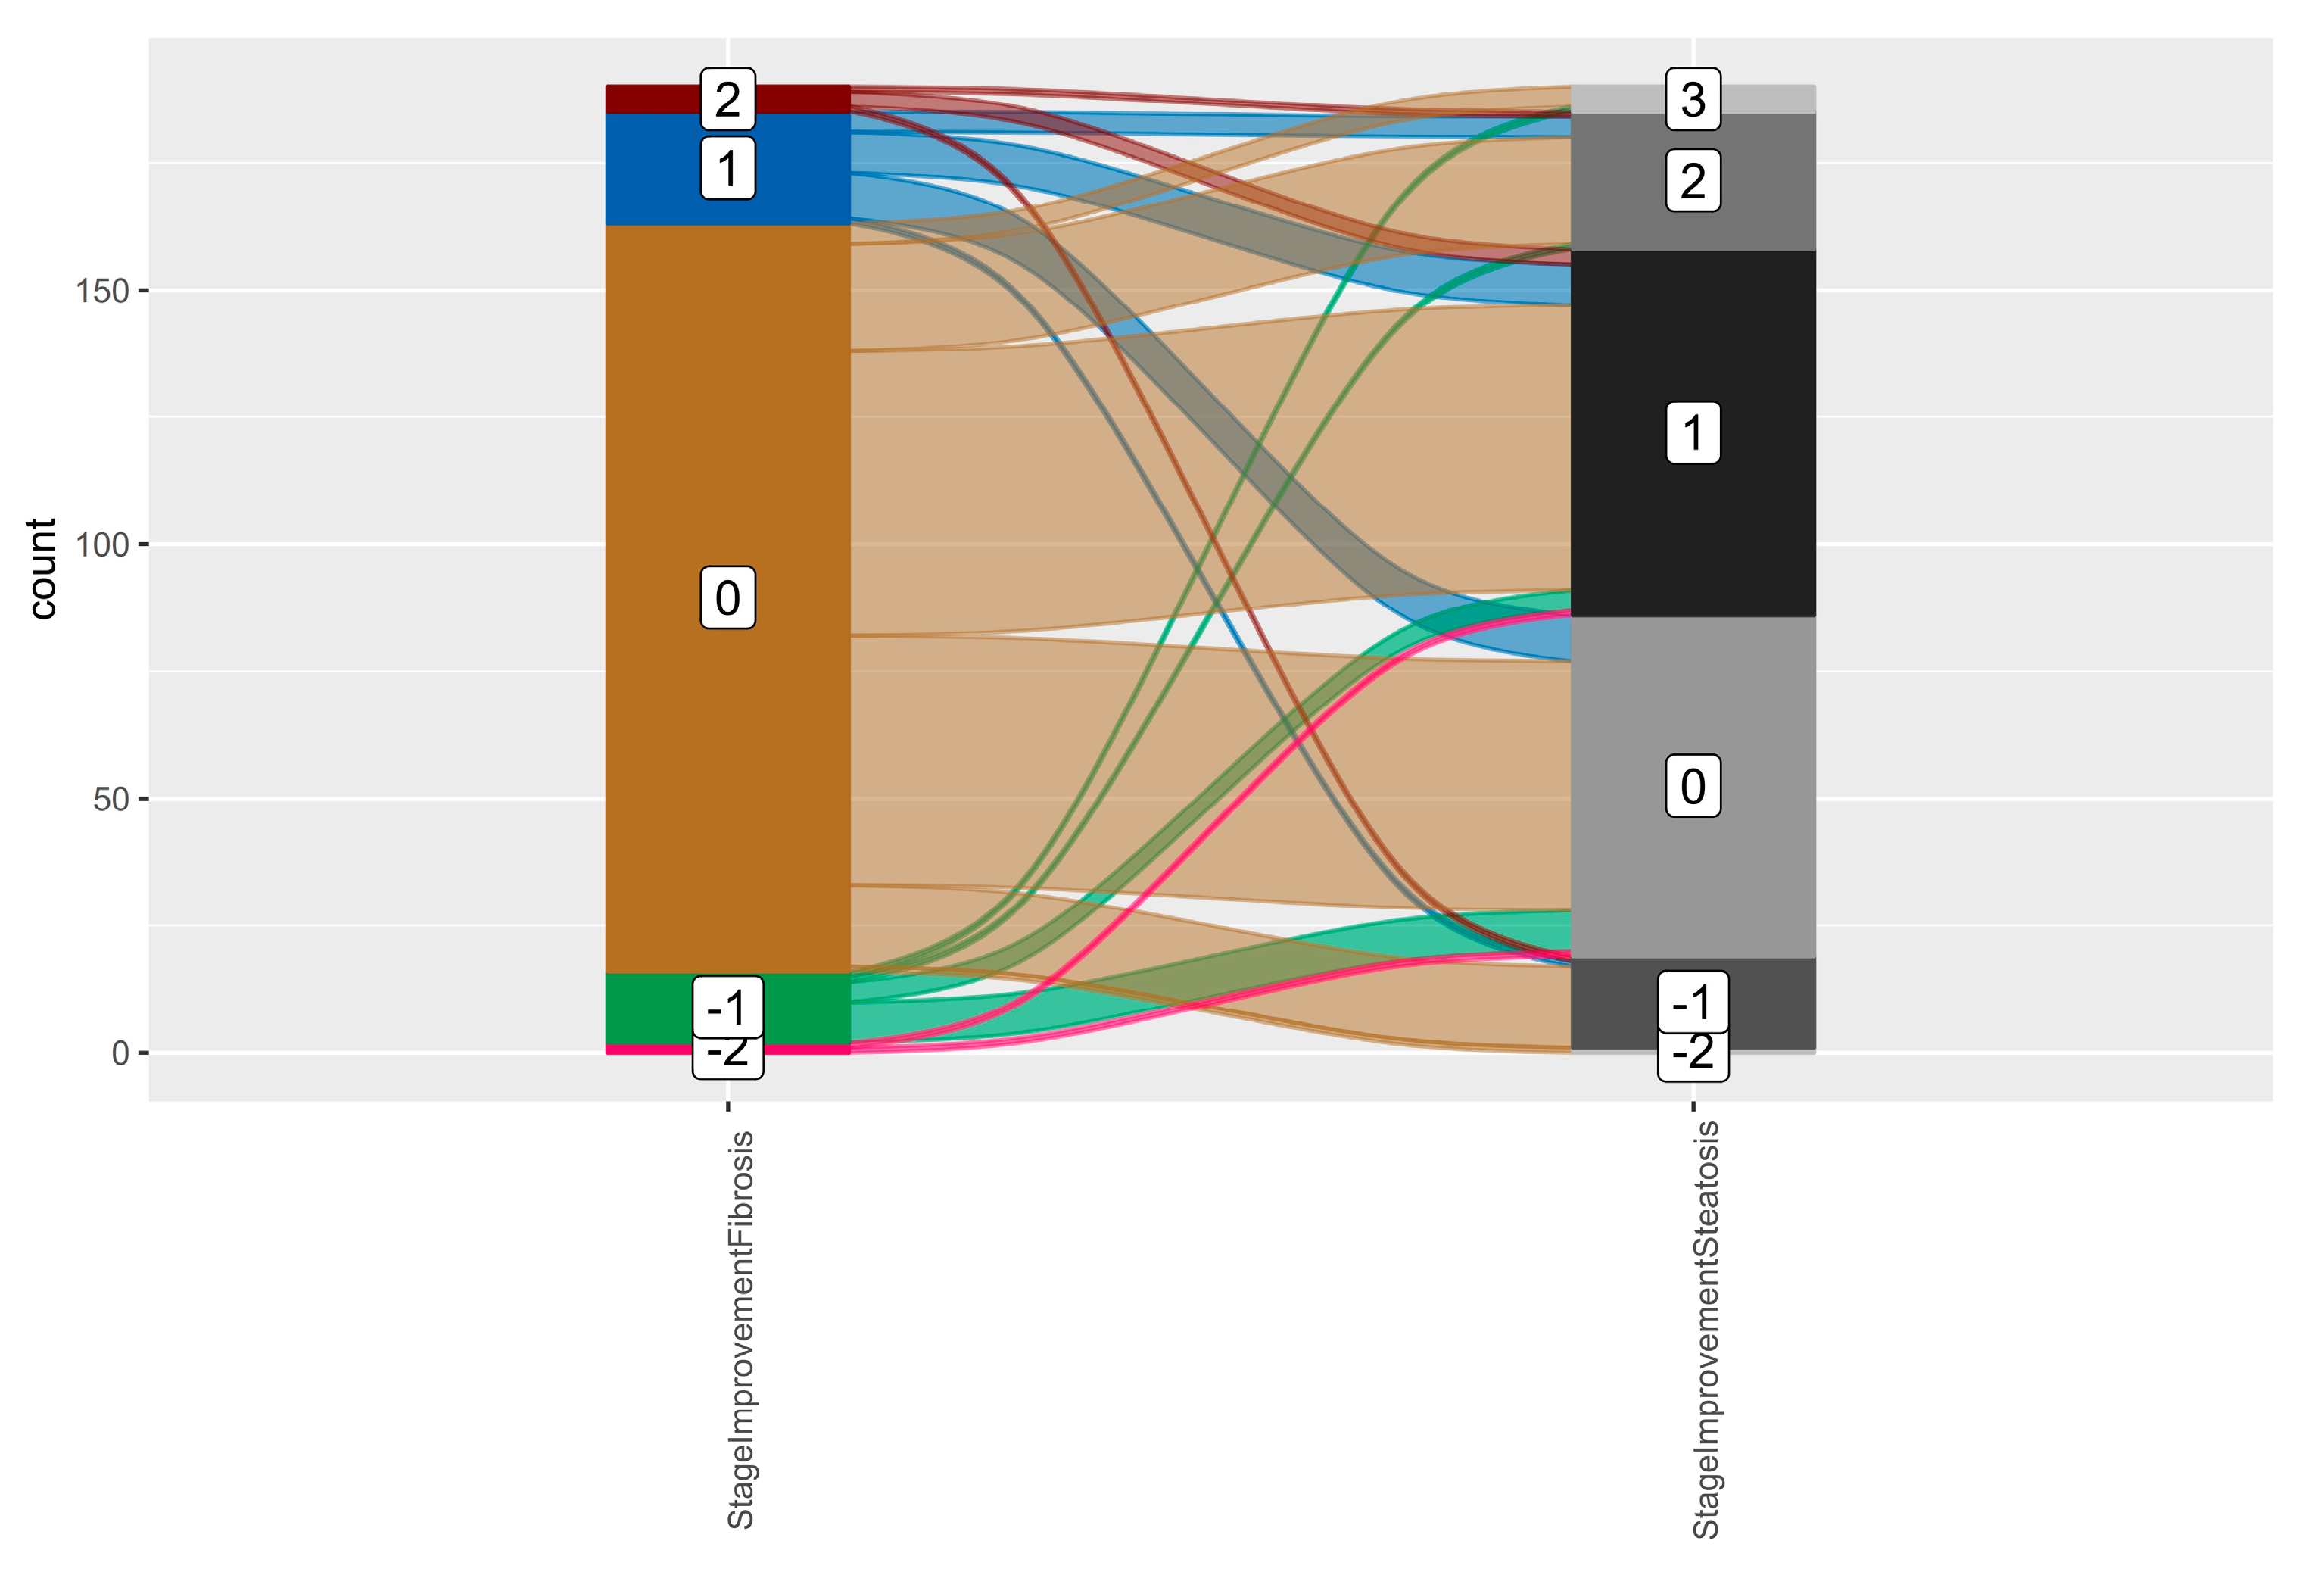
2.9. Fibrosis Assessment
2.10. Steatosis Assessment
3. Discussion
Limitations
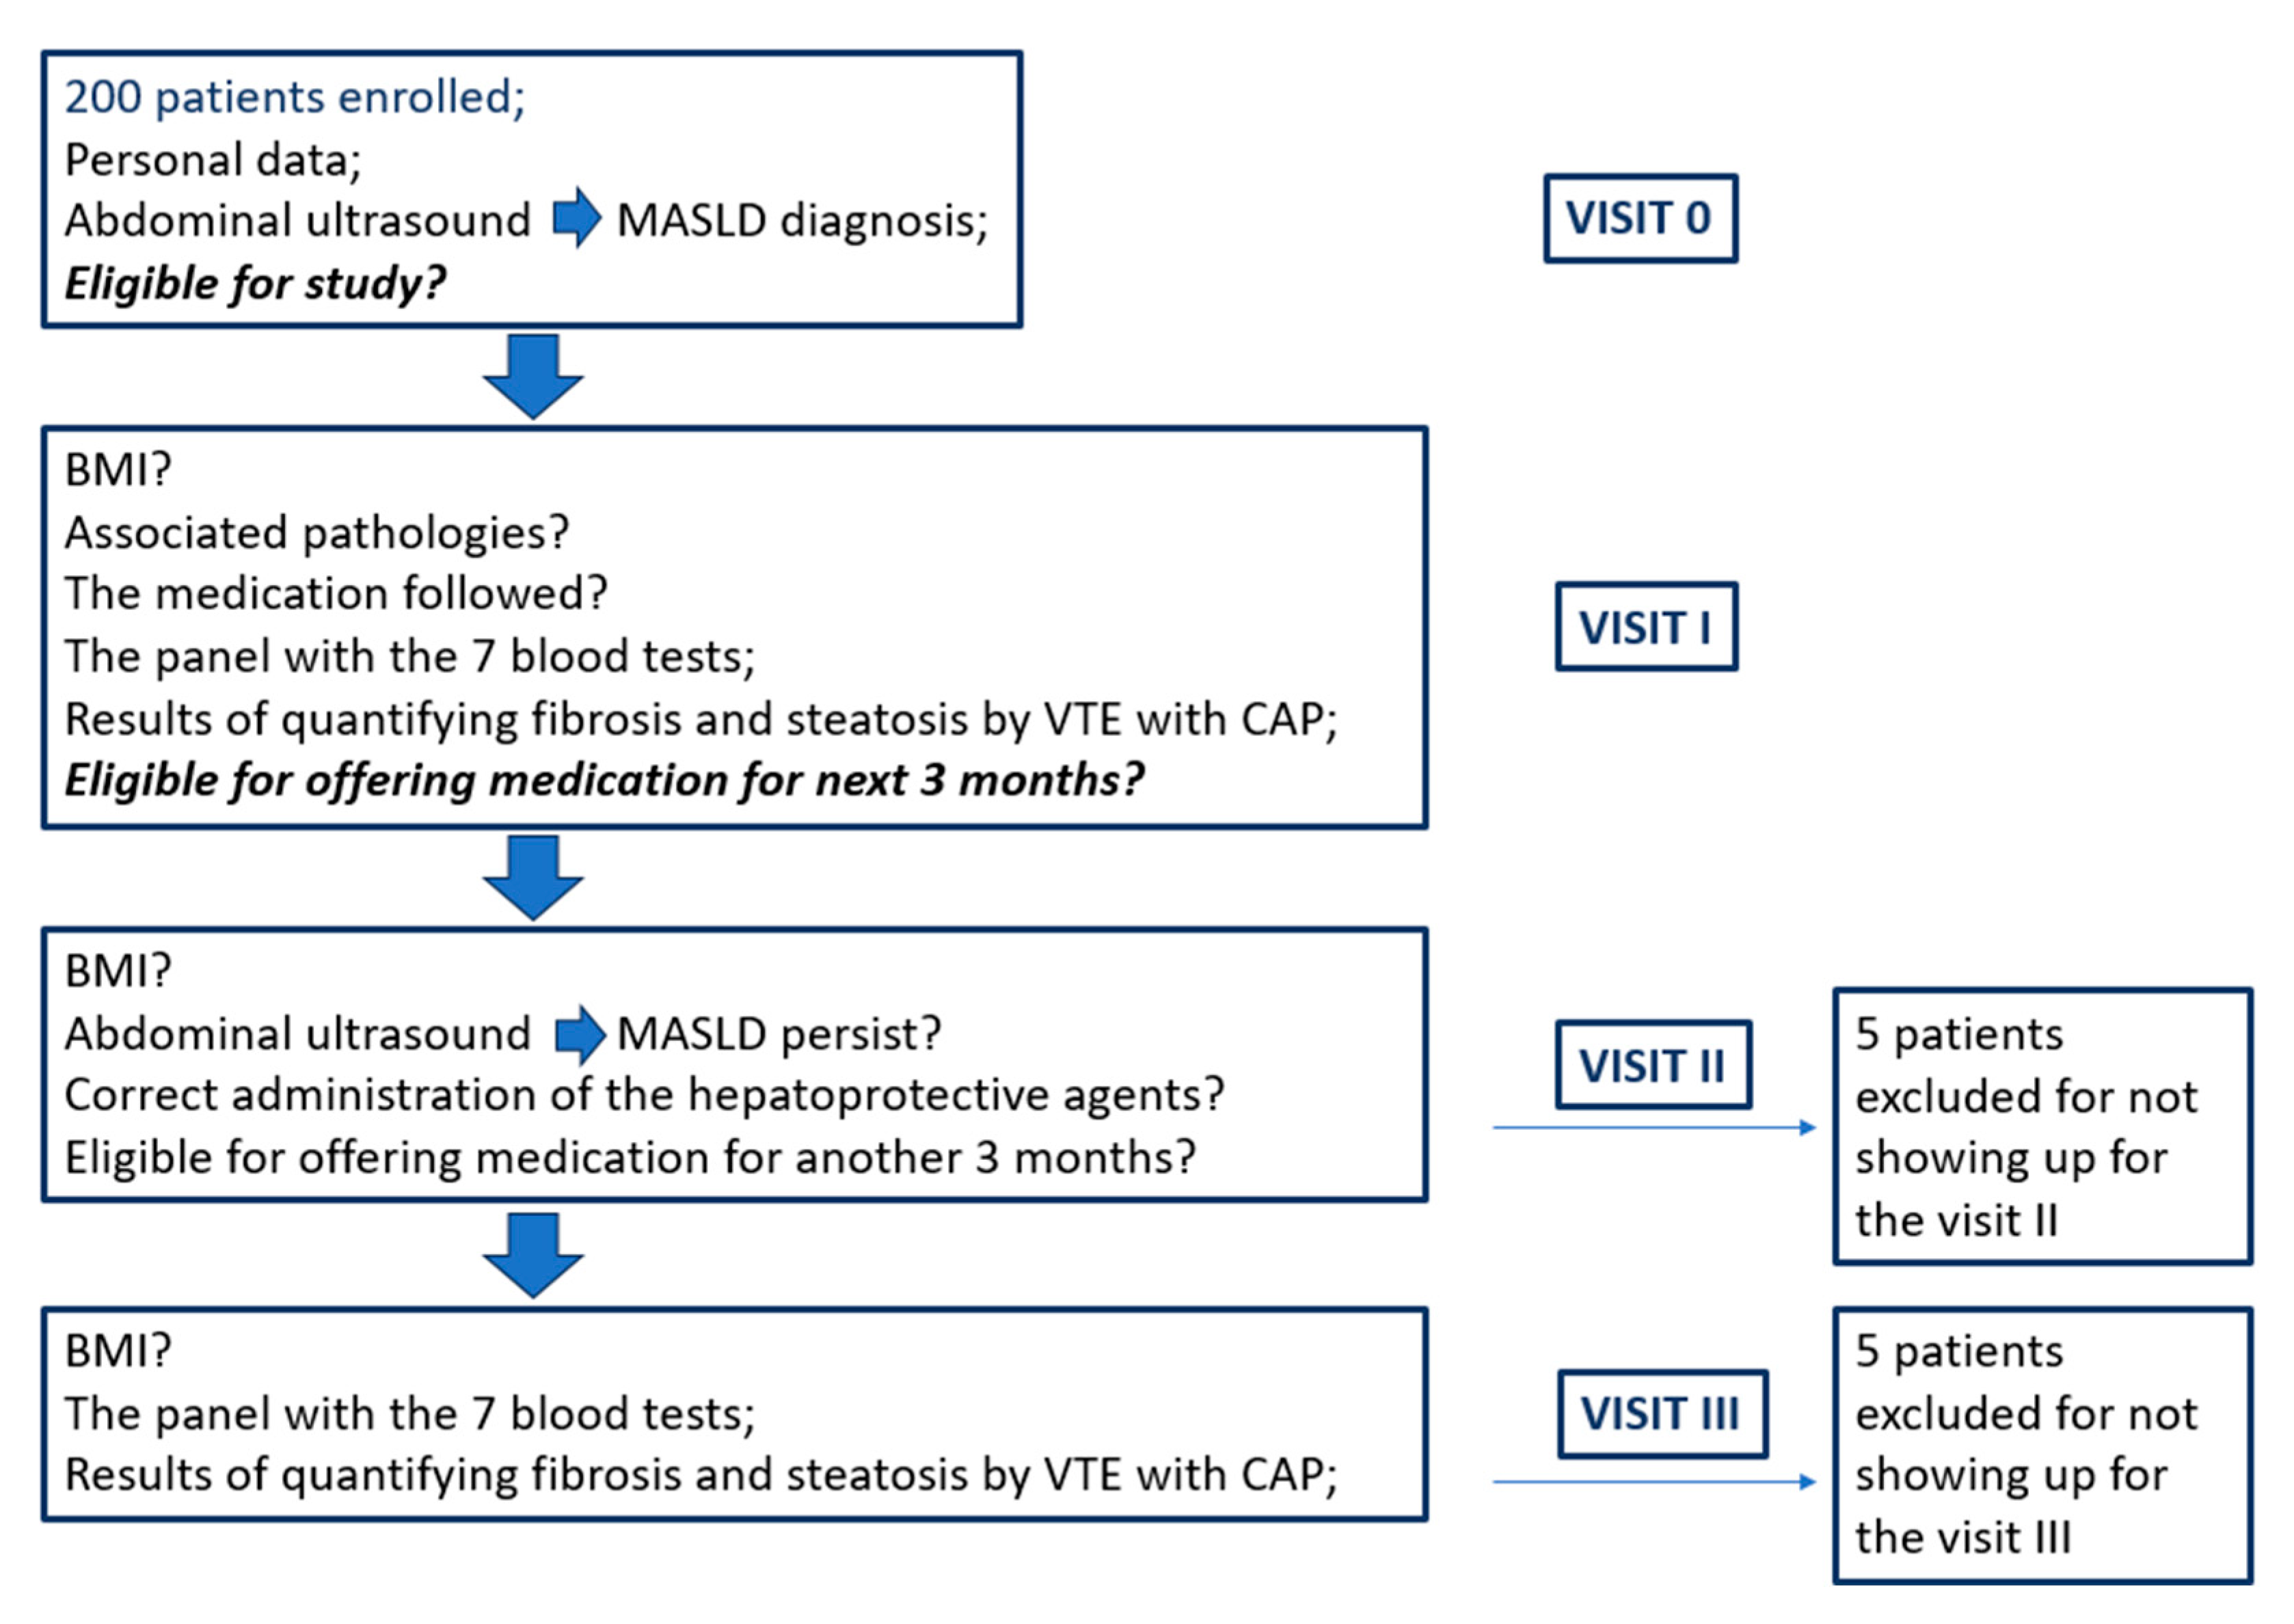
4. Materials and Methods
5. Conclusions
Author Contributions
Funding
Institutional Review Board Statement
Informed Consent Statement
Data Availability Statement
Conflicts of Interest
Abbreviations
| MASLD | Metabolic dysfunction-associated steatotic liver disease |
| MASH | Metabolic dysfunction-associated steatohepatitis |
| MRE | Magnetic resonance elastography |
| VCTE | Vibration-controlled transient elastography |
| CAP | Controlled attenuation parameter |
| LSM | Liver stiffness measurement |
| ROS | Reactive oxygen species |
| LDL | Low-density lipoproteins |
| TG | Triglycerides |
| MG | MILLIGRAMS |
| BID | Twice daily |
| ID | Identity document |
| BMI | Body mass index |
| ALT | Alanine transaminase |
| AST | Aspartate transaminase |
| GGT | Gamma-glutamyl transferase |
| ALP | Alkaline phosphatase |
| TC | Total cholesterol |
| BG | Blood glucose |
| CAP | Controlled attenuation parameter |
| SD | Standard deviation |
| Q1 | First quartile |
| Q3 | Third quartile |
References
- Tacke, F.; Horn, P.; Wai-Sun Wong, V.; Ratziu, V.; Bugianesi, E.; Francque, S.; Zelber-Sagi, S.; Valenti, L.; Roden, M.; Schick, F.; et al. EASL–EASD–EASO Clinical Practice Guidelines on the management of metabolic dysfunction-associated steatotic liver disease (MASLD). J. Hepatol. 2024, 81, 492–542. [Google Scholar] [CrossRef] [PubMed]
- Le, P.; Tatar, M.; Dasarathy, S.; Alkhouri, N.; Herman, W.H.; Taksler, G.B.; Deshpande, A.; Ye, W.; Adekunle, O.A.; McCullough, A.; et al. Estimated Burden of Metabolic Dysfunction–Associated Steatotic Liver Disease in US Adults, 2020 to 2050. JAMA Netw. Open 2025, 8, e2454707. [Google Scholar] [CrossRef] [PubMed]
- Manduca, A.; Bayly, P.J.; Ehman, R.L.; Kolipaka, A.; Royston, T.J.; Sack, I.; Sinkus, R.; Van Beers, B.E. MR elastography: Principles, guidelines, and terminology. Magn. Reson. Med. 2021, 85, 2377–2390. [Google Scholar] [CrossRef]
- Ajmera, V.; Kim, B.K.; Yang, K.; Majzoub, A.M.; Nayfeh, T.; Tamaki, N.; Izumi, N.; Nakajima, A.; Idilman, R.; Gumussoy, M.; et al. Liver Stiffness on Magnetic Resonance Elastography and the MEFIB Index and Liver-Related Outcomes in Nonalcoholic Fatty Liver Disease: A Systematic Review and Meta-Analysis of Individual Participants. Gastroenterology 2022, 163, 1079–1089.e1075. [Google Scholar] [CrossRef]
- Yin, M.; Ehman, R.L. MR Elastography: Practical Questions, From the AJR Special Series on Imaging of Fibrosis. AJR Am. J. Roentgenol. 2024, 222, e2329437. [Google Scholar] [CrossRef]
- Malik, P.; Pillai, S.; Agarwal, K.; Abdelwahed, S.; Bhandari, R.; Singh, A.; Chidharla, A.; Patel, K.; Singh, P.; Manaktala, P.; et al. Diagnostic Accuracy of Elastography and Liver Disease: A Meta-Analysis. Gastroenterol. Res. 2022, 15, 232–239. [Google Scholar] [CrossRef]
- Chon, Y.E.; Jin, Y.J.; An, J.; Kim, H.Y.; Choi, M.; Jun, D.W.; Kim, M.N.; Han, J.W.; Lee, H.A.; Yu, J.H.; et al. Optimal cut-offs of vibration-controlled transient elastography and magnetic resonance elastography in diagnosing advanced liver fibrosis in patients with nonalcoholic fatty liver disease: A systematic review and meta-analysis. Clin. Mol. Hepatol. 2024, 30, S117–S133. [Google Scholar] [CrossRef]
- Ma, Y.; Lee, G.; Heo, S.Y.; Roh, Y.S. Oxidative Stress Is a Key Modulator in the Development of Nonalcoholic Fatty Liver Disease. Antioxidants 2021, 11, 91. [Google Scholar] [CrossRef] [PubMed]
- Delli Bovi, A.P.; Marciano, F.; Mandato, C.; Siano, M.A.; Savoia, M.; Vajro, P. Oxidative Stress in Non-alcoholic Fatty Liver Disease. An Updated Mini Review. Front. Med. 2021, 8, 595371. [Google Scholar] [CrossRef]
- Smirne, C.; Croce, E.; Di Benedetto, D.; Cantaluppi, V.; Comi, C.; Sainaghi, P.P.; Minisini, R.; Grossini, E.; Pirisi, M. Oxidative Stress in Non-Alcoholic Fatty Liver Disease. Livers 2022, 2, 30–76. [Google Scholar] [CrossRef]
- Klisic, A.; Kavaric, N.; Ninic, A.; Kotur-Stevuljevic, J. Oxidative stress and cardiometabolic biomarkers in patients with non-alcoholic fatty liver disease. Sci. Rep. 2021, 11, 18455. [Google Scholar] [CrossRef] [PubMed]
- Bosch, J. Statins for MAFLD/MASH: Another brick in the wall while waiting for final answers. Gut 2025, 74, 518–520. [Google Scholar] [CrossRef]
- Hu, Z.; Yue, H.; Jiang, N.; Qiao, L. Diet, oxidative stress and MAFLD: A mini review. Front. Nutr. 2025, 12, 1539578. [Google Scholar] [CrossRef]
- Chantarojanasiri, T. Silymarin treatment and reduction of liver enzyme levels in non-alcoholic fatty liver disease: A case report. Drugs Context 2023, 12, 1–4. [Google Scholar] [CrossRef]
- Amjad, M.Z.; Hassan, M.U.; Rehman, M.; Shamim, A.; Zeeshan, H.M.; Iftikhar, Z.; Ahmed, A.; Jamil, M.I. Impact of Silymarin Supplementation on Liver Function and Enzyme Profiles in Diverse Chronic Liver Disease Etiologies. Cureus 2024, 16, e76313. [Google Scholar] [CrossRef] [PubMed]
- Wu, J.; Wen, L.; Liu, X.; Li, Q.; Sun, Z.; Liang, C.; Xie, F.; Li, X. Silybin: A Review of Its Targeted and Novel Agents for Treating Liver Diseases Based on Pathogenesis. Phytother. Res. 2024, 38, 5713–5740. [Google Scholar] [CrossRef] [PubMed]
- Dajani, A.I.; Popovic, B. Essential phospholipids for nonalcoholic fatty liver disease associated with metabolic syndrome: A systematic review and network meta-analysis. World J. Clin. Cases. 2020, 8, 5235–5249. [Google Scholar] [CrossRef]
- Khaliq, A.; Badshah, H.; Shah, Y. Combination therapy with vitamin E and ertugliflozin in patients with non-alcoholic fatty liver disease and type 2 diabetes mellitus: A randomized clinical trial. Ir. J. Med. Sci. 2025. [Google Scholar] [CrossRef]
- Song, Y.; Ni, W.; Zheng, M.; Sheng, H.; Wang, J.; Xie, S.; Yang, Y.; Chi, X.; Chen, J.; He, F.; et al. Vitamin E (300 mg) in the treatment of MASH: A multi-center, randomized, double-blind, placebo-controlled study. Cell Rep. Med. 2025, 6, 101939. [Google Scholar] [CrossRef]
- Abera, M.; Suresh, S.B.; Malireddi, A.; Boddeti, S.; Noor, K.; Ansar, M.; Malasevskaia, I. Vitamin E and Non-alcoholic Fatty Liver Disease: Investigating the Evidence Through a Systematic Review. Cureus 2024, 16, e72596. [Google Scholar] [CrossRef]
- Pinyopornpanish, K.; Leerapun, A.; Pinyopornpanish, K.; Chattipakorn, N. Effects of Metformin on Hepatic Steatosis in Adults with Nonalcoholic Fatty Liver Disease and Diabetes: Insights from the Cellular to Patient Levels. Gut Liver 2021, 15, 827–840. [Google Scholar] [CrossRef] [PubMed]
- Ren, R.; Pei, Y.; Kong, L.; Shi, Y. The effect of semaglutide combined with metformin on liver inflammation and pancreatic beta-cell function in patients with type 2 diabetes and non-alcoholic fatty liver disease. J. Diabetes Complicat. 2025, 39, 108932. [Google Scholar] [CrossRef] [PubMed]
- Abenavoli, L.; Marta, G.; Immacolata, N.; Valentina, P.; Natasa, M.; Francesca, A.; Daniela, F.; Elio, G.; Luzza, F. Effects of Mediterranean diet supplemented with silybin–vitamin E–phospholipid complex in overweight patients with non-alcoholic fatty liver disease. Expert Rev. Gastroenterol. Hepatol. 2015, 9, 519–527. [Google Scholar] [CrossRef] [PubMed]
- Al-Baiaty, F.D.R.; Ismail, A.; Abdul Latiff, Z.; Muhammad Nawawi, K.N.; Raja Ali, R.A.; Mokhtar, N.M. Possible Hepatoprotective Effect of Tocotrienol-Rich Fraction Vitamin E in Non-alcoholic Fatty Liver Disease in Obese Children and Adolescents. Front. Pediatr. 2021, 9, 667247. [Google Scholar] [CrossRef]
- Pervez, M.A.; Khan, D.A.; Mirza, S.A.; Slehria, A.U.R.; Nisar, U.; Aamir, M. Comparison of delta-tocotrienol and alpha-tocopherol effects on hepatic steatosis and inflammatory biomarkers in patients with non-alcoholic fatty liver disease: A randomized double-blind active-controlled trial. Complement. Ther. Med. 2022, 70, 102866. [Google Scholar] [CrossRef]
- Trappoliere, M.; Federico, A.; Tuccillo, C.; de Sio, I.; Di Leva, A.; Niosi, M.; D’Auria, M.; Loguercio, C. [Effects of a new pharmacological complex (silybin + vitamin-E + phospholipids) on some markers of the metabolic syndrome and of liver fibrosis in patients with hepatic steatosis. Preliminary study]. Minerva Gastroenterol. Dietol. 2005, 51, 193–199. [Google Scholar]


| Characteristics | Esentin Trio® (n = 190) |
|---|---|
| Age, years | |
| Mean (SD) | 47.66 ± 10.43 |
| Median (Q1, Q3) | 47 (39.75–55.25) |
| Sex, male, n (%) | 100 (52.6%) |
| BMI, kg·m−2 | |
| Mean (SD) | 28.97 ± 4.24 |
| Median (Q1, Q3) | 29 (26–32) |
| Alcohol consumption, n (%) | |
| No | 50 (26.3%) |
| Occasional | 109 (57.4%) |
| Frequent | 25 (13.2%) |
| Daily | 6 (3.2%) |
| Type 2 diabetes, n (%) | 67 (35.3%) |
| Hypertension, n (%) | 77 (40.5%) |
| Dyslipidemia, n (%) | 94 (49.5%) |
| Hypothyroidism, n (%) | 29 (15.3%) |
| Fibrosis grade, n (%) | |
| F0–F1 | 156 (82.1%) |
| F2 | 23 (12.1%) |
| F3 | 10 (5.3%) |
| F4 | 1 (0.5%) |
| Steatosis grade, n (%) | |
| S1 | 42 (22.1%) |
| S2 | 74 (38.9%) |
| S3 | 74 (38.9%) |
| Clinical Characteristics | Baseline | After 6 Months of Treatment | p-Value |
|---|---|---|---|
| FibroScan VCTE/LSM, kPa | 0.018 | ||
| mean (SD) | 6.14 ± 6.68 | 5 ± 1.42 | |
| median (Q1, Q3) | 5.4 (4.6–6.5) | 5 (4.4–6.4) | |
| FibroScan CAP, dBm | <0.0001 | ||
| mean (SD) | 296.05 ± 36.82 | 269 ± 39.22 | |
| median (Q1, Q3) | 293 (271.5–310) | 266 (246.25–286.75) | |
| ALT, UI−1 | <0.0001 | ||
| mean (SD) | 58.65 ± 38.44 | 37 ± 20.68 | |
| median (Q1, Q3) | 46.5 (27.75–84.25) | 30 (20–49.75) | |
| AST, UI−1 | <0.0001 | ||
| mean (SD) | 49.5 ± 31.07 | 33 ± 16.6 | |
| median (Q1, Q3) | 40.5 (23–69) | 28 (20.3–43) | |
| GGT, UI−1 | <0.0001 | ||
| mean (SD) | 73.47 ± 48.54 | 57 ± 35.96 | |
| median (Q1, Q3) | 59 (34–115) | 45 (28–86) | |
| ALP, UI−1 | 0.022 | ||
| mean (SD) | 79.33 ± 33.03 | 74 ± 24.68 | |
| median (Q1, Q3) | 75.5 (57.83–95.5) | 70 (58–88.75) | |
| TG, mg·dL−1 | <0.0001 | ||
| mean (SD) | 163.04 ± 65.89 | 147 ± 64 | |
| median (Q1, Q3) | 163 (126–200.5) | 146 (117–167) | |
| TC, mg·dL−1 | <0.0001 | ||
| mean (SD) | 222.73 ± 46.22 | 196 ± 35.26 | |
| median (Q1, Q3) | 226.5 (195–260) | 200 (178–217.75) | |
| BG, mg/dL | <0.0001 | ||
| mean (SD) | 108.11 ± 28.55 | 98 ± 21.84 | |
| median (Q1, Q3) | 104 (90–117.25) | 96 (86–105.75) |
Disclaimer/Publisher’s Note: The statements, opinions and data contained in all publications are solely those of the individual author(s) and contributor(s) and not of MDPI and/or the editor(s). MDPI and/or the editor(s) disclaim responsibility for any injury to people or property resulting from any ideas, methods, instructions or products referred to in the content. |
© 2025 by the authors. Licensee MDPI, Basel, Switzerland. This article is an open access article distributed under the terms and conditions of the Creative Commons Attribution (CC BY) license (https://creativecommons.org/licenses/by/4.0/).
Share and Cite
Gheonea, D.-I.; Tocia, C.; Sacerdoțianu, V.-M.; Bocioagă, A.-G.; Doica, I.-P.; Manea, N.C.; Turcu-Știolică, A.; Oancea, C.-N.; Dumitru, E. Therapeutic Efficacy of Silymarin, Vitamin E, and Essential Phospholipid Combination Therapy on Hepatic Steatosis, Fibrosis, and Metabolic Parameters in MASLD Patients: A Prospective Clinical Study. Int. J. Mol. Sci. 2025, 26, 5427. https://doi.org/10.3390/ijms26125427
Gheonea D-I, Tocia C, Sacerdoțianu V-M, Bocioagă A-G, Doica I-P, Manea NC, Turcu-Știolică A, Oancea C-N, Dumitru E. Therapeutic Efficacy of Silymarin, Vitamin E, and Essential Phospholipid Combination Therapy on Hepatic Steatosis, Fibrosis, and Metabolic Parameters in MASLD Patients: A Prospective Clinical Study. International Journal of Molecular Sciences. 2025; 26(12):5427. https://doi.org/10.3390/ijms26125427
Chicago/Turabian StyleGheonea, Dan-Ionuț, Cristina Tocia, Victor-Mihai Sacerdoțianu, Alexandra-Georgiana Bocioagă, Irina-Paula Doica, Nicolae Cătălin Manea, Adina Turcu-Știolică, Carmen-Nicoleta Oancea, and Eugen Dumitru. 2025. "Therapeutic Efficacy of Silymarin, Vitamin E, and Essential Phospholipid Combination Therapy on Hepatic Steatosis, Fibrosis, and Metabolic Parameters in MASLD Patients: A Prospective Clinical Study" International Journal of Molecular Sciences 26, no. 12: 5427. https://doi.org/10.3390/ijms26125427
APA StyleGheonea, D.-I., Tocia, C., Sacerdoțianu, V.-M., Bocioagă, A.-G., Doica, I.-P., Manea, N. C., Turcu-Știolică, A., Oancea, C.-N., & Dumitru, E. (2025). Therapeutic Efficacy of Silymarin, Vitamin E, and Essential Phospholipid Combination Therapy on Hepatic Steatosis, Fibrosis, and Metabolic Parameters in MASLD Patients: A Prospective Clinical Study. International Journal of Molecular Sciences, 26(12), 5427. https://doi.org/10.3390/ijms26125427