
Molecular Imaging: Unveiling Metabolic Abnormalities in Pancreatic Cancer


Abstract
1. Introduction
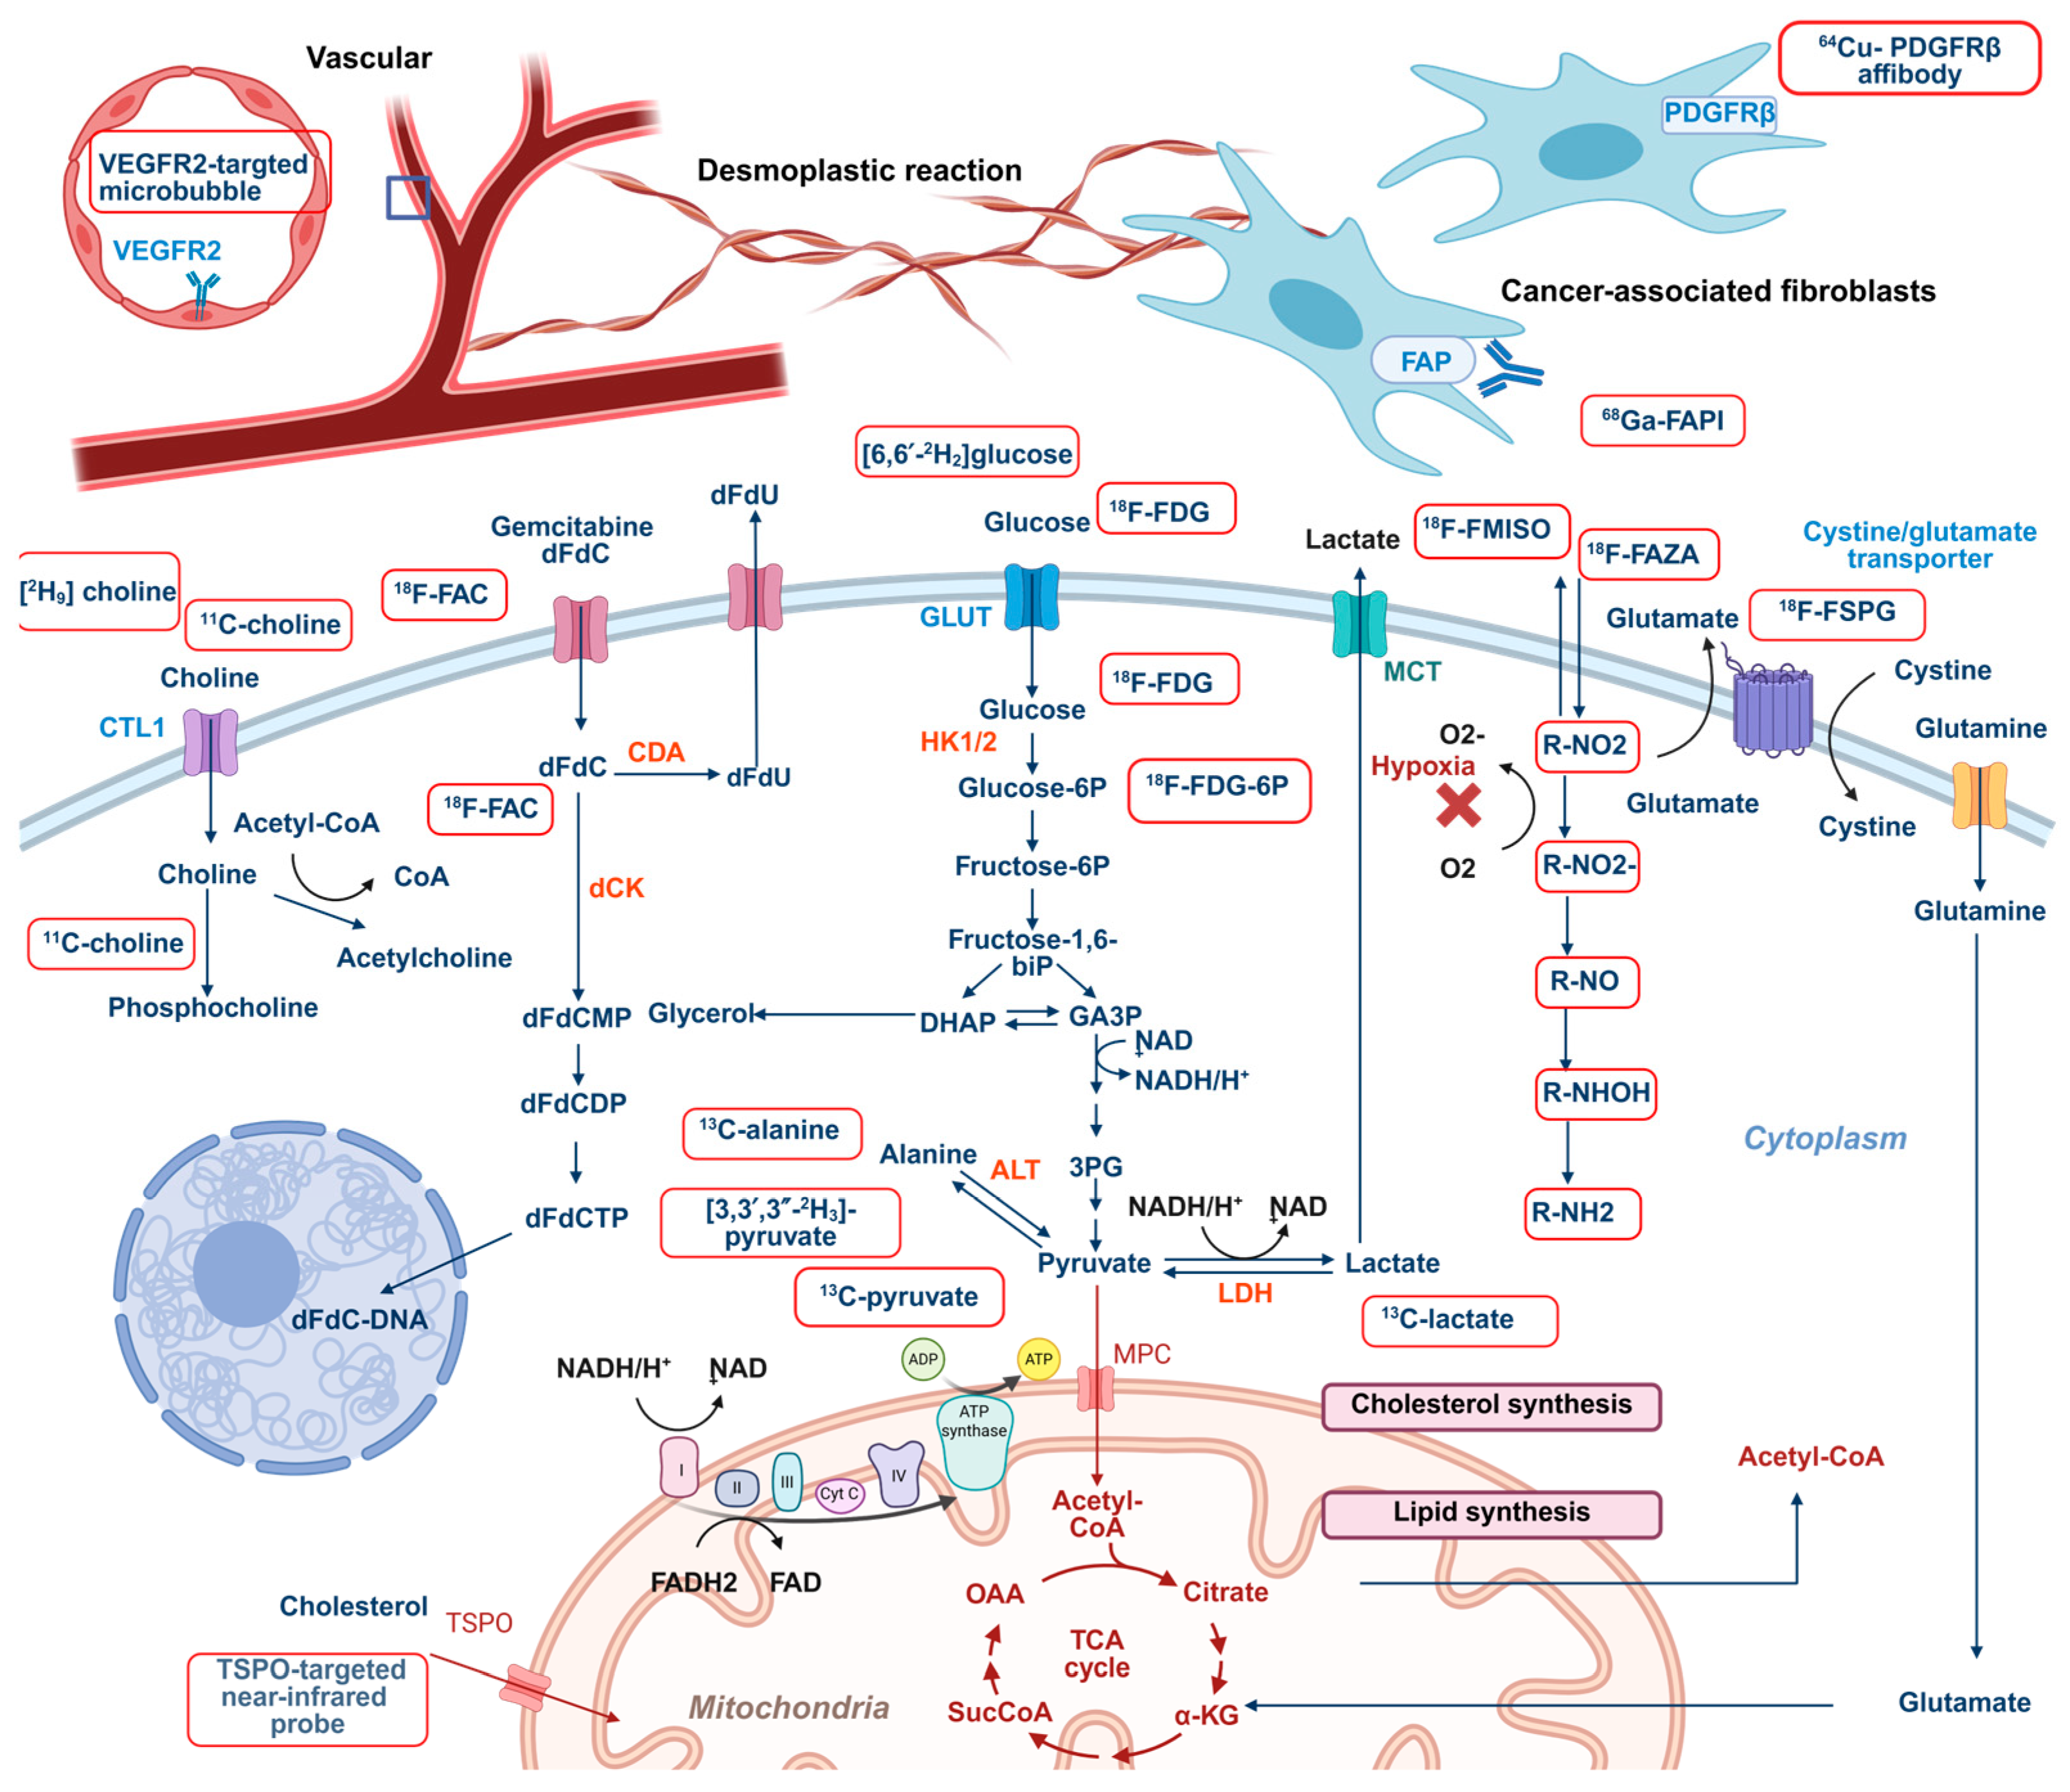
2. Molecular Imaging of Key Metabolic Pathways in Pancreatic Cancer: Glucose, Lipids, and Amino Acids
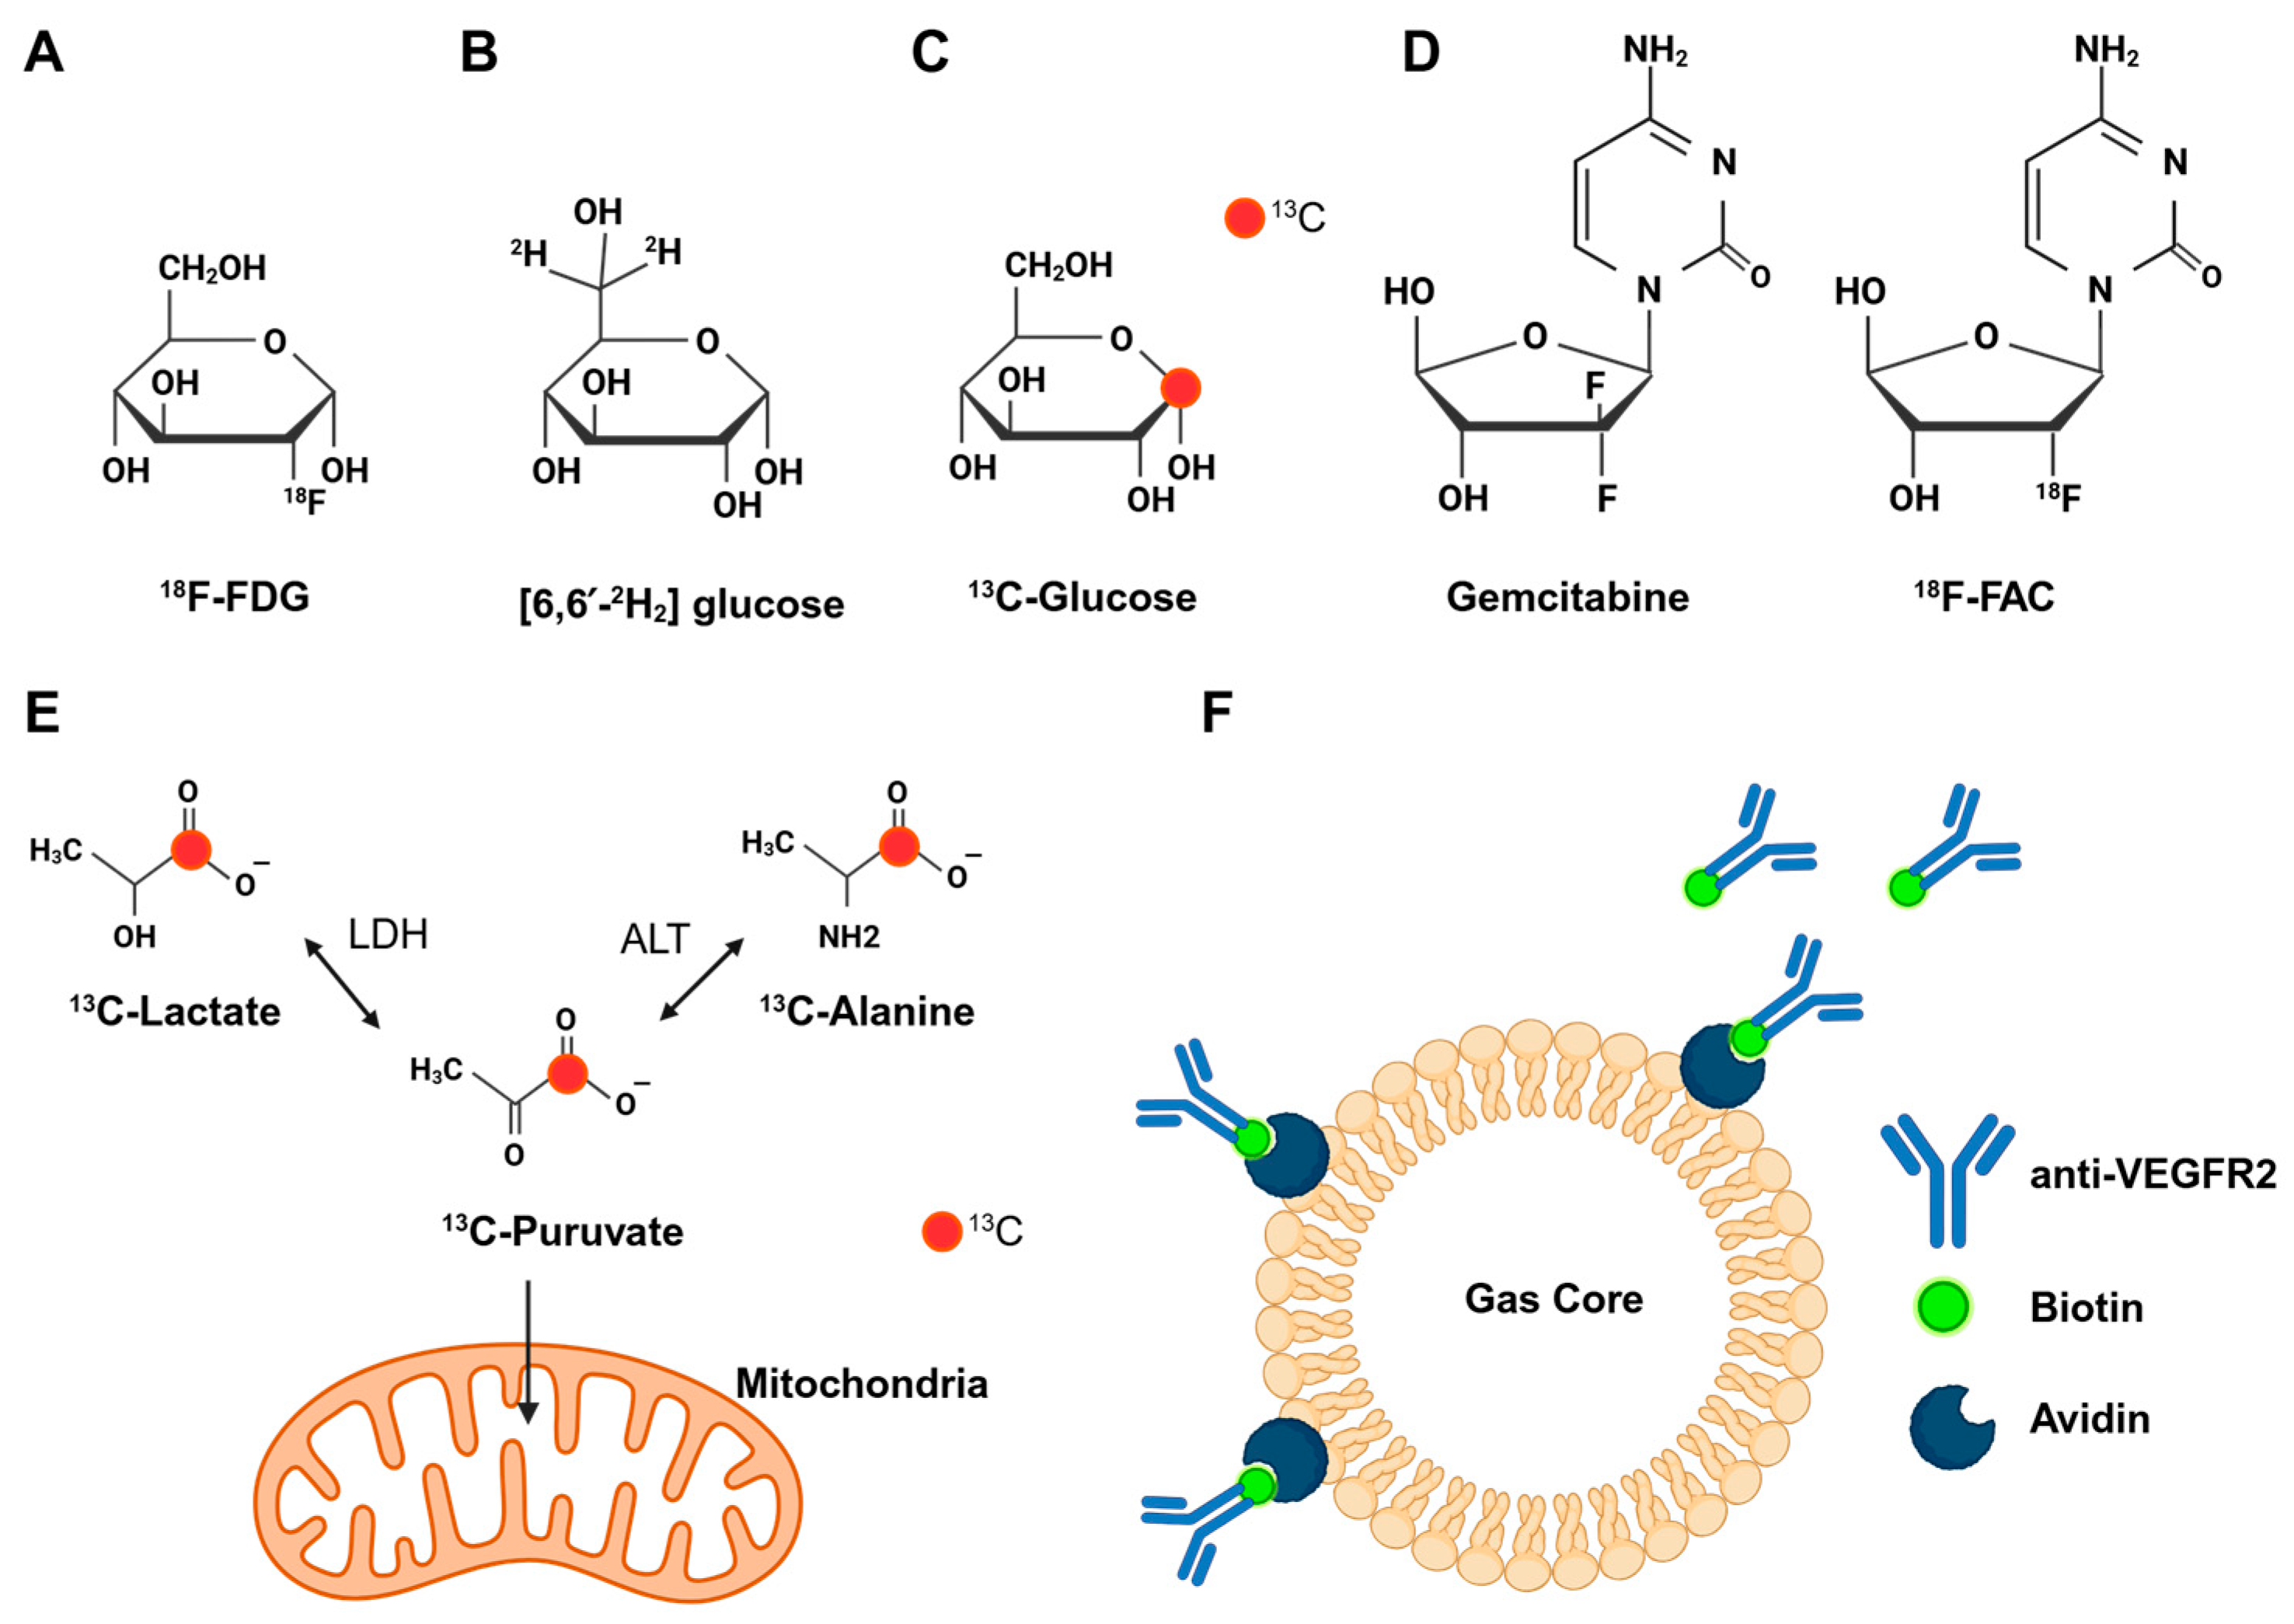
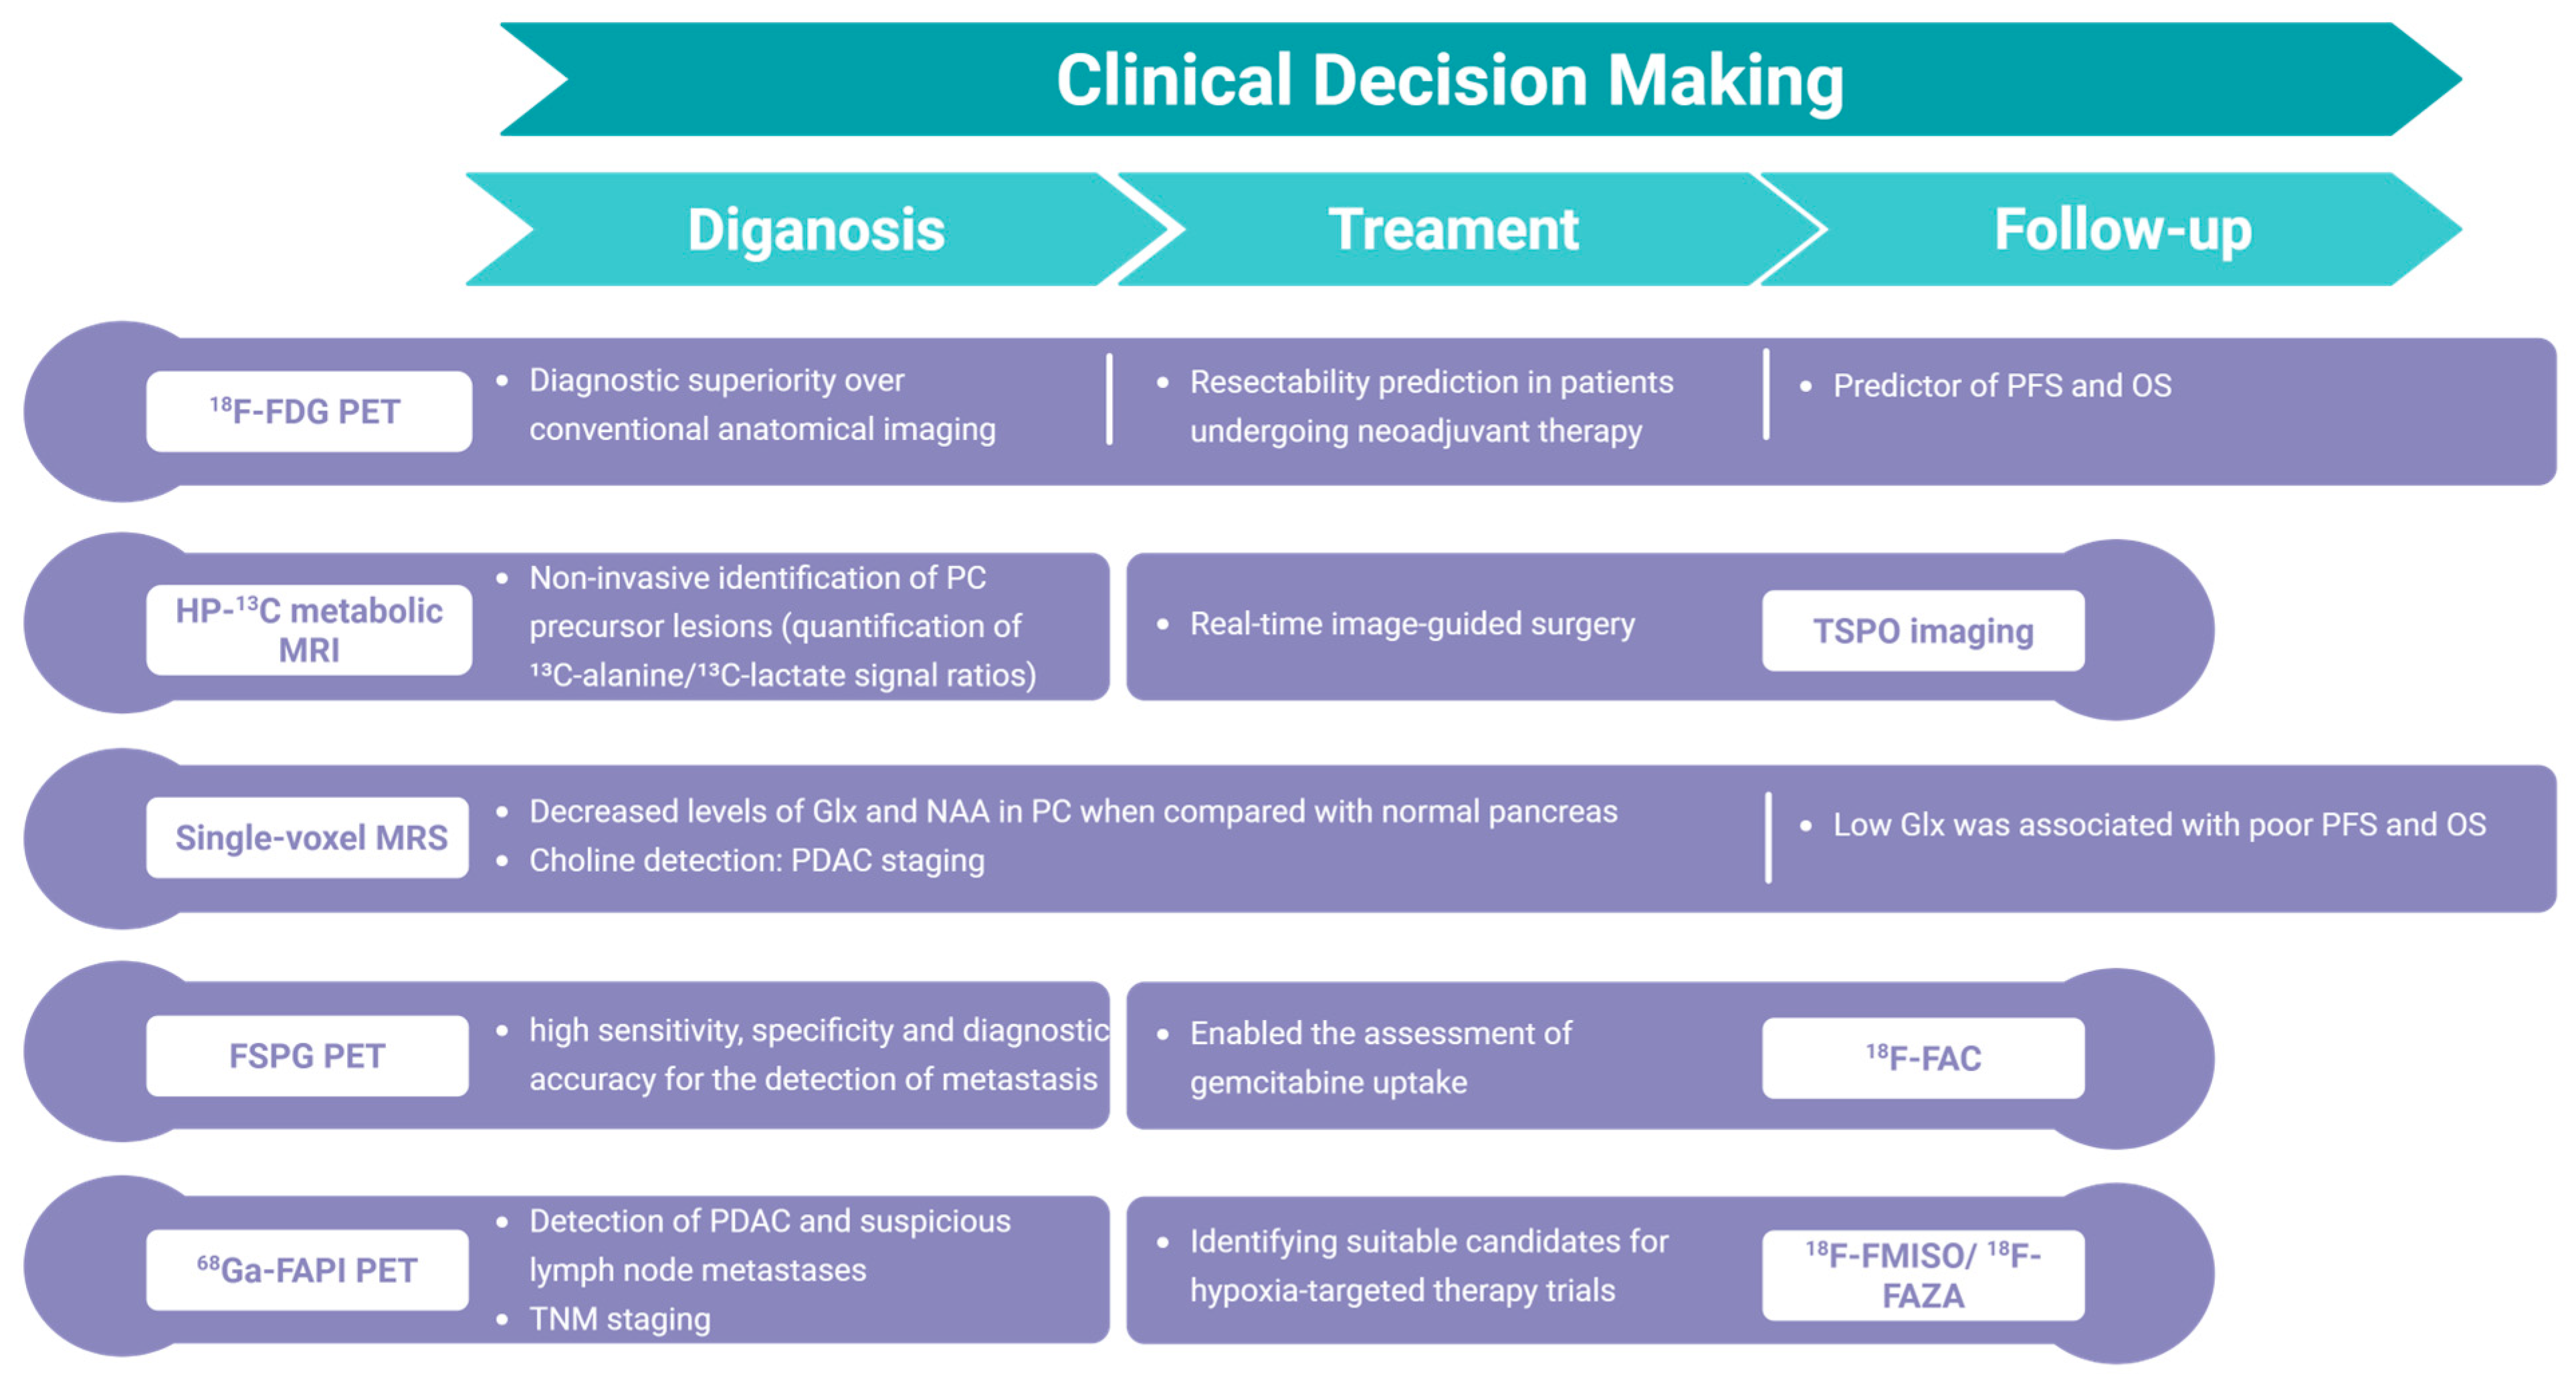
2.1. Imaging Glucose Metabolism
2.2. Imaging Amino Acid Metabolism
2.3. Imaging Lipid Metabolism
3. Imaging Phenotypic Consequences of Cancer Metabolism and Microenvironment
3.1. Imaging Redox Homeostasis
3.2. Imaging the Metabolism of Chemotherapy Drugs
3.3. Imaging Tumor Microenvironment: Hypoxia, Desmoplasia, and Vascularization
4. The Role of Artificial Intelligence (AI) in Enhancing Metabolic Imaging Interpretation
5. Discussion and Conclusions
Funding
Conflicts of Interest
Abbreviations
| 18F-FAC | 2′-deoxy-2′-18F-fluoro-β-d-arabinofuranosylcytosine |
| AI | Artificial intelligence |
| CAFs | Cancer-associated fibroblasts |
| CB2R | Cannabinoid receptor type 2 |
| CD36 | Fatty acid translocase |
| CECT | Contrast-enhanced computed tomography |
| CEUS | Contrast-enhanced ultrasound |
| Chkα | Choline kinase-α |
| dCK | Deoxycytidine kinase |
| dFdC | 2′,2′-difluorodeoxycytidine |
| DMI | Deuterium metabolic imaging |
| FA | Fatty acid |
| FABPs | Fatty acid-binding proteins |
| FAD | Flavin adenine dinucleotide |
| FAPI | FAP inhibitor |
| FATPs | Fatty acid transport proteins |
| FCH | 18F-fluoro-choline |
| FEC | 18F-fluoroethyl-choline |
| FSPG | (4S)-4-(3-18F-Fluoropropyl)-l-glutamate |
| G6Pase | Glucose-6-phosphatase |
| Ga68 | Gallium-68 |
| Gln | Glutamine |
| GLUD1 | Glutamate dehydrogenase |
| GLUL | Glutamate ammonia ligase |
| GLUT1 | Glucose transporter1 |
| GOT1 | Aspartate transaminase |
| HK1/2 | Hexokinase 1/2 |
| HNSCC | Head and neck squamous cell carcinoma |
| HP | Hyperpolarized |
| IHC | Immunohistochemical |
| LDH | Lactate dehydrogenase |
| LDLR | Low-density lipoprotein receptor |
| MRI | Magnetic resonance imaging |
| MRS | Magnetic resonance spectroscopy |
| MSI | Mass spectrometry imaging |
| NAA | N-acetylaspartate |
| NADPH | Nicotinamide dinucleotide |
| NIR | Near-infrared |
| O2 | Oxygen |
| OMI | Optical metabolic imaging |
| ORR | Optical redox ratio |
| OS | Overall survival |
| OXPHOS | Oxidative phosphorylation |
| PA | Photoacoustic |
| PC | Pancreatic cancer |
| PDAC | Pancreatic adenocarcinoma |
| PDGFRβ | Platelet-derived growth factor receptor beta |
| PDO | PDAC-derived patient organoids |
| PEGPH20 | PEGylated recombinant human hyaluronidase |
| PET | Positron emission tomography |
| PFK1 | Phosphofructokinase1 |
| PFS | Progression-free survival |
| PPP | Pentose phosphate pathway |
| PSC | Pancreatic stellate cells |
| ROS | Reactive oxygen species |
| scRNAseq | Single-cell RNA sequencing |
| SUV | Standardized uptake value |
| TCA | Tricarboxylic acid |
| TME | Tumor microenvironment |
| TSPO | Translocator protein |
| US | Ultrasound |
| VEGFR2 | Vascular endothelial growth factor receptor type 2 |
References
- Siegel, R.L.; Giaquinto, A.N.; Jemal, A. Cancer statistics, 2024. CA Cancer J. Clin. 2024, 74, 12–49. [Google Scholar] [CrossRef] [PubMed]
- Mizrahi, J.D.; Surana, R.; Valle, J.W.; Shroff, R.T. Pancreatic cancer. Lancet 2020, 395, 2008–2020. [Google Scholar] [CrossRef] [PubMed]
- Zeng, S.; Pöttler, M.; Lan, B.; Grützmann, R.; Pilarsky, C.; Yang, H. Chemoresistance in Pancreatic Cancer. Int. J. Mol. Sci. 2019, 20, 4504. [Google Scholar] [CrossRef] [PubMed]
- Hanahan, D.; Weinberg, R.A. Hallmarks of cancer: The next generation. Cell 2011, 144, 646–674. [Google Scholar] [CrossRef]
- Park, W.; Chawla, A.; O’Reilly, E.M. Pancreatic Cancer: A Review. JAMA 2021, 326, 851–862. [Google Scholar] [CrossRef]
- De Santis, M.C.; Bockorny, B.; Hirsch, E.; Cappello, P.; Martini, M. Exploiting pancreatic cancer metabolism: Challenges and opportunities. Trends Mol. Med. 2024, 30, 592–604. [Google Scholar] [CrossRef]
- Qin, C.; Yang, G.; Yang, J.; Ren, B.; Wang, H.; Chen, G.; Zhao, F.; You, L.; Wang, W.; Zhao, Y. Metabolism of pancreatic cancer: Paving the way to better anticancer strategies. Mol. Cancer 2020, 19, 50. [Google Scholar] [CrossRef]
- Biankin, A.V.; Waddell, N.; Kassahn, K.S.; Gingras, M.C.; Muthuswamy, L.B.; Johns, A.L.; Miller, D.K.; Wilson, P.J.; Patch, A.M.; Wu, J.; et al. Pancreatic cancer genomes reveal aberrations in axon guidance pathway genes. Nature 2012, 491, 399–405. [Google Scholar] [CrossRef]
- Humpton, T.J.; Alagesan, B.; DeNicola, G.M.; Lu, D.; Yordanov, G.N.; Leonhardt, C.S.; Yao, M.A.; Alagesan, P.; Zaatari, M.N.; Park, Y.; et al. Oncogenic KRAS Induces NIX-Mediated Mitophagy to Promote Pancreatic Cancer. Cancer Discov. 2019, 9, 1268–1287. [Google Scholar] [CrossRef]
- Ying, H.; Kimmelman, A.C.; Lyssiotis, C.A.; Hua, S.; Chu, G.C.; Fletcher-Sananikone, E.; Locasale, J.W.; Son, J.; Zhang, H.; Coloff, J.L.; et al. Oncogenic Kras maintains pancreatic tumors through regulation of anabolic glucose metabolism. Cell 2012, 149, 656–670. [Google Scholar] [CrossRef]
- Dey, P.; Li, J.; Zhang, J.; Chaurasiya, S.; Strom, A.; Wang, H.; Liao, W.T.; Cavallaro, F.; Denz, P.; Bernard, V.; et al. Oncogenic KRAS-Driven Metabolic Reprogramming in Pancreatic Cancer Cells Utilizes Cytokines from the Tumor Microenvironment. Cancer Discov. 2020, 10, 608–625. [Google Scholar] [CrossRef] [PubMed]
- Collisson, E.A.; Bailey, P.; Chang, D.K.; Biankin, A.V. Molecular subtypes of pancreatic cancer. Nat. Rev. Gastroenterol. Hepatol. 2019, 16, 207–220. [Google Scholar] [CrossRef] [PubMed]
- Suurmeijer, J.A.; Soer, E.C.; Dings, M.P.G.; Kim, Y.; Strijker, M.; Bonsing, B.A.; Brosens, L.A.A.; Busch, O.R.; Groen, J.V.; Halfwerk, J.B.G.; et al. Impact of classical basal-like molecular subtypes on overall survival in resected pancreatic cancer in the SPACIOUS-2 multicentre study. Br. J. Surg. 2022, 109, 1150–1155. [Google Scholar] [CrossRef] [PubMed]
- Ali, H.A.; Karasinska, J.M.; Topham, J.T.; Johal, D.; Kalloger, S.; Metcalfe, A.; Warren, C.S.; Miyagi, A.; Tao, L.V.; Kevorkova, M.; et al. Pancreatic cancer tumor organoids exhibit subtype-specific differences in metabolic profiles. Cancer Metab. 2024, 12, 28. [Google Scholar] [CrossRef]
- Liang, C.; Qin, Y.; Zhang, B.; Ji, S.; Shi, S.; Xu, W.; Liu, J.; Xiang, J.; Liang, D.; Hu, Q.; et al. Energy sources identify metabolic phenotypes in pancreatic cancer. Acta Biochim. Biophys. Sin. 2016, 48, 969–979. [Google Scholar] [CrossRef]
- Rong, Z.; Yang, J.; Liu, J.; Meng, Q.; Hua, J.; Tan, Z.; Zhang, B.; Liu, Y.; Du, Q.; Wang, W.; et al. Dense stroma activates the TGF-β1/FBW7 axis to induce metabolic subtype switching in pancreatic cancer. Int. J. Surg. 2025, 111, 1891–1903. [Google Scholar] [CrossRef]
- Karasinska, J.M.; Topham, J.T.; Kalloger, S.E.; Jang, G.H.; Denroche, R.E.; Culibrk, L.; Williamson, L.M.; Wong, H.L.; Lee, M.K.C.; O’Kane, G.M.; et al. Altered Gene Expression along the Glycolysis-Cholesterol Synthesis Axis Is Associated with Outcome in Pancreatic Cancer. Clin. Cancer Res. 2020, 26, 135–146. [Google Scholar] [CrossRef]
- Mehla, K.; Singh, P.K. Metabolic Subtyping for Novel Personalized Therapies Against Pancreatic Cancer. Clin. Cancer Res. 2020, 26, 6–8. [Google Scholar] [CrossRef]
- Vaezi, M.A.; Nekoufar, S.; Robati, A.K.; Salimi, V.; Tavakoli-Yaraki, M. Therapeutic potential of β-hydroxybutyrate in the management of pancreatic neoplasms: Exploring novel diagnostic and treatment strategies. Lipids Health Dis. 2024, 23, 376. [Google Scholar] [CrossRef]
- Ruan, T.; Keshari, K.R. Imaging Tumor Metabolism. Cold Spring Harb. Perspect. Med. 2024, 15, a041551. [Google Scholar] [CrossRef]
- Wartski, M.; Sauvanet, A. 18F-FDG PET/CT in pancreatic adenocarcinoma: A role at initial imaging staging? Diagn. Interv. Imaging 2019, 100, 735–741. [Google Scholar] [CrossRef] [PubMed]
- Rowe, S.P.; Pomper, M.G. Molecular imaging in oncology: Current impact future directions. CA Cancer J. Clin. 2022, 72, 333–352. [Google Scholar] [CrossRef] [PubMed]
- Serrao, E.M.; Kettunen, M.I.; Rodrigues, T.B.; Dzien, P.; Wright, A.J.; Gopinathan, A.; Gallagher, F.A.; Lewis, D.Y.; Frese, K.K.; Almeida, J.; et al. MRI with hyperpolarised [1–13C]pyruvate detects advanced pancreatic preneoplasia prior to invasive disease in a mouse model. Gut 2016, 65, 465–475. [Google Scholar] [CrossRef]
- Wang, Z.J.; Ohliger, M.A.; Larson, P.E.Z.; Gordon, J.W.; Bok, R.A.; Slater, J.; Villanueva-Meyer, J.E.; Hess, C.P.; Kurhanewicz, J.; Vigneron, D.B. Hyperpolarized (13)C MRI: State of the Art and Future Directions. Radiology 2019, 291, 273–284. [Google Scholar] [CrossRef]
- Zhang, G.; Keshari, K.R. Deuterium Metabolic Imaging of Pancreatic Cancer. NMR Biomed. 2021, 34, e4603. [Google Scholar] [CrossRef]
- Koppenol, W.H.; Bounds, P.L.; Dang, C.V. Otto Warburg’s contributions to current concepts of cancer metabolism. Nat. Rev. Cancer 2011, 11, 325–337. [Google Scholar] [CrossRef] [PubMed]
- Liu, Y.H.; Hu, C.M.; Hsu, Y.S.; Lee, W.H. Interplays of glucose metabolism and KRAS mutation in pancreatic ductal adenocarcinoma. Cell Death Dis. 2022, 13, 817. [Google Scholar] [CrossRef]
- Yan, L.; Raj, P.; Yao, W.; Ying, H. Glucose Metabolism in Pancreatic Cancer. Cancers 2019, 11, 1460. [Google Scholar] [CrossRef]
- Tanner, L.B.; Goglia, A.G.; Wei, M.H.; Sehgal, T.; Parsons, L.R.; Park, J.O.; White, E.; Toettcher, J.E.; Rabinowitz, J.D. Four Key Steps Control Glycolytic Flux in Mammalian Cells. Cell Syst. 2018, 7, 49–62.e8. [Google Scholar] [CrossRef]
- Yamamoto, K.; Brender, J.R.; Seki, T.; Kishimoto, S.; Oshima, N.; Choudhuri, R.; Adler, S.S.; Jagoda, E.M.; Saito, K.; Devasahayam, N.; et al. Molecular Imaging of the Tumor Microenvironment Reveals the Relationship between Tumor Oxygenation, Glucose Uptake, and Glycolysis in Pancreatic Ductal Adenocarcinoma. Cancer Res. 2020, 80, 2087–2093. [Google Scholar] [CrossRef]
- Gallagher, B.M.; Ansari, A.; Atkins, H.; Casella, V.; Christman, D.R.; Fowler, J.S.; Ido, T.; MacGregor, R.R.; Som, P.; Wan, C.N.; et al. Radiopharmaceuticals, X.X.V.I.I. 18F-labeled 2-deoxy-2-fluoro-d-glucose as a radiopharmaceutical for measuring regional myocardial glucose metabolism in vivo: Tissue distribution and imaging studies in animals. J. Nucl. Med. 1977, 18, 990–996. [Google Scholar] [PubMed]
- Huang, S.; Chong, H.; Sun, X.; Wu, Z.; Jia, Q.; Zhang, Y.; Lan, X. The Value of (18)F-FDGPET/CTin Diagnosing Pancreatic Lesions: Comparison With, C.A.1.9.–.9.; Enhanced CTor Enhanced, M.R. Front. Med. 2021, 8, 668697. [Google Scholar] [CrossRef] [PubMed]
- Wang, X.Y.; Yang, F.; Jin, C.; Fu, D.L. Utility of PET/CTin diagnosis staging assessment of resectability metabolic response of pancreatic cancer. World J. Gastroenterol. 2014, 20, 15580–15589. [Google Scholar] [CrossRef] [PubMed]
- Pimiento, J.M.; Davis-Yadley, A.H.; Kim, R.D.; Chen, D.T.; Eikman, E.A.; Berman, C.G.; Malafa, M.P. Metabolic Activity by 18F-FDG-PET/CT Is Prognostic for Stage I and II Pancreatic Cancer. Clin. Nucl. Med. 2016, 41, 177–181. [Google Scholar] [CrossRef]
- Smeets, E.M.M.; Withaar, D.S.; Grootjans, W.; Hermans, J.J.; van Laarhoven, K.; de Geus-Oei, L.F.; Gotthardt, M.; Aarntzen, E. Optimal respiratory-gated [(18)F]FDG PET/CT significantly impacts the quantification of metabolic parameters and their correlation with overall survival in patients with pancreatic ductal adenocarcinoma. EJNMMI Res. 2019, 9, 24. [Google Scholar] [CrossRef]
- Chen, B.B.; Tien, Y.W.; Chang, M.C.; Cheng, M.F.; Chang, Y.T.; Yang, S.H.; Wu, C.H.; Kuo, T.C.; Shih, I.L.; Yen, R.F.; et al. Multiparametric PET/MRimaging biomarkers are associated with overall survival in patients with pancreatic cancer. Eur. J. Nucl. Med. Mol. Imaging 2018, 45, 1205–1217. [Google Scholar] [CrossRef]
- Jia, G.; Zhang, J.; Li, R.; Yan, J.; Zuo, C. The exploration of quantitative intra-tumoral metabolic heterogeneity in dual-time (18)F-FDG PET/CT of pancreatic cancer. Abdom. Radiol. 2021, 46, 4218–4225. [Google Scholar] [CrossRef]
- Yoo, S.H.; Kang, S.Y.; Cheon, G.J.; Oh, D.Y.; Bang, Y.J. Predictive Role of Temporal Changes in Intratumoral Metabolic Heterogeneity During Palliative Chemotherapy in Patients with Advanced Pancreatic Cancer: AProspective Cohort Study. J. Nucl. Med. 2020, 61, 33–39. [Google Scholar] [CrossRef]
- Yoo, J.; Lee, J.M.; Joo, I.; Lee, D.H.; Yoon, J.H.; Yu, M.H.; Jang, J.Y.; Lee, S.H. Post-neoadjuvant treatment pancreatic cancer resectability and outcome prediction using CT, (18)F-FDG PET/MRI and CA 19–9. Cancer Imaging 2023, 23, 49. [Google Scholar] [CrossRef]
- Christofk, H.R.; Vander Heiden, M.G.; Harris, M.H.; Ramanathan, A.; Gerszten, R.E.; Wei, R.; Fleming, M.D.; Schreiber, S.L.; Cantley, L.C. The M2 splice isoform of pyruvate kinase is important for cancer metabolism and tumour growth. Nature 2008, 452, 230–233. [Google Scholar] [CrossRef]
- Beinat, C.; Patel, C.B.; Haywood, T.; Murty, S.; Naya, L.; Castillo, J.B.; Reyes, S.T.; Phillips, M.; Buccino, P.; Shen, B.; et al. A Clinical PETImaging Tracer ([(18)F]DASA-23) to Monitor Pyruvate Kinase M2-Induced Glycolytic Reprogramming in Glioblastoma. Clin. Cancer Res. 2021, 27, 6467–6478. [Google Scholar] [CrossRef]
- Li, X.; Deng, S.; Liu, M.; Jin, Y.; Zhu, S.; Deng, S.; Chen, J.; He, C.; Qin, Q.; Wang, C.; et al. The responsively decreased PKM2 facilitates the survival of pancreatic cancer cells in hypoglucose. Cell Death Dis. 2018, 9, 133. [Google Scholar] [CrossRef]
- He, D.; Feng, H.; Sundberg, B.; Yang, J.; Powers, J.; Christian, A.H.; Wilkinson, J.E.; Monnin, C.; Avizonis, D.; Thomas, C.J.; et al. Methionine oxidation activates pyruvate kinase M2 to promote pancreatic cancer metastasis. Mol. Cell. 2022, 82, 3045–3060.e3011. [Google Scholar] [CrossRef] [PubMed]
- Otto, A.M. Metabolic Constants and Plasticity of Cancer Cells in a Limiting Glucose and Glutamine Microenvironment-A Pyruvate Perspective. Front. Oncol. 2020, 10, 596197. [Google Scholar] [CrossRef]
- Comandatore, A.; Franczak, M.; Smolenski, R.T.; Morelli, L.; Peters, G.J.; Giovannetti, E. Lactate Dehydrogenase and its clinical significance in pancreatic and thoracic cancers. Semin. Cancer Biol. 2022, 86, 93–100. [Google Scholar] [CrossRef] [PubMed]
- Biancur, D.E.; Kimmelman, A.C. The plasticity of pancreatic cancer metabolism in tumor progression and therapeutic resistance. Biochim. Biophys. Acta Rev. Cancer 2018, 1870, 67–75. [Google Scholar] [CrossRef] [PubMed]
- Gordon, J.W.; Chen, H.Y.; Nickles, T.; Lee, P.M.; Bok, R.; Ohliger, M.A.; Okamoto, K.; Ko, A.H.; Larson, P.E.Z.; Wang, Z.J. Hyperpolarized (13)CMetabolic MRIof Patients with Pancreatic Ductal Adenocarcinoma, J. Magn. Reson. Imaging 2024, 60, 741–749. [Google Scholar] [CrossRef]
- Heid, I.; Munch, C.; Karakaya, S.; Lueong, S.S.; Winkelkotte, A.M.; Liffers, S.T.; Godfrey, L.; Cheung, P.F.Y.; Savvatakis, K.; Topping, G.J.; et al. Functional noninvasive detection of glycolytic pancreatic ductal adenocarcinoma. Cancer Metab. 2022, 10, 24. [Google Scholar] [CrossRef]
- Kishimoto, S.; Brender, J.R.; Crooks, D.R.; Matsumoto, S.; Seki, T.; Oshima, N.; Merkle, H.; Lin, P.; Reed, G.; Chen, A.P.; et al. Imaging of glucose metabolism by 13C-MRI distinguishes pancreatic cancer subtypes in mice. eLife 2019, 8, e46312. [Google Scholar] [CrossRef]
- Dutta, P.; Perez, M.R.; Lee, J.; Kang, Y.; Pratt, M.; Salzillo, T.C.; Weygand, J.; Zacharias, N.M.; Gammon, S.T.; Koay, E.J.; et al. Combining Hyperpolarized Real-Time Metabolic Imaging NMR Spectroscopy To Identify Metabolic Biomarkers in Pancreatic Cancer. J. Proteome Res. 2019, 18, 2826–2834. [Google Scholar] [CrossRef]
- Montrazi, E.T.; Sasson, K.; Agemy, L.; Scherz, A.; Frydman, L. Molecular imaging of tumor metabolism: Insight from pyruvate- and glucose-based deuterium MRI studies. Sci. Adv. 2024, 10, eadm8600. [Google Scholar] [CrossRef]
- Shimoni-Sebag, A.; Abramovich, I.; Agranovich, B.; Massri, R.; Stossel, C.; Atias, D.; Raites-Gurevich, M.; Yizhak, K.; Golan, T.; Gottlieb, E.; et al. A metabolic switch to the pentose-phosphate pathway induces radiation resistance in pancreatic cancer. Radiother. Oncol. 2025, 202, 110606. [Google Scholar] [CrossRef] [PubMed]
- Viswanath, P.; Batsios, G.; Ayyappan, V.; Taglang, C.; Gillespie, A.M.; Larson, P.E.Z.; Luchman, H.A.; Costello, J.F.; Pieper, R.O.; Ronen, S.M. Metabolic imaging detects elevated glucose flux through the pentose phosphate pathway associated with TERT expression in low-grade gliomas. Neuro. Oncol. 2021, 23, 1509–1522. [Google Scholar] [CrossRef]
- Fu, S.; Xu, S.; Zhang, S. The role of amino acid metabolism alterations in pancreatic cancer: From mechanism to application. Biochim. Biophys. Acta Rev. Cancer 2023, 1878, 188893. [Google Scholar] [CrossRef]
- Dos Santos, K.; Bertho, G.; Baudin, M.; Giraud, N. Glutamine: A key player in human metabolism as revealed by hyperpolarized magnetic resonance. Prog. Nucl. Magn. Reson. Spectrosc. 2024, 144–145, 15–39. [Google Scholar] [CrossRef] [PubMed]
- Stumvoll, M.; Perriello, G.; Meyer, C.; Gerich, J. Role of glutamine in human carbohydrate metabolism in kidney and other tissues. Kidney Int. 1999, 55, 778–792. [Google Scholar] [CrossRef]
- Ren, L.L.; Mao, T.; Meng, P.; Zhang, L.; Wei, H.Y.; Tian, Z.B. Glutamine addiction therapeutic strategies in pancreatic cancer. World J. Gastrointest. Oncol. 2023, 15, 1852–1863. [Google Scholar] [CrossRef] [PubMed]
- Son, J.; Lyssiotis, C.A.; Ying, H.; Wang, X.; Hua, S.; Ligorio, M.; Perera, R.M.; Ferrone, C.R.; Mullarky, E.; Shyh-Chang, N.; et al. Glutamine supports pancreatic cancer growth through a KRAS-regulated metabolic pathway. Nature 2013, 496, 101–105. [Google Scholar] [CrossRef]
- Bott, A.J.; Shen, J.; Tonelli, C.; Zhan, L.; Sivaram, N.; Jiang, Y.P.; Yu, X.; Bhatt, V.; Chiles, E.; Zhong, H.; et al. Glutamine Anabolism Plays a Critical Role in Pancreatic Cancer by Coupling Carbon and Nitrogen Metabolism. Cell Rep. 2019, 29, 1287–1298.e6. [Google Scholar] [CrossRef]
- Chang, C.K.; Shih, T.T.; Tien, Y.W.; Chang, M.C.; Chang, Y.T.; Yang, S.H.; Cheng, M.F.; Chen, B.B. Metabolic Alterations in Pancreatic Cancer Detected by In Vivo (1)H-MR Spectroscopy: Correlation with Normal Pancreas, PET Metabolic Activity, Clinical Stages, and Survival Outcome. Diagnostics 2021, 11, 1541. [Google Scholar] [CrossRef]
- Cheng, M.F.; Huang, Y.Y.; Ho, B.Y.; Kuo, T.C.; Hsin, L.W.; Shiue, C.Y.; Kuo, H.C.; Jeng, Y.M.; Yen, R.F.; Tien, Y.W. Prospective comparison of (4S)-4-(3-(18)F-fluoropropyl)-L-glutamate versus (18)F-fluorodeoxyglucose PET/CTfor detecting metastases from pancreatic ductal adenocarcinoma: Aproof-of-concept study. Eur. J. Nucl. Med. Mol. Imaging 2019, 46, 810–820. [Google Scholar] [CrossRef] [PubMed]
- Yin, X.; Xu, R.; Song, J.; Ruze, R.; Chen, Y.; Wang, C.; Xu, Q. Lipid metabolism in pancreatic cancer: Emerging roles and potential targets. Cancer Commun. 2022, 42, 1234–1256. [Google Scholar] [CrossRef]
- Wu, H.; Fu, M.; Wu, M.; Cao, Z.; Zhang, Q.; Liu, Z. Emerging mechanisms and promising approaches in pancreatic cancer metabolism. Cell Death Dis. 2024, 15, 553. [Google Scholar] [CrossRef]
- Meng, X.; Sun, J.; Xu, F.; Liu, Z.; He, Y. Lipid metabolism marker CD36 is associated with (18)FDG-PET/CT false negative lymph nodes in head and neck squamous cell carcinoma. Front. Oncol. 2023, 13, 1156527. [Google Scholar] [CrossRef]
- Tao, T.; Li, G.; Zhou, K.; Pan, Q.; Wu, D.; Lai, L.; Gao, M.; Li, S.; Chen, L.; Han, R.P.S.; et al. Discovery of Fatty Acid Translocase CD36-Targeting Near-Infrared Fluorescent Probe Enables Visualization and Imaging-Guided Surgery for Glioma. Anal. Chem. 2025, 97, 3687–3695. [Google Scholar] [CrossRef]
- Brooks, A.F.; Winton, W.P.; Stauff, J.; Arteaga, J.; Henderson, B.; Niedbala, J.; Scott, P.J.H.; Viglianti, B.L. Development of Fluorinated NP-59: ARevival of Cholesterol Use Imaging with, PET. J. Nucl. Med. 2022, 63, 1949–1955. [Google Scholar] [CrossRef]
- Ahmed, H.; Wang, Y.; Griffiths, W.J.; Levey, A.I.; Pikuleva, I.; Liang, S.H.; Haider, A. Brain cholesterol and Alzheimer’s disease: Challenges and opportunities in probe and drug development. Brain 2024, 147, 1622–1635. [Google Scholar] [CrossRef] [PubMed]
- Cohen, A.S.; Li, J.; Hight, M.R.; McKinley, E.; Fu, A.; Payne, A.; Liu, Y.; Zhang, D.; Xie, Q.; Bai, M.; et al. TSPO-targeted PET and Optical Probes for the Detection Localization of Premalignant Malignant Pancreatic Lesions. Clin. Cancer Res. 2020, 26, 5914–5925. [Google Scholar] [CrossRef] [PubMed]
- Penet, M.F.; Shah, T.; Bharti, S.; Krishnamachary, B.; Artemov, D.; Mironchik, Y.; Wildes, F.; Maitra, A.; Bhujwalla, Z.M. Metabolic imaging of pancreatic ductal adenocarcinoma detects altered choline metabolism. Clin. Cancer Res. 2015, 21, 386–395. [Google Scholar] [CrossRef]
- Chen, B.B.; Tien, Y.W.; Chang, M.C.; Cheng, M.F.; Chang, Y.T.; Wu, C.H.; Chen, X.J.; Kuo, T.C.; Yang, S.H.; Shih, I.L.; et al. PET/MRIin pancreatic periampullary cancer: Correlating diffusion-weighted imaging MRspectroscopy glucose metabolic activity with clinical stage prognosis. Eur. J. Nucl. Med. Mol. Imaging 2016, 43, 1753–1764. [Google Scholar] [CrossRef]
- Veltien, A.; van Asten, J.; Ravichandran, N.; de Graaf, R.A.; De Feyter, H.M.; Oosterwijk, E.; Heerschap, A. Simultaneous Recording of the Uptake and Conversion of Glucose and Choline in Tumors by Deuterium Metabolic Imaging. Cancers 2021, 13, 4034. [Google Scholar] [CrossRef] [PubMed]
- Donadon, M.; Lopci, E.; Galvanin, J.; Giudici, S.; Del Fabbro, D.; Lanza, E.; Pedicini, V.; Chiti, A.; Torzilli, G. Prognostic Value of Metabolic Imaging Data of (11)C-choline PET/CT in Patients Undergoing Hepatectomy for Hepatocellular Carcinoma. Cancers 2021, 13, 472. [Google Scholar] [CrossRef]
- Caroli, P.; De Giorgi, U.; Scarpi, E.; Fantini, L.; Moretti, A.; Galassi, R.; Celli, M.; Conteduca, V.; Rossi, L.; Bianchi, E.; et al. Prognostic value of 18F-choline PET/CTmetabolic parameters in patients with metastatic castration-resistant prostate cancer treated with abiraterone or enzalutamide. Eur. J. Nucl. Med. Mol. Imaging 2018, 45, 348–354. [Google Scholar] [CrossRef]
- Treglia, G.; Rizzo, A.; Piccardo, A. Expanding the clinical indications of [(18)F]fluorocholine PET/CTin primary hyperparathyroidism: The evidence cannot be evaded. Eur. J. Nucl. Med. Mol. Imaging 2024, 51, 1345–1348. [Google Scholar] [CrossRef] [PubMed]
- Clauser, P.; Rasul, S.; Kapetas, P.; Fueger, B.J.; Milos, R.I.; Balber, T.; Berroterán-Infante, N.; Hacker, M.; Helbich, T.H.; Baltzer, P.A.T. Prospective validation of 18F-Fluoroethylcholine as a tracer in PET/MRI for the evaluation of breast lesions and prediction of lymph node status. Radiol. Med. 2023, 128, 689–698. [Google Scholar] [CrossRef] [PubMed]
- Evangelista, L.; De Pellegrin, A.; Girometti, R.; Cassarino, G.; Giacomuzzi, F.; Rensi, M. An Incidental Pancreatic Finding at 18F-Choline PET/CT: Chronic Mass-Forming Pancreatitis. Diagnostics 2021, 11, 1490. [Google Scholar] [CrossRef]
- Kitajima, K.; Fukushima, K.; Yamamoto, S.; Kato, T.; Odawara, S.; Takaki, H.; Kobayashi, K.; Yamano, T.; Yamakado, K.; Nakanishi, Y.; et al. (11)C-Choline positive but (18)F-FDGnegative pancreatic metastasis from renal cell carcinoma on, P.E.T. Nagoya J. Med. Sci. 2017, 79, 273–277. [Google Scholar]
- Shah, T.; Krishnamachary, B.; Wildes, F.; Wijnen, J.P.; Glunde, K.; Bhujwalla, Z.M. Molecular causes of elevated phosphoethanolamine in breast and pancreatic cancer cells. NMR Biomed. 2018, 31, e3936. [Google Scholar] [CrossRef]
- Buchthal, S.D.; Thoma, W.J.; Taylor, J.S.; Nelson, S.J.; Brown, T.R. In vivo T1 values of phosphorus metabolites in human liver and muscle determined at 1.5 T by chemical shift imaging. NMR Biomed. 1989, 2, 298–304. [Google Scholar] [CrossRef]
- Rivera, D. Emerging Role for 7T MRI and Metabolic Imaging for Pancreatic and Liver Cancer. Metabolites 2022, 12, 409. [Google Scholar] [CrossRef]
- Cheung, E.C.; Vousden, K.H. The role of ROS in tumour development and progression. Nat. Rev. Cancer 2022, 22, 280–297. [Google Scholar] [CrossRef] [PubMed]
- Purohit, V.; Simeone, D.M.; Lyssiotis, C.A. Metabolic Regulation of Redox Balance in Cancer. Cancers 2019, 11, 955. [Google Scholar] [CrossRef] [PubMed]
- Xing, F.; Hu, Q.; Qin, Y.; Xu, J.; Zhang, B.; Yu, X.; Wang, W. The Relationship of Redox with Hallmarks of Cancer: The Importance of Homeostasis and Context. Front. Oncol. 2022, 12, 862743. [Google Scholar] [CrossRef]
- Panday, A.; Sahoo, M.K.; Osorio, D.; Batra, S. NADPH oxidases: An overview from structure to innate immunity-associated pathologies. Cell Mol. Immunol. 2015, 12, 5–23. [Google Scholar] [CrossRef]
- Martínez-Reyes, I.; Chandel, N.S. Mitochondrial TCA cycle metabolites control physiology and disease. Nat. Commun. 2020, 11, 102. [Google Scholar] [CrossRef]
- Broekgaarden, M.; Bulin, A.L.; Frederick, J.; Mai, Z.; Hasan, T. Tracking, Photodynamic and Chemotherapy-Induced Redox-State Perturbations in 3DCulture Models of Pancreatic Cancer: A Tool for Identifying Therapy-Induced Metabolic Changes. J. Clin. Med. 2019, 8, 1399. [Google Scholar] [CrossRef] [PubMed]
- Walsh, A.J.; Castellanos, J.A.; Nagathihalli, N.S.; Merchant, N.B.; Skala, M.C. Optical Imaging of Drug-Induced Metabolism Changes in Murine and Human Pancreatic Cancer Organoids Reveals Heterogeneous Drug Response. Pancreas 2016, 45, 863–869. [Google Scholar] [CrossRef]
- Datta, R.; Sivanand, S.; Lau, A.N.; Florek, L.V.; Barbeau, A.M.; Wyckoff, J.; Skala, M.C.; Vander Heiden, M.G. Interactions with stromal cells promote a more oxidized cancer cell redox state in pancreatic tumors. Sci. Adv. 2022, 8, eabg6383. [Google Scholar] [CrossRef]
- Broekgaarden, M.; Anbil, S.; Bulin, A.L.; Obaid, G.; Mai, Z.; Baglo, Y.; Rizvi, I.; Hasan, T. Modulation of redox metabolism negates cancer-associated fibroblasts-induced treatment resistance in a heterotypic 3D culture platform of pancreatic cancer. Biomaterials 2019, 222, 119421. [Google Scholar] [CrossRef]
- Huang, P.; Chubb, S.; Hertel, L.W.; Grindey, G.B.; Plunkett, W. Action of 2′,2′-difluorodeoxycytidine on DNA synthesis. Cancer Res. 1991, 51, 6110–6117. [Google Scholar]
- Russell, J.; Grkovski, M.; O’Donoghue, I.J.; Kalidindi, T.M.; Pillarsetty, N.; Burnazi, E.M.; Kulick, A.; Bahr, A.; Chang, Q.; LeKaye, H.C.; et al. Predicting Gemcitabine Delivery by (18)F-FACPETin Murine Models of Pancreatic Cancer. J. Nucl. Med. 2021, 62, 195–200. [Google Scholar] [CrossRef] [PubMed]
- Strittmatter, N.; Richards, F.M.; Race, A.M.; Ling, S.; Sutton, D.; Nilsson, A.; Wallez, Y.; Barnes, J.; Maglennon, G.; Gopinathan, A.; et al. Method To Visualize the Intratumor Distribution and Impact of Gemcitabine in Pancreatic Ductal Adenocarcinoma by Multimodal Imaging. Anal. Chem. 2022, 94, 1795–1803. [Google Scholar] [CrossRef] [PubMed]
- Bjånes, T.K.; Jordheim, L.P.; Schjøtt, J.; Kamceva, T.; Cros-Perrial, E.; Langer, A.; Ruiz de Garibay, G.; Kotopoulis, S.; McCormack, E.; Riedel, B. Intracellular Cytidine Deaminase Regulates Gemcitabine Metabolism in Pancreatic Cancer Cell Lines. Drug Metab. Dispos. 2020, 48, 153–158. [Google Scholar] [CrossRef] [PubMed]
- Yamamoto, K.; Iwadate, D.; Kato, H.; Nakai, Y.; Tateishi, K.; Fujishiro, M. Targeting the Metabolic Rewiring in Pancreatic Cancer and Its Tumor Microenvironment. Cancers 2022, 14, 4351. [Google Scholar] [CrossRef]
- Li, Y.; Zhang, J.; Xu, J.; Liu, S. The Metabolism Symbiosis Between Pancreatic Cancer and Tumor Microenvironment. Front. Oncol. 2021, 11, 759376. [Google Scholar] [CrossRef]
- Yamane, T.; Aikawa, M.; Yasuda, M.; Fukushima, K.; Seto, A.; Okamoto, K.; Koyama, I.; Kuji, I. [(18)F]FMISO PET/CT as a preoperative prognostic factor in patients with pancreatic cancer. EJNMMI Res. 2019, 9, 39. [Google Scholar] [CrossRef]
- Metran-Nascente, C.; Yeung, I.; Vines, D.C.; Metser, U.; Dhani, N.C.; Green, D.; Milosevic, M.; Jaffray, D.; Hedley, D.W. Measurement of Tumor Hypoxia in Patients with Advanced Pancreatic Cancer Based on 18F-Fluoroazomyin Arabinoside Uptake. J. Nucl. Med. 2016, 57, 361–366. [Google Scholar] [CrossRef]
- Wang, Y.; Jhang, D.F.; Tsai, C.H.; Chiang, N.J.; Tsao, C.H.; Chuang, C.C.; Chen, L.T.; Chang, W.W.; Liao, L.D. In Vivo Assessment of Hypoxia Levels in Pancreatic Tumors Using a Dual-Modality Ultrasound/Photoacoustic Imaging System. Micromachines 2021, 12, 668. [Google Scholar] [CrossRef]
- Pereira, B.A.; Vennin, C.; Papanicolaou, M.; Chambers, C.R.; Herrmann, D.; Morton, J.P.; Cox, T.R.; Timpson, P. CAF Subpopulations: A New Reservoir of Stromal Targets in Pancreatic Cancer. Trends Cancer 2019, 5, 724–741. [Google Scholar] [CrossRef]
- Lavie, D.; Ben-Shmuel, A.; Erez, N.; Scherz-Shouval, R. Cancer-associated fibroblasts in the single-cell era. Nat. Cancer 2022, 3, 793–807. [Google Scholar] [CrossRef] [PubMed]
- Saúde-Conde, R.; Arçay Öztürk, A.; Stosic, K.; Azurmendi Senar, O.; Navez, J.; Bouchart, C.; Arsenijevic, T.; Flamen, P.; Van Laethem, J.L. Cancer-Associated Fibroblasts in Pancreatic Ductal Adenocarcinoma or a Metaphor for Heterogeneity: From Single-Cell Analysis to Whole-Body Imaging. Biomedicines 2024, 12, 591. [Google Scholar] [CrossRef] [PubMed]
- Liu, Q.; Shi, S.; Liu, S.; Xu, X.; Hu, S.; Zhang, J.; Wang, C.; Yu, X.; Song, S. The added value of [(68)Ga]Ga-DOTA-FAPI-04 PET/CTin pancreatic cancer: Acomparison to, [.(.1.8.).F.].F.-F.D.G. Eur. Radiol. 2023, 33, 5007–5016. [Google Scholar] [CrossRef]
- Kaghazchi, F.; Divband, G.; Amini, H.; Adinehpour, Z.; Akbarian Aghdam, R. 68 Ga-FAPI-46 and 18 F-FDG in Advanced Metastatic Pancreatic Cancer. Clin. Nucl. Med. 2022, 47, e666–e669. [Google Scholar] [CrossRef]
- Kessler, L.; Hirmas, N.; Pabst, K.M.; Hamacher, R.; Ferdinandus, J.; Schaarschmidt, B.M.; Milosevic, A.; Nader, M.; Umutlu, L.; Uhl, W.; et al. (68)Ga-Labeled Fibroblast Activation Protein Inhibitor ((68)Ga-FAPI) PET for Pancreatic Adenocarcinoma: Data from the (68)Ga-FAPI PET Observational Trial. J. Nucl. Med. 2023, 64, 1910–1917. [Google Scholar] [CrossRef]
- Spektor, A.M.; Gutjahr, E.; Lang, M.; Glatting, F.M.; Hackert, T.; Pausch, T.; Tjaden, C.; Schreckenberger, M.; Haberkorn, U.; Röhrich, M. Immunohistochemical FAP Expression Reflects (68)Ga-FAPI PET Imaging Properties of Low- and High-Grade Intraductal Papillary Mucinous Neoplasms and Pancreatic Ductal Adenocarcinoma. J. Nucl. Med. 2024, 65, 52–58. [Google Scholar] [CrossRef] [PubMed]
- Rasinski, P.; Af Burén, S.; Holstensson, M.; Nilsson, T.; Loizou, L.; Tran, T.A.; Sparrelid, E.; Löhr, J.M.; Axelsson, R. Tumor Characterization by [(68)Ga]FAPI-46 PET/CT Can Improve Treatment Selection for Pancreatic Cancer Patients: An Interim Analysis of a Prospective Clinical Trial. J. Nucl. Med. 2023, 64, 1232–1237. [Google Scholar] [CrossRef] [PubMed]
- Ouyang, J.; Ding, P.; Zhang, R.; Lu, Y. Head-to-head comparison of (68)Ga-FAPI-04 PET/CT and (18)F-FDG PET/CT in the evaluation of primary digestive system cancer: A systematic review and meta-analysis. Front. Oncol. 2023, 13, 1202505. [Google Scholar] [CrossRef]
- Ding, J.; Qiu, J.; Hao, Z.; Huang, H.; Liu, Q.; Liu, W.; Ren, C.; Hacker, M.; Zhang, T.; Wu, W.; et al. Comparing the clinical value of baseline [(68) Ga]Ga-FAPI-04 PET/CT and [(18)F]F-FDG PET/CT in pancreatic ductal adenocarcinoma: Additional prognostic value of the distal pancreatitis. Eur. J. Nucl. Med. Mol. Imaging 2023, 50, 4036–4050. [Google Scholar] [CrossRef]
- Ding, J.; Qiu, J.; Hao, Z.; Huang, H.; Liu, Q.; Liu, W.; Ren, C.; Hacker, M.; Zhang, T.; Wu, W.; et al. Prognostic value of preoperative [(68) Ga]Ga-FAPI-04 PET/CT in patients with resectable pancreatic ductal adenocarcinoma in correlation with immunohistological characteristics. Eur. J. Nucl. Med. Mol. Imaging 2023, 50, 1780–1791. [Google Scholar] [CrossRef]
- Zhang, Z.; Jia, G.; Pan, G.; Cao, K.; Yang, Q.; Meng, H.; Yang, J.; Zhang, L.; Wang, T.; Cheng, C.; et al. Comparison of the diagnostic efficacy of (68) Ga-FAPI-04 PET/MR and (18)F-FDG PET/CT in patients with pancreatic cancer. Eur. J. Nucl. Med. Mol. Imaging 2022, 49, 2877–2888. [Google Scholar] [CrossRef]
- Röhrich, M.; Naumann, P.; Giesel, F.L.; Choyke, P.L.; Staudinger, F.; Wefers, A.; Liew, D.P.; Kratochwil, C.; Rathke, H.; Liermann, J.; et al. Impact of (68)Ga-FAPI PET/CT Imaging on the Therapeutic Management of Primary and Recurrent Pancreatic Ductal Adenocarcinomas. J. Nucl. Med. 2021, 62, 779–786. [Google Scholar] [CrossRef] [PubMed]
- Metzger, G.; Bayerl, C.; Rogasch, J.M.; Furth, C.; Wetz, C.; Beck, M.; Mehrhof, F.; Amthauer, H.; Ghadjar, P.; Neumann, C.; et al. (68)Ga-labeled fibroblast activation protein inhibitor (FAPI) PET/CT for locally advanced or recurrent pancreatic cancer staging and restaging after chemoradiotherapy. Theranostics 2024, 14, 4184–4197. [Google Scholar] [CrossRef] [PubMed]
- Jia, R.; Hao, X.-Z.; Si, H.-Y.; Zhu, W.-J.; Wang, Z.-K.; Huo, L.; Dai, G.-H. Predictive value of baseline68Ga-FAPI PET/CT in the first-line therapy of pancreatic ductal adenocarcinoma (PDAC). J. Clin. Oncol. 2024, 42, e16300. [Google Scholar] [CrossRef]
- Li, Z.; Geng, R.; Zhan, Y.; Liu, R.; Li, M.; Ke, N.; Yang, H.; Lu, X.; Li, L.; Li, S.; et al. (64)Cu Radiolabeled PDGFRβ-Targeting Affibody for PET Imaging in Pancreatic Cancer. Mol. Pharm. 2025, 22, 1633–1640. [Google Scholar] [CrossRef]
- Pysz, M.A.; Machtaler, S.B.; Seeley, E.S.; Lee, J.J.; Brentnall, T.A.; Rosenberg, J.; Tranquart, F.; Willmann, J.K. Vascular Endothelial Growth Factor Receptor Type 2–targeted Contrast-enhanced US of Pancreatic Cancer Neovasculature in a Genetically Engineered Mouse Model: Potential for Earlier Detection. Radiology 2015, 274, 790–799. [Google Scholar] [CrossRef]
- Willmann, J.K.; Bonomo, L.; Testa, A.C.; Rinaldi, P.; Rindi, G.; Valluru, K.S.; Petrone, G.; Martini, M.; Lutz, A.M.; Gambhir, S.S. Ultrasound Molecular Imaging with BR55 in Patients with Breast Ovarian Lesions: First-in-Human Results. J. Clin. Oncol. 2017, 35, 2133–2140. [Google Scholar] [CrossRef]
- Mulder, B.G.S.; Koller, M.; Duiker, E.W.; Sarasqueta, A.F.; Burggraaf, J.; Meijer, V.E.; Vahrmeijer, A.L.; Hoogwater, F.J.H.; Bonsing, B.A.; van Dam, G.M.; et al. Intraoperative Molecular Fluorescence Imaging of Pancreatic Cancer by Targeting Vascular Endothelial Growth Factor: A Multicenter Feasibility Dose-Escalation Study. J. Nucl. Med. 2023, 64, 82–89. [Google Scholar] [CrossRef]
- Tripathi, S.; Tabari, A.; Mansur, A.; Dabbara, H.; Bridge, C.P.; Daye, D. From Machine Learning to Patient Outcomes: A Comprehensive Review of AI in Pancreatic Cancer. Diagnostics 2024, 14, 174. [Google Scholar] [CrossRef]
- Liu, W.; Zhang, B.; Liu, T.; Jiang, J.; Liu, Y. Artificial Intelligence in Pancreatic Image Analysis: A Review. Sensors 2024, 24, 4749. [Google Scholar] [CrossRef]
- Enriquez, J.S.; Chu, Y.; Pudakalakatti, S.; Hsieh, K.L.; Salmon, D.; Dutta, P.; Millward, N.Z.; Lurie, E.; Millward, S.; McAllister, F.; et al. Hyperpolarized Magnetic Resonance and Artificial Intelligence: Frontiers of Imaging in Pancreatic Cancer. JMIR Med. Inform. 2021, 9, e26601. [Google Scholar] [CrossRef]
- Cao, K.; Xia, Y.; Yao, J.; Han, X.; Lambert, L.; Zhang, T.; Tang, W.; Jin, G.; Jiang, H.; Fang, X.; et al. Large-scale pancreatic cancer detection via non-contrast CT and deep learning. Nat. Med. 2023, 29, 3033–3043. [Google Scholar] [CrossRef] [PubMed]
- Placido, D.; Yuan, B.; Hjaltelin, J.X.; Zheng, C.; Haue, A.D.; Chmura, P.J.; Yuan, C.; Kim, J.; Umeton, R.; Antell, G.; et al. A deep learning algorithm to predict risk of pancreatic cancer from disease trajectories. Nat. Med. 2023, 29, 1113–1122. [Google Scholar] [CrossRef] [PubMed]
- Yao, J.; Shi, Y.; Cao, K.; Lu, L.; Lu, J.; Song, Q.; Jin, G.; Xiao, J.; Hou, Y.; Zhang, L. DeepPrognosis: Preoperative prediction of pancreatic cancer survival and surgical margin via comprehensive understanding of dynamic contrast-enhanced CT imaging and tumor-vascular contact parsing. Med. Image Anal. 2021, 73, 102150. [Google Scholar] [CrossRef] [PubMed]
- Park, Y.J.; Park, Y.S.; Kim, S.T.; Hyun, S.H. A Machine Learning Approach Using [(18)F]FDG PET-Based Radiomics for Prediction of Tumor Grade and Prognosis in Pancreatic Neuroendocrine Tumor. Mol. Imaging Biol. 2023, 25, 897–910. [Google Scholar] [CrossRef]
- Wei, W.; Jia, G.; Wu, Z.; Wang, T.; Wang, H.; Wei, K.; Cheng, C.; Liu, Z.; Zuo, C. A multidomain fusion model of radiomics and deep learning to discriminate between PDAC and AIP based on 18F-FDG PET/CT images. Jpn. J. Radiol. 2023, 41, 417–427. [Google Scholar] [CrossRef]
- Zhang, G.; Bao, C.; Liu, Y.; Wang, Z.; Du, L.; Zhang, Y.; Wang, F.; Xu, B.; Zhou, S.K.; Liu, R. (18)F-FDG-PET/CT-based deep learning model for fully automated prediction of pathological grading for pancreatic ductal adenocarcinoma before surgery. EJNMMI Res. 2023, 13, 49. [Google Scholar] [CrossRef]
- Zhao, G.; Chen, X.; Zhu, M.; Liu, Y.; Wang, Y. Exploring the application and future outlook of Artificial intelligence in pancreatic cancer. Front. Oncol. 2024, 14, 1345810. [Google Scholar] [CrossRef]
- Ai, C.; Sun, X.; Xiao, S.; Guo, L.; Shang, M.; Shi, D.; Meng, D.; Zhao, Y.; Wang, X.; Li, J. CAFs targeted ultrasound-responsive nanodroplets loaded V9302 and GLULsiRNA to inhibit melanoma growth via glutamine metabolic reprogramming and tumor microenvironment remodeling. J. Nanobiotechnology 2023, 21, 214. [Google Scholar] [CrossRef] [PubMed]
- Kobayashi, K.; Einama, T.; Tsunenari, T.; Yonamine, N.; Takao, M.; Takihata, Y.; Tsujimoto, H.; Ueno, H.; Tamura, K.; Ishida, J.; et al. Preoperative CA19-9 level and dual time point FDG-PET/CT as strong biological indicators of borderline resectability in pancreatic cancer: A retrospective study. Oncol. Lett. 2024, 27, 279. [Google Scholar] [CrossRef]
- Kanda, T.; Wakiya, T.; Ishido, K.; Kimura, N.; Fujita, H.; Yoshizawa, T.; Goto, S.; Tatara, Y.; Kijima, H.; Hakamada, K. Heterogeneity of metabolic adaptive capacity affects the prognosis among pancreatic ductal adenocarcinomas. J. Gastroenterol. 2022, 57, 798–811. [Google Scholar] [CrossRef]
- Mukhopadhyay, S.; Vander Heiden, M.G.; McCormick, F. The Metabolic Landscape of RAS-Driven Cancers from biology to therapy. Nat. Cancer 2021, 2, 271–283. [Google Scholar] [CrossRef] [PubMed]
- De Jesus, V.H.F.; Mathias-Machado, M.C.; de Farias, J.P.F.; Aruquipa, M.P.S.; Jácome, A.A.; Peixoto, R.D. Targeting KRAS in Pancreatic Ductal Adenocarcinoma: The Long Road to Cure. Cancers 2023, 15, 5015. [Google Scholar] [CrossRef] [PubMed]
- Koch, P.D.; Quintana, J.; Ahmed, M.; Kohler, R.H.; Weissleder, R. Small Molecule Imaging Agent for Mutant KRAS G12C. Adv. Ther. 2021, 4, 2000290. [Google Scholar] [CrossRef]
- Karageorgou, M.-A.; Bouziotis, P.; Stiliaris, E.; Stamopoulos, D. Radiolabeled Iron Oxide Nanoparticles as Dual Modality Contrast Agents in SPECT/MRI and PET/MRI. Nanomaterials 2023, 13, 503. [Google Scholar] [CrossRef] [PubMed]

| Imaging Technique | Tracers | Targeted Molecules or Processes | Applications | Stage 1 |
|---|---|---|---|---|
| PET | 18F-FDG | Glucose uptake | Diagnosis, staging, recurrence detection, resectability prediction, prognosis | Licensed tracers used in the clinic |
| 18F-FSPG | Cystine/glutamate transporter | Detection of metastasis | Clinical evaluation | |
| 18F-FAC | dCK activity | Gemcitabine metabolism | Experimental modalities tested in animals | |
| 68Ga-FAPI | FAP | Stromal mapping, metastasis detection, therapy response | Clinical evaluation | |
| 64Cu- ZPDGFRβ | PDGFRβ | NA | Experimental modalities tested in animals | |
| 18F-V-1008 | TSPO | Distinguish early disease | Experimental modalities tested in animals | |
| 18F-FMISO and 18F-FAZA | Hypoxia | Prognosis | Clinical evaluation | |
| MRI/MRS | NA | Glx, NAA, choline | Diagnosis | Clinical evaluation |
| 13C-glucose | Glucose metabolism | Metabolic flux analysis, therapy response | Clinical evaluation | |
| 13C-pyruvate | ||||
| 2H-labeled glucose/choline | Glucose/choline | Multi-metabolite mapping | Experimental modalities tested in animals | |
| MSI | NA | Gemcitabine and its metabolites | Gemcitabine metabolism | Experimental modalities tested in animals |
| NIR imaging | V-1520 | TSPO | Image-guided surgery | Experimental modalities tested in animals |
| IRDye800CW | VEGFR2 | Image-guided surgery | Clinical evaluation | |
| Optical metabolic imaging | NA | NADPH and FAD | Therapy response | Experimental modalities tested in animals |
| US/PA/CEUS | NA | Oxygenation | Therapy response | Experimental modalities tested in animals |
| VEGFR2-targeted microbubbles | VEGFR2 | Diagnosis | Clinical evaluation |
Disclaimer/Publisher’s Note: The statements, opinions and data contained in all publications are solely those of the individual author(s) and contributor(s) and not of MDPI and/or the editor(s). MDPI and/or the editor(s) disclaim responsibility for any injury to people or property resulting from any ideas, methods, instructions or products referred to in the content. |
© 2025 by the authors. Licensee MDPI, Basel, Switzerland. This article is an open access article distributed under the terms and conditions of the Creative Commons Attribution (CC BY) license (https://creativecommons.org/licenses/by/4.0/).
Share and Cite
Wang, H.; Gui, Y.; Lv, K. Molecular Imaging: Unveiling Metabolic Abnormalities in Pancreatic Cancer. Int. J. Mol. Sci. 2025, 26, 5242. https://doi.org/10.3390/ijms26115242
Wang H, Gui Y, Lv K. Molecular Imaging: Unveiling Metabolic Abnormalities in Pancreatic Cancer. International Journal of Molecular Sciences. 2025; 26(11):5242. https://doi.org/10.3390/ijms26115242
Chicago/Turabian StyleWang, Huanyu, Yang Gui, and Ke Lv. 2025. "Molecular Imaging: Unveiling Metabolic Abnormalities in Pancreatic Cancer" International Journal of Molecular Sciences 26, no. 11: 5242. https://doi.org/10.3390/ijms26115242
APA StyleWang, H., Gui, Y., & Lv, K. (2025). Molecular Imaging: Unveiling Metabolic Abnormalities in Pancreatic Cancer. International Journal of Molecular Sciences, 26(11), 5242. https://doi.org/10.3390/ijms26115242