
Green Chemistry Meets Olive Mill Wastewater: Bioinspired Oxidation of Phenols and Polyphenols Using Selenium Catalysts

 , ,
, ,  ,
, 
Abstract
1. Introduction
2. Results and Discussion
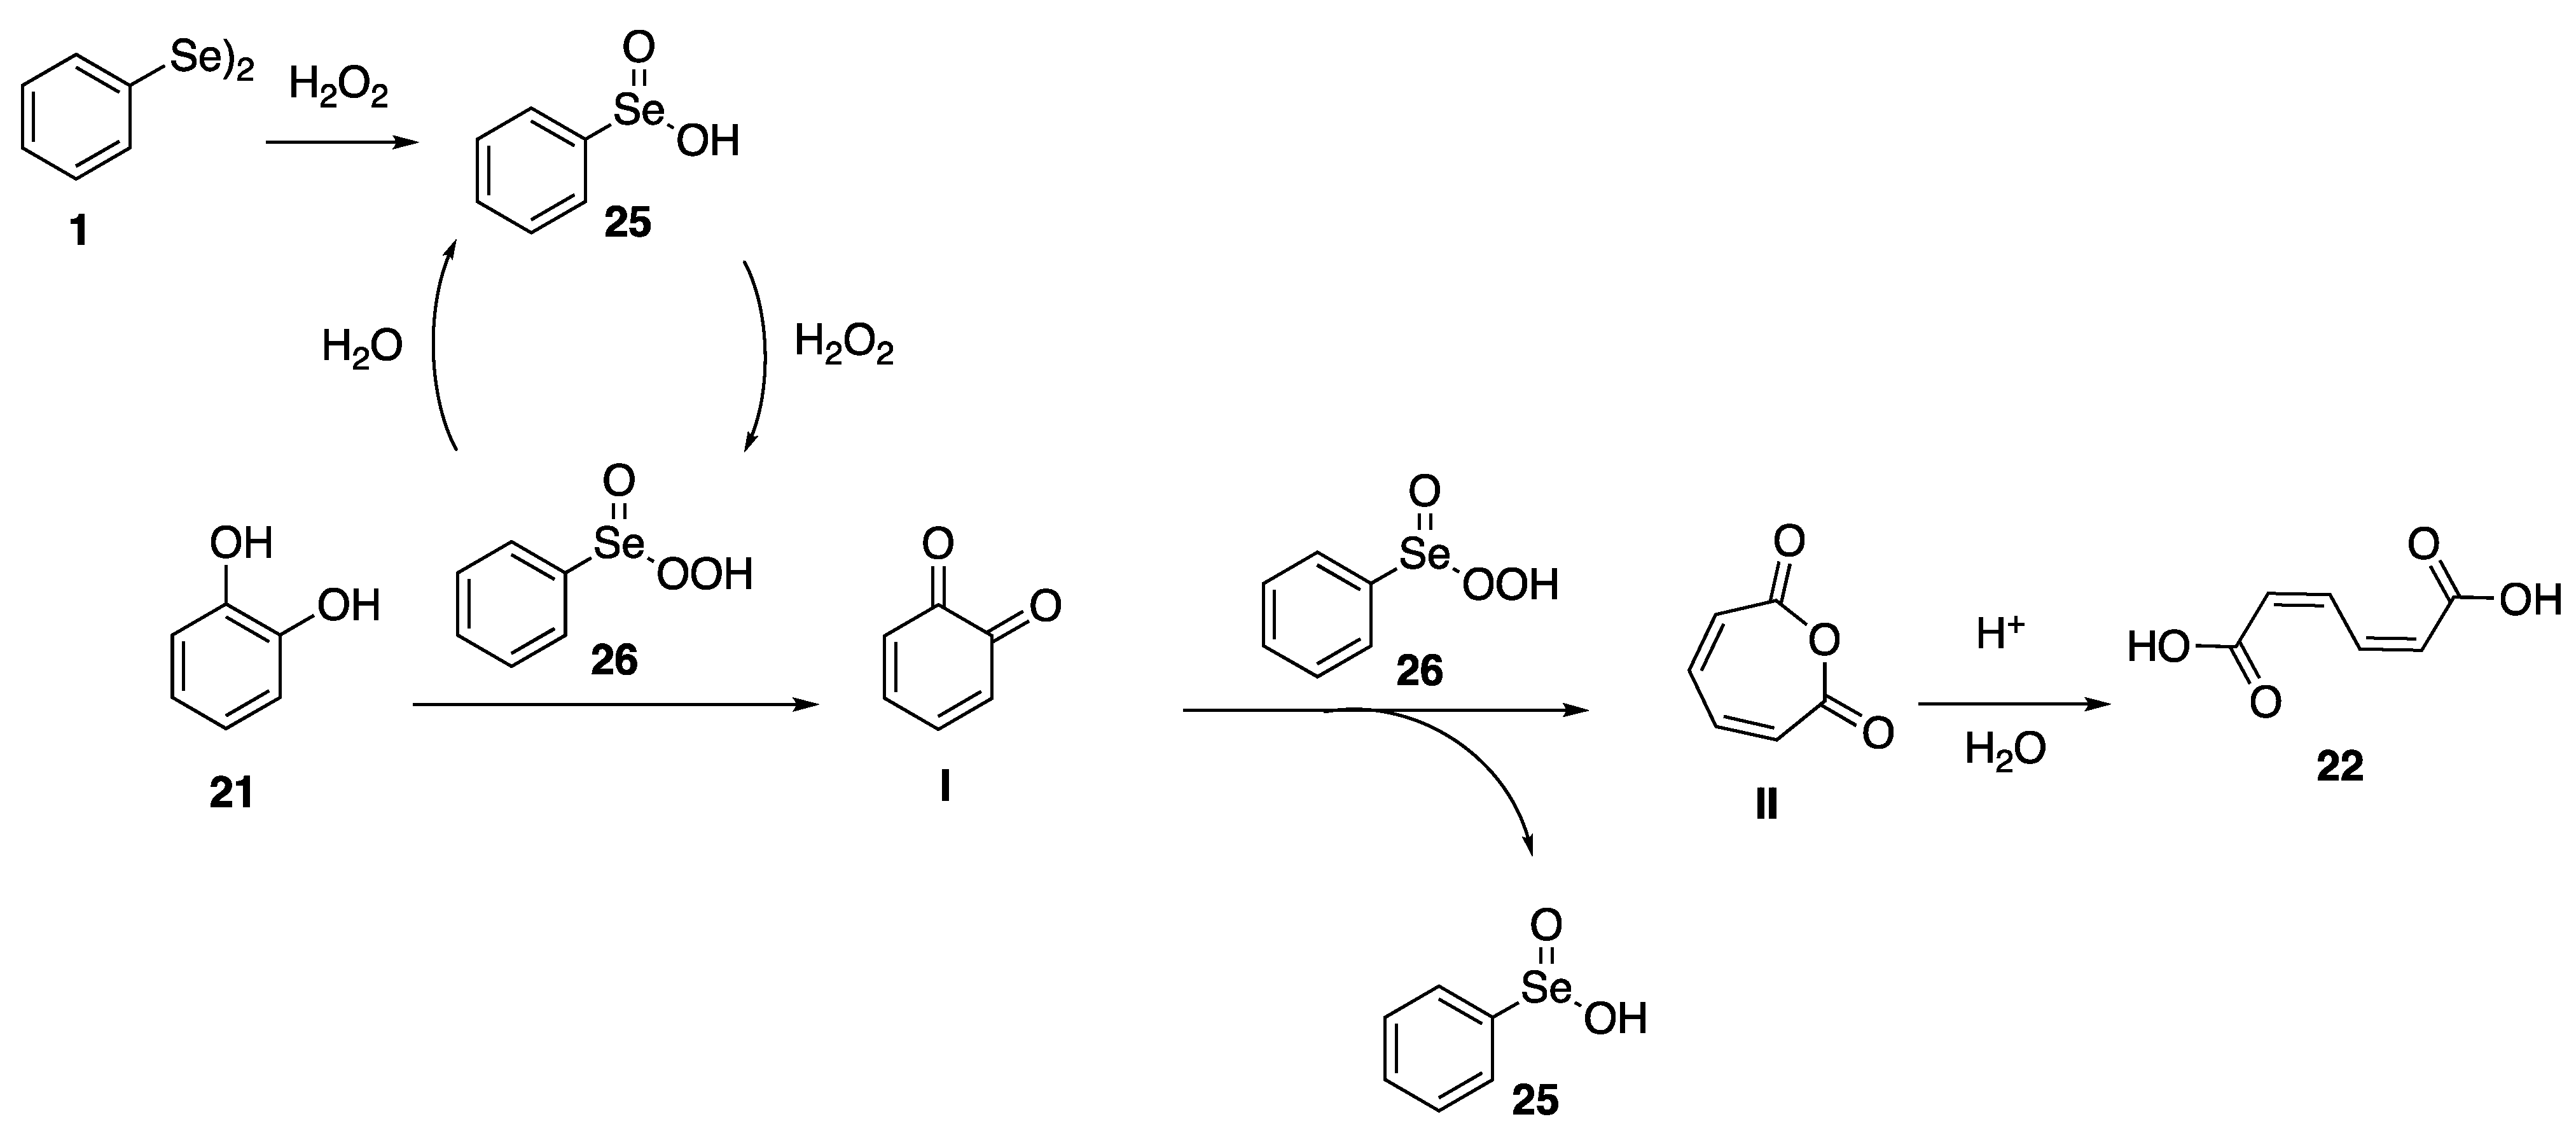
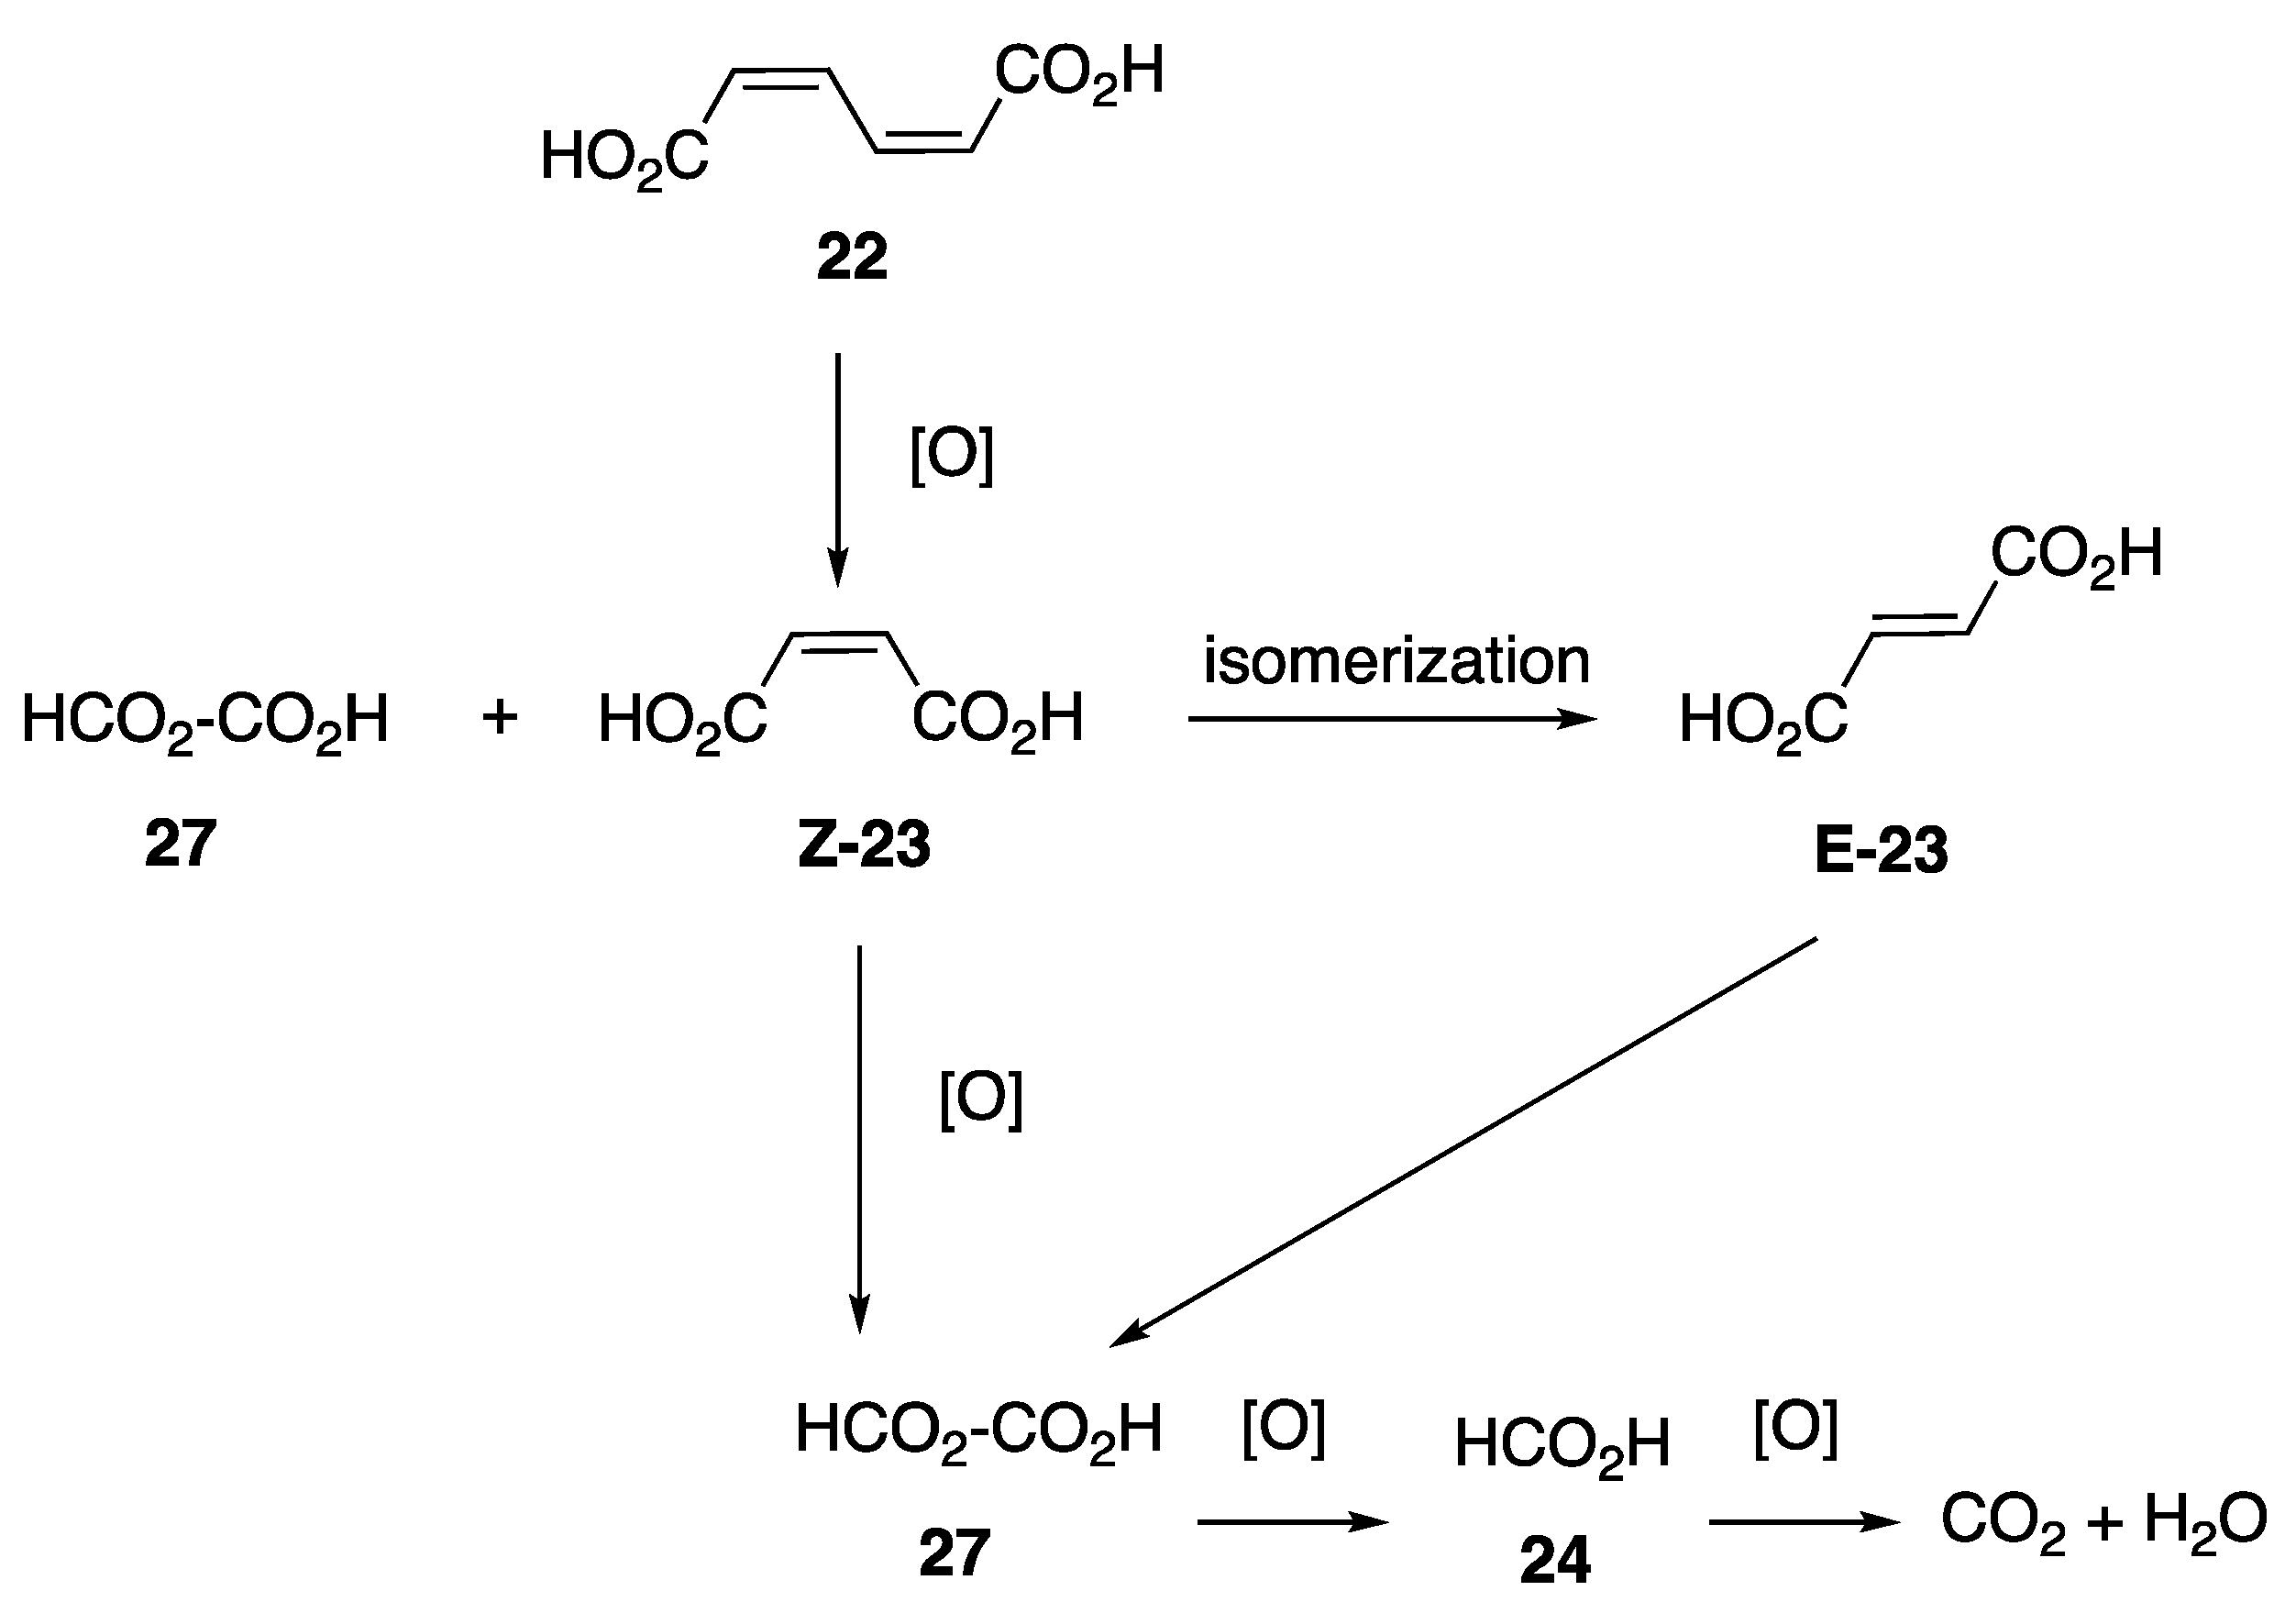
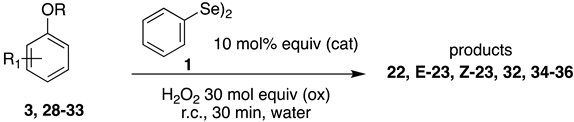
2.1. Oxidation of Model Compounds
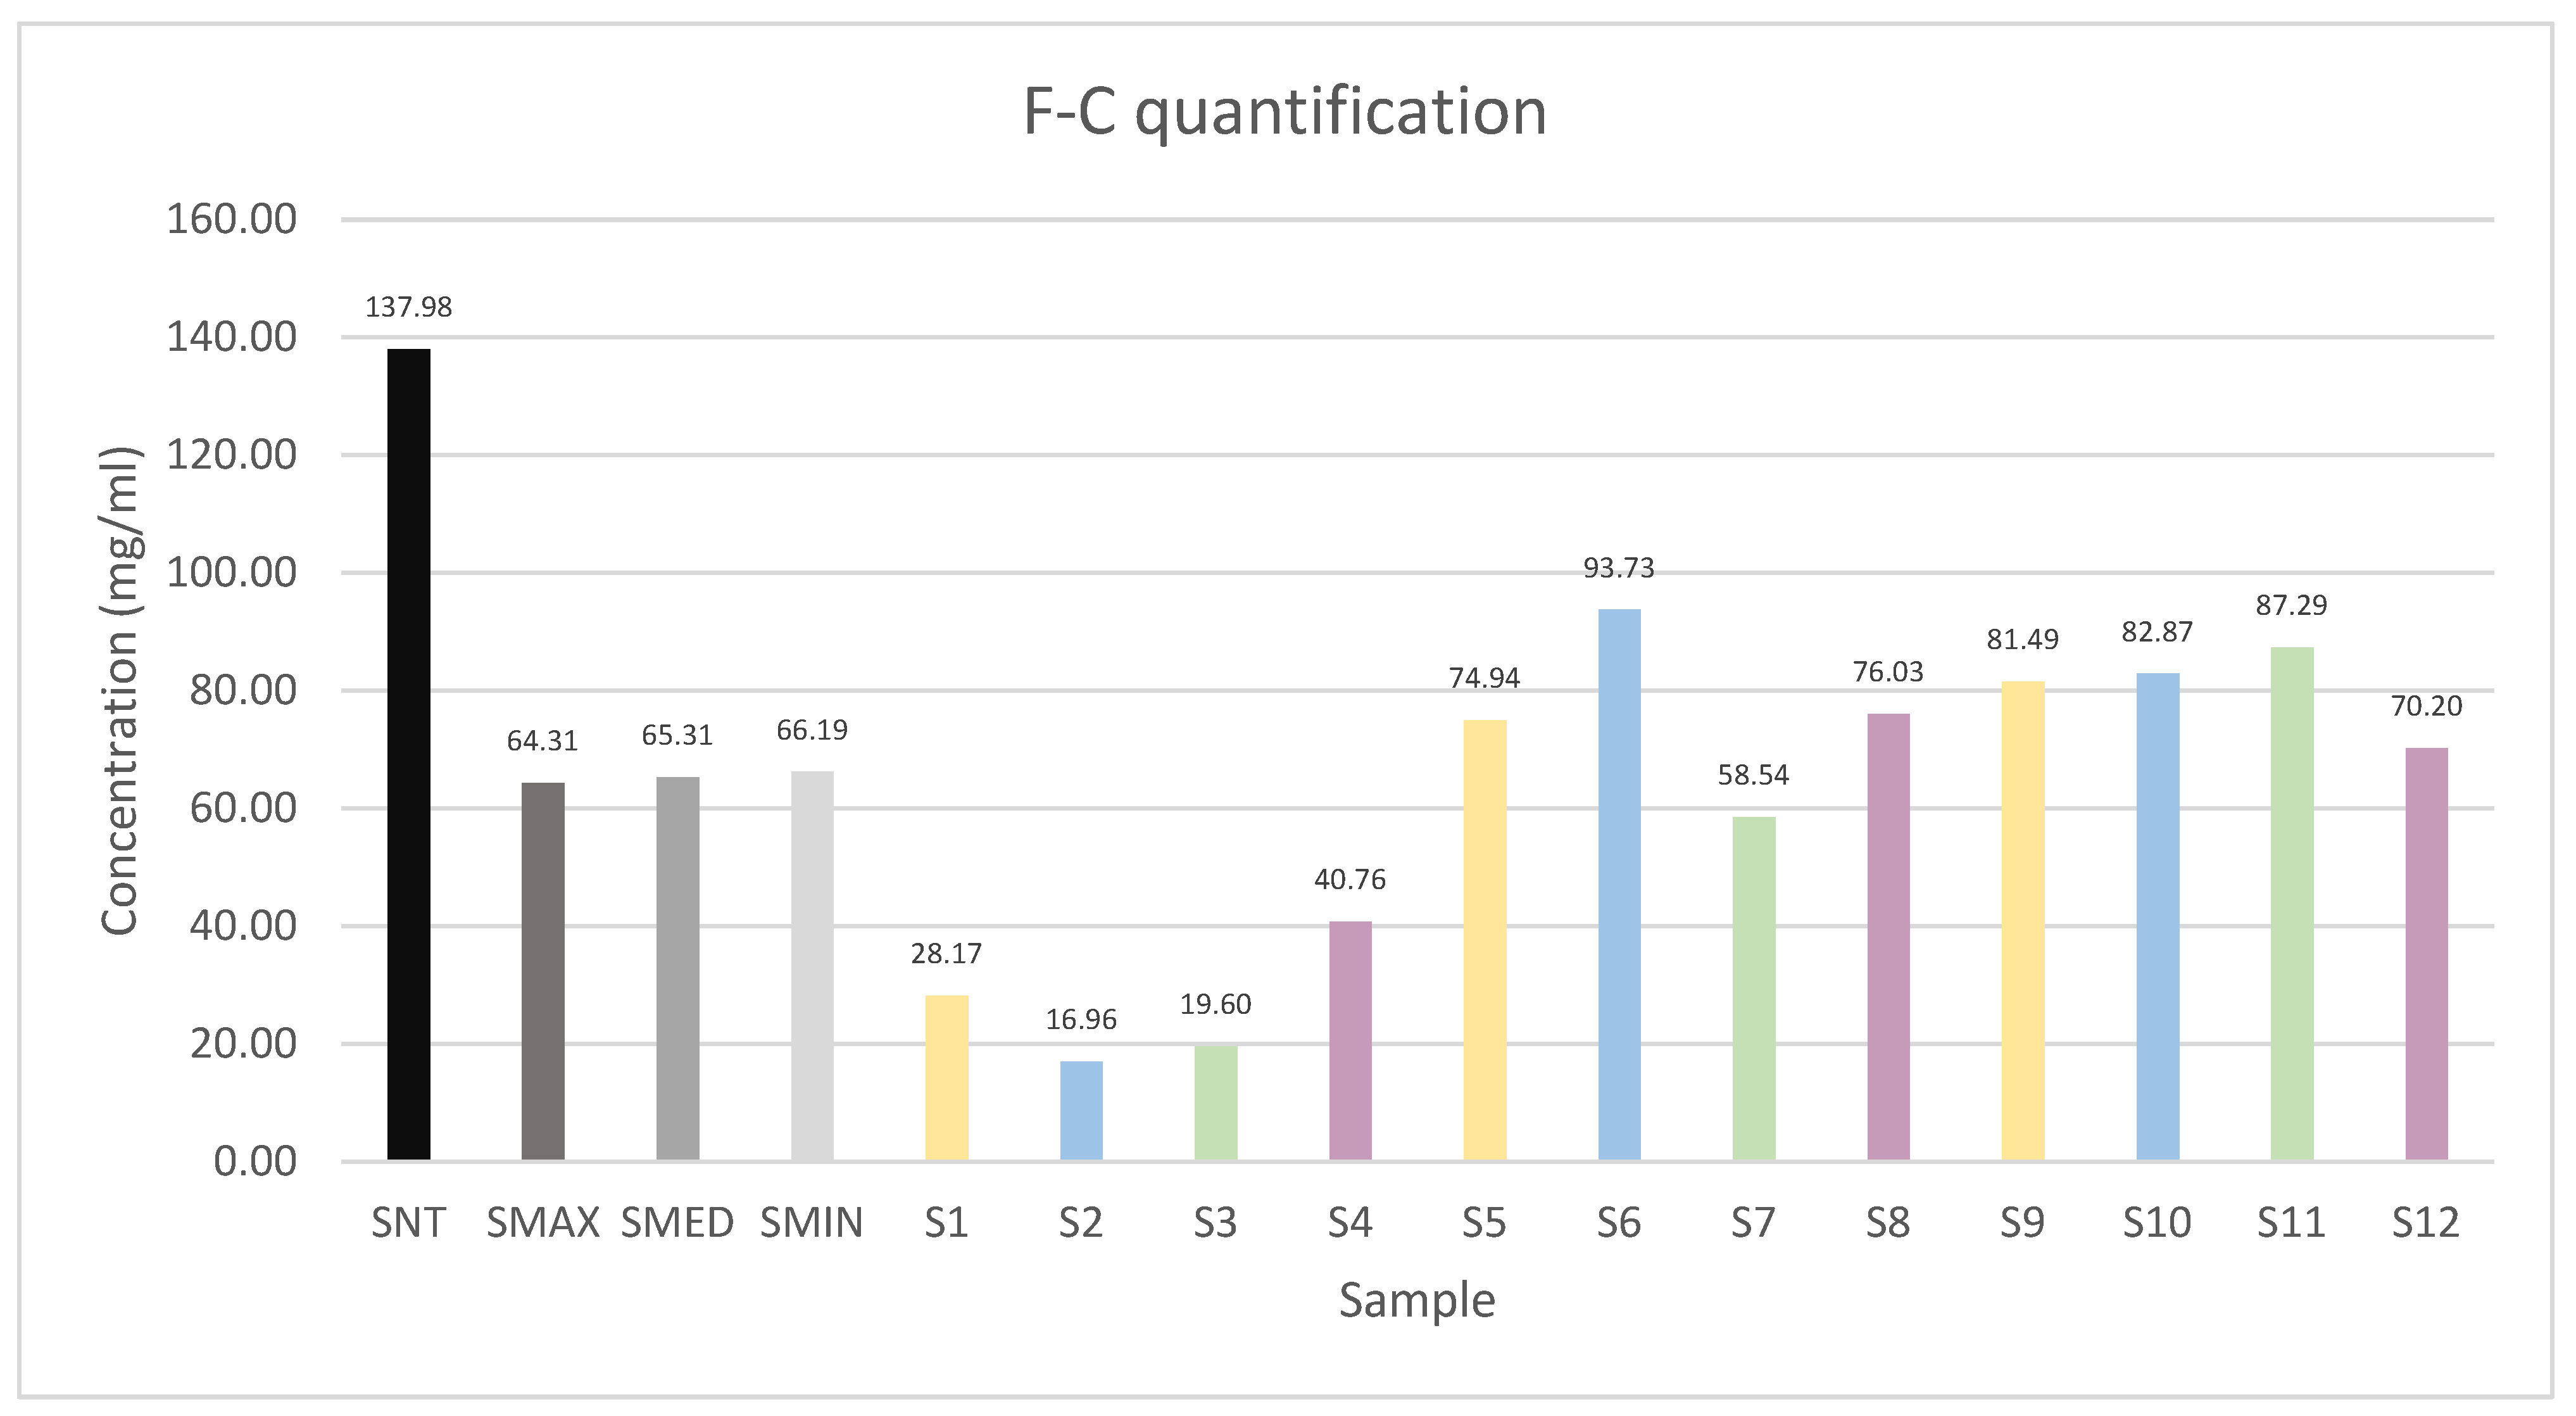
2.2. Measurement of Polyphenol Amount by F-C Method
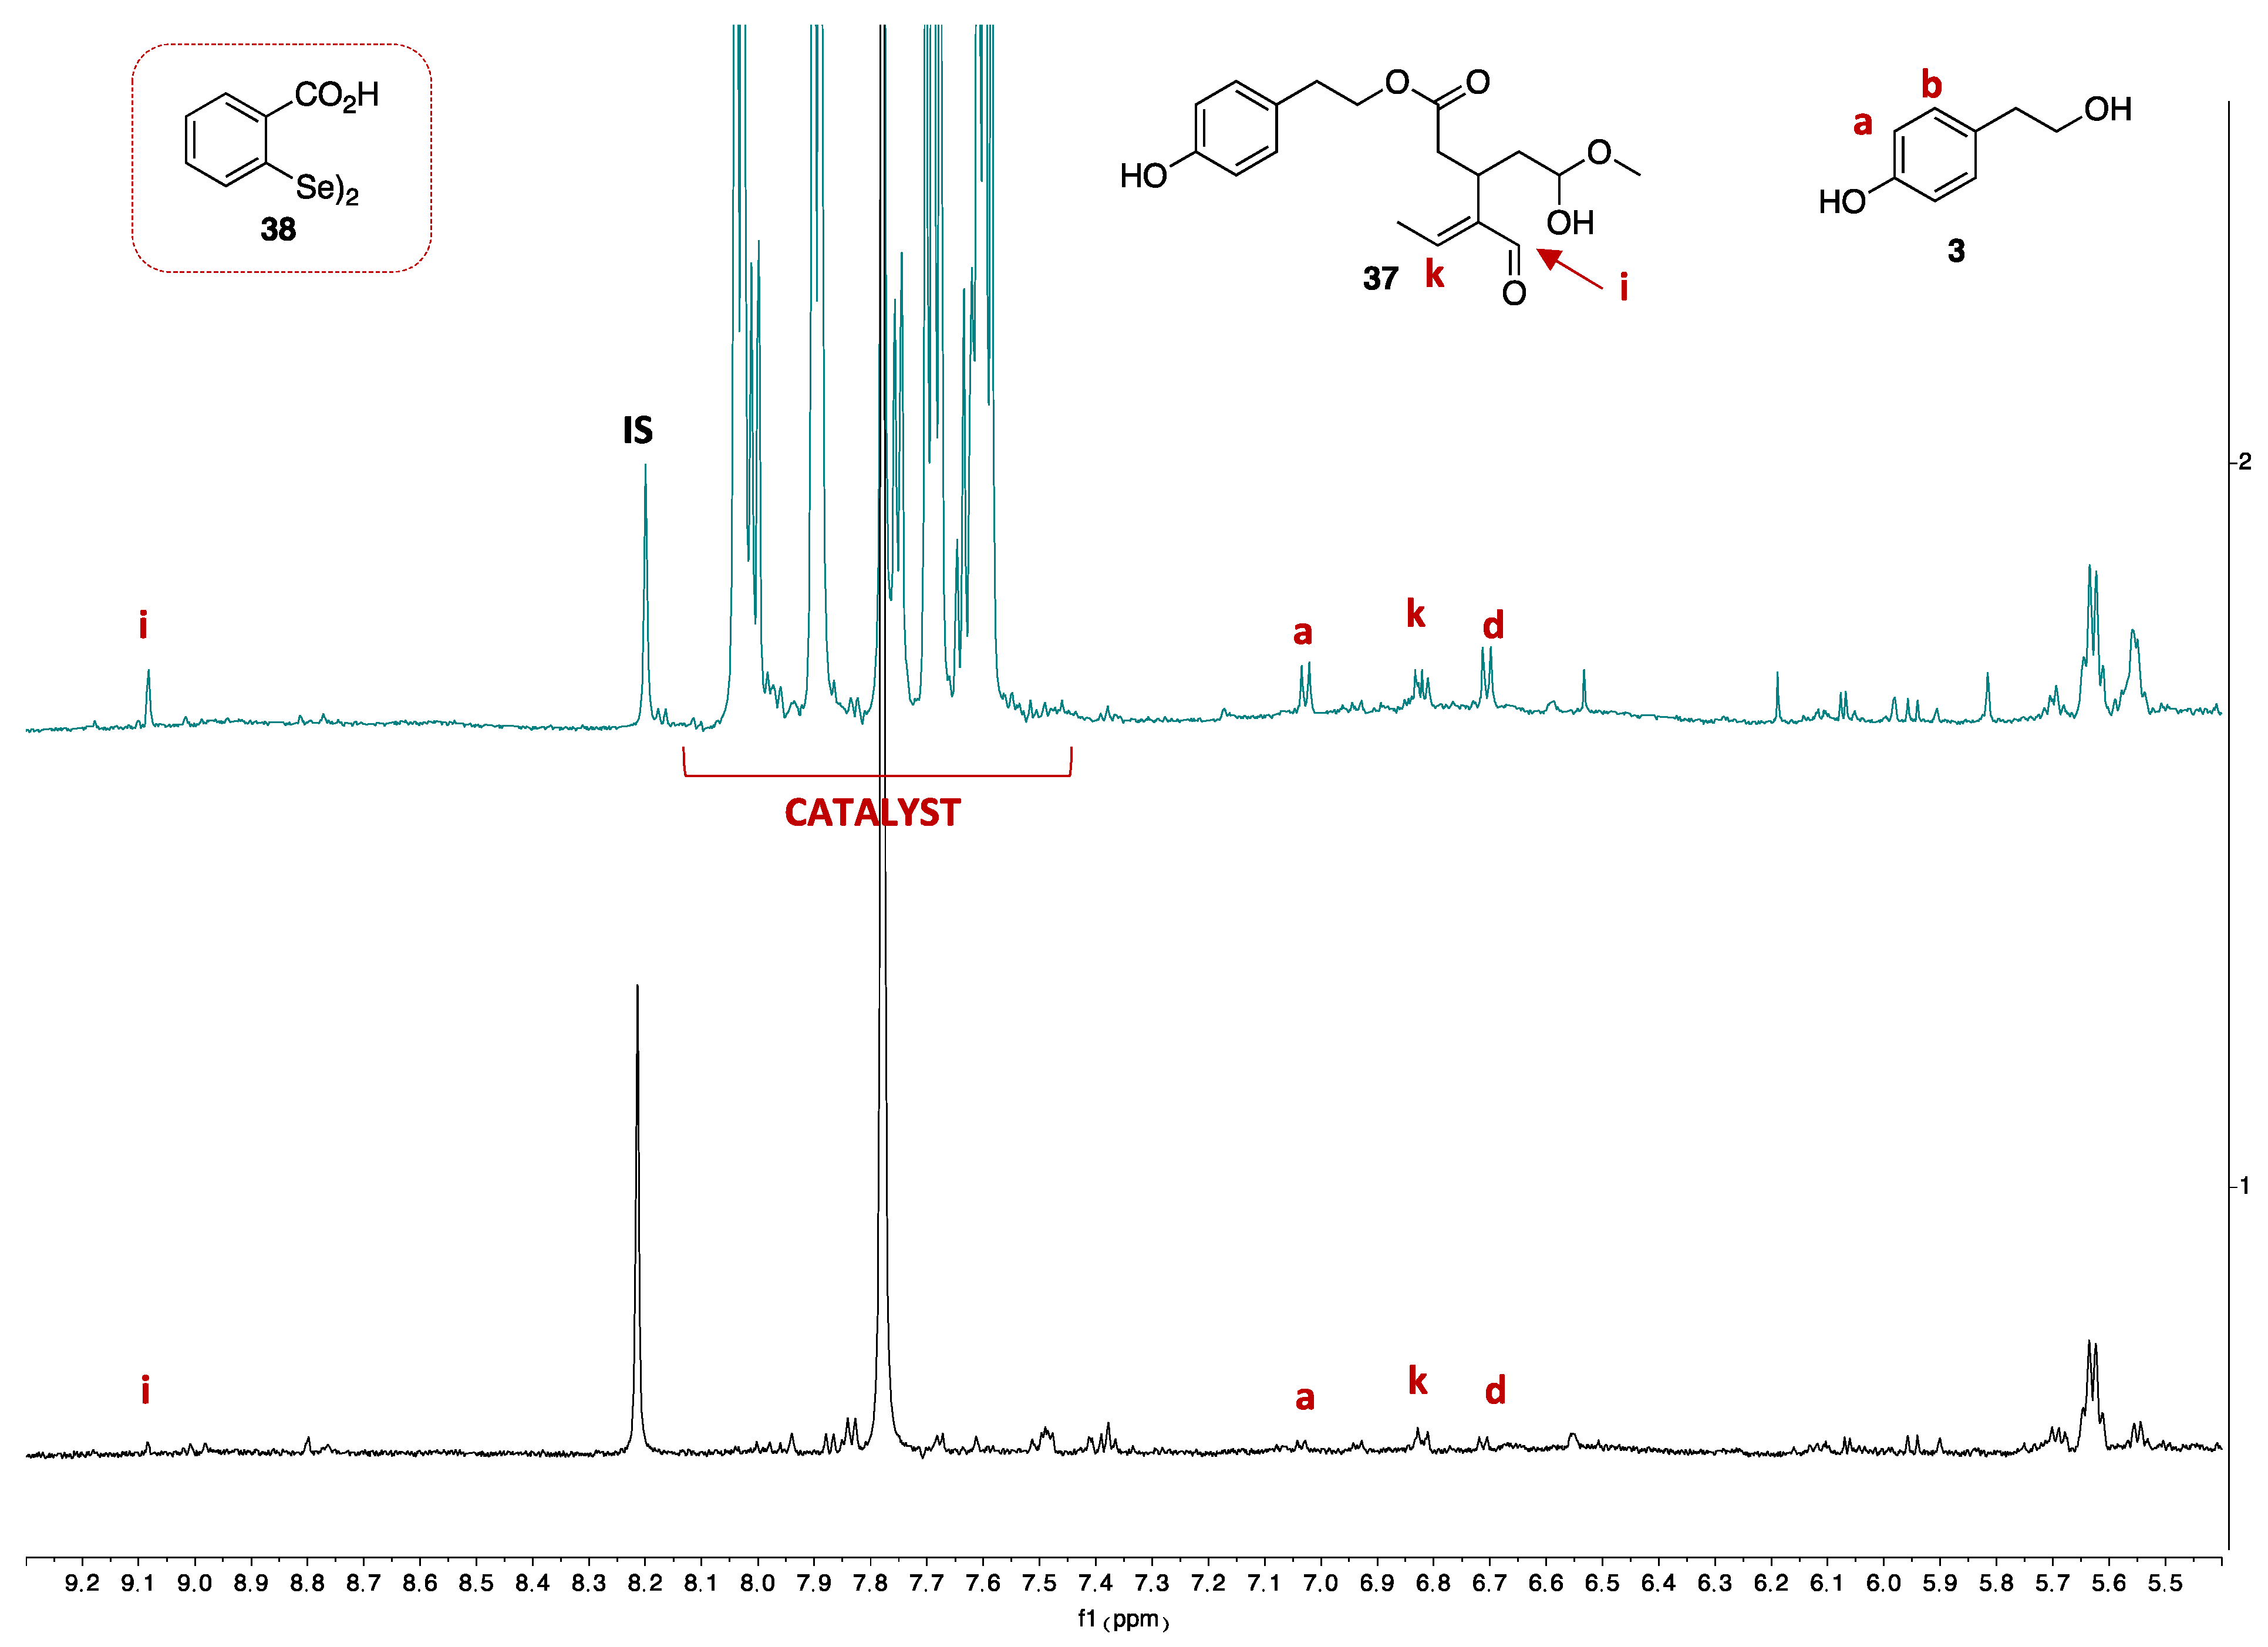
2.3. Measurement of Polyphenol Amount by qNMR
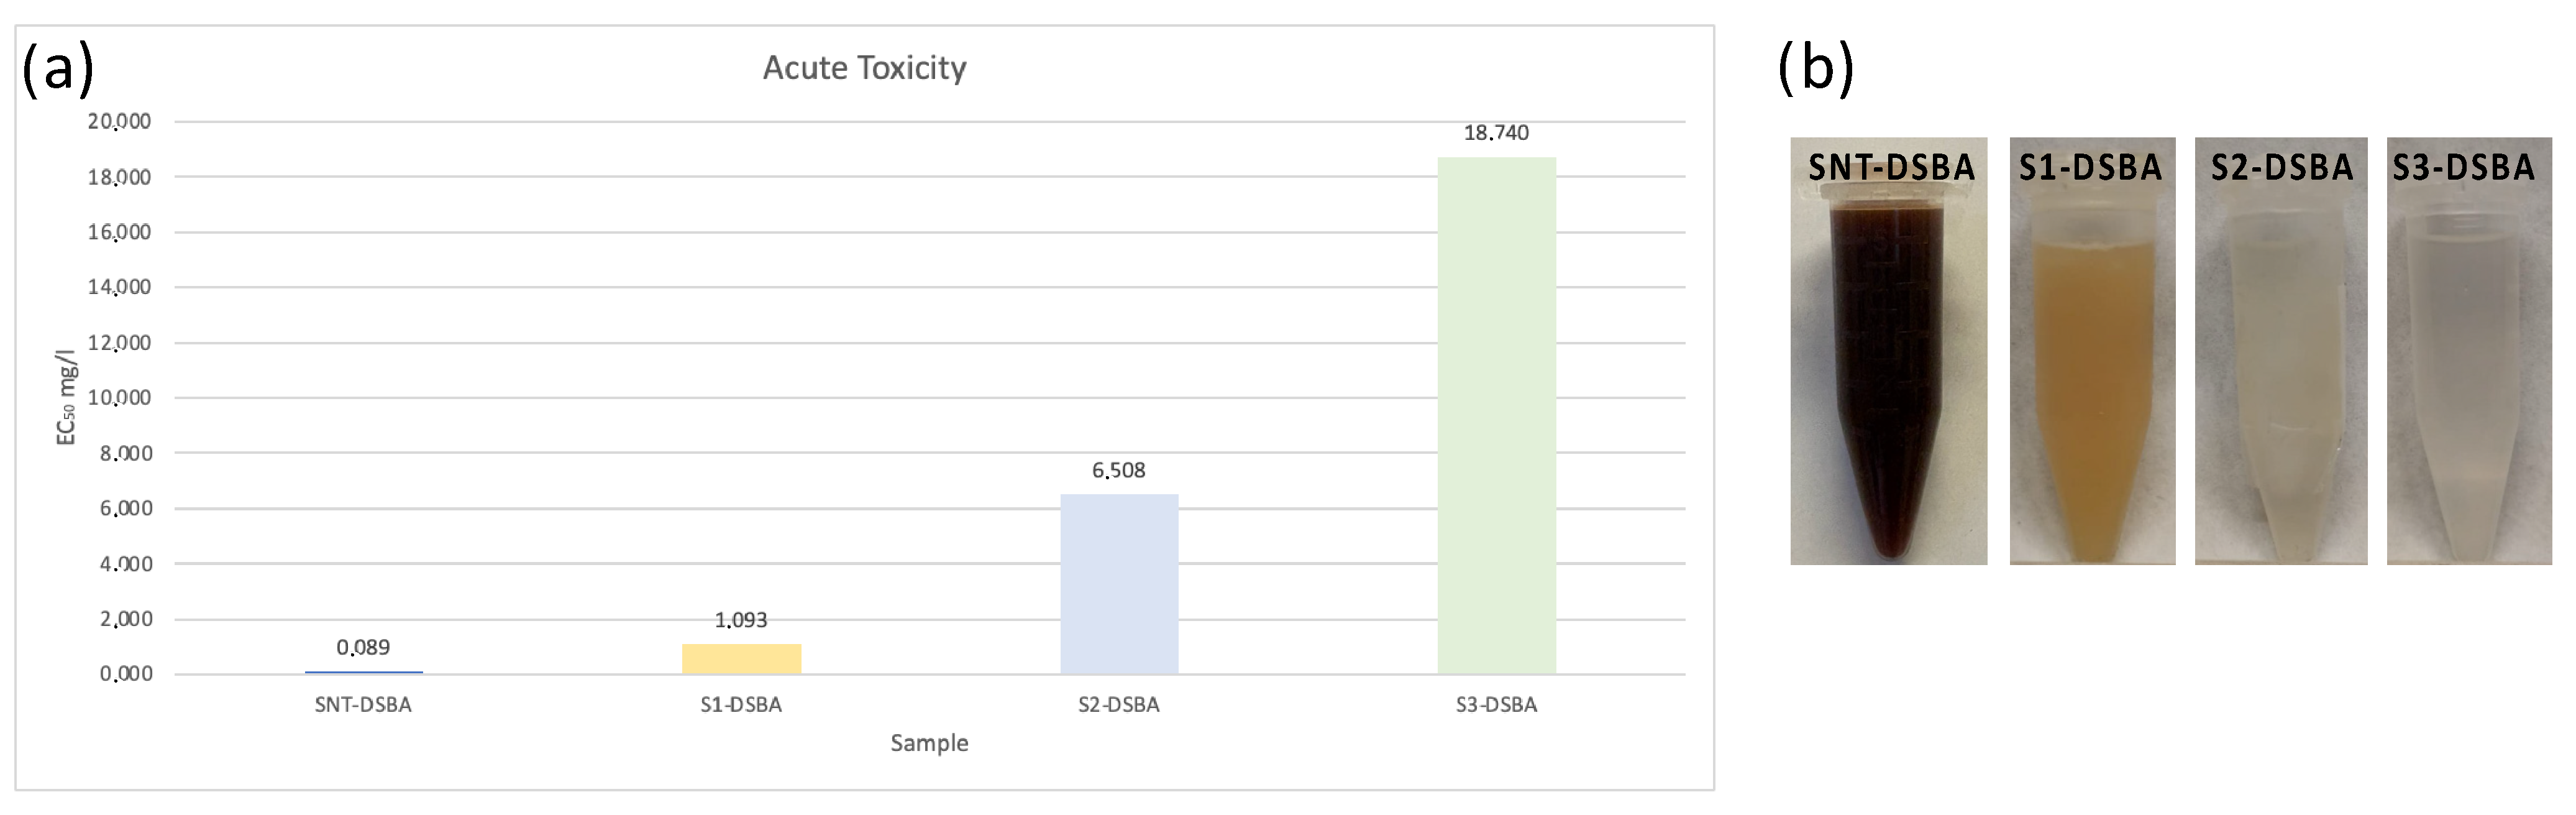
2.4. Toxicological Evaluation
3. Materials and Methods
3.1. General
Synthesis of Catalyst
3.2. Oxidation Reaction of Model Compound
3.3. Olive Mill Waste Water Oxidation and Quantification
3.3.1. Oxidation of OMW
3.3.2. F-C Quantification of OMW
- (a)
- First, 0.1 mL of the stock solution (250 μg/mL) was picked up and diluted to 1 mL, obtaining a solution with a concentration of 25 μg/mL.
- (b)
- Second, 0.08 mL of the stock solution (250 μg/mL) was picked up and diluted to 1 mL, obtaining a solution with a concentration of 20 μg/mL.
- (c)
- Third, 0.05 mL of the stock solution (250 μg/mL) was picked up and diluted to 1 mL, obtaining a solution with a concentration of 12.5 μg/mL.
- (d)
- Fourth, 0.03 mL of the stock solution (250 μg/mL) was picked up and diluted to 1 mL, obtaining a solution with a concentration of 7.5 μg/mL.
- (e)
- Fifth, 0.020 mL of the stock solution (250 μg/mL) was picked up and diluted to 1 mL, obtaining a solution with a concentration of 5 μg/mL.
- (f)
- Sixth, 0.015 mL of the stock solution (250 μg/mL) was picked up and diluted to 1 mL, obtaining a solution with a concentration of 3.75 μg/mL.
- (g)
- Seventh, 0.010 mL of the stock solution (250 μg/mL) was picked up and diluted to 1 mL, obtaining a solution with a concentration of 2.5 μg/mL.
3.3.3. Polyphenol Extraction
3.3.4. Acidic Polyphenol Extraction
3.3.5. Extracted Polyphenol Quantification
3.3.6. Polyphenol Quantification by 1H-NMR
3.3.7. Catalyst Removal by Filtration
3.4. Acute Toxicity—Microtox® 81.9% Basic Test
4. Conclusions
Supplementary Materials
Author Contributions
Funding
Institutional Review Board Statement
Informed Consent Statement
Data Availability Statement
Acknowledgments
Conflicts of Interest
Abbreviations
| OMW | Olive mill wastewater |
| GPx | Glutathione peroxidase |
| F-C | Folin–Ciocalteu |
| TPs | Total phenols |
| AOPs | Advanced oxidative processes |
| WAO | Wet air oxidation |
| NMR | Nuclear magnetic resonance |
References
- Almanza-Aguilera, E.; Cano, A.; Gil-Lespinard, M.; Burguera, N.; Zamora-Ros, R.; Agudo, A.; Farràs, M. Mediterranean Diet and Olive Oil, Microbiota, and Obesity-Related Cancers. From Mechanisms to Prevention. Semin. Cancer Biol. 2023, 95, 103–119. [Google Scholar] [CrossRef]
- Ochando-Pulido, J.M.; Fragoso, R.; Macedo, A.; Duarte, E.; Ferez, A.M. A Brief Review on Recent Processes for the Treatment of Olive Mill Effluents. In Products from Olive Tree; Boskou, D., Clodoveo, M.L., Eds.; InTech: Houston, TX, USA, 2016; ISBN 978-953-51-2724-6. [Google Scholar]
- International Olive Council. Available online: https://www.Internationaloliveoil.org (accessed on 14 October 2024).
- Tsagaraki, E.; Lazarides, H.N.; Petrotos, K.B. Olive Mill Wastewater Treatment. In Utilization of By-Products and Treatment of Waste in the Food Industry; Oreopoulou, V., Russ, W., Eds.; Springer: New York, NY, USA, 2007; pp. 133–157. ISBN 978-0-387-33511-7. [Google Scholar]
- Attard, K.; Lia, F. The Antioxidant and Bioactive Potential of Olive Mill Waste. In Biochemistry; Novo Barros, A., Cristina Santos Abraão, A., Eds.; IntechOpen: London, UK, 2024; Volume 60, ISBN 978-0-85466-206-7. [Google Scholar]
- Al-Hmoud, L. Olive Mill Wastewater Treatment: A Recent Review. Jordanian J. Eng. Chem. Ind. 2020, 3, 91–106. [Google Scholar] [CrossRef]
- Souilem, S.; El-Abbassi, A.; Kiai, H.; Hafidi, A.; Sayadi, S.; Galanakis, C.M. Olive Oil Production Sector: Environmental Effects and Sustainability Challenges. In Olive Mill Waste; Elsevier: Amsterdam, The Netherlands, 2017; pp. 1–28. ISBN 978-0-12-805314-0. [Google Scholar]
- McNamara, C.J.; Anastasiou, C.C.; O’Flaherty, V.; Mitchell, R. Bioremediation of Olive Mill Wastewater. Int. Biodeterior. Biodegrad. 2008, 61, 127–134. [Google Scholar] [CrossRef]
- Obied, H.K.; Allen, M.S.; Bedgood, D.R.; Prenzler, P.D.; Robards, K.; Stockmann, R. Bioactivity and Analysis of Biophenols Recovered from Olive Mill Waste. J. Agric. Food Chem. 2005, 53, 823–837. [Google Scholar] [CrossRef]
- Al-Qodah, Z.; Al-Zoubi, H.; Hudaib, B.; Omar, W.; Soleimani, M.; Abu-Romman, S.; Frontistis, Z. Sustainable vs. Conventional Approach for Olive Oil Wastewater Management: A Review of the State of the Art. Water 2022, 14, 1695. [Google Scholar] [CrossRef]
- Rozzi, A.; Malpei, F. Treatment and Disposal of Olive Mill Effluents. Int. Biodeterior. Biodegrad. 1996, 38, 135–144. [Google Scholar] [CrossRef]
- Martínez-Gallardo, M.R.; Jurado, M.M.; López-González, J.A.; Toribio, A.; Suárez-Estrella, F.; Sáez, J.A.; Moral, R.; Andreu-Rodríguez, F.J.; López, M.J. Biorecovery of Olive Mill Wastewater Sludge from Evaporation Ponds. J. Environ. Manag. 2022, 319, 115647. [Google Scholar] [CrossRef]
- Vaz, T.; Quina, M.M.J.; Martins, R.C.; Gomes, J. Olive Mill Wastewater Treatment Strategies to Obtain Quality Water for Irrigation: A Review. Sci. Total Environ. 2024, 931, 172676. [Google Scholar] [CrossRef]
- Magdich, S.; Ben Ahmed, C.; Jarboui, R.; Ben Rouina, B.; Boukhris, M.; Ammar, E. Dose and Frequency Dependent Effects of Olive Mill Wastewater Treatment on the Chemical and Microbial Properties of Soil. Chemosphere 2013, 93, 1896–1903. [Google Scholar] [CrossRef]
- Foti, P.; Romeo, F.V.; Russo, N.; Pino, A.; Vaccalluzzo, A.; Caggia, C.; Randazzo, C.L. Olive Mill Wastewater as Renewable Raw Materials to Generate High Added-Value Ingredients for Agro-Food Industries. Appl. Sci. 2021, 11, 7511. [Google Scholar] [CrossRef]
- De Martino, A.; Arienzo, M.; Iorio, M.; Vinale, F.; Lorito, M.; Prenzler, P.D.; Ryan, D.; Obied, H.K. Detoxification of Olive Mill Wastewaters by Zinc–Aluminium Layered Double Hydroxides. Appl. Clay Sci. 2011, 53, 737–744. [Google Scholar] [CrossRef]
- Chaari, I.; Touil, A.; Medhioub, M. Adsorption-Desorption of Phenolic Compounds from Olive Mills Wastewater Using Tunisian Natural Clay. Chin. J. Chem. Eng. 2021, 40, 287–292. [Google Scholar] [CrossRef]
- Sygouni, V.; Pantziaros, A.G.; Iakovides, I.C.; Sfetsa, E.; Bogdou, P.I.; Christoforou, E.A.; Paraskeva, C.A. Treatment of Two-Phase Olive Mill Wastewater and Recovery of Phenolic Compounds Using Membrane Technology. Membranes 2019, 9, 27. [Google Scholar] [CrossRef]
- Hanafi, F.; Assobhei, O.; Mountadar, M. Detoxification and Discoloration of Moroccan Olive Mill Wastewater by Electrocoagulation. J. Hazard. Mater. 2010, 174, 807–812. [Google Scholar] [CrossRef]
- Ehaliotis, C.; Papadopoulou, K.; Kotsou, M.; Mari, I.; Balis, C. Adaptation and Population Dynamics of Azotobacter Vinelandii during Aerobic Biological Treatment of Olive-Mill Wastewater. FEMS Microbiol. Ecol. 1999, 30, 301–311. [Google Scholar] [CrossRef]
- Ramos-Cormenzana, A.; Juárez-Jiménez, B.; Garcia-Pareja, M.P. Antimicrobial Activity of Olive Mill Wastewaters (Alpechin) and Biotransformed Olive Oil Mill Wastewater. Int. Biodeterior. Biodegrad. 1996, 38, 283–290. [Google Scholar] [CrossRef]
- Di Gioia, D.; Bertin, L.; Fava, F.; Marchetti, L. Biodegradation of Hydroxylated and Methoxylated Benzoic, Phenylacetic and Phenylpropenoic Acids Present in Olive Mill Wastewaters by Two Bacterial Strains. Res. Microbiol. 2001, 152, 83–93. [Google Scholar] [CrossRef]
- Chatzisymeon, E.; Diamadopoulos, E.; Mantzavinos, D. Effect of Key Operating Parameters on the Non-Catalytic Wet Oxidation of Olive Mill Wastewaters. Water Sci. Technol. 2009, 59, 2509–2518. [Google Scholar] [CrossRef]
- Gomes, H.T.; Figueiredo, J.L.; Faria, J.L. Catalytic Wet Air Oxidation of Olive Mill Wastewater. Catal. Today 2007, 124, 254–259. [Google Scholar] [CrossRef]
- Rivas, F.J.; Beltrán, F.J.; Gimeno, O.; Acedo, B. Wet Air Oxidation of Wastewater from Olive Oil Mills. Chem. Eng. Technol. 2001, 24, 415–421. [Google Scholar] [CrossRef]
- Elkacmi, R.; Bennajah, M. Advanced Oxidation Technologies for the Treatment and Detoxification of Olive Mill Wastewater: A General Review. J. Water Reuse Desalinat. 2019, 9, 463–505. [Google Scholar] [CrossRef]
- Hodaifa, G.; Agabo, C.; Moya, A.J.; Pacheco, R.; Mateo, S. Treatment of Olive Oil Mill Wastewater by UV-Light and UV/H2O2 System. Int. J. Green Technol. 2018, 1, 46–53. [Google Scholar] [CrossRef]
- Sponza, D.T.; Oztekin, R. Treatment of Olive Mill Wastewater by Photooxidation with ZrO2-Doped TiO2Nanocomposite and Its Reuse Capability. Environ. Technol. 2016, 37, 865–879. [Google Scholar] [CrossRef]
- Al-Bsoul, A.; Al-Shannag, M.; Tawalbeh, M.; Al-Taani, A.A.; Lafi, W.K.; Al-Othman, A.; Alsheyab, M. Optimal Conditions for Olive Mill Wastewater Treatment Using Ultrasound and Advanced Oxidation Processes. Sci. Total Environ. 2020, 700, 134576. [Google Scholar] [CrossRef]
- Nieto, L.M.; Hodaifa, G.; Rodríguez, S.; Giménez, J.A.; Ochando, J. Degradation of Organic Matter in Olive-Oil Mill Wastewater through Homogeneous Fenton-like Reaction. Chem. Eng. J. 2011, 173, 503–510. [Google Scholar] [CrossRef]
- Kallel, M.; Belaid, C.; Boussahel, R.; Ksibi, M.; Montiel, A.; Elleuch, B. Olive Mill Wastewater Degradation by Fenton Oxidation with Zero-Valent Iron and Hydrogen Peroxide. J. Hazard. Mater. 2009, 163, 550–554. [Google Scholar] [CrossRef]
- Siorou, S.; Vgenis, T.T.; Dareioti, M.A.; Vidali, M.; Efthimiou, I.; Kornaros, M.; Vlastos, D.; Dailianis, S. Investigation of olive mill wastewater (OMW) ozonation efficiency with the use of a battery of selected ecotoxicity and human toxicity assays. Aquat. Toxicol. 2015, 164, 135–144. [Google Scholar] [CrossRef]
- Gotsi, M.; Kalogerakis, N.; Psillakis, E.; Samaras, P.; Mantzavinos, D. Electrochemical Oxidation of Olive Oil Mill Wastewaters. Water Res. 2005, 39, 4177–4187. [Google Scholar] [CrossRef]
- Mekki, A.; Dhouib, A.; Feki, F.; Sayadi, S. Assessment of Toxicity of the Untreated and Treated Olive Mill Wastewaters and Soil Irrigated by Using Microbiotests. Ecotoxicol. Environ. Saf. 2008, 69, 488–495. [Google Scholar] [CrossRef]
- Belaqziz, M.; El-Abbassi, A.; Chamkh, F.; Qatibi, A.-I. Treatment of Olive Mill Wastewaters Using Infiltration/Percolation System: Effect on Microbial Communities in the Soil Filter. Desalinat. Water Treat. 2022, 276, 124–132. [Google Scholar] [CrossRef]
- Hernando, M.D.; De Vettori, S.; Martínez Bueno, M.J.; Fernández-Alba, A.R. Toxicity Evaluation with Vibrio Fischeri Test of Organic Chemicals Used in Aquaculture. Chemosphere 2007, 68, 724–730. [Google Scholar] [CrossRef]
- Pacuła-Miszewska, A.J.; Sancineto, L. Oxygen-Transfer Reactions Catalyzed by Organoselenium Compounds. In Organochalcogen Compounds; Elsevier: Amsterdam, The Netherlands, 2022; pp. 219–250. ISBN 978-0-12-819449-2. [Google Scholar]
- Lenardão, E.J.; Santi, C.; Sancineto, L. New Frontiers in Organoselenium Compounds; Springer International Publishing: Cham, Switzerland, 2018; ISBN 978-3-319-92404-5. [Google Scholar]
- Giurg, M.; Kowal, E.; Muchalski, H.; Syper, L.; Młochowski, J. Catalytic Oxidative Domino Degradation of Alkyl Phenols Towards 2- and 3-Substituted Muconolactones. Synth. Commun. 2008, 39, 251–266. [Google Scholar] [CrossRef]
- Scheck, C. Degradation of Phenol and Salicylic Acid by Ultraviolet Radiation/Hydrogen Peroxide/Oxygen. Water Res. 1995, 29, 2346–2352. [Google Scholar] [CrossRef]
- Pinho, I.A.; Lopes, D.V.; Martins, R.C.; Quina, M.J. Phytotoxicity Assessment of Olive Mill Solid Wastes and the Influence of Phenolic Compounds. Chemosphere 2017, 185, 258–267. [Google Scholar] [CrossRef]
- Pérez, M.; Dominguez-López, I.; Lamuela-Raventós, R.M. The Chemistry Behind the Folin–Ciocalteu Method for the Estimation of (Poly)Phenol Content in Food: Total Phenolic Intake in a Mediterranean Dietary Pattern. J. Agric. Food Chem. 2023, 71, 17543–17553. [Google Scholar] [CrossRef]
- Samara, M.; Nasser, A.; Mingelgrin, U. Critical Examination of the Suitability of the Folin-Ciocalteu Reagent Assay for Quantitative Analysis of Polyphenols—The Case of Olive-Mill Wastewater. Am. J. Anal. Chem. 2022, 13, 476–493. [Google Scholar] [CrossRef]
- Abu-Lafi, S.; Al-Natsheh, M.S.; Yaghmoor, R.; Al-Rimawi, F. Enrichment of Phenolic Compounds from Olive Mill Wastewater and In Vitro Evaluation of Their Antimicrobial Activities. Evid. Based Complement. Alternat. Med. 2017, 2017, 3706915. [Google Scholar] [CrossRef]
- De Marco, E.; Savarese, M.; Paduano, A.; Sacchi, R. Characterization and Fractionation of Phenolic Compounds Extracted from Olive Oil Mill Wastewaters. Food Chem. 2007, 104, 858–867. [Google Scholar] [CrossRef]
- Sands, K.N.; Mendoza Rengifo, E.; George, G.N.; Pickering, I.J.; Gelfand, B.S.; Back, T.G. The Unexpected Role of Se VI Species in Epoxidations with Benzeneseleninic Acid and Hydrogen Peroxide. Angew. Chem. Int. Ed. 2020, 59, 4283–4287. [Google Scholar] [CrossRef]
- Babić, S.; Malev, O.; Pflieger, M.; Lebedev, A.T.; Mazur, D.M.; Kužić, A.; Čož-Rakovac, R.; Trebše, P. Toxicity Evaluation of Olive Oil Mill Wastewater and Its Polar Fraction Using Multiple Whole-Organism Bioassays. Sci. Total Environ. 2019, 686, 903–914. [Google Scholar] [CrossRef]
- Isidori, M.; Lavorgna, M.; Nardelli, A.; Parrella, A. Model Study on the Effect of 15 Phenolic Olive Mill Wastewater Constituents on Seed Germination and Vibrio fischeri Metabolism. J. Agric. Food Chem. 2005, 53, 8414–8417. [Google Scholar] [CrossRef]
- Anghinoni, J.M.; Ferreira, S.S.; Piquini, P.C.; Iglesias, B.A.; Perin, G.; Penteado, F.; Lenardão, E.J. Visible Light and Triselenium Dicyanide (TSD): New Horizons in the Synthesis of Organic Selenocyanates. Chem. Eur. J. 2023, 29, e202301934. [Google Scholar] [CrossRef]
- Blainski, A.; Lopes, G.; De Mello, J. Application and Analysis of the Folin Ciocalteu Method for the Determination of the Total Phenolic Content from Limonium Brasiliense L. Molecules 2013, 18, 6852–6865. [Google Scholar] [CrossRef]
- Jastrzebski, R.; Weckhuysen, B.M.; Bruijnincx, P.C.A. Catalytic Oxidative Cleavage of Catechol by a Non-Heme Iron(Iii) Complex as a Green Route to Dimethyl Adipate. Chem. Commun. 2013, 49, 6912. [Google Scholar] [CrossRef]
- Grill, J.M.; Ogle, J.W.; Miller, S.A. An Efficient and Practical System for the Catalytic Oxidation of Alcohols, Aldehydes, and α,β-Unsaturated Carboxylic Acids. J. Org. Chem. 2006, 71, 9291–9296. [Google Scholar] [CrossRef]
- Kastelic, J.; Hodnik, Ž.; Šket, P.; Plavec, J.; Lah, N.; Leban, I.; Pajk, M.; Planinšek, O.; Kikelj, D. Fluconazole Cocrystals with Dicarboxylic Acids. Cryst. Growth Des. 2010, 10, 4943–4953. [Google Scholar] [CrossRef]
- Jones, I.C.; Sharman, G.J.; Pidgeon, J. 1H and13C NMR Data to Aid the Identification and Quantification of Residual Solvents by NMR Spectroscopy. Magn. Reson. Chem. 2005, 43, 497–509. [Google Scholar] [CrossRef]
- Saikia, B.; Borah, P. A New Avenue to the Dakin Reaction in H2O2–WERSA. RSC Adv. 2015, 5, 105583–105586. [Google Scholar] [CrossRef]
- Stern, A.J.; Swenton, J.S. Addition of Organolithium Reagents to Quinone Silyl Methyl Monoketals. A Useful Expedient in the Synthesis of p-Quinols Having Acid-Sensitive Groups. J. Org. Chem. 1988, 53, 2465–2468. [Google Scholar] [CrossRef]
- Krasowska, D.; Begini, F.; Santi, C.; Mangiavacchi, F.; Drabowicz, J.; Sancineto, L. Ultrasound-Assisted Synthesis of Alkali Metals Diselenides (M2Se2) and Their Application for the Gram-Scale Preparation of 2,2’-Diselenobis(Benzoic Acid). Arkivoc 2019, 2019, 24. [Google Scholar] [CrossRef]
- Sysolyatin, S.V.; Kryukov, Y.A.; Malykhin, V.V.; Muradov, K.K.; Chernysheva, G.A.; Aliev, O.I.; Smol’yakova, V.I.; Anishchenko, A.M.; Sidekhmenova, A.V.; Shamanaev, A.Y.; et al. p-Tyrosol: A new synthetic method and new types of pharmacological activity. Russ. Chem. Bull. 2015, 64, 2210–2214. [Google Scholar] [CrossRef]


 | ||||||||
|---|---|---|---|---|---|---|---|---|
| Entry | Spectrum | Time | NMR Conversion (%) | NMR Yield (%) | 22 (%) | E-23 (%) | Z-23 (%) | 24 (%) |
| 1 | S1-A [a] | 30 min | 100 | 99 | 84 | 14 | 2 | 0 |
| 2 | S1-B | 1 h | 100 | 65 | 66 | 27 | 4 | 3 |
| 3 | S1-C | 3 h | 100 | 36 | 74 | 18 | 7 | 1 |
| 4 | S1-D | 6 h | 100 | 35 | 63 | 24 | 11 | 2 |
| 5 | S1-E [b] | 24 h | 100 | 17 | 46 | 30 | 23 | 1 |
 | ||||
|---|---|---|---|---|
| Entry [a] | Substrate | Conversion (%) | Products (Ratio) | NMR Yield (%) |
| 1 |  | 100 | 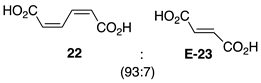 | 73 |
| 2 | 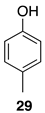 | 80 | 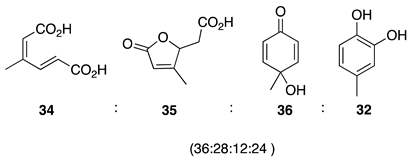 | 55 |
| 3 | 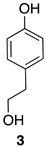 | 0 | - | - |
| 4 |  | 100 |  | n.c. [b] |
| 5 |  | 100 | 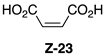 | n.c. [b] |
| 6 | 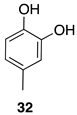 | 100 |  | 89 |
| 7 |  | 100 |  | n.c. [b] |
| Entry | 3 | 2 | 37 | TP | Decrease [b] (%) | ||||
|---|---|---|---|---|---|---|---|---|---|
| (μmol) [a] | (mg/mL) | (μmol) [a] | (mg/mL) | (μmol) [a] | (mg/mL) | (μmol) [a] | (mg/mL) | ||
| SNT | 1.47 | 0.45 | 8.48 | 2.91 | 1.80 | 1.35 | 11.75 | 4.70 | - |
| SMAX | 0.91 | 0.28 | 4.46 | 1.53 | 0.63 | 0.47 | 6.0 | 2.28 | 49 |
| S1 | 0.81 | 0.25 | 0 | 0 | 0.11 | 0.08 | 0.92 | 0.33 | 92 |
| S2 | 0.47 | 0.14 | 0 | 0 | 0 | 0 | 0.47 | 0.14 | 96 |
| S3 | 0.42 | 0.13 | 0 | 0 | 0.21 | 0.16 | 0.63 | 0.29 | 95 |
| S4 | 0.71 | 0.22 | 0 | 0 | 0.11 | 0.08 | 0.82 | 0.30 | 93 |
| Entry | 3 | 2 | 37 | TP | Decrease [b] (%) | ||||
|---|---|---|---|---|---|---|---|---|---|
| (μmol) [a] | (mg/mL) | (μmol) [a] | (mg/mL) | (μmol) [a] | (mg/mL) | (μmol) [a] | (mg/mL) | ||
| SNT | 1.47 | 0.45 | 8.48 | 2.91 | 1.80 | 1.35 | 11.75 | 4.70 | - |
| SMED | 1.10 | 0.34 | 5.30 | 1.82 | 1.75 | 1.31 | 8.15 | 3.6 | 31 |
| S5 | 1.02 | 0.31 | 4.09 | 1.40 | 1.57 | 1.17 | 6.68 | 2.89 | 43 |
| S6 | 0.94 | 0.29 | 3.94 | 1.35 | 1.3 | 0.97 | 6.18 | 2.61 | 47 |
| S7 | 1.02 | 0.31 | 5.30 | 1.82 | 1.59 | 1.19 | 7.91 | 3.32 | 33 |
| S8 | 1.03 | 0.32 | 5.04 | 1.73 | 1.41 | 1.05 | 7.48 | 3.10 | 36 |
| Entry | 3 | 2 | 37 | TP | Reduction [b] (%) | ||||
|---|---|---|---|---|---|---|---|---|---|
| (μmol) [a] | (mg/mL) | (μmol) [a] | (mg/mL) | (μmol) [a] | (mg/mL) | (μmol) [a] | (mg/mL) | ||
| SNT | 1.47 | 0.45 | 8.48 | 2.91 | 1.80 | 1.35 | 11.75 | 4.70 | - |
| SMIN | 1.27 | 0.39 | 5.62 | 1.93 | 1.48 | 1.11 | 8.37 | 3.42 | 29 |
| S9 | 1.07 | 0.33 | 4.88 | 1.67 | 1.36 | 1.02 | 7.31 | 3.02 | 38 |
| S10 | 1.10 | 0.34 | 5.49 | 1.88 | 1.37 | 1.02 | 7.96 | 3.24 | 32 |
| S11 | 1.06 | 0.33 | 5.61 | 1.92 | 1.54 | 1.15 | 8.21 | 3.40 | 30 |
| S12 | 1.16 | 0.36 | 5.10 | 1.75 | 1.53 | 1.14 | 7.79 | 3.25 | 34 |
| Sample | EC50 [mg/L] | Determination Coefficient (R2) |
|---|---|---|
| SNT | 0.0886 (0.0386–0.2029) | 0.09191 |
| S1 | 0.1163 (0.0902–0.1501) | 0.9938 |
| S2 | 0.0965 (0.0671–0.1390) | 0.9623 |
| S3 | 0.1569 (0.1085–0.2269) | 0.9668 |
| S4 | 0.1150 (0.1062–0.1245) | 0.9981 |
| S5 | 0.1261 (0.1089–0.1461) | 0.9623 |
| S6 | 0.2019 (0.1123–0.3631) | 0.9603 |
| S7 | 0.2190 (0.1376–0.3486) | 0.9352 |
| S8 | 0.2054 (0.1329–0.3174) | 0.9446 |
| S9 | 0.2087 (0.1431–0.3044) | 0.9580 |
| S10 | 0.3321 (0.2694–0.4109) | 0.9833 |
| S11 | 0.3612 (0.2724–0.4791) | 0.9705 |
| S12 | 0.2761 (0.2362–0.3228) | 0.9914 |
| Sample | EC50 [mg/L] (5 Min) | Determination Coefficient (R2) |
|---|---|---|
| SNT | 0.0886 (0.0386–0.2029) | 0.09191 |
| S1-DSBA | 1.093 (0.5756–2.076) | 0.9488 |
| S2-DSBA | 6.508 (5.181–8.175) | 0.9815 |
| S3-DSBA | 18.74 (7.107–49.41) | 0.9896 |
Disclaimer/Publisher’s Note: The statements, opinions and data contained in all publications are solely those of the individual author(s) and contributor(s) and not of MDPI and/or the editor(s). MDPI and/or the editor(s) disclaim responsibility for any injury to people or property resulting from any ideas, methods, instructions or products referred to in the content. |
© 2025 by the authors. Licensee MDPI, Basel, Switzerland. This article is an open access article distributed under the terms and conditions of the Creative Commons Attribution (CC BY) license (https://creativecommons.org/licenses/by/4.0/).
Share and Cite
Scimmi, C.; Szymanek, I.; Rogacz, D.; Passeri, S.; Patanella, G.; Kozłowski, C.; Deska, M.; Rychter, P.; Drabowicz, J.; Santi, C. Green Chemistry Meets Olive Mill Wastewater: Bioinspired Oxidation of Phenols and Polyphenols Using Selenium Catalysts. Int. J. Mol. Sci. 2025, 26, 5192. https://doi.org/10.3390/ijms26115192
Scimmi C, Szymanek I, Rogacz D, Passeri S, Patanella G, Kozłowski C, Deska M, Rychter P, Drabowicz J, Santi C. Green Chemistry Meets Olive Mill Wastewater: Bioinspired Oxidation of Phenols and Polyphenols Using Selenium Catalysts. International Journal of Molecular Sciences. 2025; 26(11):5192. https://doi.org/10.3390/ijms26115192
Chicago/Turabian StyleScimmi, Cecilia, Izabela Szymanek, Diana Rogacz, Sebastiano Passeri, Giulia Patanella, Cezary Kozłowski, Małgorzata Deska, Piotr Rychter, Jozef Drabowicz, and Claudio Santi. 2025. "Green Chemistry Meets Olive Mill Wastewater: Bioinspired Oxidation of Phenols and Polyphenols Using Selenium Catalysts" International Journal of Molecular Sciences 26, no. 11: 5192. https://doi.org/10.3390/ijms26115192
APA StyleScimmi, C., Szymanek, I., Rogacz, D., Passeri, S., Patanella, G., Kozłowski, C., Deska, M., Rychter, P., Drabowicz, J., & Santi, C. (2025). Green Chemistry Meets Olive Mill Wastewater: Bioinspired Oxidation of Phenols and Polyphenols Using Selenium Catalysts. International Journal of Molecular Sciences, 26(11), 5192. https://doi.org/10.3390/ijms26115192