Article

Evaluating Glial Fibrillary Acidic Protein and Neurofilament Light as Potential Biomarkers for Spinocerebellar Ataxia 7

by
Rana Hanna Al-Shaikh
1,2,
Karen Jansen-West
1,3,
Audrey Strongosky
2,
Zoe Parrales
2,
Judith A. Dunmore
1,
Yuping Song
1,
Tania F. Gendron
1,3,
Juan C. Guevara
4,
Helio A. G. Teive
5,
Jarosław Dulski
2,6,7,
Jarosław Sławek
6,7,
Leonard Petrucelli
1,3,
Zbigniew K. Wszolek
2,* and
Mercedes Prudencio
1,3,*
1
Department of Neuroscience, Mayo Clinic, Jacksonville, FL 32224, USA
2
Department of Neurology, Mayo Clinic, Jacksonville, FL 32224, USA
3
Neuroscience Graduate Program, Mayo Graduate School, Mayo Clinic College of Medicine, Jacksonville, FL 32224, USA
4
Department of Science, University of Barcelona, 08007 Barcelona, Spain
5
Movement Disorders Unit, Neurology Service, Internal Medicine Department, Hospital de Clínicas, Federal University of Paraná, Curitiba 80060-90, PR, Brazil
6
Division of Neurological and Psychiatric Nursing, Medical University of Gdańsk, 80-211 Gdansk, Poland
7
Neurology Department, St. Adalbert Hospital, Copernicus PL Ltd., 80-462 Gdansk, Poland
*
Authors to whom correspondence should be addressed.
Int. J. Mol. Sci. 2025, 26(11), 5070; https://doi.org/10.3390/ijms26115070
Submission received: 14 March 2025 / Revised: 20 May 2025 / Accepted: 21 May 2025 / Published: 24 May 2025
(This article belongs to the Special Issue Advances in Rare Diseases Biomarkers: 2nd Edition)

Abstract

Spinocerebellar ataxia type 7 (SCA7), a rare form of ataxia, possesses a wide phenotypic spectrum ranging from classic ataxic symptoms to blindness, multiorgan failure, cardiomyopathy, and early death among younger age groups. Biomarkers associated with disease progression and severity could aid in disease prognostication. We evaluated the utility of glial fibrillary acidic protein (GFAP) and neurofilament light (NfL) in distinguishing patients with SCA7 from healthy controls and estimating patient prognosis. GFAP and NfL levels were measured in 23 plasma and 20 cerebrospinal fluid (CSF) samples from asymptomatic (N = 3) and symptomatic SCA7 participants (N = 10) and from healthy controls (N = 8). GFAP concentrations were elevated in the plasma (82.7 pg/mL) and CSF (9318 pg/mL) of patients with SCA7 compared to controls (plasma: 48.0 pg/mL; CSF: 89,056 pg/mL). Similarly, NfL plasma (21.6 pg/mL) and CSF (2615.0 pg/mL) levels were also significantly upregulated in SCA7 compared to controls (plasma: 8.2 pg/mL; CSF: 414.6 pg/mL). Higher levels of NfL, but not of GFAP, significantly discriminated symptomatic SCA7 patients from controls (area under de curve, AUC: 0.898, p = 0.0059, in plasma, and AUC: 1.0, p = 0.0012, in CSF). The levels of both biomarkers increased overtime, with plasma NfL levels strongly associated with a worse score in the scale for the assessment and rating of ataxia (SARA) (Spearman r: 0.8354, p = 0.0007; regression analysis: β: 0.021, 95% CI: 0.008–0.035, p = 0.0048). These findings suggest that NfL could serve as a valuable biomarker for monitoring disease progression and prognosis in SCA7 patients.
Keywords:
ataxia; NfL; GFAP; biomarker

1. Introduction

Spinocerebellar ataxia type 7 (SCA7, OMIM#164500) is 1 of 50 types of autosomal dominant cerebellar ataxias identified to date [1,2,3]. With a prevalence of 1 to 5 in 100,000 individuals worldwide, SCAs are not as frequently encountered when compared to other movement disorders. SCA7 is extremely rare and may present in <1:100,000 individuals [4]. It is most prevalent in a few geographical regions around the globe, including Mexico, Sweden, South Africa, and Venezuela [5,6,7,8,9]. SCA7 is caused by a cytosine–adenine–guanine (CAG) polyglutamine (polyQ) repeat expansion located within exon 3 of the ataxin 7 (ATXN7) gene [10,11] on chromosome 3p14.1 [3]. The ATXN7 gene encodes an 892 amino acid protein, with the N-terminal polyglutamine expansion altering the assembly of the PT3-TAFII31-GCN5L acetylase (STAGA) chromatin-modifying complex involved in transcriptional regulation [12,13]. The normal length of CAG repeats in ATXN7 ranges from 3 to 20, indicating that ATXN7 can only handle a limited number of repeats before it becomes pathogenic [13]. When the number of CAG repeats exceeds the normal range, it can lead to SCA7. There are two categories of pathogenic repeat expansions: reduced penetrance (34 to 36 CAG repeats), where individuals may or may not develop disease, or full penetrance (37 to 460 CAG repeats), where individuals are highly likely to develop disease [3]. Anticipation, a phenomenon where disease worsens and appears earlier in each generation of a family, is frequently observed in CAG-repeat SCAs and presents more intensely among SCA7 mutation carriers [3,14]. Due to its unstable nature, the CAG repeat expansion mutation in SCA7 expands with each successive generation, leading to a variation in disease manifestation [12]. Members of the successive generations may develop more severe symptoms and at a younger age, years prior to the development of symptoms in their parents or grandparents [15]. A unique aspect of SCA7 is its propensity to manifest across different age groups, including infants, juveniles, adolescents, and adults. Additionally, longer CAG repeats, particularly those with 100 or more repeats, are more frequently observed in younger patients with SCA7, often leading to a more severe clinical course or even death. This pattern of anticipation is notably distinct from other CAG repeat diseases and usually displays poor prognosis [3]. The clinical manifestation of SCA7 includes typical characteristics of other spinocerebellar ataxias (SCAs): gait impairment, incoordination, nystagmus, dysarthria, dysmetria, ocular motor disturbances, dysdiadochokinesia, hyperreflexia, peripheral neuropathy, and postural tremor [8]. SCA7 presents with some clinical features that are distinct from other SCAs, such as visual impairment that can progress to complete vision loss due to the gradual degeneration and dystrophy of retinal rods and cones [16,17,18]. All aforementioned traits contribute to the wide spectrum of clinical phenotypes and disease severity ranging from vision impairment during adult onset [17,19] to failure to thrive, developmental delay, multiorgan failure, and cardiomyopathy, eventually leading to death at a very early age [3,15]. Advancements in genetic analysis have facilitated the determination of a definitive diagnosis; however, predicting prognosis and survival and improving patient care are still unattainable without molecular indicators. Accordingly, in this paper, we investigate the biomarker utility of two intermediate filaments—glial fibrillary acidic protein (GFAP), a marker of astrogliosis, and neurofilament light (NfL), a marker of neuroaxonal damage and neurodegeneration. While GFAP has been associated with other neurodegenerative diseases [20,21,22,23], it has not been investigated as a biomarker for SCA7. Moreover, NfL has been detected in biofluids from patients with various neurodegenerative diseases [24,25,26,27,28,29], including SCA3, pre-symptomatic and early-onset SCA7, and other SCAs [30,31,32,33,34,35,36,37,38]. Therefore, we measured NfL and GFAP levels in the plasma and cerebrospinal fluid (CSF) of individuals with asymptomatic and symptomatic SCA7 and controls to evaluate their potential as disease biomarkers.

2. Results

2.1. Study Participants

Our cohort consists of asymptomatic (N = 3) and symptomatic SCA7 participants (N = 10) and healthy controls (N = 8), with a total of 7 females in the asymptomatic (N = 2) and symptomatic (N = 5) SCA7 groups (Table 1). SCA7 individuals originated from Mexico, Poland, Spain, and the United States. The Polish patients were previously reported [39], and our cohort contained one child with an onset of ataxia at the age of 7 years. The median age of ataxia onset in our cohort of patients with SCA7 was 30 years, with a range from 7 to 55 years of age (Table 1). Symptoms at disease onset included vision impairment (N = 3) and/or gait difficulties (N = 6), tremor (N = 1), and dysarthria (N = 1). Median disease duration from age of onset to time of first sample collection was 8.61 for the seven patients of SCA7 with CSF and 8.73 for all SCA7 patients with plasma (Table 1). The clinical rating scales utilized in our study were the scale for the assessment and rating of ataxia (SARA) [34] and gait mobility scale (GMS) [40]. The median SARA score among the symptomatic SCA7 patients was 11.5 (range: 3–31, out of 40 points) (Table 1). As for the GMS, the median score was 1, corresponding with impaired gait with no assistance required (range: 0 to 4) (Table 1). At the first visit, most patients with SCA7 also showed vision changes (N = 8) and/or abnormal reflexes (N = 8).

2.2. Length of ATXN7 CAG Repeat Expansion Is Associated with Age of Ataxia Onset

The association between longer CAG repeat length in ATXN7 and earlier age of symptom onset was previously established [3,38,41,42]. We thus evaluated whether ATXN7 CAG repeat length is associated with age of symptom onset in our cohort of patients with SCA7. The median number of CAG repeats in the symptomatic SCA7 cohort, determined through a research lab-based polymerase-chain reaction assays, was 39 CAG repeats, with a range from 34 to 43 CAG repeats. Of note, results from clinically approved genetic assays for CAG ATXN7 repeat-length are also available for six individuals in the cohort and show a slightly higher number of repeats than the research-based laboratory assays (Table S1), where symptomatic SCA7 showed a median number of 43 ATXN7 CAG repeats (range: 41–50). Since clinical-based assays were not available for all study participants, we used the research lab-based assay results for subsequent analyses. We observed that an earlier age of ataxia onset correlated with longer ATXN7 CAG repeat expansions (Spearman r = −0.8598, p = 0.0023, N = 10; Figure S1), analogous to previously published studies [38,41].

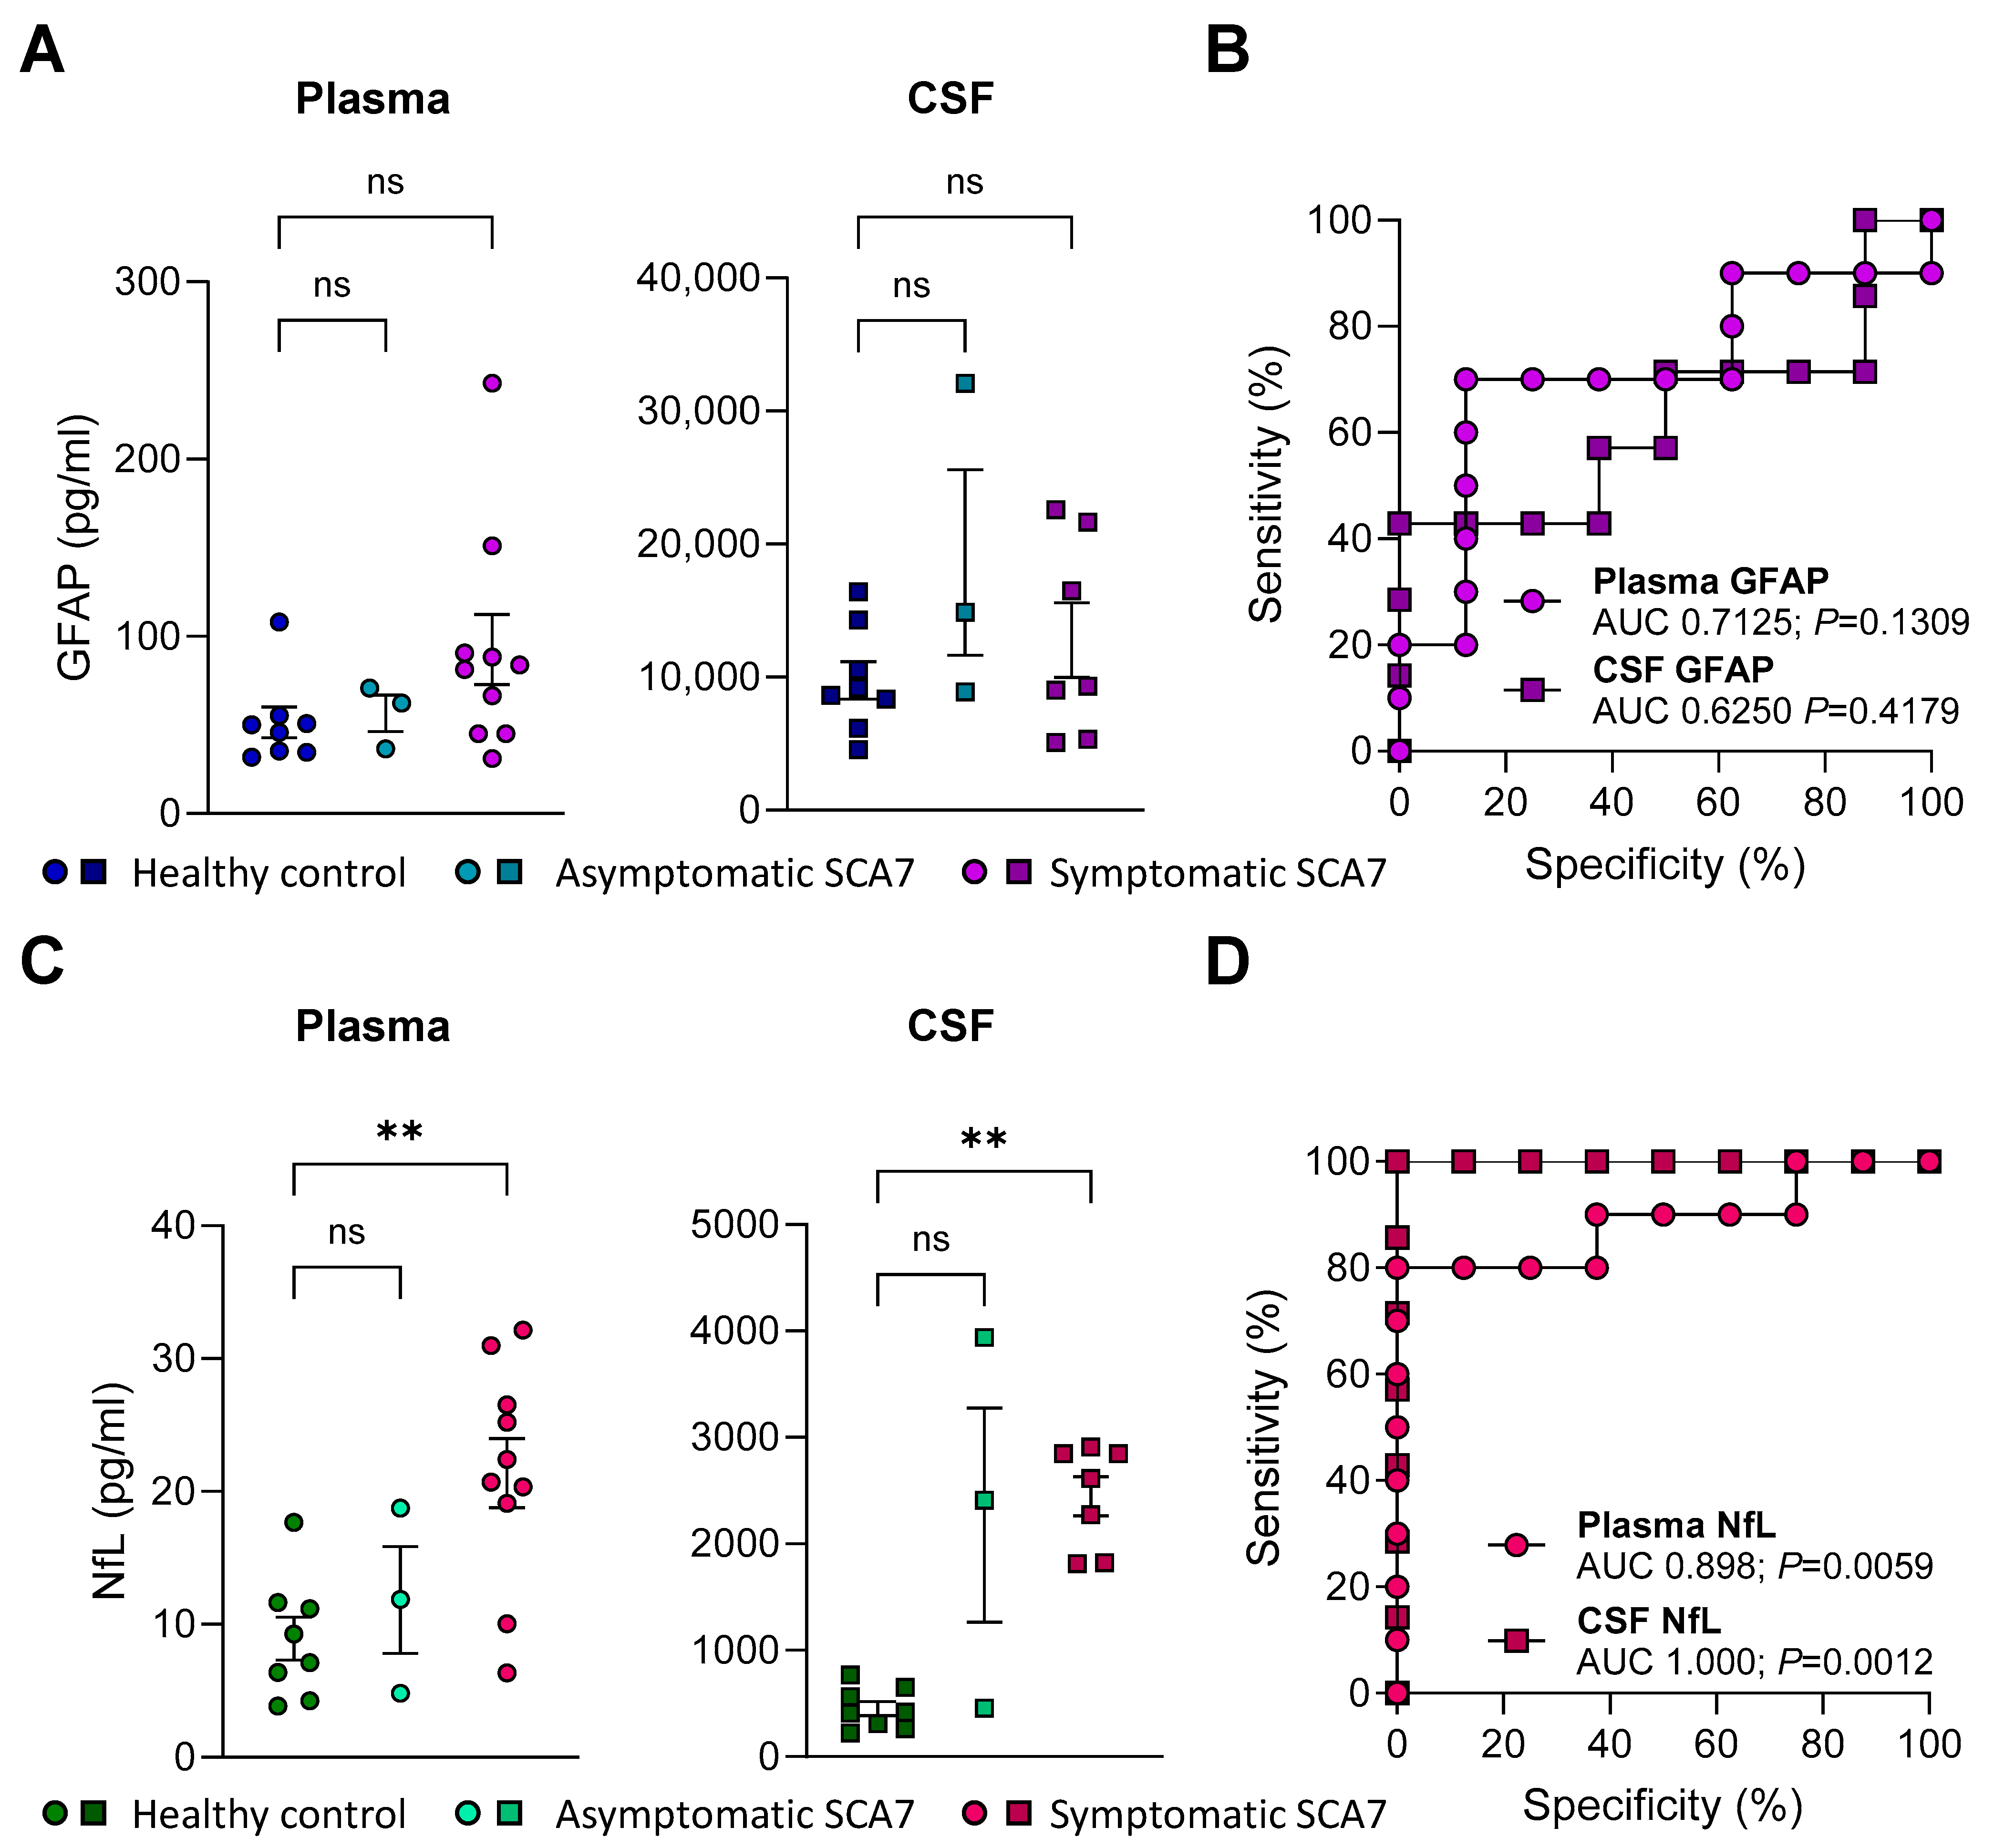
2.3. GFAP Concentrations in Plasma or CSF Do Not Distinguish Patients with SCA7 from Healthy Controls

Based on emerging evidence demonstrating increased GFAP concentrations in biofluids from individuals with neurodegenerative diseases [20,21,22,23], we evaluated whether plasma or CSF GFAP is elevated in SCA7 patients compared to the controls. Trends of higher plasma and CSF GFAP levels were observed in symptomatic SCA7 patients compared to the healthy controls (Figure 1A), where the median plasma and CSF GFAP concentrations were 82.7 and 9318 pg/mL, respectively, in SCA7 compared to 48 and 8906 pg/mL in the plasma and CSF of controls (Table 1). Of note, we also included the evaluation of three asymptomatic ATXN7 mutation carriers and, while these numbers are too low to establish meaningful outcomes, we observed a similar trend of higher GFAP in the CSF of asymptomatic SCA7 (148,801 pg/mL) compared to the controls (8906 pg/mL; Figure 1A and Table 1). We additionally performed a receiver operator characteristic (ROC) curve analysis to evaluate the ability of GFAP levels to discriminate between symptomatic SCA7 individuals and the controls. The area under the curve (AUC) values were higher when using GFAP concentrations in plasma (AUC: 0.7125, p = 0.1309) than in CSF (AUC: 0.625, p = 0.4179), but neither reached statistical significance (Figure 1B). Overall, while GFAP levels trended higher in patients with SCA7, they did not strongly discriminate them from the healthy controls.

2.4. NfL Levels in Plasma and CSF Are Elevated in SCA7 Patients and Distinguishes Them from Healthy Controls

Multiple studies across neurodegenerative diseases have shown that NfL concentrations in biofluids show prognostic utility [24,28,29,43,44]. As we performed for GFAP, we measured NfL in our study cohort. We observed a significant increase in both plasma (median of 21.6 pg/mL) and CSF (median of 2615 pg/mL) NfL levels in patients with SCA7 compared to the controls (median plasma: 8.2 pg/mL; median CSF: 414.6 pg/mL; Figure 1C and Table 1). Both plasma (AUC: 0.898, p = 0.0059) and CSF (AUC: 1.0, p = 0.0012) NfL strongly discriminated patients with SCA7 from the healthy controls (Figure 1D). We also observed higher, although not significant, CSF NfL levels in the three asymptomatic SCA7 individuals (median 2412 pg/mL; Table 1) and showed a high AUC value (AUC: 0.875, p = 0.0662), when compared to the controls (Figure S2). Overall, these data suggest that neuronal injury is prevalent in patients with SCA7 and may serve to discriminate them from the controls.

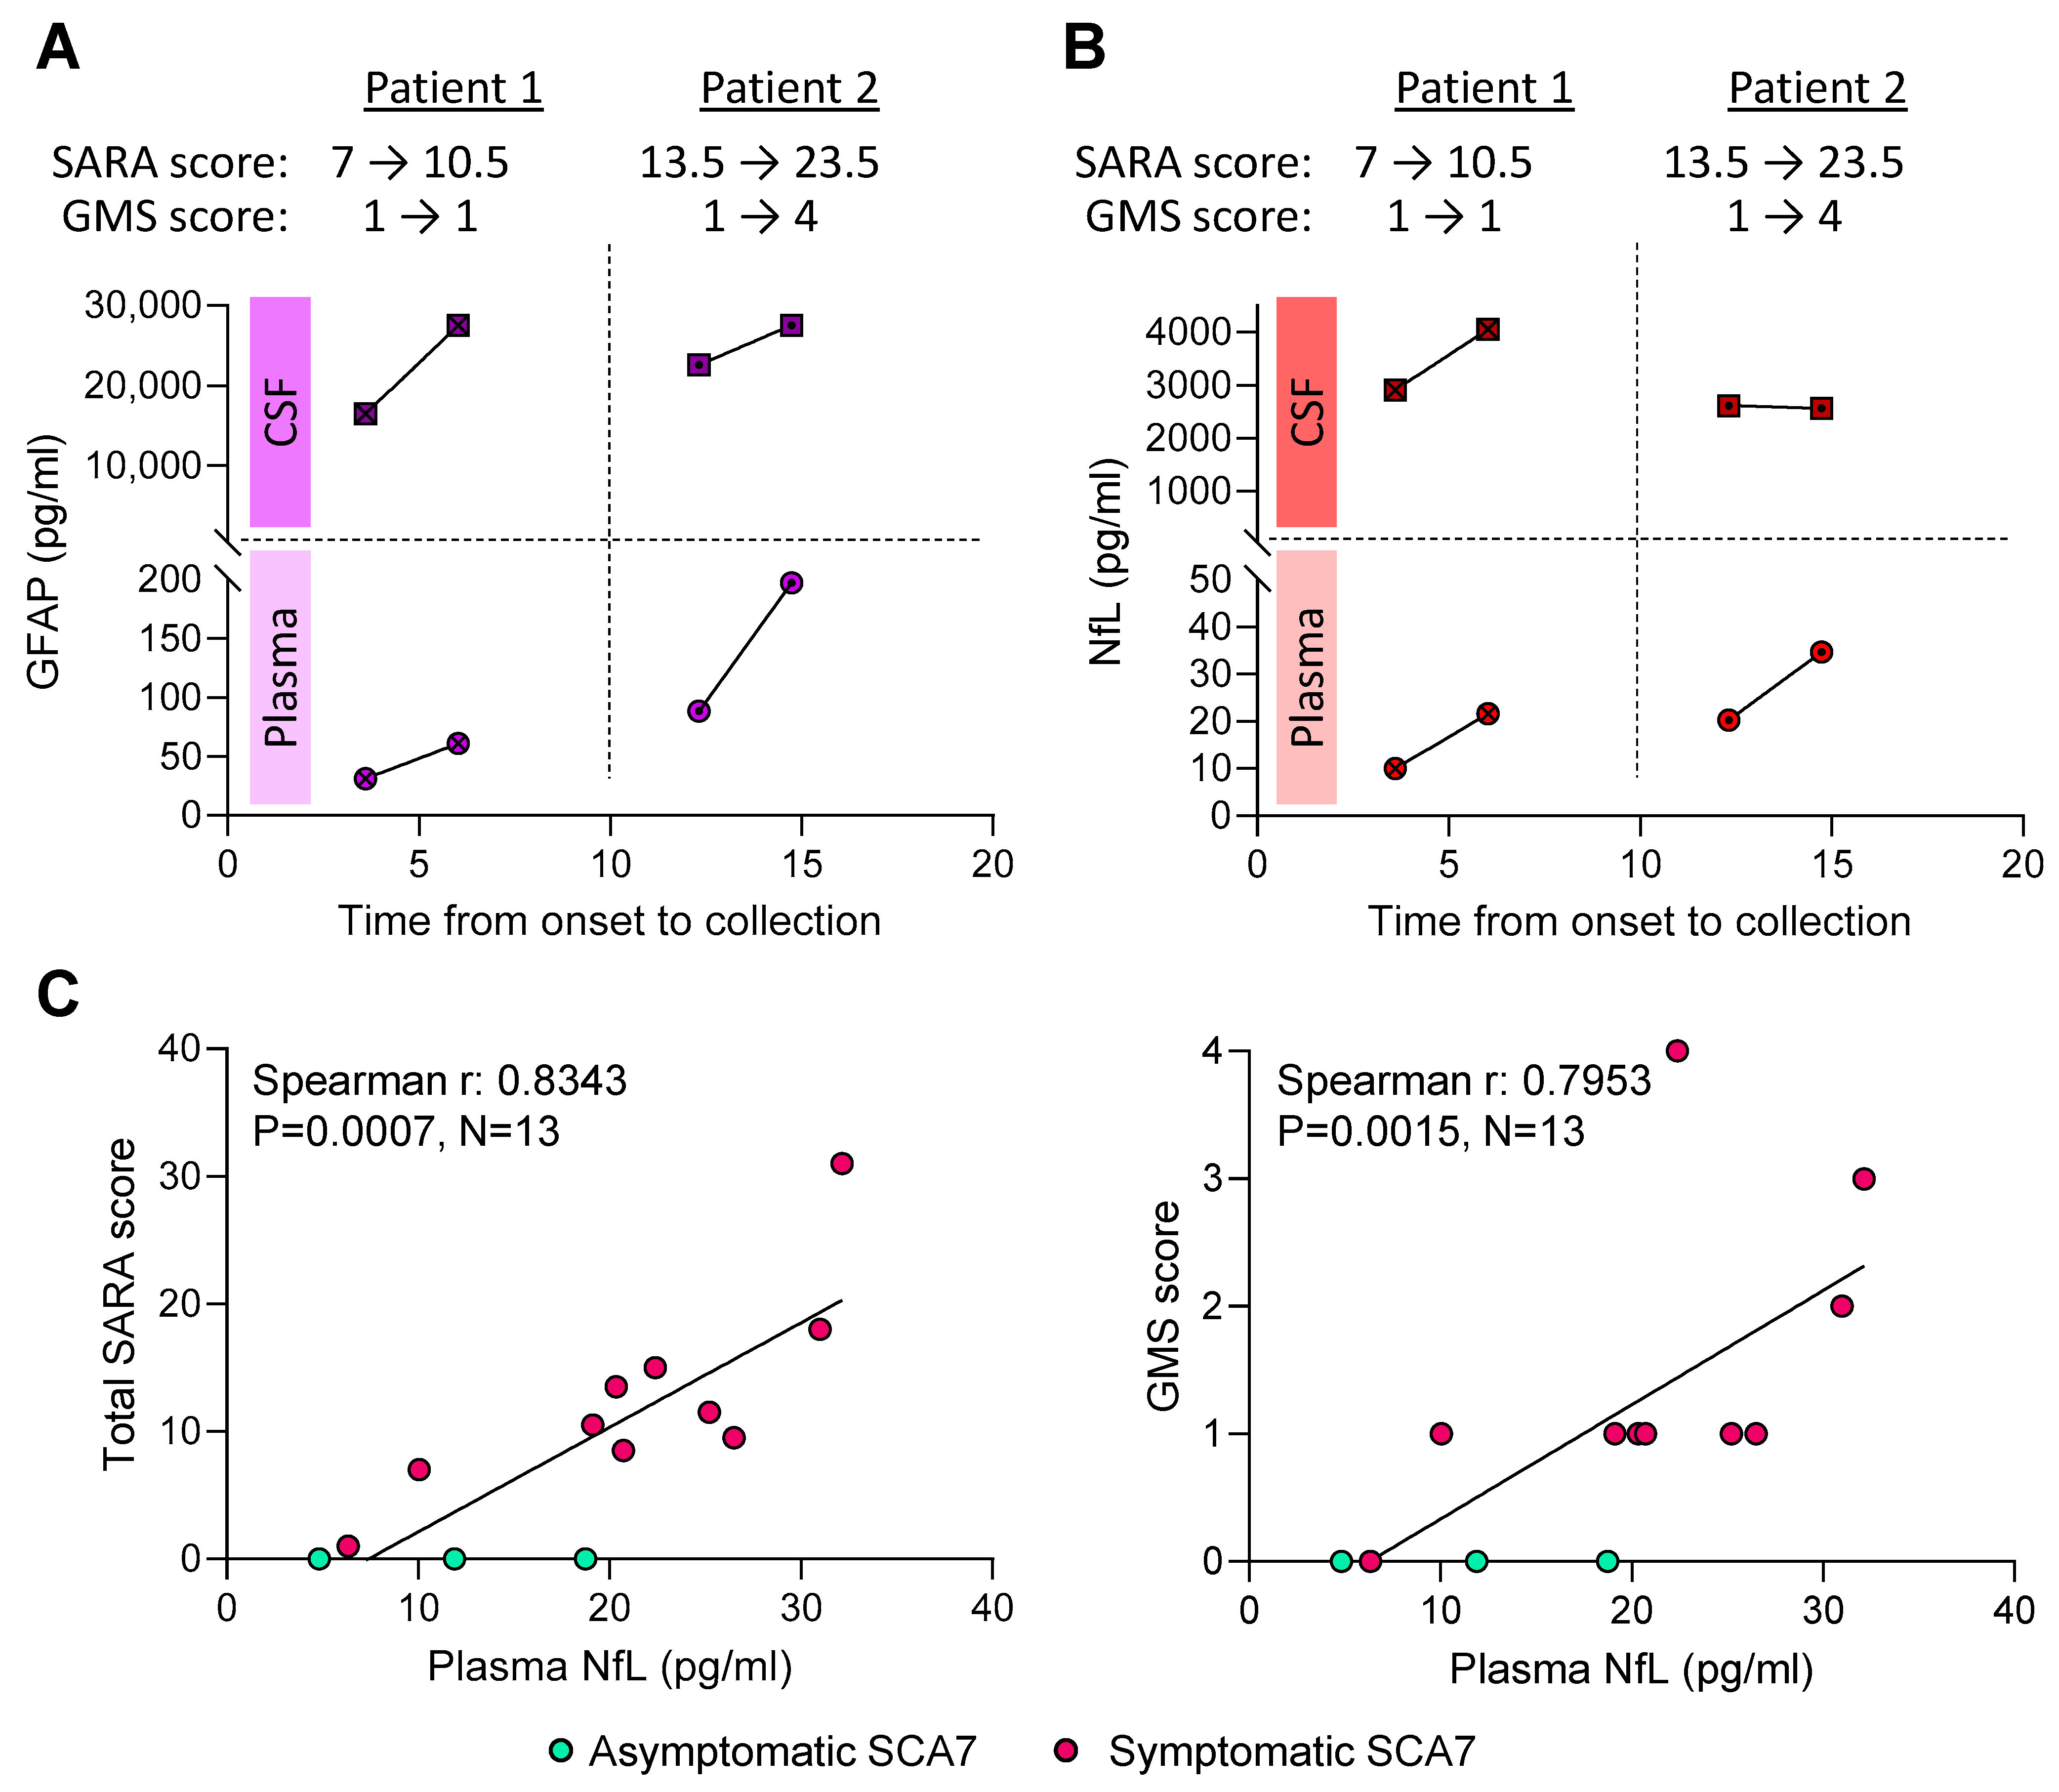
2.5. Higher Plasma NfL Levels Are Associated with Worse SARA Scores

We next evaluated whether GFAP or NfL concentrations in biofluids could inform disease progression. Two of our symptomatic SCA7 individuals reported back 29 months later for their follow-up visit, and a second sample of plasma and CSF was collected. Both patients showed worsening of symptoms, as reflected by higher SARA and unchanged GMS scores for Patient 1 and higher SARA and GMS scores for Patient 2, who was utilizing a wheelchair at follow-up (Figure 2A,B). Both GFAP (Figure 2A) and NfL (Figure 2B) levels in plasma and CSF increased with time in both patients. Moreover, Patient 2, who showed worse clinical scores than Patient 1 at the time of sample collection, also had overall higher plasma GFAP and NfL levels (Figure 2A,B). However, neither plasma nor CSF GFAP levels were associated with SARA or GMS scores (Figure S3 and Table 2). In contrast, plasma NfL was significantly associated with worse SARA scores (Spearman r: 0.8343, p = 0.0007, N = 13; Figure 2C and Table 2), even when performing linear regression analyses (β: 0.021, 95% CI: 0.008–0.035, p = 0.0048; Table 2), but trends were only observed when adjusting for sex, age, and ATXN7 CAG repeat length (β: 0.013, 95% CI: −0.003–0.029, p = 0.0932; Table 2). Similarly, GMS scores were associated with higher plasma NfL levels in the unadjusted analyses (Spearman r: 0.7953, p = 0.0015, N = 13, Figure 2C and Table 2), but significance was lost when adjusting for age, sex, and ATXN7 CAG repeat length (β: 0.074, 95% CI: −0.0042–0.191, p = 0.1784; Table 2). CSF NfL levels were not associated with either SARA or GMS scores (Figure S4 and Table 2). Overall, these data suggest that NfL levels in plasma may aid to inform disease progression in SCA7.

3. Discussion

SCA7 is characterized by the presence of a polyQ expansion in the ATXN7 protein, leading to changes in protein conformation and the formation of insoluble aggregates [45,46]. These polyQ ATXN7 aggregates interfere with different cellular processes, such as transcription, protein degradation, and glutamate transport [47]. These aggregates accumulate in the nuclear compartment of the cell and are expressed diffusely throughout the brain and various other tissues. These aggregates are thought to be toxic, leading to neuronal loss and consequent symptom development. However, the exact point at which aggregate accumulation becomes toxic remains unclear [45]. Pre-symptomatic ATXN7 mutation carriers are thus burdened with the notion of when to seek and initiate therapy to halt or prevent disease progression and maintain quality of life. This poses a major challenge for clinicians. Efforts to discover biomarkers for neurodegenerative conditions are critical to improve disease prognosis. Scientific studies aimed at uncovering molecular biomarkers and quantitatively assessing molecular indicators of disease progression are needed. Thus, we aimed to evaluate the utility of GFAP and NfL levels as biomarkers for SCA7, building on their established roles in other neurodegenerative diseases.
GFAP, a neurofilament protein expressed in astrocytes, is released in response to neuronal injury [21] and has been associated with 16 different neurological maladies [48]. GFAP concentrations in biofluids have been evaluated in SCA3, SCA1, and SCA6 with no remarkable findings [35,49,50], although increased GFAP levels were found in plasma from Friedreich’s ataxia patients [51]. Interestingly, no reports to date have investigated GFAP in patients with SCA7. We observed trends of higher GFAP levels in both plasma and CSF in patients with SCA7, along with elevated AUC values (Figure 1B) when compared to the controls. Although these results were not statistically significant, the increase in plasma GFAP in patients with SCA7 contrasts with patterns seen in other SCAs [35,49,50]. Therefore, the contribution of GFAP to SCA pathogenesis could potentially be unique to SCA7 disease pathology. Furthermore, our analysis did not reveal associations between GFAP levels and the clinical characteristics of disease progression and severity. This lack of association may largely be attributed to the small cohort size. It is conceivable that, with a larger cohort, a higher level of distinction could be elucidated.
NfL, a core constituent of axonal cytoskeleton proteins [52], has been established as a marker of axonal damage expressed solely in neurons. It provides an excellent candidate for disease prognostication and aid in assessing therapeutic efficacy [53,54]. It has been extensively investigated as a biomarker in multiple brain-related diseases, such as amyotrophic lateral sclerosis, frontotemporal dementia, Alzheimer’s disease, stroke, multiple sclerosis, and even following COVID-19 infection [29,54,55,56,57,58,59,60,61,62]. Therefore, it is not specific to a single condition. Our group previously found elevated NfL levels in plasma and CSF from patients with SCA3 but not in other SCAs [34]. Studies examining the time-dependent elevation of NfL in plasma and CSF during the disease course of various neurological conditions have shown its peek during the acute phase of the disease [56,58,63]. This suggests its potential utility in determining disease onset among asymptomatic ATXN7 mutation carriers. In this study, we observed increased NfL levels in both plasma and CSF from two patients with SCA7 from their initial visit to a 29-month follow-up, and three ATXN7 mutation carriers show high CSF NfL levels. Interestingly, plasma NfL levels increased overtime and significantly correlated with worse SARA scores, indicating its potential to inform on disease progression. The lack of association between CSF NfL and clinical scores is unclear. It is possible NfL rises in the CSF during the early stages of the disease and is then released into the bloodstream at later stages. However, our limited cohort of pre-symptomatic SCA7 cases or SCA7 patients with longitudinal collections restricts our ability to draw definitive conclusions. It is conceivable that CSF may prove to be a superior medium for identifying biomarkers that distinguish different disease states. Furthermore, NfL has been shown to be responsive to therapy. For example, in multiple sclerosis, NfL levels peek during severe relapsing episodes (as characteristic of the disease) and can be lowered following medication administration [63]. Therefore, developing therapies aimed at reducing NfL levels in SCA7 could potentially prolong the pre-ataxic stage and delay disease onset. This approach may also pave the way for future therapeutic trials.
The significance of NfL as a biomarker for SCA7 has just recently been highlighted. In a recent study, increased NfL levels were observed in 15 individuals with SCA7 [36,37,38], and our cohort of 13 ATXN7 mutation carriers validate such findings. Overall, our cohort showed slightly higher plasma NfL levels (mean: 21.38 pg/mL vs. 15.53 pg/mL [38]). However, previous studies did not include CSF, and we observed higher NfL levels compared to plasma (median SCA7 plasma: 21.6 pg/mL vs. median SCA7 CSF: 2615 pg/mL). More importantly, while previous studies showed increased SARA scores at 1-year follow-up concomitant with decreases in volume loss, they were not able to detect longitudinal changes in NfL [38]. This suggests that CSF may be more sensitive to alterations and could potentially detect changes earlier than in blood. In fact, previous evidence suggests that CSF measurements offer greater sensitivity for detecting NfL than blood [64]. Additionally, increased NfL levels have been observed in CSF, but not in blood, during preclinical stages of other neurodegenerative diseases [65]. Importantly, CSF NfL may provide a more direct measure of central nervous system neuroaxonal injury, whereas blood NfL measurements can be affected by other factors such as kidney function [66], body mass index, and blood volumes [67], among others.
Our study shows increases in both GFAP and NfL at 29 months following first visit for two study participants, where SARA scores increased at a rate of 1.4 (Patient 1) or 4.1 (Patient 2) points/year. Our more significant findings may be explained by the more advanced clinical state of our patients at the time of sample collection, as demonstrated by an earlier median age of onset (30 vs. 36 years [38]) and a lower proportion of pre-ataxic/asymptomatic SCA7 individuals in our cohort (N = 3/13), compared to a previous study (N = 9/15 [38]). Fundamentally, we observed a strong correlation between plasma NfL levels and SARA scores, suggesting that NfL may be indicative of disease progression. Our studies, along with previous findings [38], emphasize the importance of measuring NfL to better understand disease progression and enhance the effectiveness of clinical trials for SCA7. A limitation of our studies stems from the rarity of this condition globally and the challenges associated with collecting human biofluids such as CSF. Nonetheless, we present the largest cohort of symptomatic SCA7 in biomarker studies reported to date, and further support NfL, and potentially GFAP, as biomarkers to inform on disease status, progression, and clinical trial efficacy in SCA7.

4. Materials and Methods

4.1. Standard Protocol Approvals, Registrations, and Patient Consents

Informed consent was obtained according to standard protocols approved by the Mayo Clinic Institutional Review Board (IRB) ethics committee (IRB 16-009414) and Mayo Clinic IRB approved material transfer agreement between Mayo Clinic and the collaborative institution in Poland. Patients were evaluated by movement disorder specialists (Z.K.W., J.D., J.S.) at Mayo Clinic Florida and Medical University of Gdansk. SCA7 participants originated from Mexico, Poland, Spain, and the United States. The healthy control participants originated from Brazil, Mexico, and the United States, and were confirmed to be negative for the ATXN7 CAG repeat expansion. All study participants underwent neurological evaluations for the assessment and rating of ataxia (SARA) [40] and gait mobility scale (GMS) [34].

4.2. Sample Collection and Preparation

We collected whole-blood, CSF, and/or plasma samples from 3 asymptomatic ATXN7 mutation carriers and 10 symptomatic SCA7 patients between 2020 and 2023 and from 8 age- and sex-matched healthy controls from 2018 to 2022 (Table 1). Demographic information, as well as clinical data, was recorded for every participant at each visit (i.e., age at sample collection, age of symptom onset, and SARA and GMS scores). Blood and plasma samples were obtained from all 21 participants, and CSF samples were collected from 18 participants. All samples were collected according to standard protocols and procedures at Mayo Clinic Florida and Medical University of Gdansk. Samples were placed on ice immediately following collection and processed within 30 min. Blood and plasma samples were collected during the same visits as the lumbar punctures, where CSF was collected into polypropylene tubes. Samples were centrifuged at 4 °C for 15 min at two different speeds depending on the sample type: 2465 g (plasma) and 453 g (CSF). The supernatant was then aliquoted into 200 µL volumes and stored at −80 °C. Blood samples were divided into 2 mL aliquots for DNA extraction.

4.3. GFAP and NfL Immunoassays

Both GFAP and NfL were measured on the Simoa® HD-1 analyzer using the Simoa® HD-1 Human Neurology 2-Plex immunoassay for GFAP and NfL (Quanterix, Billerica, MA, USA). Assays were performed by trained personnel. Plasma samples were run at a 4x dilution and CSF was diluted 1:40, as recommended by the manufacturer. Each measurement was performed in duplicate by a technician that was blinded to the identity of the samples. The mean of both measurements was provided along with the percent coefficient of variation (%CV). All measurements showed a CV ≤ 20%.

4.4. Genomic DNA Extraction

DNA was extracted from whole blood using the Gentra Puregene Kit (Qiagen, Germantown, MD, USA), according to manufacturer’s instructions, with some modifications. All steps were performed at room temperature. Briefly, 2 mL of whole blood was combined with 6 mL of RBC solution in 15 mL conical bottom centrifuge tubes, incubated for 10 min, and centrifuged at 2000 g for 5 min. The supernatant was discarded, and the resulting pellet was resuspended and lysed with 2 mL of Cell Lysis solution, mixed gently, and incubated on a rocking or rotating platform for five minutes or until the solution was completely homogenized. Then, 0.7 mL of Protein Precipitation solution was added, vortexed for 20 s, and centrifuged at 2000 g for 5 min. The resulting supernatant was transferred to a new tube containing 3 mL of ice-cold 100% isopropanol and 30 μL of 3 M sodium acetate pH 5.2 (Teknova, Hollister, CA, USA). Next, the sample was mixed by gently inverting the tube 25–50 times until strands or clumps of DNA were revealed. Tubes were incubated 20 min at room temperature or overnight at −20 °C. Samples were centrifuged for 3 min at 2000 g, and the supernatant was carefully discarded. Using 0.5 mL of 70% ethanol, the cell pellet was transferred to a DNase RNase free 1.5 mL tube containing 0.7 mL of 70% ethanol and centrifuged at 13,000 g for 5 min. Subsequently, the supernatant was discarded, and the resulting DNA pellet was allowed to air-dry by inverting the tube or turning it sideways for no more than 15 min. DNA was finally resuspended in 50–200 μL (based on the size of the pellet) Tris low EDTA suspension buffer (10mM Tris-HCL, 0.1mM EDTA, pH 8.0; Teknova, Hollister, CA, USA), followed by incubation at 65 °C for 10–90 min on a Bioshake (QINSTRUMENTS, Jena, Germany) at 1000 rpm followed by 1–2 h at 55 °C. DNA was stored when three consistent concentrations, measured by Nanodrop, were observed and 260/230 was ≥2.0.

4.5. Repeat Expansion Assessment Using a Research Lab-Based Assay from Genomic DNA

CAG repeat expansion genotypic analysis in the ATXN7 gene was performed for all individuals (mutation carriers and the healthy controls). To assess the length of the CAG repeat expansion, genomic DNA from the patients and controls was amplified using Apex Taq DNA polymerase (Genesee, Rochester, NY, USA) and the following primers: 5′-/FAM/TCGGAGCGGGCCGCGGATGAC-3′ and 5′-CACGACTGTCCCAGCATCACTT-3′ [68]. A touchdown PCR program (3 min 95 °C; 10 cycles of 15 s 95 °C, 15 s 60 °C decreasing 1 °C per cycle, 15 s 72 °C; 25 cycles 15 s 95 °C, 15 s 50 °C, 15 s 72 °C; and 10 min 72 °C; 4 °C) was used. PCR products were diluted, combined with GeneScan 500 LIZ dye Size Standard (Fisher, Plano, TX, USA), and analyzed for size on the ABI 3730 Genetic Analyzer. The GeneMapper™ 4.0 Software (Applied Biosystems, Foster City, CA, USA) was used to determine the allelic repeat size.

4.6. Statistical Analyses

Statistical analyses were performed using GraphPad Prism 9.5.0. Differences between study groups were assessed by non-parametric Kruskal–Wallis test, followed by Dunn’s multiple comparison tests. To illustrate and evaluate the associations between NfL or GFAP concentrations and clinical scores, we performed Spearman correlations. Multilinear regression models were also used to evaluate the associations of each biomarker with clinical scores after logarithmically transforming the biomarker data, where confounding variables were included in the adjusted models to account for the potential effects of age, sex, and ATXN7 CAG repeat length, as indicated. To further determine whether GFAP or NfL can discriminate between the different study groups in our cohort, we performed receiver operator characteristic curves to generate the area under the curve (AUC). An AUC of 0.5 corresponds to a predictive ability equal to that of chance, while an AUC of 1.0 represents a perfect predictive ability. p values were considered significant when <0.05 (Kruskal–Wallis, Spearman, AUC analyses) or <0.025 (multilinear regression analyses).

Supplementary Materials

The following supporting information can be downloaded at: https://www.mdpi.com/article/10.3390/ijms26115070/s1.

Author Contributions

Conceptualization, L.P., Z.K.W. and M.P.; methodology, R.H.A.-S., K.J.-W., T.F.G. and M.P.; formal analysis, R.H.A.-S., K.J.-W., T.F.G. and M.P., investigation, R.H.A.-S., K.J.-W., T.F.G. and M.P.; resources, R.H.A.-S., K.J.-W., A.S., Z.P., J.A.D., Y.S., T.F.G., J.C.G., H.A.G.T., J.D., J.S., L.P., Z.K.W. and M.P.; data curation, R.H.A.-S., K.J.-W., A.S., Z.P., T.F.G. and M.P.; writing—original draft preparation, R.H.A.-S., K.J.-W., T.F.G. and M.P.; writing—review and editing, R.H.A.-S., K.J.-W., A.S., Z.P., J.A.D., Y.S., T.F.G., J.C.G., H.A.G.T., J.D., J.S., L.P., Z.K.W. and M.P.; visualization, R.H.A.-S. and M.P.; supervision, Z.K.W., L.P., T.F.G. and M.P.; funding acquisition, Z.K.W., L.P. and M.P. All authors have read and agreed to the published version of the manuscript.

Funding

The study was supported by a gift from the Donald G. and Jodi P. Heeringa Family. This work was supported by the National Institutes of Health [(R01NS120992: M.P.), (U54NS123743: L.P. and M.P.), (R35NS097273: L.P.)], the Target ALS Foundation (M.P., and L.P.), BrightFocus Foundation (M.P.), and the Robert Packard Center for ALS Research at Johns Hopkins (L.P.). Z.K.W. is partially supported by the NIH/NIA and NIH/NINDS (1U19AG063911, FAIN: U19AG063911), the Haworth Family Professorship in Neurodegenerative Diseases fund, The Albertson Parkinson’s Research Foundation, PPND Family Foundation, and Margaret N. and John Wilchek Family. J. Dulski is partially supported by the Haworth Family Professorship in Neurodegenerative Diseases fund (90052067) and receives a “Scholarship for Outstanding Young Scientists” from the Polish Minister of Science (SMN/19/1279/2023).

Institutional Review Board Statement

Informed consent was obtained according to standard protocols approved by the Mayo Clinic Institutional Review Board (IRB) ethics committee (IRB 16-009414, 5/24/2017) and Mayo Clinic IRB approved material transfer agreement between Mayo Clinic and the collaborative institution in Poland.

Informed Consent Statement

Informed consent was obtained from all subjects or the next of kin involved in the study.

Data Availability Statement

All the data pertinent in this study are included in the figures, tables, and Supplementary Material.

Acknowledgments

We would like to thank our patients and their families for their participation in this study. We thank Martha Garcia from the Mayo Clinic International Business office in Mexico City, Mexico, for her invaluable assistance with some logistics of this study. This is study was also possible thanks to the generosity of the Donald G. and Jodi P. Heeringa Family.

Conflicts of Interest

Z.K.W. is partially supported by the NIH/NIA and NIH/NINDS (1U19AG063911, FAIN: U19AG063911), gifts from the Donald G. and Jodi P. Heeringa Family, the Haworth Family Professorship in Neurodegenerative Diseases fund, The Albertson Parkinson’s Research Foundation, PPND Family Foundation, and Margaret N. and John Wilchek Family. He serves as PI or Co-PI on Biohaven Pharmaceuticals, Inc. (BHV4157-206), Vigil Neuroscience, Inc. (VGL101-01.002, VGL101-01.201, Csf1r biomarker and repository project, and ultra-high field MRI in the diagnosis and management of CSF1R-related adult-onset leukoencephalopathy with axonal spheroids and pigmented glia), ONO-2808-03, and Amylyx AMX0035-009 projects/grants. He serves as Co-PI of the Mayo Clinic APDA Center for Advanced Research and as an external advisory board member for the Vigil Neuroscience, Inc., and as a consultant for Eli Lilly & Company and for NovoGlia, Inc. J. Dulski is partially supported by the Polish Minister of Science (Scholarship for Outstanding Young Scientists, SMN/19/1279/2023), and the Haworth Family Professorship in Neurodegenerative Diseases fund (90052067). He serves as an editorial board member of Neurologia i Neurochirurgia Polska. He received speakers’ bureau honoraria from VM Media Ltd., Radosław Lipiński 90 Consulting, Ipsen. He received compensation for providing consultancy work for Clinigma ApS. He has intellectual property rights for “Application of Hydrogen Peroxide and 17β -Estradiol and its Metabolites as Biomarkers in a Method of Diagnosing Neurodegenerative Diseases In Vitro” (WO/2023/234790). The remaining authors declare that the research was conducted in the absence of any commercial or financial relationships that could be construed as a potential conflict of interest.

Abbreviations

The following abbreviations are used in this manuscript:
AUCArea under the curve
ATXN7Ataxin 7
CAGCytosine–adenine–guanine
CVCoefficient of variation
CSFCerebrospinal fluid
GMSGait mobility scale
GFAPGlial fibrillary acidic protein
IRBInstitutional Review Board
NfLNeurofilament light
SARAScale for the assessment and rating of ataxia
STAGASPT3-TAFII31-GCN5L acetylase
SCA7Spinocerebellar ataxia type 7

References

  1. Fujioka, S.; Sundal, C.; Wszolek, Z.K. Autosomal dominant cerebellar ataxia type III: A review of the phenotypic and genotypic characteristics. Orphanet. J. Rare Dis. 2013, 8, 14. [Google Scholar] [CrossRef] [PubMed]
  2. Whaley, N.R.; Fujioka, S.; Wszolek, Z.K. Autosomal dominant cerebellar ataxia type I: A review of the phenotypic and genotypic characteristics. Orphanet. J. Rare Dis. 2011, 6, 33. [Google Scholar] [CrossRef] [PubMed]
  3. La Spada, A.R. Spinocerebellar Ataxia Type 7. In GeneReviews ((R)); Adam, M.P., Feldman, J., Mirzaa, G.M., Pagon, R.A., Wallace, S.E., Amemiya, A., Eds.; University of Washington: Seattle, WA, USA, 1993. [Google Scholar]
  4. Cerecedo-Zapata, C.M.; Tapia-Guerrero, Y.S.; Ramírez-González, J.A.; Meza-Dorantes, A.; Tercero-Pérez, K.N.; Cortés, H.; Guerra-Grajeda, A.; Ortega-Ibarra, I.H.; Gatica-Ramos, G.; Poblete-Velazquez, A.; et al. Current Overview of Spinocerebellar Ataxia Type 7 in Mexican Population: Challenges in Specialized Care for a Rare Disease. Int. J. Mol. Sci. 2024, 25, 10750. [Google Scholar] [CrossRef]
  5. Rodríguez-Labrada, R.; Martins, A.C.; Magaña, J.J.; Vazquez-Mojena, Y.; Medrano-Montero, J.; Fernandez-Ruíz, J.; Cisneros, B.; Teive, H.; McFarland, K.N.; Saraiva-Pereira, M.L.; et al. Founder Effects of Spinocerebellar Ataxias in the American Continents and the Caribbean. Cerebellum 2020, 19, 446–458. [Google Scholar] [CrossRef]
  6. Smith, D.C.; Bryer, A.; Watson, L.M.; Greenberg, L.J. Inherited polyglutamine spinocerebellar ataxias in South Africa. S. Afr. Med. J. 2012, 102, 683–686. [Google Scholar] [CrossRef]
  7. Smith, D.C.; Greenberg, L.J.; Bryer, A. The hereditary ataxias: Where are we now? Four decades of local research. S. Afr. Med. J. 2016, 106, S38–S41. [Google Scholar]
  8. Magaña, J.J.; Gómez, R.; Maldonado-Rodríguez, M.; Velázquez-Pérez, L.; Tapia-Guerrero, Y.S.; Cortés, H.; Leyva-García, N.; Hernández-Hernández, O.; Cisneros, B. Origin of the spinocerebellar ataxia type 7 gene mutation in Mexican population. Cerebellum 2013, 12, 902–905. [Google Scholar] [CrossRef]
  9. Paradisi, I.; Ikonomu, V.; Arias, S. Spinocerebellar ataxias in Venezuela: Genetic epidemiology and their most likely ethnic descent. J. Hum. Genet. 2016, 61, 215–222. [Google Scholar] [CrossRef] [PubMed]
  10. Michalík, A.; Del-Favero, J.; Mauger, C.; Löfgren, A.; Van Broeckhoven, C. Genomic organisation of the spinocerebellar ataxia type 7 (SCA7) gene responsible for autosomal dominant cerebellar ataxia with retinal degeneration. Hum. Genet. 1999, 105, 410–417. [Google Scholar] [CrossRef]
  11. David, G.; Abbas, N.; Stevanin, G.; Dürr, A.; Yvert, G.; Cancel, G.; Weber, C.; Imbert, G.; Saudou, F.; Antoniou, E.; et al. Cloning of the SCA7 gene reveals a highly unstable CAG repeat expansion. Nat. Genet. 1997, 17, 65–70. [Google Scholar] [CrossRef]
  12. Paulson, H. Repeat expansion diseases. Handb. Clin. Neurol. 2018, 147, 105–123. [Google Scholar] [PubMed]
  13. Bonsor, M.; Ammar, O.; Schnoegl, S.; Wanker, E.E.; Ramos, E.S. Polyglutamine disease proteins: Commonalities and differences in interaction profiles and pathological effects. Proteomics 2024, 24, e2300114. [Google Scholar] [CrossRef] [PubMed]
  14. Atadzhanov, M.; Smith, D.C.; Mwaba, M.H.; Siddiqi, O.K.; Bryer, A.; Greenberg, L.J. Clinical and genetic analysis of spinocerebellar ataxia type 7 (SCA7) in Zambian families. Cerebellum Ataxias 2017, 4, 17. [Google Scholar] [CrossRef] [PubMed]
  15. Bah, M.G.; Rodriguez, D.; Cazeneuve, C.; Mochel, F.; Devos, D.; Suppiej, A.; Roubertie, A.; Meunier, I.; Gitiaux, C.; Curie, A.; et al. Deciphering the natural history of SCA7 in children. Eur. J. Neurol. 2020, 27, 2267–2276. [Google Scholar] [CrossRef]
  16. To, K.W.; Adamian, M.; Jakobiec, F.A.; Berson, E.L. Olivopontocerebellar atrophy with retinal degeneration. An electroretinographic and histopathologic investigation. Ophthalmology 1993, 100, 15–23. [Google Scholar] [CrossRef]
  17. Aleman, T.S.; Cideciyan, A.V.; Volpe, N.J.; Stevanin, G.; Brice, A.; Jacobson, S.G. Spinocerebellar ataxia type 7 (SCA7) shows a cone-rod dystrophy phenotype. Exp. Eye Res. 2002, 74, 737–745. [Google Scholar] [CrossRef]
  18. Ahn, J.K.; Seo, J.-M.; Chung, H.; Yu, H.G. Anatomical and functional characteristics in atrophic maculopathy associated with spinocerebellar ataxia type 7. Am. J. Ophthalmol. 2005, 139, 923–925. [Google Scholar] [CrossRef]
  19. Velázquez-Pérez, L.; Cerecedo-Zapata, C.M.; Hernández-Hernández, O.; Martínez-Cruz, E.; Tapia-Guerrero, Y.S.; González-Piña, R.; Salas-Vargas, J.; Rodríguez-Labrada, R.; Gurrola-Betancourth, R.; Leyva-García, N.; et al. A comprehensive clinical and genetic study of a large Mexican population with spinocerebellar ataxia type 7. Neurogenetics 2015, 16, 11–21. [Google Scholar] [CrossRef]
  20. Chatterjee, P.; Pedrini, S.; Stoops, E.; Goozee, K.; Villemagne, V.L.; Asih, P.R.; Verberk, I.M.W.; Dave, P.; Taddei, K.; Sohrabi, H.R.; et al. Plasma glial fibrillary acidic protein is elevated in cognitively normal older adults at risk of Alzheimer’s disease. Transl. Psychiatry 2021, 11, 27. [Google Scholar] [CrossRef]
  21. Abdelhak, A.; Foschi, M.; Abu-Rumeileh, S.; Yue, J.K.; D’anna, L.; Huss, A.; Oeckl, P.; Ludolph, A.C.; Kuhle, J.; Petzold, A.; et al. Blood GFAP as an emerging biomarker in brain and spinal cord disorders. Nat. Rev. Neurol. 2022, 18, 158–172. [Google Scholar] [CrossRef]
  22. Ganne, A.; Balasubramaniam, M.; Griffin, W.S.T.; Reis, R.J.S.; Ayyadevara, S. Glial Fibrillary Acidic Protein: A Biomarker and Drug Target for Alzheimer’s Disease. Pharmaceutics 2022, 14, 1354. [Google Scholar] [CrossRef] [PubMed]
  23. Chatterjee, P.; Pedrini, S.; Ashton, N.J.; Tegg, M.; Goozee, K.; Singh, A.K.; Karikari, T.K.; Simrén, J.; Vanmechelen, E.; Armstrong, N.J.; et al. Diagnostic and prognostic plasma biomarkers for preclinical Alzheimer’s disease. Alzheimers Dement. 2022, 18, 1141–1154. [Google Scholar] [CrossRef]
  24. Aamodt, W.W.; Waligorska, T.; Shen, J.; Tropea, T.F.; Siderowf, A.; Weintraub, D.; Grossman, M.; Irwin, D.; Wolk, D.A.; Xie, S.X.; et al. Neurofilament Light Chain as a Biomarker for Cognitive Decline in Parkinson Disease. Mov. Disord. 2021, 36, 2945–2950. [Google Scholar] [CrossRef]
  25. Pareyson, D.; Shy, M.E. Neurofilament light, biomarkers, and Charcot-Marie-Tooth disease. Neurology 2018, 90, 257–259. [Google Scholar] [CrossRef]
  26. Benkert, P.; Meier, S.; Schaedelin, S.; Manouchehrinia, A.; Yaldizli, Ö.; Maceski, A.; Oechtering, J.; Achtnichts, L.; Conen, D.; Derfuss, T.; et al. Serum neurofilament light chain for individual prognostication of disease activity in people with multiple sclerosis: A retrospective modelling and validation study. Lancet Neurol. 2022, 21, 246–257. [Google Scholar] [CrossRef] [PubMed]
  27. Graham, N.S.N.; Zimmerman, K.A.; Moro, F.; Heslegrave, A.; Maillard, S.A.; Bernini, A.; Miroz, J.-P.; Donat, C.K.; Lopez, M.Y.; Bourke, N.; et al. Axonal marker neurofilament light predicts long-term outcomes and progressive neurodegeneration after traumatic brain injury. Sci. Transl. Med. 2021, 13, eabg9922. [Google Scholar] [CrossRef]
  28. Chelban, V.; Nikram, E.; Perez-Soriano, A.; Wilke, C.; Foubert-Samier, A.; Vijiaratnam, N.; Guo, T.; Jabbari, E.; Olufodun, S.; Gonzalez, M.; et al. Neurofilament light levels predict clinical progression and death in multiple system atrophy. Brain 2022, 145, 4398–4408. [Google Scholar] [CrossRef]
  29. Gendron, T.F.; Heckman, M.G.; White, L.J.; Veire, A.M.; Pedraza, O.; Burch, A.R.; Bozoki, A.C.; Dickerson, B.C.; Domoto-Reilly, K.; Foroud, T.; et al. Comprehensive cross-sectional and longitudinal analyses of plasma neurofilament light across FTD spectrum disorders. Cell Rep. Med. 2022, 3, 100607. [Google Scholar] [CrossRef] [PubMed]
  30. Wilke, C.; Bender, F.; Hayer, S.N.; Brockmann, K.; Schöls, L.; Kuhle, J.; Synofzik, M. Serum neurofilament light is increased in multiple system atrophy of cerebellar type and in repeat-expansion spinocerebellar ataxias: A pilot study. J. Neurol. 2018, 265, 1618–1624. [Google Scholar] [CrossRef]
  31. Wilke, C.; Haas, E.; Reetz, K.; Faber, J.; Garcia-Moreno, H.; Santana, M.M.; van de Warrenburg, B.; Hengel, H.; Lima, M.; Filla, A.; et al. Neurofilaments in spinocerebellar ataxia type 3: Blood biomarkers at the preataxic and ataxic stage in humans and mice. EMBO Mol. Med. 2020, 12, e11803. [Google Scholar] [CrossRef]
  32. Peng, L.; Wang, S.; Chen, Z.; Peng, Y.; Wang, C.; Long, Z.; Peng, H.; Shi, Y.; Hou, X.; Lei, L.; et al. Blood Neurofilament Light Chain in Genetic Ataxia: A Meta-Analysis. Mov. Disord. 2022, 37, 171–181. [Google Scholar] [CrossRef] [PubMed]
  33. Koike, Y.; Jansen-West, K.R.; Al-Shaikh, R.H.; Carlomagno, Y.; Song, Y.; Dunmore, J.A.; LeDoux, M.S.; Friedman, J.H.; Pena, A.B.; Uitti, R.J.; et al. Urine levels of the polyglutamine ataxin-3 protein are elevated in patients with spinocerebellar ataxia type 3. Parkinsonism Relat. Disord. 2021, 89, 151–154. [Google Scholar] [CrossRef]
  34. Prudencio, M.; Garcia-Moreno, H.; Jansen-West, K.R.; Al-Shaikh, R.H.; Gendron, T.F.; Heckman, M.G.; Spiegel, M.R.; Carlomagno, Y.; Daughrity, L.M.; Song, Y.; et al. Toward allele-specific targeting therapy and pharmacodynamic marker for spinocerebellar ataxia type 3. Sci. Transl. Med. 2020, 12, eabb7086. [Google Scholar] [CrossRef]
  35. Garcia-Moreno, H.; Prudencio, M.; Thomas-Black, G.; Solanky, N.; Jansen-West, K.R.; Al-Shaikh, R.H.; Heslegrave, A.; Zetterberg, H.; Santana, M.M.; de Almeida, L.P.; et al. Tau and neurofilament light-chain as fluid biomarkers in spinocerebellar ataxia type 3. Eur. J. Neurol. 2022, 29, 2439–2452. [Google Scholar] [CrossRef]
  36. Coarelli, G.; Darios, F.; Petit, E.; Dorgham, K.; Adanyeguh, I.; Petit, E.; Brice, A.; Mochel, F.; Durr, A. Plasma neurofilament light chain predicts cerebellar atrophy and clinical progression in spinocerebellar ataxia. Neurobiol. Dis. 2021, 153, 105311. [Google Scholar] [CrossRef] [PubMed]
  37. Nassisi, M.; Coarelli, G.; Blanchard, B.; Dubec-Fleury, C.; Drine, K.; Kitic, N.; Sancho, S.; Hilab, R.; du Montcel, S.T.; Junge, C.; et al. ATXN7-Related Cone-Rod Dystrophy: The Integrated Functional Evaluation of the Cerebellum (CERMOI) Study. JAMA Ophthalmol. 2024, 142, 301–308. [Google Scholar] [CrossRef]
  38. Coarelli, G.; Dubec-Fleury, C.; Petit, E.; Sayah, S.; Fischer, C.; Nassisi, M.; Gatignol, P.; Dorgham, K.; Daghsen, L.; Daye, P.; et al. Longitudinal Changes of Clinical, Imaging, and Fluid Biomarkers in Preataxic and Early Ataxic Spinocerebellar Ataxia Type 2 and 7 Carriers. Neurology 2024, 103, e209749. [Google Scholar] [CrossRef]
  39. Dulski, J.; Al-Shaikh, R.H.; Prudencio, M.; Petrucelli, L.; Sulek, A.; Bernatowicz, K.; Sławek, J.; Wszolek, Z.K. First families with spinocerebellar ataxia type 7 in Poland. Neurol. Neurochir. Pol. 2023, 57, 310–313. [Google Scholar] [CrossRef] [PubMed]
  40. Schmitz-Hubsch, T.; Du Montcel, S.T.; Baliko, L.; Berciano, J.; Boesch, S.; Depondt, C.; Giunti, P.; Globas, C.; Infante, J.; Kang, J.S.; et al. Scale for the assessment and rating of ataxia: Development of a new clinical scale. Neurology 2006, 66, 1717–1720. [Google Scholar] [CrossRef]
  41. Chirino, A.; Hernandez-Castillo, C.R.; Galvez, V.; Contreras, A.; Diaz, R.; Beltran-Parrazal, L.; Fernandez-Ruiz, J. Motor and cognitive impairments in spinocerebellar ataxia type 7 and its correlations with cortical volumes. Eur. J. Neurosci. 2018, 48, 3199–3211. [Google Scholar] [CrossRef]
  42. Giunti, P.; Stevanin, G.; Worth, P.; David, G.; Brice, A.; Wood, N. Molecular and clinical study of 18 families with ADCA type II: Evidence for genetic heterogeneity and de novo mutation. Am. J. Hum. Genet. 1999, 64, 1594–1603. [Google Scholar] [CrossRef] [PubMed]
  43. Mollenhauer, B.; Dakna, M.; Kruse, N.; Galasko, D.; Foroud, T.; Zetterberg, H.; Schade, S.; Gera, R.G.; Wang, W.; Gao, F.; et al. Validation of Serum Neurofilament Light Chain as a Biomarker of Parkinson’s Disease Progression. Mov. Disord. 2020, 35, 1999–2008. [Google Scholar] [CrossRef]
  44. Buhmann, C.; Magnus, T.; Choe, C.-U. Blood neurofilament light chain in Parkinson’s disease. J. Neural Transm. 2023, 130, 755–762. [Google Scholar] [CrossRef]
  45. Paulson, H.L.; Bonini, N.M.; Roth, K.A. Polyglutamine disease and neuronal cell death. Proc. Natl. Acad. Sci. USA 2000, 97, 12957–12958. [Google Scholar] [CrossRef] [PubMed]
  46. Ross, C.A. Intranuclear neuronal inclusions: A common pathogenic mechanism for glutamine-repeat neurodegenerative diseases? Neuron 1997, 19, 1147–1150. [Google Scholar] [CrossRef] [PubMed]
  47. orres-Ramos, Y.; Montoya-Estrada, A.; Cisneros, B.; Tercero-Pérez, K.; León-Reyes, G.; Leyva-García, N.; Hernández-Hernández, O.; Magaña, J.J. Oxidative Stress in Spinocerebellar Ataxia Type 7 Is Associated with Disease Severity. Cerebellum 2018, 17, 601–609. [Google Scholar] [CrossRef]
  48. Heimfarth, L.; Passos, F.R.S.; Monteiro, B.S.; Araújo, A.A.d.S.; Júnior, L.J.Q.; Quintans, J.d.S.S. Serum glial fibrillary acidic protein is a body fluid biomarker: A valuable prognostic for neurological disease—A systematic review. Int. Immunopharmacol. 2022, 107, 108624. [Google Scholar] [CrossRef]
  49. Brouillette, A.M.; Öz, G.; Gomez, C.M. Cerebrospinal Fluid Biomarkers in Spinocerebellar Ataxia: A Pilot Study. Dis. Markers 2015, 2015, 413098. [Google Scholar] [CrossRef]
  50. Öz, G.; Hutter, D.; Tkáč, I.; Clark, H.B.; Gross, M.D.; Jiang, H.; Eberly, L.E.; Bushara, K.O.; Gomez, C.M. Neurochemical alterations in spinocerebellar ataxia type 1 and their correlations with clinical status. Mov. Disord. 2010, 25, 1253–1261. [Google Scholar] [CrossRef]
  51. Zeitlberger, A.M.; Thomas-Black, G.; Garcia-Moreno, H.; Foiani, M.; Heslegrave, A.J.; Zetterberg, H.; Giunti, P. Plasma Markers of Neurodegeneration Are Raised in Friedreich’s Ataxia. Front. Cell. Neurosci. 2018, 12, 366. [Google Scholar] [CrossRef]
  52. Petzold, A. Neurofilament phosphoforms: Surrogate markers for axonal injury, degeneration and loss. J. Neurol. Sci. 2005, 233, 183–198. [Google Scholar] [CrossRef] [PubMed]
  53. Khalil, M.; Teunissen, C.E.; Otto, M.; Piehl, F.; Sormani, M.P.; Gattringer, T.; Barro, C.; Kappos, L.; Comabella, M.; Fazekas, F.; et al. Neurofilaments as biomarkers in neurological disorders. Nat. Rev. Neurol. 2018, 14, 577–589. [Google Scholar] [CrossRef] [PubMed]
  54. Gaiottino, J.; Norgren, N.; Dobson, R.; Topping, J.; Nissim, A.; Malaspina, A.; Bestwick, J.P.; Monsch, A.U.; Regeniter, A.; Lindberg, R.L.; et al. Increased neurofilament light chain blood levels in neurodegenerative neurological diseases. PLoS ONE 2013, 8, e75091. [Google Scholar] [CrossRef]
  55. Rosengren, L.E.; Karlsson, J.; Persson, L.I.; Wikkelsø, C. Patients with amyotrophic lateral sclerosis and other neurodegenerative diseases have increased levels of neurofilament protein in CSF. J. Neurochem. 1996, 67, 2013–2018. [Google Scholar] [CrossRef]
  56. Gendron, T.F.; Badi, M.K.; Heckman, M.G.; Jansen-West, K.R.; Vilanilam, G.K.; Johnson, P.W.; Burch, A.R.; Walton, R.L.; Ross, O.A.; Brott, T.G.; et al. Plasma neurofilament light predicts mortality in patients with stroke. Sci. Transl. Med. 2020, 12, eaay1913. [Google Scholar] [CrossRef]
  57. Meeter, L.H.; Gendron, T.F.; Sias, A.C.; Jiskoot, L.C.; Russo, S.P.; Donker Kaat, L.; Papma, J.M.; Panman, J.L.; van der Ende, E.L.; Dopper, E.G.; et al. Poly(GP), neurofilament and grey matter deficits in C9orf72 expansion carriers. Ann. Clin. Transl. Neurol. 2018, 5, 583–597. [Google Scholar] [CrossRef]
  58. Prudencio, M.; Erben, Y.; Marquez, C.P.; Jansen-West, K.R.; Franco-Mesa, C.; Heckman, M.G.; White, L.J.; Dunmore, J.A.; Cook, C.N.; Lilley, M.T.; et al. Serum neurofilament light protein correlates with unfavorable clinical outcomes in hospitalized patients with COVID-19. Sci. Transl. Med. 2021, 13, eabi7643. [Google Scholar] [CrossRef] [PubMed]
  59. Erben, Y.; Prudencio, M.; Marquez, C.P.; Jansen-West, K.R.; Heckman, M.G.; White, L.J.; Dunmore, J.A.; Cook, C.N.; Lilley, M.T.; Qosja, N.; et al. Neurofilament light chain and vaccination status associate with clinical outcomes in severe COVID-19. iScience 2022, 25, 105272. [Google Scholar] [CrossRef]
  60. Rojas, J.C.; Wang, P.; Staffaroni, A.M.; Heller, C.; Cobigo, Y.; Wolf, A.; Goh, S.-Y.M.; A Ljubenkov, P.; Heuer, H.W.; Fong, J.C.; et al. Plasma Neurofilament Light for Prediction of Disease Progression in Familial Frontotemporal Lobar Degeneration. Neurology 2021, 96, e2296–e2312. [Google Scholar] [CrossRef]
  61. Alcolea, D.; Vilaplana, E.; Suárez-Calvet, M.; Illán-Gala, I.; Blesa, R.; Clarimón, J.; Lladó, A.; Sánchez-Valle, R.; Molinuevo, J.L.; García-Ribas, G.; et al. CSF sAPPbeta, YKL-40, and neurofilament light in frontotemporal lobar degeneration. Neurology 2017, 89, 178–188. [Google Scholar] [CrossRef]
  62. Kuhle, J.; Kropshofer, H.; Haering, D.A.; Kundu, U.; Meinert, R.; Barro, C.; Dahlke, F.; Tomic, D.; Leppert, D.; Kappos, L. Blood neurofilament light chain as a biomarker of MS disease activity and treatment response. Neurology 2019, 92, e1007–e1015. [Google Scholar] [CrossRef] [PubMed]
  63. Barro, C.; Healy, B.C.; Liu, Y.; Saxena, S.; Paul, A.; Polgar-Turcsanyi, M.; Guttmann, C.R.; Bakshi, R.; Kropshofer, H.; Weiner, H.L.; et al. Serum GFAP and NfL Levels Differentiate Subsequent Progression and Disease Activity in Patients with Progressive Multiple Sclerosis. Neurol. Neuroimmunol. Neuroinflamm. 2023, 10, e200052. [Google Scholar] [CrossRef] [PubMed]
  64. Alagaratnam, J.; von Widekind, S.; De Francesco, D.; Underwood, J.; Edison, P.; Winston, A.; Zetterberg, H.; Fidler, S. Correlation between CSF and blood neurofilament light chain protein: A systematic review and meta-analysis. BMJ Neurol. Open 2021, 3, e000143. [Google Scholar] [CrossRef]
  65. Andersson, E.; Janelidze, S.; Lampinen, B.; Nilsson, M.; Leuzy, A.; Stomrud, E.; Blennow, K.; Zetterberg, H.; Hansson, O. Blood and cerebrospinal fluid neurofilament light differentially detect neurodegeneration in early Alzheimer’s disease. Neurobiol. Aging 2020, 95, 143–153. [Google Scholar] [CrossRef] [PubMed]
  66. Stocker, H.; Beyer, L.; Trares, K.; Perna, L.; Rujescu, D.; Holleczek, B.; Beyreuther, K.; Gerwert, K.; Schöttker, B.; Brenner, H. Association of Kidney Function with Development of Alzheimer Disease and Other Dementias and Dementia-Related Blood Biomarkers. JAMA Netw. Open 2023, 6, e2252387. [Google Scholar] [CrossRef]
  67. Manouchehrinia, A.; Piehl, F.; Hillert, J.; Kuhle, J.; Alfredsson, L.; Olsson, T.; Kockum, I. Confounding effect of blood volume and body mass index on blood neurofilament light chain levels. Ann. Clin. Transl. Neurol. 2020, 7, 139–143. [Google Scholar] [CrossRef]
  68. La Spada, A.R.; Fu, Y.H.; Sopher, B.L.; Libby, R.T.; Wang, X.; Li, L.Y.; Einum, D.D.; Huang, J.; Possin, D.E.; Smith, A.C.; et al. Polyglutamine-expanded ataxin-7 antagonizes CRX function and induces cone-rod dystrophy in a mouse model of SCA7. Neuron 2001, 31, 913–927. [Google Scholar] [CrossRef]
Figure 1. GFAP and NfL levels in the plasma and CSF of SCA7 patients demonstrate plasma NfL levels discriminate symptomatic SCA7 patients the best from the healthy controls. (A,C) GFAP (A) and NfL (C) levels were measured in plasma (left, circles) and CSF (right, squares) using commercially developed kits (see Section 4), in symptomatic and pre-symptomatic SCA7 individuals and healthy controls. Statistical differences were assessed by Kruskal–Wallis followed by Dunn’s multiple comparison test. ** p < 0.005, ns: not significant. (B,D) Area under the receiver operating curve (AUC) analyses for GFAP (B) and NfL (D) levels in plasma and CSF to assess their ability to distinguish symptomatic SCA7 patients from the healthy controls.
Ijms 26 05070 g001
Figure 2. GFAP and NfL levels increase overtime, and higher plasma NfL levels are associated with worse SARA and GMS scores. (A,B) Plasma and CSF GFAP (A) and NfL (B) levels were evaluated longitudinally in two symptomatic SCA7 patients. The time in between visits was 29 months for both patients. Progression of their SARA and GMS scores at each visit is included in the figure. (C) Spearman correlations were performed to visualize the associations between NfL in plasma or and total SARA (left) and GMS (right) scores.
Ijms 26 05070 g002
Table 1. Characteristics of the study cohort.
VariableHealthy Controls
(N = 8)
Asymptomatic SCA7
(N = 3)
Symptomatic SCA7
(N = 10 Plasma, N = 7 CSF)
Age at ataxia onset (years)N/AN/A30 (7, 55)
Sex (female)5 (62.50%)2 (66.67%)5 (50.00.%)
Age at plasma collection (years)48.09 (31.74, 62.13)37.75 (23.87, 54.52)39.72 (10.12, 66.85)
Age at CSF collection (years)48.09 (31.74, 62.13)37.75 (23.87, 54.52)40.61 (32.61, 65.32)
Disease duration of ataxia at plasma collection (years)N/AN/A8.73 (3.12, 18.82)
Disease duration of ataxia at CSF collection (years)N/AN/A8.61 (3.61, 17.54)
ATXN7 CAG-repeat length5.0 (5, 8)31 (30, 34)39 (34, 43)
GMS
  0 = Asymptomatic8 (100.0%)3 (100.0%)1 (10.0%)
  1 = Impaired gait (no assistance)0 (0.0%)0 (0.0%)6 (60.0%)
  2 = Impaired gait (require cane)0 (0.0%)0 (0.0%)1 (10.0%)
  3 = Requires a walker0 (0.0%)0 (0.0%)1 (10.0%)
  4 = Wheelchair bound0 (0.0%)0 (0.0%)1 (10.0%)
  5 = Bedridden0 (0.0%)0 (0.0%)0 (0.0%)
Total SARA0 (0, 1)0 (0, 0)11.5 (3.0, 31.0)
Plasma GFAP (pg/mL)48.0 (31.8, 108.0)62.4 (36.6, 71.0)82.7 (31.2, 242.9)
CSF GFAP (pg/mL)8906 (4537, 16,433)14,881 (8888, 32,098)9318 (5093, 22,573)
Plasma NfL (pg/mL)8.2 (3.8, 17.7)11.9 (4.8, 18.7)21.6 (6.3, 32.2)
CSF NfL (pg/mL)414.6 (223.5, 769.3)2412.0 (458.0, 3942.0)2615.0 (1814.5, 2911.0)
The sample median (minimum, maximum) is provided for continuous variables, and the number (%) of subjects is provided for categorical variables. ATXN7: ataxin 7; CAG: cytosine–adenine–guanine; CSF: cerebrospinal fluid; GMS: gait mobility scale; SARA: scale for assessment and rating of ataxia; SCA7: spinocerebellar ataxia type 7. For two cases with a second plasma collection, only information for the first visit was used. N/A: not applicable.
Table 2. Associations of GFAP and NfL in plasma and CSF with SARA and GMS scores in ATXN7 mutation carriers.
Unadjusted AnalysisMultilinear Regression Model
VariableNβ (95% CI)p-Valueβ (95% CI)p-Value
Association with plasma GFAP
  SARA130.010 (−0.007, 0.027)0.20670.006 (−0.017, 0.029)0.5691
  GMS130.051 (−0.078, 0.180)0.4014−0.002 (−0.162, 0.158)0.9782
Association with CSF GFAP
  SARA10−0.011 (−0.044, 0.021)0.4398−0.031 (−0.082, 0.021)0.1892
  GMS100.001 (−0.185, 0.185)0.98930.069 (−0.225, 0.363)0.5744
Association with plasma NfL
  SARA130.021 (0.008, 0.035)0.00480.013 (−0.003, 0.029)0.0932
  GMS130.129 (0.016, 0.241)0.02880.074 (−0.042, 0.191)0.1784
Association with CSF NfL
  SARA100.012 (−0.019, 0.042)0.4026−0.022 (−0.051, 0.007)0.1139
  GMS100.058 (−0.109, 0.226)0.44650.004 (−0.182, 0.190)0.9576
β: regression coefficient; CI: confidence intervals. β values, 95% CIs, and p values result from unadjusted linear regression models or multilinear regression models adjusted for age, sex, and ATXN7 CAG repeat length, where GFAP and NfL levels were considered on the base 10 logarithmic scale. β values are interpreted as the change in mean GFAP or NfL levels in ATXN7 mutation carriers. p-values < 0.025 are considered statistically significant.
Disclaimer/Publisher’s Note: The statements, opinions and data contained in all publications are solely those of the individual author(s) and contributor(s) and not of MDPI and/or the editor(s). MDPI and/or the editor(s) disclaim responsibility for any injury to people or property resulting from any ideas, methods, instructions or products referred to in the content.

