
Synergistic Effects of 2-Deoxyglucose and Diclofenac Sodium on Breast Cancer Cells: A Comparative Evaluation of MDA-231 and MCF7 Cells

 , , ,
, , ,  ,
, 

Abstract
1. Introduction
2. Results
2.1. Cell Viability
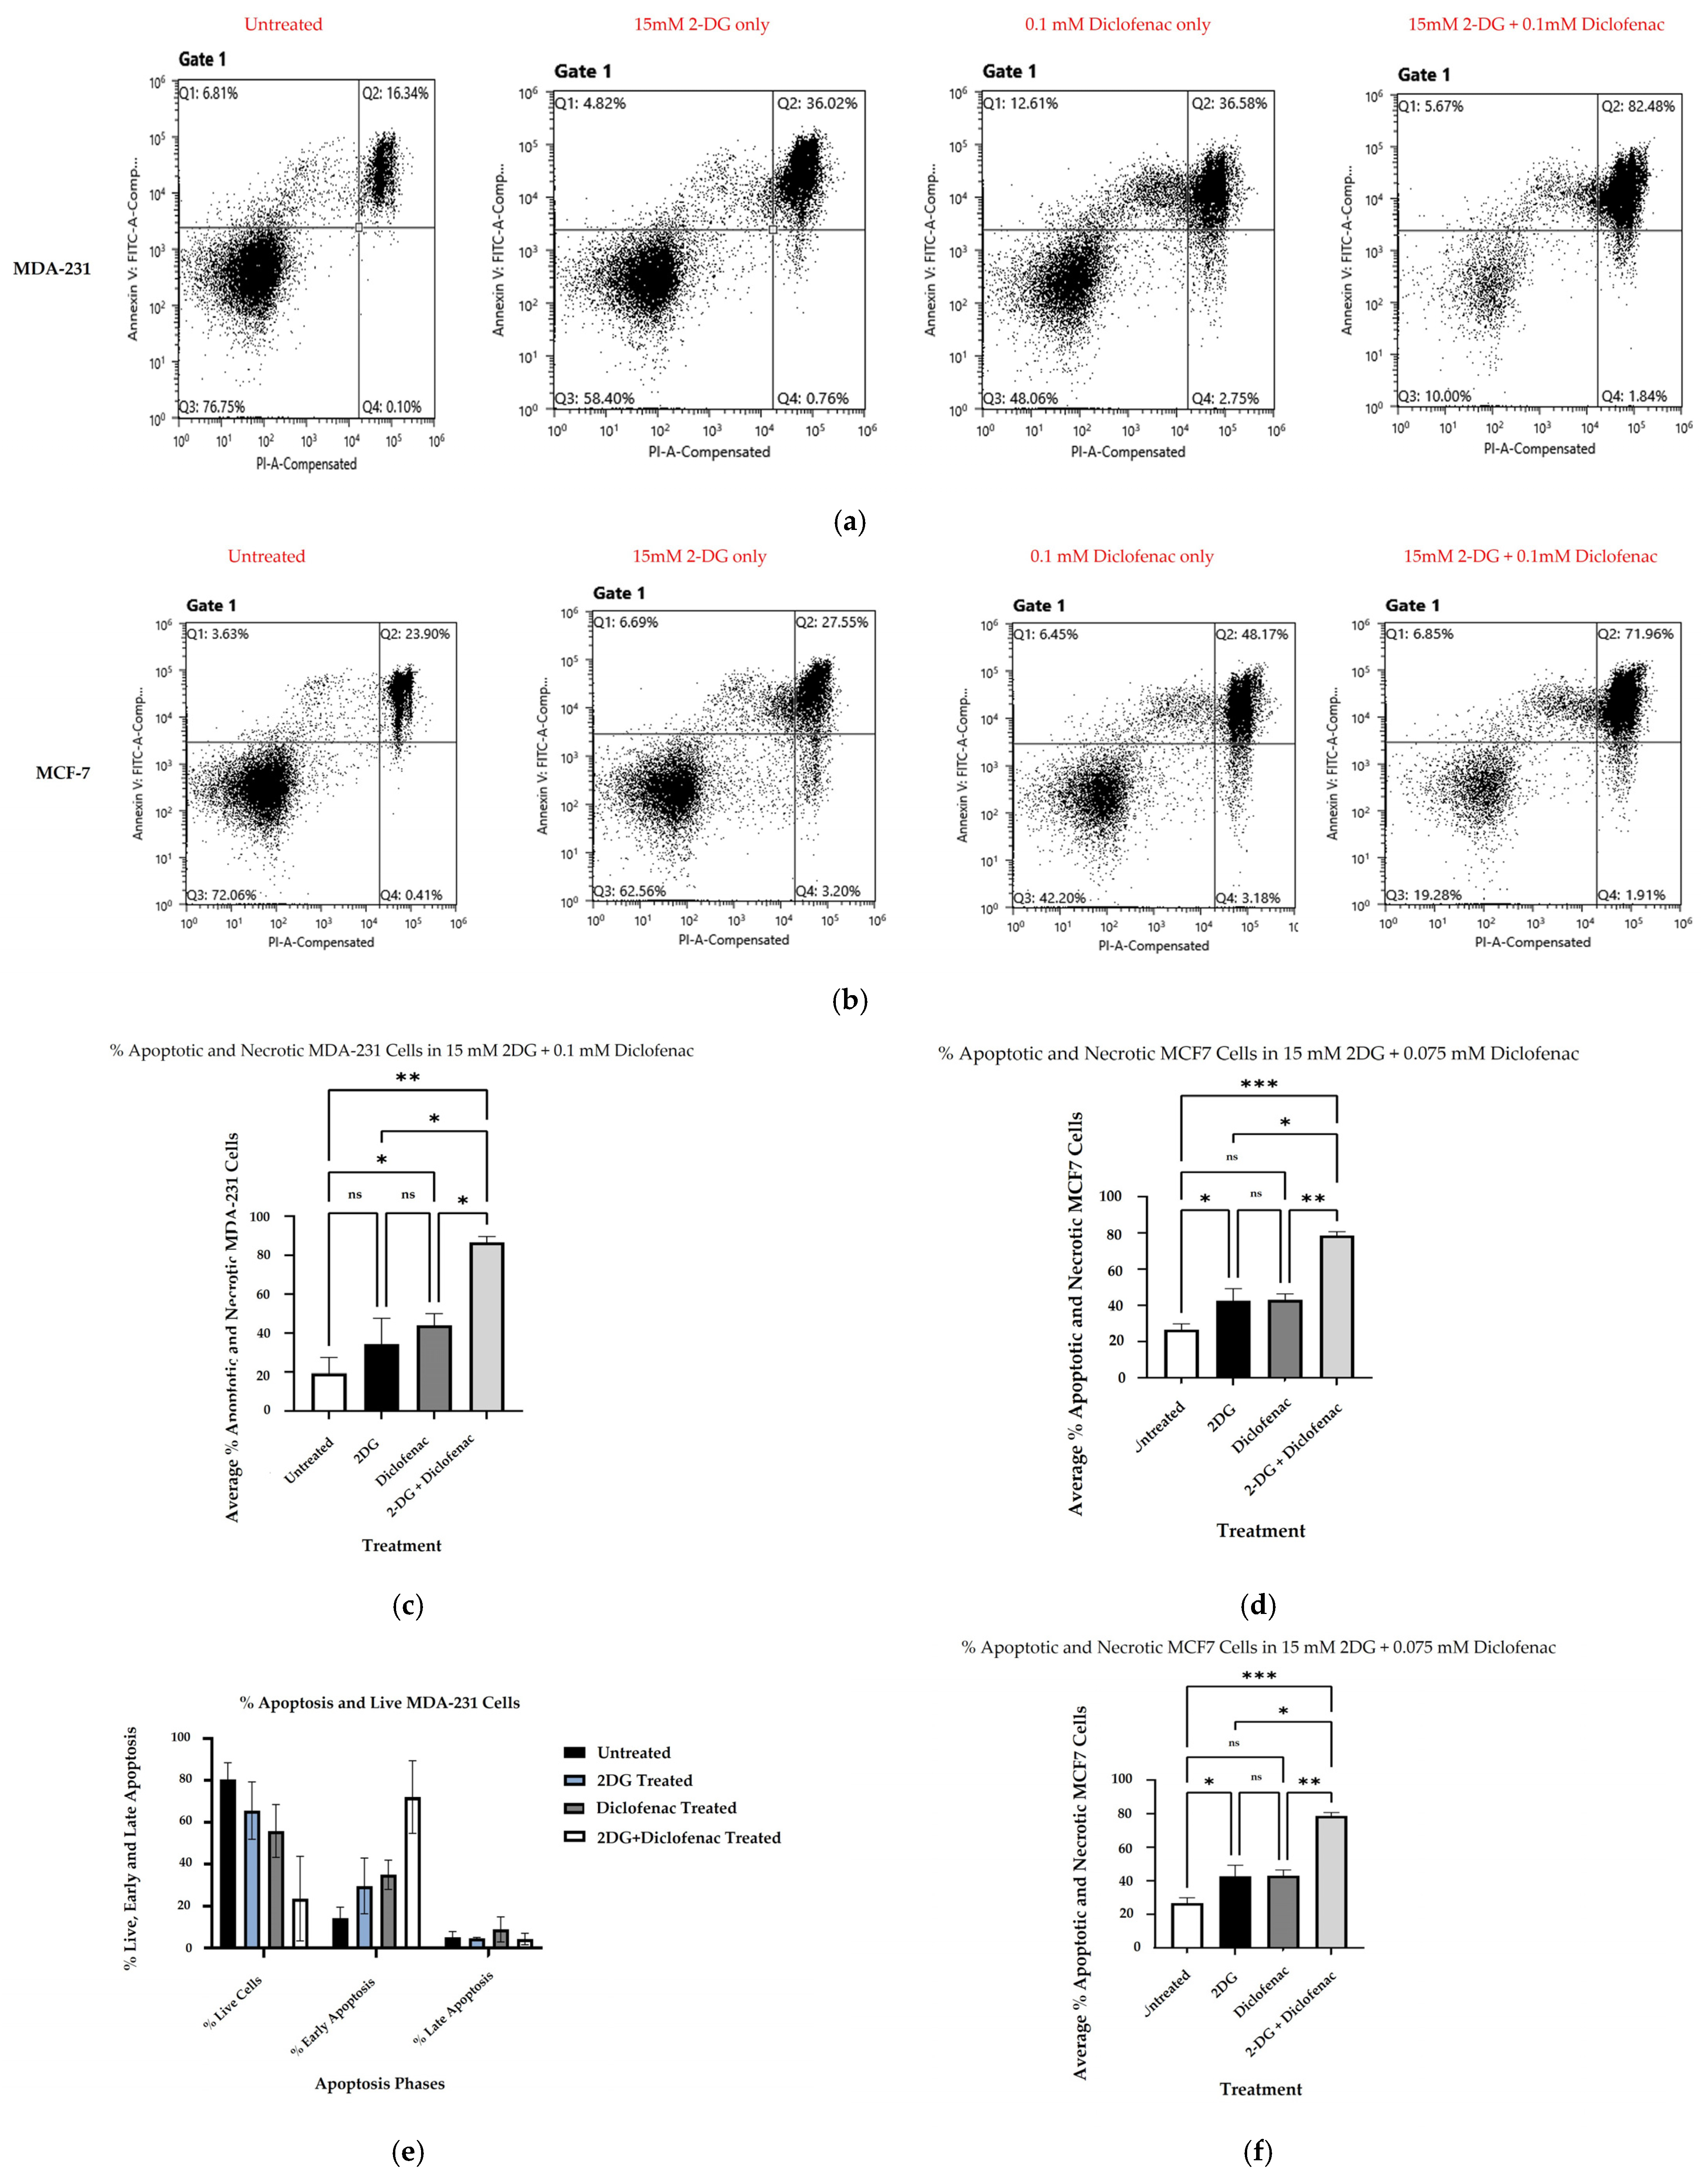
2.2. Cell Death Analysis by Apoptosis Assay
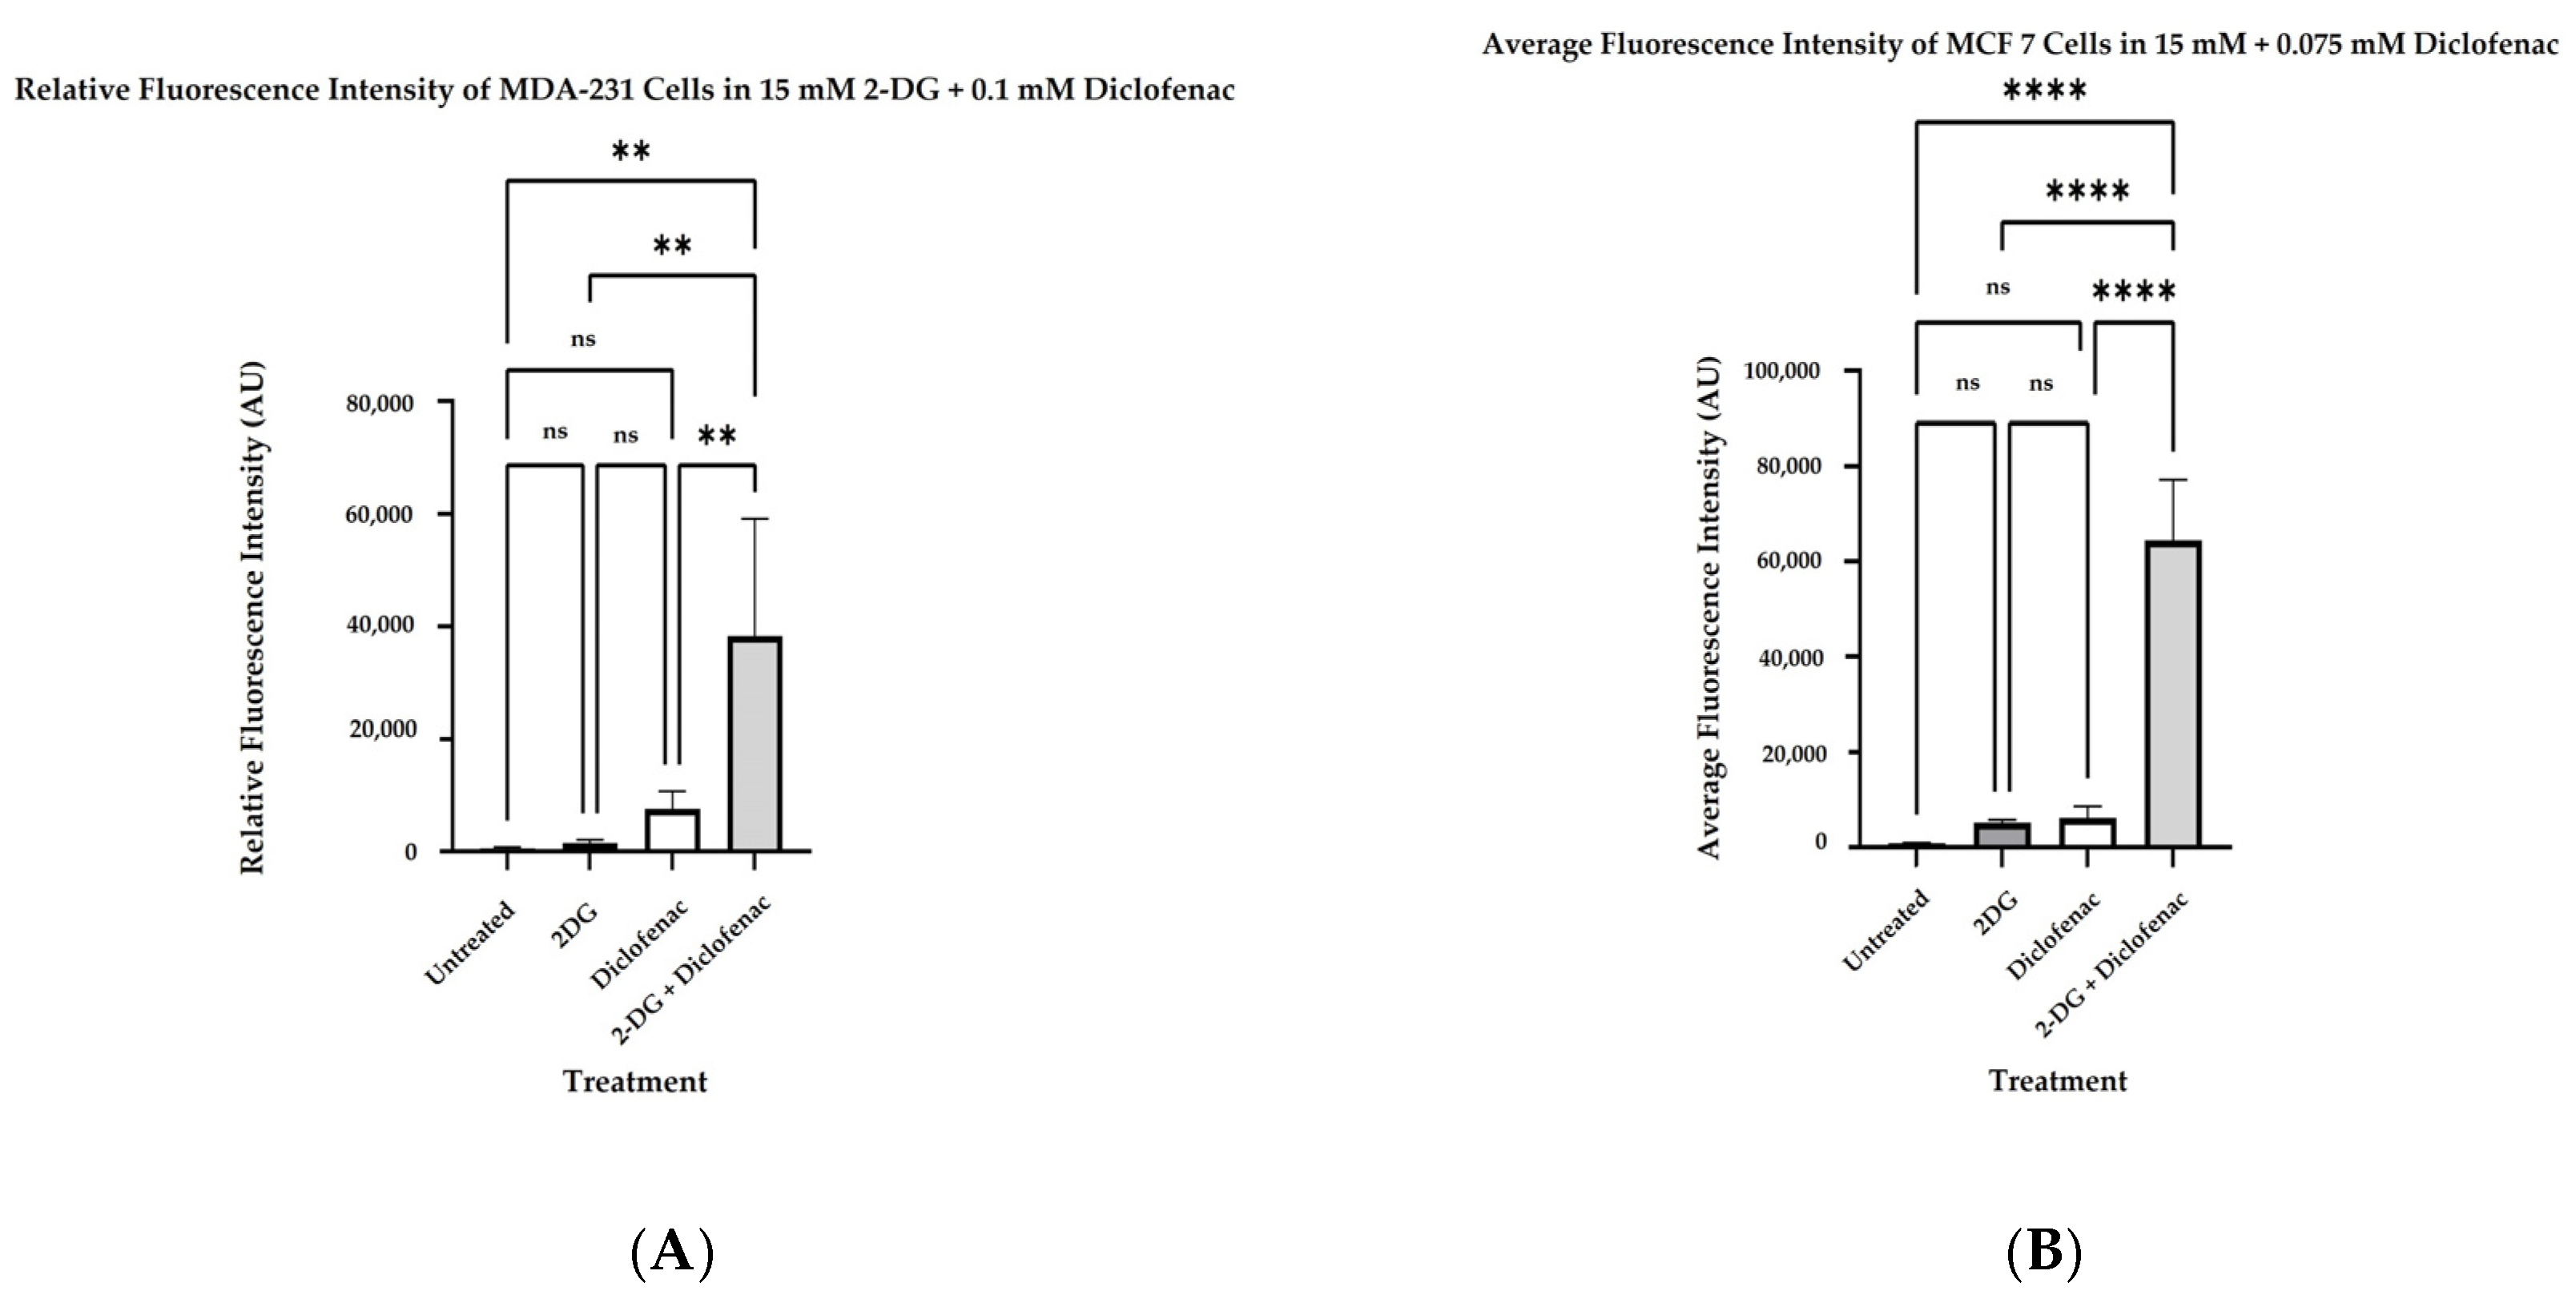
2.3. Determination of Reactive Oxygen Species
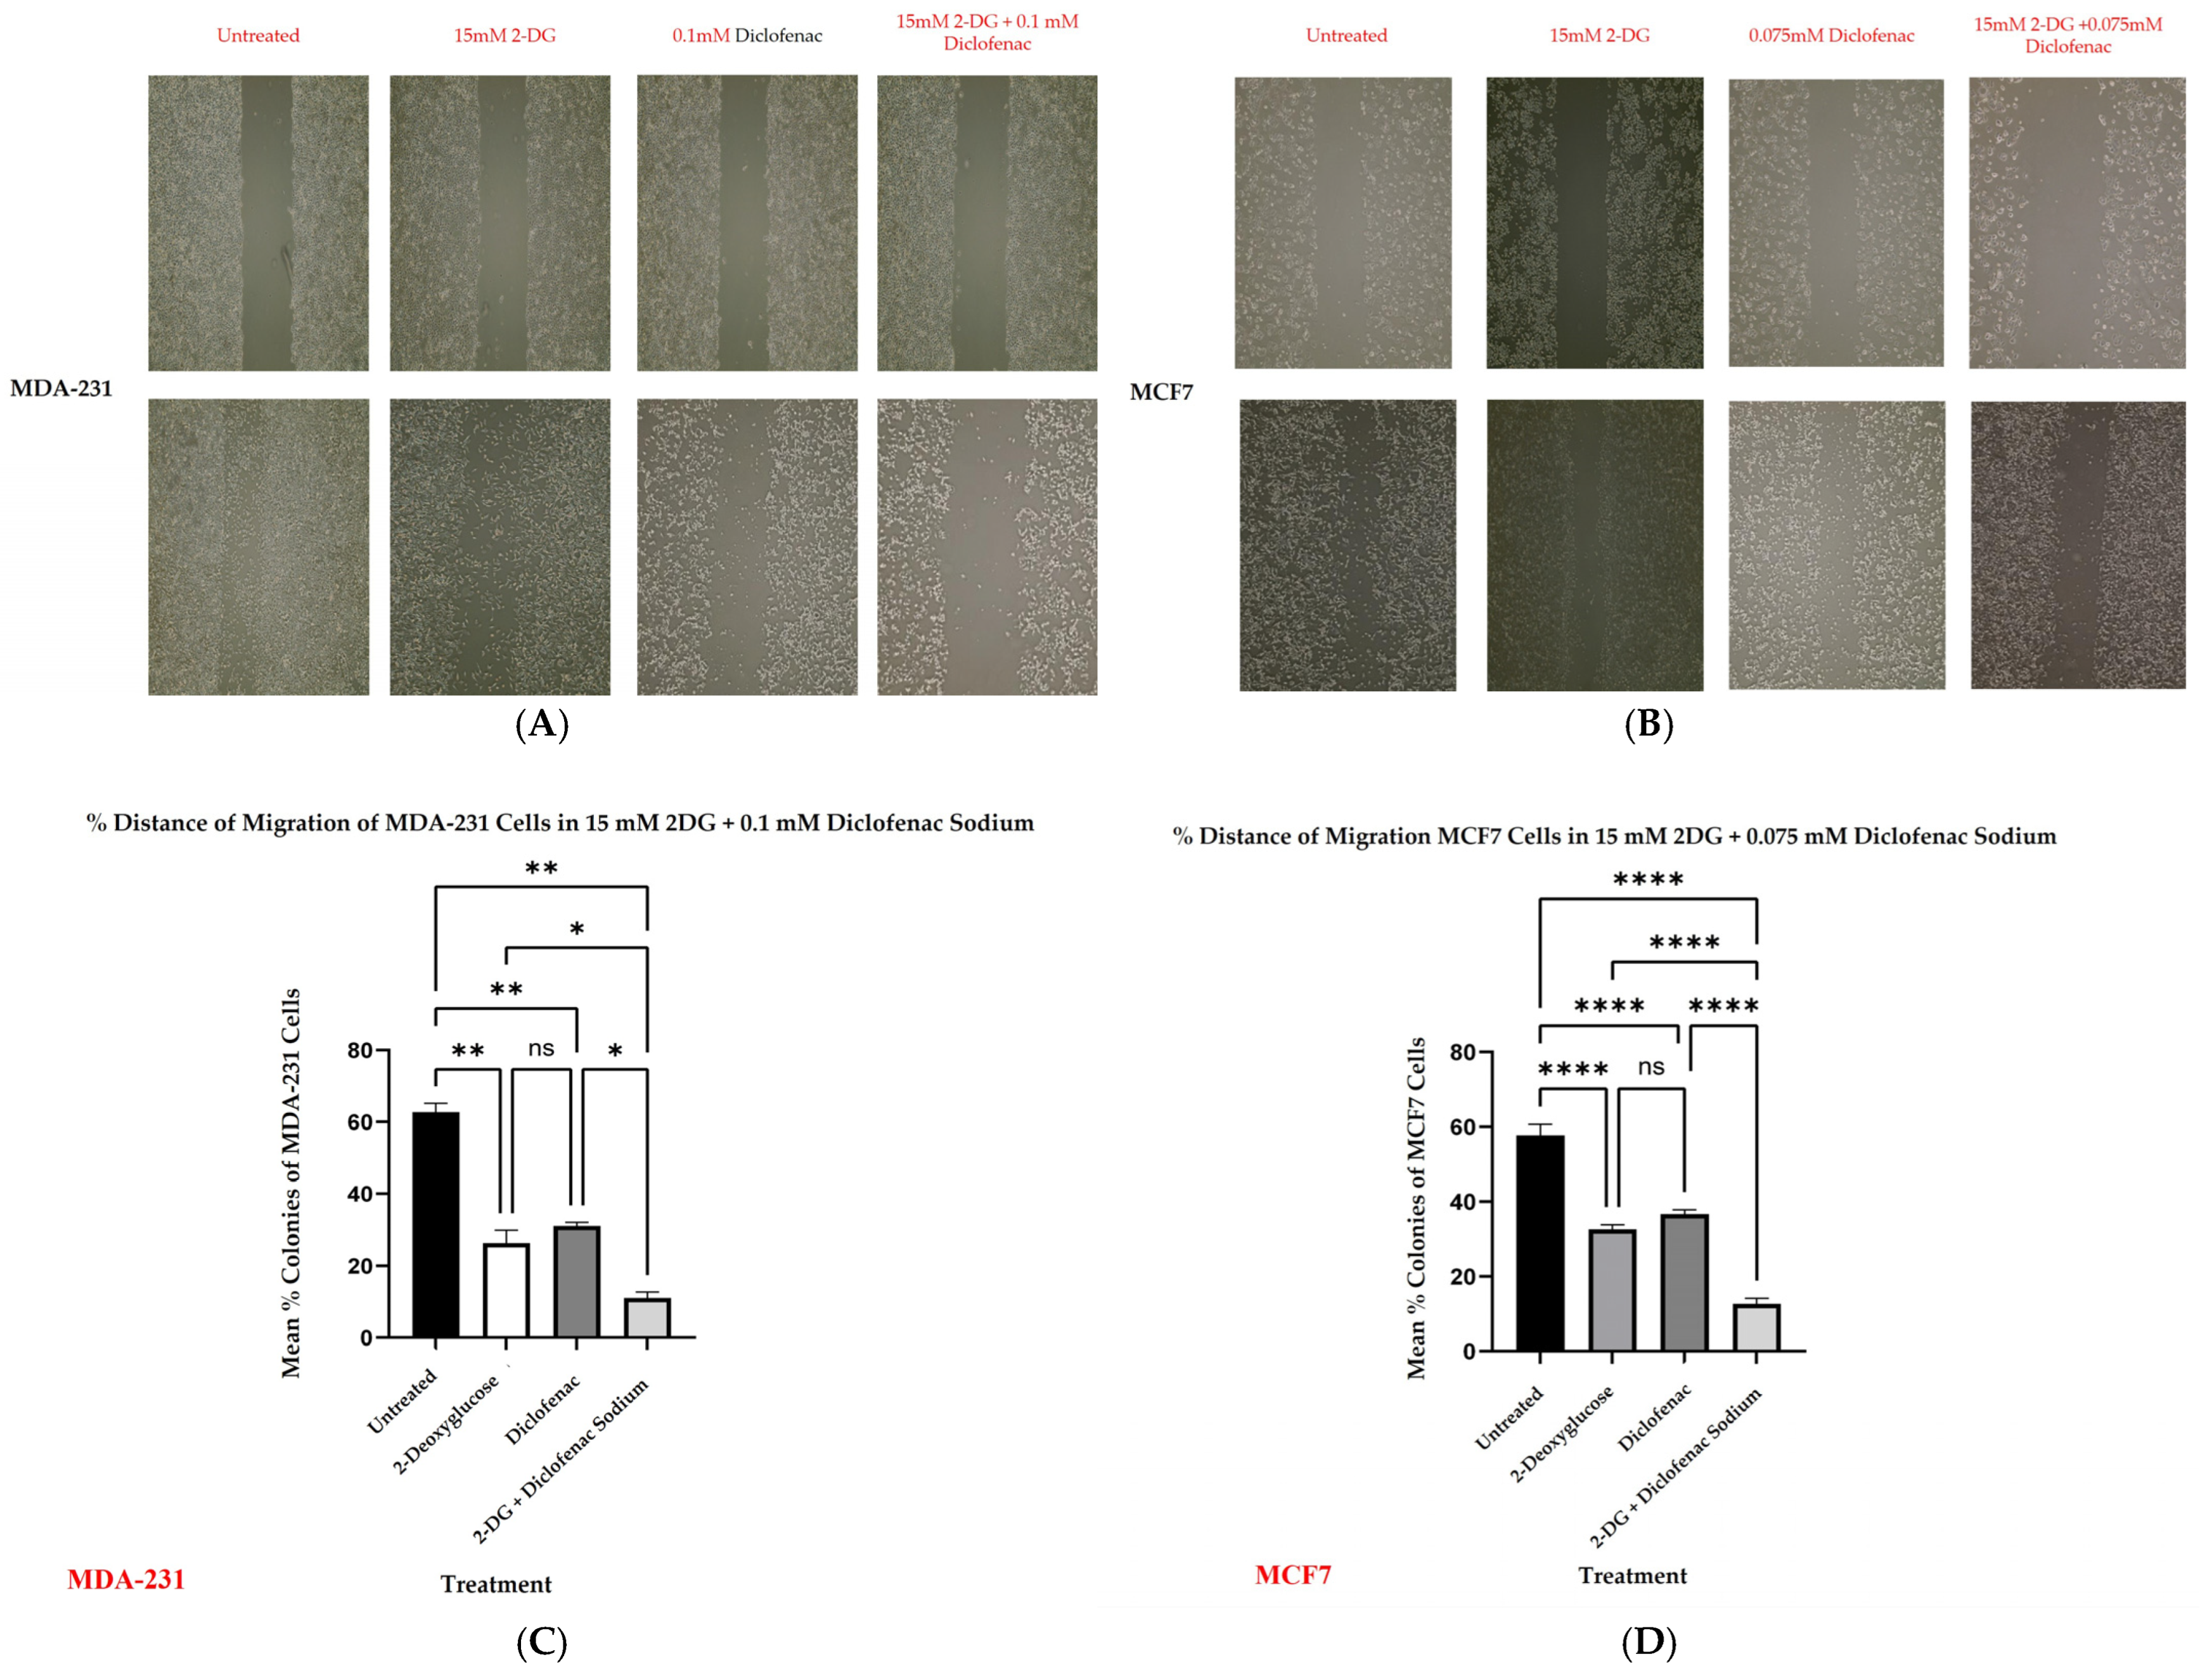
2.4. Wound Healing
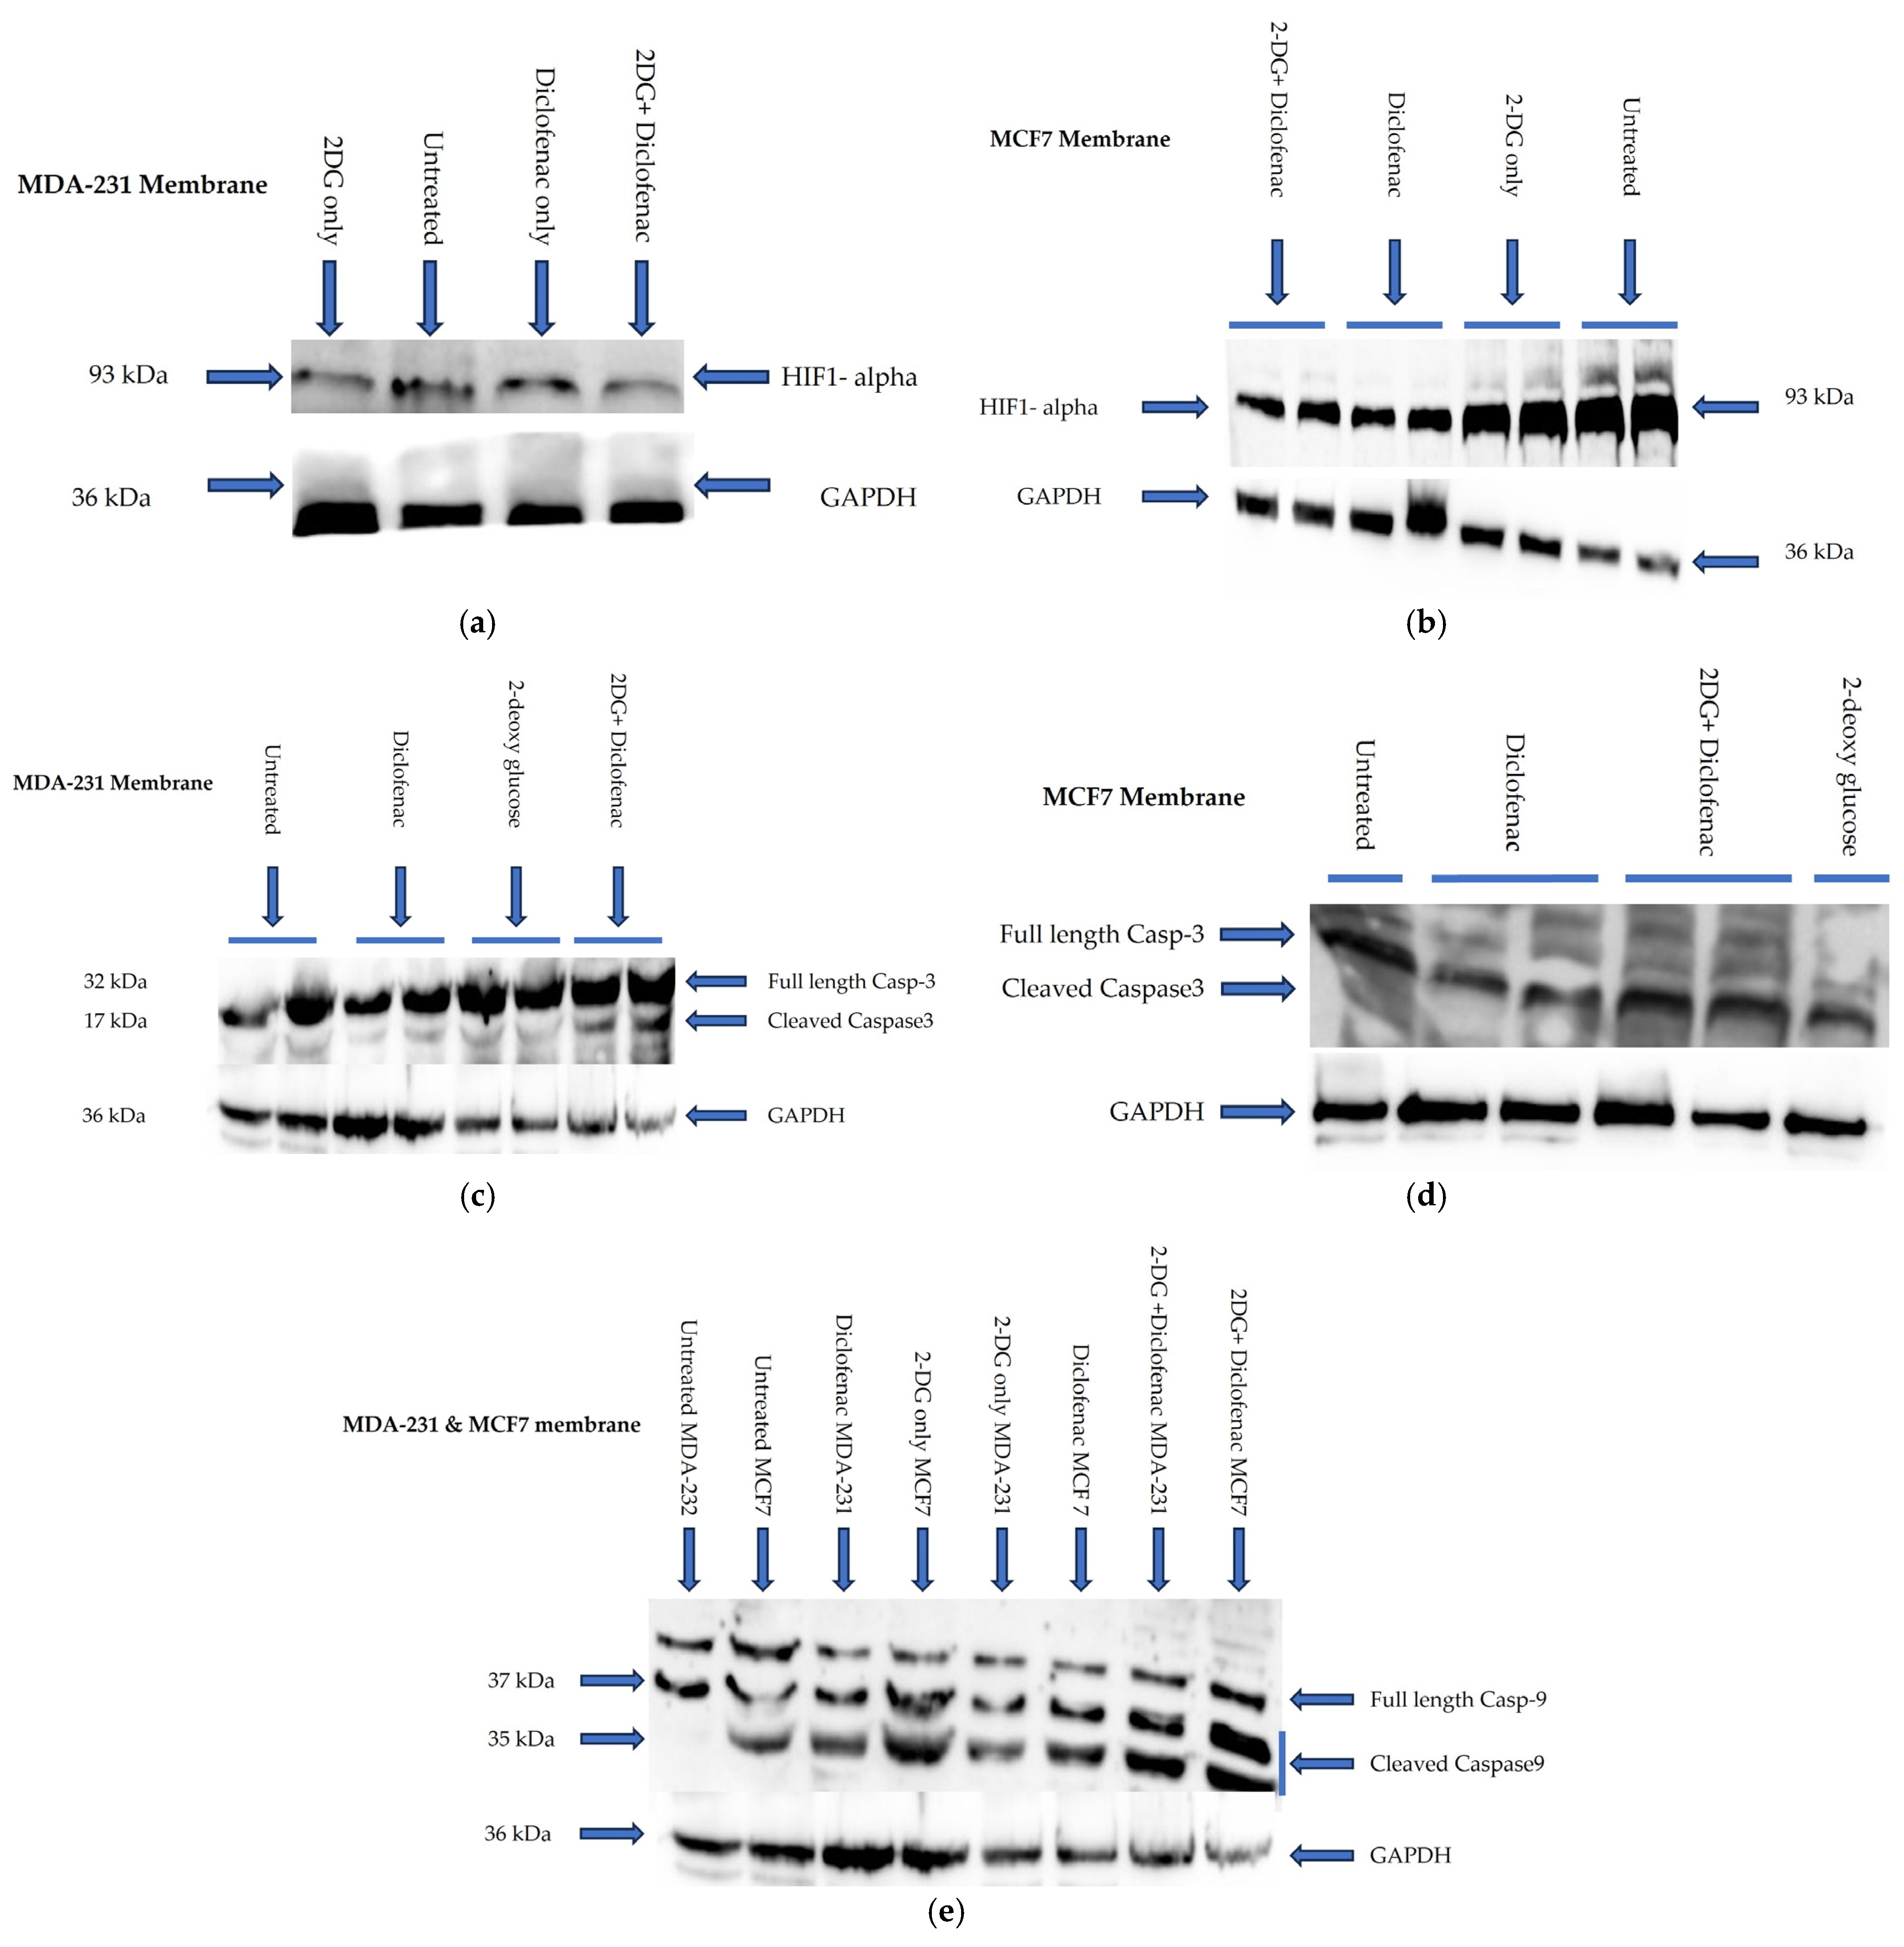
2.5. Immunoblotting
2.6. Colony Formation
3. Discussion
4. Conclusions
5. Materials and Methods
5.1. Cell Cultures
5.2. 3-(4,5-Dimethylthiazol-2-Yl)-2,5-Diphenyltetrazolium Bromide (MTT) Assay
5.3. Reactive Oxygen Species (ROS) Determination
5.4. Colony Formation Assay
5.5. Wound Healing Assay
5.6. Apoptosis Assay
5.7. Western Blotting
5.8. Data Analysis
Author Contributions
Funding
Institutional Review Board Statement
Informed Consent Statement
Data Availability Statement
Acknowledgments
Conflicts of Interest
References
- DeSantis, C.; Ma, J.; Bryan, L.; Jemal, A. Breast cancer statistics, 2013. CA Cancer J. Clin. 2014, 64, 52–62. [Google Scholar] [CrossRef] [PubMed]
- Waks, A.G.; Winer, E.P. Breast Cancer Treatment: A Review. Am. Med. Assoc. 2019, 321, 288–300. [Google Scholar] [CrossRef]
- Ebrahimi, A.; Shahrebabaki, P.B.; Fouladi, H.; Derakhshan, S.M. The impact of microRNAs on the resistance of breast cancer subtypes to chemotherapy. Pathol.-Res. Pract. 2023, 249, 154702. [Google Scholar] [CrossRef]
- Nedeljković, M.; Damjanović, A. Mechanisms of chemotherapy resistance in triple-negative breast cancer-how we can rise to the challenge. Cells 2019, 8, 957. [Google Scholar] [CrossRef]
- Samuel, S.M.; Varghese, E.; Satheesh, N.J.; Triggle, C.R.; Büsselberg, D. Metabolic heterogeneity in TNBCs: A potential determinant of therapeutic efficacy of 2-deoxyglucose and metformin combinatory therapy. Biomed. Pharmacother. 2023, 164, 114911. [Google Scholar] [CrossRef]
- Correia, A.S.; Gärtner, F.; Vale, N. Drug combination and repurposing for cancer therapy: The example of breast cancer. Heliyon 2021, 7, e05948. [Google Scholar] [CrossRef]
- O’Neill, S.; Porter, R.K.; McNamee, N.; Martinez, V.G.; O’Driscoll, L. 2-Deoxy-D-Glucose inhibits aggressive triple-negative breast cancer cells by targeting glycolysis and the cancer stem cell phenotype. Sci. Rep. 2019, 9, 3788. [Google Scholar] [CrossRef]
- Aft, R.L.; Zhang, F.W.; Gius, D. Evaluation of 2-deoxy-D-glucose as a chemotherapeutic agent: Mechanism of cell death. Br. J. Cancer 2002, 87, 805–812. [Google Scholar] [CrossRef]
- Yang, L.; Li, J.; Li, Y.; Zhou, Y.; Wang, Z.; Zhang, D.; Liu, J.; Zhang, X. Diclofenac impairs the proliferation and glucose metabolism of triple-negative breast cancer cells by targeting the c-Myc pathway. Exp. Ther. Med. 2021, 21, 584. [Google Scholar] [CrossRef]
- Vaupel, P.; Multhoff, G. Revisiting the Warburg effect: Historical dogma versus current understanding. J. Physiol. 2021, 599, 1745–1757. [Google Scholar] [CrossRef]
- Muz, B.; de la Puente, P.; Azab, F.; Azab, A.K. The role of hypoxia in cancer progression, angiogenesis, metastasis, and resistance to therapy. Hypoxia 2015, 3, 83. [Google Scholar] [CrossRef] [PubMed]
- Mahmood, T.; Yang, P.C. Western blot: Technique, theory, and trouble shooting. N. Am. J. Med. Sci. 2012, 4, 429–434. [Google Scholar] [CrossRef] [PubMed]
- Padilla, J.; Lee, J. A novel therapeutic target, bach1, regulates cancer metabolism. Cells 2021, 10, 634. [Google Scholar] [CrossRef]
- Lucantoni, F.; Dussmann, H.; Prehn, J.H.M. Metabolic targeting of breast cancer cells with the 2-deoxy-D-glucose and the mitochondrial bioenergetics inhibitor MDIVI-1. Front. Cell Dev. Biol. 2018, 6, 113. [Google Scholar] [CrossRef]
- Wick, A.N.; Drury, D.R.; Nakada, H.I.; Wolfe, J.B. Localization of the primary metabolic block produced by 2-deoxyglucose. J. Biol. Chem. 1957, 224, 963–969. [Google Scholar] [CrossRef]
- Laussel, C.; Léon, S. Cellular toxicity of the metabolic inhibitor 2-deoxyglucose and associated resistance mechanisms. Biochem. Pharmacol. 2020, 182, 114213. [Google Scholar] [CrossRef]
- Cheng, G.; Zielonka, J.; Dranka, B.P.; McAllister, D.; Mackinnon, A.C., Jr.; Joseph, J.; Kalyanaraman, B. Mitochondria-targeted drugs synergize with 2-deoxyglucose to trigger breast cancer cell death. Cancer Res. 2012, 72, 2634–2644. [Google Scholar] [CrossRef]
- Zhang, T.; Zhu, X.; Wu, H.; Jiang, K.; Zhao, G.; Shaukat, A.; Deng, G.; Qiu, C. Targeting the ROS/PI3K/AKT/HIF-1α/HK2 axis of breast cancer cells: Combined administration of Polydatin and 2-Deoxy-d-glucose. J. Cell Mol. Med. 2019, 23, 3711–3723. [Google Scholar] [CrossRef]
- Repas, J.; Zupin, M.; Vodlan, M.; Veranič, P.; Gole, B.; Potočnik, U.; Pavlin, M. Dual Effect of Combined Metformin and 2-Deoxy-D-Glucose Treatment on Mitochondrial Biogenesis and PD-L1 Expression in Triple-Negative Breast Cancer Cells. Cancers 2022, 14, 1343. [Google Scholar] [CrossRef]
- Wokoun, U.; Hellriegel, M.; Emons, G.; Gröndker, C. Co-Treatment of breast cancer cells with pharmacologic doses of 2-deoxy-D-glucose and metformin: Starving tumors. Oncol. Rep. 2017, 37, 2418–2424. [Google Scholar] [CrossRef]
- Bizjak, M.; Malavašič, P.; Dolinar, K.; Pohar, J.; Pirkmajer, S.; Pavlin, M. Combined treatment with Metformin and 2-deoxy glucose induces detachment of viable MDA-MB-231 breast cancer cells in vitro. Sci. Rep. 2017, 7, 1761. [Google Scholar] [CrossRef]
- Francio, V.T.; Davani, S.; Towery, C.; Brown, T.L. Oral Versus Topical Diclofenac Sodium in the Treatment of Osteoarthritis. J. Pain. Palliat. Care Pharmacother. 2017, 31, 113–120. [Google Scholar] [CrossRef]
- Chung, C.H. The use of injectable nonsteroidal anti-inflammatory drugs in local accident & emergency practice. Hong Kong J. Emerg. Med. 2002, 9, 65–71. [Google Scholar]
- Mitchell, J.A.; Akarasereenont, P.; Thiemermann, C.; Flower, R.J.; Vane, J.R. Selectivity of nonsteroidal antiinflammatory drugs as inhibitors of constitutive and inducible cyclooxygenase. Proc. Natl. Acad. Sci. USA 1994, 90, 11693–11697. [Google Scholar] [CrossRef]
- Gan, T.J. Diclofenac: An update on its mechanism of action and safety profile. Curr. Med Res. Opin. 2010, 26, 1715–1731. [Google Scholar] [CrossRef]
- Scholer, D.W.; Ku, E.C.; Boettcher, I.; Schweizer, A. Pharmacology of Diclofenac Sodium. Am. J. Med. 1986, 80, 34–38. [Google Scholar] [CrossRef]
- Ku, E.C.; Lee, W.; Kothari, M.V.H. Effect of Diclofenac Sodium on the Apchidonic Acid Cascade. Am. J. Med. 1986, 80, 18–23. [Google Scholar] [CrossRef]
- Pantziarka, P.; Sukhatme, V.; Bouche, G.; Meheus, L.; Sukhatme, V.P. Repurposing Drugs in Oncology (ReDO)—Diclofenac as an anti-cancer agent. Ecancermedicalscience 2016, 10, 610. [Google Scholar] [CrossRef]
- Andreidesz, K.; Koszegi, B.; Kovacs, D.; Vantus, V.B.; Gallyas, F.; Kovacs, K. Effect of oxaliplatin, olaparib and LY294002 in combination on triple-negative breast cancer cells. Int. J. Mol. Sci. 2021, 22, 2056. [Google Scholar] [CrossRef]
- Chatterjee, S.; Thaker, N.; De, A. Combined 2-deoxy glucose and metformin improves therapeutic efficacy of sodium-iodide symporter-mediated targeted radioiodine therapy in breast cancer cells. Breast Cancer Targets Ther. 2015, 7, 251–265. [Google Scholar] [CrossRef]
- Zhou, N.; Liu, Q.; Wang, X.; He, L.; Zhang, T.; Zhou, H.; Zhu, X.; Zhou, T.; Deng, G.; Qiu, C. The combination of hydroxychloroquine and 2-deoxyglucose enhances apoptosis in breast cancer cells by blocking protective autophagy and sustaining endoplasmic reticulum stress. Cell Death Discov. 2022, 8, 286. [Google Scholar] [CrossRef] [PubMed]
- Demidenko, E.; Miller, T.W. Statistical determination of synergy based on Bliss definition of drugs independence. PLoS ONE 2019, 14, e0224137. [Google Scholar] [CrossRef] [PubMed]
- Zhao, W.; Sachsenmeier, K.; Zhang, L.; Sult, E.; Hollingsworth, R.E.; Yang, H. A new bliss independence model to analyze drug combination data. J. Biomol. Screen. 2014, 19, 817–821. [Google Scholar] [CrossRef]
- Kumar, P.; Nagarajan, A.; Uchil, P.D. Analysis of cell viability by the MTT assay. Cold Spring Harb. Protoc. 2018, 2018, 469–471. [Google Scholar] [CrossRef]
- Karakaş, D.; Ari, F.; Ulukaya, E. The MTT viability assay yields strikingly false-positive viabilities although the cells are killed by some plant extracts. Turk. J. Biol. 2017, 41, 919–925. [Google Scholar] [CrossRef]
- Dent, R.; Trudeau, M.; Pritchard, K.I.; Hanna, W.M.; Kahn, H.K.; Sawka, C.A.; Lickley, L.A.; Rawlinson, E.; Sun, P.; Narod, S.A. Triple-negative breast cancer: Clinical features and patterns of recurrence. Clin. Cancer Res. 2007, 13, 4429–4434. [Google Scholar] [CrossRef]
- Lakshmanan, I.; Batra, S.K. Protocol for Apoptosis Assay by Flow Cytometry Using Annexin V Staining Method Materials and Reagents. Bio-Protocol 2013, 3, e374. [Google Scholar] [CrossRef]
- Rieger, A.M.; Nelson, K.L.; Konowalchuk, J.D.; Barreda, D.R. Modified annexin V/propidium iodide apoptosis assay for accurate assessment of cell death. J. Vis. Exp. 2011, 50, 3–6. [Google Scholar] [CrossRef]
- Crowley, L.C.; Marfell, B.J.; Scott, A.P.; Waterhouse, N.J. Quantitation of apoptosis and necrosis by annexin V binding, propidium iodide uptake, and flow cytometry. Cold Spring Harb. Protoc. 2016, 2016, 953–957. [Google Scholar] [CrossRef]
- Horton, R.; Wilming, L.; Rand, V.; Lovering, R.C.; Bruford, E.A.; Khodiyar, V.K.; Lush, M.J.; Povey, S.; Talbot, C.C., Jr.; Wright, M.W.; et al. Gene map of the extended human MHC. Nat. Rev. Genet. 2004, 5, 889–899. [Google Scholar] [CrossRef]
- Maelfait, J.; Beyaert, R. Non-apoptotic functions of caspase-8. Biochem. Pharmacol. 2008, 76, 1365–1373. [Google Scholar] [CrossRef]
- Johnson, I.T. Anticarcinogenic Effects of Diet-Related Apoptosis in the Colorectal Mucosa. Food Chem. Toxicol. 2002, 40, 1171–1178. [Google Scholar] [CrossRef]
- Jarskog, L.F.; Glantz, L.A.; Gilmore, J.H.; Lieberman, J.A. Apoptotic mechanisms in the pathophysiology of schizophrenia. Prog. Neuro-Psychopharmacol. Biol. Psychiatry 2005, 29, 846–858. [Google Scholar] [CrossRef]
- Dai, X.; Wang, L.; Deivasigamni, A.; Looi, C.Y.; Karthikeyan, C.; Trivedi, P.; Chinnathambi, A.; Alharbi, S.A.; Arfuso, F.; Dharmarajan, A.; et al. A Novel Benzimidazole Derivative, MBIC Inhibits Tumor Growth and Promotes Apoptosis via Activation of ROS-Dependent JNK Signaling Pathway in Hepatocellular Carcinoma. Oncotarget 2017, 8, 12831–12842. [Google Scholar] [CrossRef]
- Aggarwal, V.; Tuli, H.S.; Varol, A.; Thakral, F.; Yerer, M.B.; Sak, K.; Varol, M.; Jain, A.; Khan, M.A.; Sethi, G. Role of reactive oxygen species in cancer progression: Molecular mechanisms and recent advancements. Biomolecules 2019, 9, 735. [Google Scholar] [CrossRef]
- Bylund, J.; Brown, K.L.; Movitz, C.; Dahlgren, C.; Karlsson, A. Intracellular generation of superoxide by the phagocyte NADPH oxidase: How, where, and what for? Free Radic. Biol. Med. 2010, 49, 1834–1845. [Google Scholar] [CrossRef]
- Kamiya, T.; Goto, A.; Kurokawa, E.; Hara, H.; Adachi, T. Cross Talk Mechanism among EMT, ROS, and Histone Acetylation in Phorbol Ester-Treated Human Breast Cancer MCF-7 Cells. Oxid. Med. Cell. Longev. 2016, 2016, 1284372. [Google Scholar] [CrossRef]
- Giorgio, M.; Migliaccio, E.; Orsini, F.; Paolucci, D.; Moroni, M.; Contursi, C.; Pelliccia, G.; Luzi, L.; Minucci, S.; Marcaccio, M.; et al. Electron transfer between cytochrome c and p66Shc generates reactive oxygen species that trigger mitochondrial apoptosis. Cell 2005, 122, 221–233. [Google Scholar] [CrossRef]
- Redza-Dutordoir, M.; Averill-Bates, D.A. Activation of apoptosis signalling pathways by reactive oxygen species. Biochim. Biophys. Acta 2016, 1863, 2977–2992. [Google Scholar] [CrossRef]
- Rani, V.; Deep, G.; Singh, R.K.; Palle, K.; Yadav, U.C.S. Oxidative stress and metabolic disorders: Pathogenesis and therapeutic strategies. Life Sci. 2016, 148, 183–193. [Google Scholar] [CrossRef]
- Lee, M. Metabolic interplay between glycolysis and mitochondrial oxidation: The reverse Warburg effect and its therapeutic implication. World J. Biol. Chem. 2015, 6, 148. [Google Scholar] [CrossRef] [PubMed]
- Chaffer, C.L.; Weinberg, R.A. A Perspective on Cancer Cell Metastasis. Available online: https://www.science.org (accessed on 27 March 2025).
- Mohamed, O.A.A.; Tesen, H.S.; Hany, M.; Sherif, A.; Abdelwahab, M.M.; Elnaggar, M.H. The role of hypoxia on prostate cancer progression and metastasis. Mol. Biol. Rep. 2023, 50, 3873–3884. [Google Scholar] [CrossRef] [PubMed]
- Semenza, G.L. Hypoxia-inducible factors: Mediators of cancer progression and targets for cancer therapy. Trends Pharmacol. Sci. 2012, 33, 207–214. [Google Scholar] [CrossRef]
- Rey, S.; Semenza, G.L. Hypoxia-inducible factor-1-dependent mechanisms of vascularization and vascular remodelling. Cardiovasc. Res. 2010, 86, 236–242. [Google Scholar] [CrossRef]
- Sikov, W.M. Assessing the Role of Platinum Agents in Aggressive Breast Cancers. Curr. Oncol. Rep. 2015, 17, 3. [Google Scholar] [CrossRef]
- Riss, T.L.; Moravec, R.A.; Niles, A.L. Cell Viability Assays; NIH: Rockville, MD, USA, 2013.
- Franken, N.A.P.; Rodermond, H.M.; Stap, J.; Haveman, J.; van Bree, C. Clonogenic assay of cells in vitro. Nat. Protoc. 2006, 1, 2315–2319. [Google Scholar] [CrossRef]
- Jonkman, J.E.N.; Cathcart, J.A.; Xu, F.; Bartolini, M.E.; Amon, J.E.; Stevens, K.M.; Colarusso, P. An introduction to the wound healing assay using live-cell microscopy. Cell Adhes. Migr. 2014, 8, 440–451. [Google Scholar] [CrossRef]


Disclaimer/Publisher’s Note: The statements, opinions and data contained in all publications are solely those of the individual author(s) and contributor(s) and not of MDPI and/or the editor(s). MDPI and/or the editor(s) disclaim responsibility for any injury to people or property resulting from any ideas, methods, instructions or products referred to in the content. |
© 2025 by the authors. Licensee MDPI, Basel, Switzerland. This article is an open access article distributed under the terms and conditions of the Creative Commons Attribution (CC BY) license (https://creativecommons.org/licenses/by/4.0/).
Share and Cite
Maloba, G.O.; Were, T.; Barasa, E.; Mohamed, N.; Arshi, A.; Gallyas, F. Synergistic Effects of 2-Deoxyglucose and Diclofenac Sodium on Breast Cancer Cells: A Comparative Evaluation of MDA-231 and MCF7 Cells. Int. J. Mol. Sci. 2025, 26, 4894. https://doi.org/10.3390/ijms26104894
Maloba GO, Were T, Barasa E, Mohamed N, Arshi A, Gallyas F. Synergistic Effects of 2-Deoxyglucose and Diclofenac Sodium on Breast Cancer Cells: A Comparative Evaluation of MDA-231 and MCF7 Cells. International Journal of Molecular Sciences. 2025; 26(10):4894. https://doi.org/10.3390/ijms26104894
Chicago/Turabian StyleMaloba, Geofrey Ouma, Tom Were, Erick Barasa, Nasreldeen Mohamed, Arshi Arshi, and Ferenc Gallyas. 2025. "Synergistic Effects of 2-Deoxyglucose and Diclofenac Sodium on Breast Cancer Cells: A Comparative Evaluation of MDA-231 and MCF7 Cells" International Journal of Molecular Sciences 26, no. 10: 4894. https://doi.org/10.3390/ijms26104894
APA StyleMaloba, G. O., Were, T., Barasa, E., Mohamed, N., Arshi, A., & Gallyas, F. (2025). Synergistic Effects of 2-Deoxyglucose and Diclofenac Sodium on Breast Cancer Cells: A Comparative Evaluation of MDA-231 and MCF7 Cells. International Journal of Molecular Sciences, 26(10), 4894. https://doi.org/10.3390/ijms26104894