
Accelerated Biological Aging in Exfoliation Glaucoma Assessed by Fundus-Derived Predicted Age and Advanced Glycation End Products


Abstract
:1. Introduction
2. Results
3. Discussion
4. Materials and Methods
4.1. Subjects
4.2. Propensity Score Matching
4.3. Measurement of AGEs in the Fingertip Skin
4.4. Age Prediction from Fundus Photographs
4.5. Statistical Analysis
5. Conclusions
Author Contributions
Funding
Institutional Review Board Statement
Informed Consent Statement
Data Availability Statement
Acknowledgments
Conflicts of Interest
Abbreviations
| AGEs | Advanced Glycation End products |
| BCVA | Best-Corrected Visual Acuity |
| BMI | Body Mass Index |
| CML | Carboxymethyl-Lysine |
| DBP | Diastolic Blood Pressure |
| ECM | Extracellular Matrix |
| EXG | Exfoliation Glaucoma |
| HR | Heart Rate |
| IOP | Intraocular Pressure |
| IOL | Intraocular Lens |
| MD | Mean Deviation |
| MGO | Methylglyoxal |
| OAG | Open-Angle Glaucoma |
| POAG | Primary Open-Angle Glaucoma |
| RGC | Retinal Ganglion Cell |
| RMSE | Root Mean Square Error |
| sAF | Skin Autofluorescence |
| SBP | Systolic Blood Pressure |
| SERE | Subjective Spherical Equivalent Refractive Error |
| T1, T2, T3 | First, second, and third tertiles (age-based categories) |
| TM | Trabecular Meshwork |
| VIF | Variance Inflation Factor |
References
- Tham, Y.C.; Li, X.; Wong, T.Y.; Quigley, H.A.; Aung, T.; Cheng, C.Y. Global prevalence of glaucoma and projections of glaucoma burden through 2040: A systematic review and meta-analysis. Ophthalmology 2014, 121, 2081–2090. [Google Scholar] [CrossRef]
- Burton, M.J.; Ramke, J.; Marques, A.P.; Bourne, R.R.A.; Congdon, N.; Jones, I.; Ah Tong, B.A.M.; Arunga, S.; Bachani, D.; Bascaran, C.; et al. The Lancet Global Health Commission on Global Eye Health: Vision beyond 2020. Lancet Glob. Health 2021, 9, e489–e551. [Google Scholar] [CrossRef] [PubMed]
- Foster, A.; Resnikoff, S. The impact of Vision 2020 on global blindness. Eye 2005, 19, 1133–1135. [Google Scholar] [CrossRef]
- Weinreb, R.N.; Khaw, P.T. Primary open-angle glaucoma. Lancet 2004, 363, 1711–1720. [Google Scholar] [CrossRef] [PubMed]
- Hamanaka, T.; Sakurai, T.; Fuse, N.; Ishida, N.; Kumasaka, T.; Tanito, M. Comparisons of Schlemm’s canal and trabecular meshwork morphologies between juvenile and primary open angle glaucoma. Exp. Eye Res. 2021, 210, 108711. [Google Scholar] [CrossRef] [PubMed]
- Lutjen-Drecoll, E. Functional morphology of the trabecular meshwork in primate eyes. Prog. Retin Eye Res. 1999, 18, 91–119. [Google Scholar] [CrossRef]
- Ritch, R.; Schlotzer-Schrehardt, U. Exfoliation syndrome. Surv. Ophthalmol. 2001, 45, 265–315. [Google Scholar] [CrossRef]
- Schlotzer-Schrehardt, U.; Naumann, G.O. Ocular and systemic pseudoexfoliation syndrome. Am. J. Ophthalmol. 2006, 141, 921–937. [Google Scholar] [CrossRef]
- Nakabayashi, M. Review of the ischemia hypothesis for ocular hypertension other than congenital glaucoma and closed-angle glaucoma. Ophthalmologica 2004, 218, 344–349. [Google Scholar] [CrossRef]
- Takai, Y.; Tanito, M.; Ohira, A. Multiplex cytokine analysis of aqueous humor in eyes with primary open-angle glaucoma, exfoliation glaucoma, and cataract. Investig. Ophthalmol. Vis. Sci. 2012, 53, 241–247. [Google Scholar] [CrossRef]
- Umeno, A.; Yoshida, Y.; Kaidzu, S.; Tanito, M. Positive Association between Aqueous Humor Hydroxylinoleate Levels and Intraocular Pressure. Molecules 2022, 27, 2215. [Google Scholar] [CrossRef] [PubMed]
- You, L.; Lin, Y.; Zheng, Y.; Han, Z.; Zeng, L.; Chen, H. The Impact of Aging on Ocular Diseases: Unveiling Complex Interactions. Aging Dis. 2024; Online ahead of print. [Google Scholar] [CrossRef]
- Suzuki, Y.; Iwase, A.; Araie, M.; Yamamoto, T.; Abe, H.; Shirato, S.; Kuwayama, Y.; Mishima, H.K.; Shimizu, H.; Tomita, G.; et al. Risk factors for open-angle glaucoma in a Japanese population: The Tajimi Study. Ophthalmology 2006, 113, 1613–1617. [Google Scholar] [CrossRef]
- Leske, M.C.; Wu, S.Y.; Hennis, A.; Honkanen, R.; Nemesure, B. Risk factors for incident open-angle glaucoma: The Barbados Eye Studies. Ophthalmology 2008, 115, 85–93. [Google Scholar] [CrossRef]
- Shibata, N.; Tanito, M.; Mitsuhashi, K.; Fujino, Y.; Matsuura, M.; Murata, H.; Asaoka, R. Development of a deep residual learning algorithm to screen for glaucoma from fundus photography. Sci. Rep. 2018, 8, 14665. [Google Scholar] [CrossRef]
- Li, Z.; He, Y.; Keel, S.; Meng, W.; Chang, R.T.; He, M. Efficacy of a Deep Learning System for Detecting Glaucomatous Optic Neuropathy Based on Color Fundus Photographs. Ophthalmology 2018, 125, 1199–1206. [Google Scholar] [CrossRef]
- Chan, Y.K.; Cheng, C.Y.; Sabanayagam, C. Eyes as the windows into cardiovascular disease in the era of big data. Taiwan J. Ophthalmol. 2023, 13, 151–167. [Google Scholar] [CrossRef]
- DeBuc, D.C. AI for identification of systemic biomarkers from external eye photos: A promising field in the oculomics revolution. Lancet Digit. Health. 2023, 5, e249–e250. [Google Scholar] [CrossRef] [PubMed]
- Ghenciu, L.A.; Dima, M.; Stoicescu, E.R.; Iacob, R.; Boru, C.; Hațegan, O.A. Retinal Imaging-Based Oculomics: Artificial Intelligence as a Tool in the Diagnosis of Cardiovascular and Metabolic Diseases. Biomedicines 2024, 12, 2150. [Google Scholar] [CrossRef]
- Li, Z.; Yin, S.; Wang, S.; Wang, Y.; Qiang, W.; Jiang, J. Transformative applications of oculomics-based AI approaches in the management of systemic diseases: A systematic review. J. Adv. Res. 2024; in press. [Google Scholar] [CrossRef]
- Poplin, R.; Varadarajan, A.V.; Blumer, K.; Liu, Y.; McConnell, M.V.; Corrado, G.S.; Peng, L.; Webster, D.R. Prediction of cardiovascular risk factors from retinal fundus photographs via deep learning. Nat. Biomed. Eng. 2018, 2, 158–164. [Google Scholar] [CrossRef] [PubMed]
- Betzler, B.K.; Rim, T.H.; Sabanayagam, C.; Cheng, C.Y. Artificial Intelligence in Predicting Systemic Parameters and Diseases From Ophthalmic Imaging. Front. Digit. Health 2022, 4, 889445. [Google Scholar] [CrossRef]
- Nusinovici, S.; Rim, T.H.; Li, H.; Yu, M.; Deshmukh, M.; Quek, T.C.; Lee, G.; Chong, C.C.Y.; Peng, Q.; Xue, C.C.; et al. Application of a deep-learning marker for morbidity and mortality prediction derived from retinal photographs: A cohort development and validation study. Lancet Healthy Longev. 2024, 5, 100593. [Google Scholar] [CrossRef]
- Zhu, Z.; Hu, W.; Chen, R.; Xiong, R.; Wang, W.; Shang, X.; Chen, Y.; Kiburg, K.; Shi, D.; He, S.; et al. Retinal age gap as a predictive biomarker of stroke risk. BMC Med. 2022, 20, 466. [Google Scholar] [CrossRef]
- Zhu, Z.; Shi, D.; Guankai, P.; Tan, Z.; Shang, X.; Hu, W.; Liao, H.; Zhang, X.; Huang, Y.; Yu, H.; et al. Retinal age gap as a predictive biomarker for mortality risk. Br. J. Ophthalmol. 2023, 107, 547–554. [Google Scholar] [CrossRef] [PubMed]
- Zhu, Y.; Salowe, R.; Chow, C.; Li, S.; Bastani, O.; O’Brien, J.M. Advancing Glaucoma Care: Integrating Artificial Intelligence in Diagnosis, Management, and Progression Detection. Bioengineering 2024, 11, 122. [Google Scholar] [CrossRef] [PubMed]
- Ting, D.S.W.; Cheung, C.Y.; Nguyen, Q.; Sabanayagam, C.; Lim, G.; Lim, Z.W.; Tan, G.S.W.; Soh, Y.Q.; Schmetterer, L.; Wang, Y.X.; et al. Deep learning in estimating prevalence and systemic risk factors for diabetic retinopathy: A multi-ethnic study. NPJ Digit. Med. 2019, 2, 24. [Google Scholar] [CrossRef]
- Tanito, M.; Koyama, M. Fundus-Derived Predicted Age Acceleration in Glaucoma Patients Using Deep Learning and Propensity Score-Matched Controls. J. Clin. Med. 2025, 14, 2042. [Google Scholar] [CrossRef]
- Monnier, V.M. Nonenzymatic glycosylation, the Maillard reaction and the aging process. J. Gerontol. 1990, 45, B105–B111. [Google Scholar] [CrossRef]
- Tessier, F.J. The Maillard reaction in the human body. The main discoveries and factors that affect glycation. Pathol. Biol. 2010, 58, 214–219. [Google Scholar] [CrossRef]
- Verzijl, N.; DeGroot, J.; Thorpe, S.R.; Bank, R.A.; Shaw, J.N.; Lyons, T.J.; Bijlsma, J.W.; Lafeber, F.P.; Baynes, J.W.; TeKoppele, J.M. Effect of collagen turnover on the accumulation of advanced glycation end products. J. Biol. Chem. 2000, 275, 39027–39031. [Google Scholar] [CrossRef]
- Meerwaldt, R.; Graaff, R.; Oomen, P.H.N.; Links, T.P.; Jager, J.J.; Alderson, N.L.; Thorpe, S.R.; Baynes, J.W.; Gans, R.O.B.; Smit, A.J. Simple non-invasive assessment of advanced glycation endproduct accumulation. Diabetologia 2004, 47, 1324–1330. [Google Scholar] [CrossRef] [PubMed]
- Schweitzer, C.; Cougnard-Gregoire, A.; Rigalleau, V.; Dartigues, J.F.; Malet, F.; Rougier, M.B.; Delyfer, M.N.; Helmer, C.; Korobelnik, J.F.; Delcourt, C. Autofluorescence of Skin Advanced Glycation End Products as a Risk Factor for Open Angle Glaucoma: The ALIENOR Study. Investig. Ophthalmol. Vis. Sci. 2018, 59, 75–84. [Google Scholar] [CrossRef] [PubMed]
- Sugisawa, E.; Miura, J.; Iwamoto, Y.; Uchigata, Y. Skin autofluorescence reflects integration of past long-term glycemic control in patients with type 1 diabetes. Diabetes Care 2013, 36, 2339–2345. [Google Scholar] [CrossRef]
- Beisswenger, P.J.; Makita, Z.; Curphey, T.J.; Moore, L.L.; Jean, S.; Brinck-Johnsen, T.; Bucala, R.; Vlassara, H. Formation of immunochemical advanced glycosylation end products precedes and correlates with early manifestations of renal and retinal disease in diabetes. Diabetes 1995, 44, 824–829. [Google Scholar] [CrossRef] [PubMed]
- Kilhovd, B.K.; Juutilainen, A.; Lehto, S.; Rönnemaa, T.; Torjesen, P.A.; Hanssen, K.F.; Laakso, M. Increased serum levels of advanced glycation endproducts predict total, cardiovascular and coronary mortality in women with type 2 diabetes: A population-based 18 year follow-up study. Diabetologia 2007, 50, 1409–1417. [Google Scholar] [CrossRef]
- Meerwaldt, R.; Links, T.P.; Graaff, R.; Hoogenberg, K.; Lefrandt, J.D.; Baynes, J.W.; Gans, R.O.; Smit, A.J. Increased accumulation of skin advanced glycation end-products precedes and correlates with clinical manifestation of diabetic neuropathy. Diabetologia 2005, 48, 1637–1644. [Google Scholar] [CrossRef]
- Noordzij, M.J.; Mulder, D.J.; Oomen, P.H.; Brouwer, T.; Jager, J.; Castro Cabezas, M.; Lefrandt, J.D.; Smit, A.J. Skin autofluorescence and risk of micro- and macrovascular complications in patients with Type 2 diabetes mellitus-a multi-centre study. Diabet Med. 2012, 29, 1556–1561. [Google Scholar] [CrossRef]
- Tabara, Y.; Ikezoe, T.; Yamanaka, M.; Setoh, K.; Segawa, H.; Kawaguchi, T.; Kosugi, S.; Nakayama, T.; Ichihashi, N.; Tsuboyama, T.; et al. Advanced Glycation End Product Accumulation Is Associated With Low Skeletal Muscle Mass, Weak Muscle Strength, and Reduced Bone Density: The Nagahama Study. J. Gerontol. Biol. Sci. Med. Sci. 2019, 74, 1446–1453. [Google Scholar] [CrossRef]
- Tabara, Y.; Yamanaka, M.; Setoh, K.; Segawa, H.; Kawaguchi, T.; Kosugi, S.; Nakayama, T.; Matsuda, F. Advanced Glycation End Product Accumulation is Associated with Lower Cognitive Performance in an Older General Population: The Nagahama Study. J. Alzheimers Dis. 2020, 74, 741–746. [Google Scholar] [CrossRef]
- Băbţan, A.M.; Ilea, A.; Boşca, B.A.; Crişan, M.; Petrescu, N.B.; Collino, M.; Sainz, R.M.; Gerlach, J.Q.; Câmpian, R.S. Advanced glycation end products as biomarkers in systemic diseases: Premises and perspectives of salivary advanced glycation end products. Biomark Med. 2019, 13, 479–495. [Google Scholar] [CrossRef] [PubMed]
- Ehtewish, H.; Arredouani, A.; El-Agnaf, O. Diagnostic, Prognostic, and Mechanistic Biomarkers of Diabetes Mellitus-Associated Cognitive Decline. Int. J. Mol. Sci. 2022, 23, 6144. [Google Scholar] [CrossRef]
- Li, A.; Yan, J.; Zhao, Y.; Yu, Z.; Tian, S.; Khan, A.H.; Zhu, Y.; Wu, A.; Zhang, C.; Tian, X.L. Vascular Aging: Assessment and Intervention. Clin. Interv. Aging 2023, 18, 1373–1395. [Google Scholar] [CrossRef]
- Reurean-Pintilei, D.; Pantea Stoian, A.; Potcovaru, C.G.; Salmen, T.; Cinteză, D.; Stoica, R.A.; Lazăr, S.; Timar, B. Skin Autofluorescence as a Potential Adjunctive Marker for Cardiovascular Risk Assessment in Type 2 Diabetes: A Systematic Review. Int. J. Mol. Sci. 2024, 25, 3889. [Google Scholar] [CrossRef] [PubMed]
- Suzuki, A.; Yabu, A.; Nakamura, H. Advanced glycation end products in musculoskeletal system and disorders. Methods 2022, 203, 179–186. [Google Scholar] [CrossRef] [PubMed]
- Zhu, J.; Wang, Z.; Lv, C.; Li, M.; Wang, K.; Chen, Z. Advanced Glycation End Products and Health: A Systematic Review. Ann. Biomed. Eng. 2024, 52, 3145–3156. [Google Scholar] [CrossRef]
- Dyer, D.G.; Dunn, J.A.; Thorpe, S.R.; Bailie, K.E.; Lyons, T.J.; McCance, D.R.; Baynes, J.W. Accumulation of Maillard reaction products in skin collagen in diabetes and aging. J. Clin. Investig. 1993, 91, 2463–2469. [Google Scholar] [CrossRef]
- Li, X.; McClellan, M.E.; Tanito, M.; Garteiser, P.; Towner, R.; Bissig, D.; Berkowitz, B.A.; Fliesler, S.J.; Woodruff, M.L.; Fain, G.L.; et al. Loss of caveolin-1 impairs retinal function due to disturbance of subretinal microenvironment. J. Biol. Chem. 2012, 287, 16424–16434. [Google Scholar] [CrossRef]
- Nowotny, K.; Jung, T.; Grune, T.; Höhn, A. Accumulation of modified proteins and aggregate formation in aging. Exp. Gerontol. 2014, 57, 122–131. [Google Scholar] [CrossRef]
- Ishibashi, T.; Murata, T.; Hangai, M.; Nagai, R.; Horiuchi, S.; Lopez, P.F.; Hinton, D.R.; Ryan, S.J. Advanced glycation end products in age-related macular degeneration. Arch. Ophthalmol. 1998, 116, 1629–1632. [Google Scholar] [CrossRef]
- Kandarakis, S.A.; Piperi, C.; Topouzis, F.; Papavassiliou, A.G. Emerging role of advanced glycation-end products (AGEs) in the pathobiology of eye diseases. Prog. Retin. Eye Res. 2014, 42, 85–102. [Google Scholar] [CrossRef] [PubMed]
- Satish Kumar, M.; Mrudula, T.; Mitra, N.; Bhanuprakash Reddy, G. Enhanced degradation and decreased stability of eye lens alpha-crystallin upon methylglyoxal modification. Exp. Eye Res. 2004, 79, 577–583. [Google Scholar] [CrossRef]
- Amano, S.; Kaji, Y.; Oshika, T.; Oka, T.; Machinami, R.; Nagai, R.; Horiuchi, S. Advanced glycation end products in human optic nerve head. Br. J. Ophthalmol. 2001, 85, 52–55. [Google Scholar] [CrossRef] [PubMed]
- Hondur, G.; Göktas, E.; Yang, X.; Al-Aswad, L.; Auran, J.D.; Blumberg, D.M.; Cioffi, G.A.; Liebmann, J.M.; Suh, L.H.; Trief, D.; et al. Oxidative Stress-Related Molecular Biomarker Candidates for Glaucoma. Investig. Ophthalmol. Vis. Sci. 2017, 58, 4078–4088. [Google Scholar] [CrossRef]
- Tezel, G. Oxidative stress in glaucomatous neurodegeneration: Mechanisms and consequences. Prog. Retin. Eye Res. 2006, 25, 490–513. [Google Scholar] [CrossRef]
- Tezel, G.; Luo, C.; Yang, X. Accelerated aging in glaucoma: Immunohistochemical assessment of advanced glycation end products in the human retina and optic nerve head. Investig. Ophthalmol. Vis. Sci. 2007, 48, 1201–1211. [Google Scholar] [CrossRef]
- Ahn, J.M.; Kim, S.; Ahn, K.S.; Cho, S.H.; Lee, K.B.; Kim, U.S. A deep learning model for the detection of both advanced and early glaucoma using fundus photography. PLoS ONE 2018, 13, e0207982. [Google Scholar] [CrossRef] [PubMed]
- Lim, W.S.; Ho, H.Y.; Ho, H.C.; Chen, Y.W.; Lee, C.K.; Chen, P.J.; Lai, F.; Jang, J.R.; Ko, M.L. Use of multimodal dataset in AI for detecting glaucoma based on fundus photographs assessed with OCT: Focus group study on high prevalence of myopia. BMC Med. Imaging 2022, 22, 206. [Google Scholar] [CrossRef]
- Yamamoto, T.; Iwase, A.; Araie, M.; Suzuki, Y.; Abe, H.; Shirato, S.; Kuwayama, Y.; Mishima, H.K.; Shimizu, H.; Tomita, G.; et al. The Tajimi Study report 2: Prevalence of primary angle closure and secondary glaucoma in a Japanese population. Ophthalmology 2005, 112, 1661–1669. [Google Scholar] [CrossRef]
- Miyazaki, M.; Kubota, T.; Kubo, M.; Kiyohara, Y.; Iida, M.; Nose, Y.; Ishibashi, T. The prevalence of pseudoexfoliation syndrome in a Japanese population: The Hisayama study. J. Glaucoma 2005, 14, 482–484. [Google Scholar] [CrossRef]
- Tanito, M.; Matsuoka, Y. Proportion of Glaucoma Types and Surgeries Among Young, Pre-Old, Old, and Oldest-Old Age Groups or Different Sex Groups. Clin. Ophthalmol. 2022, 16, 1815–1819. [Google Scholar] [CrossRef] [PubMed]
- Konstas, A.G.P.; Ringvold, A. Epidemiology of Exfoliation Syndrome. J. Glaucoma 2018, 27 (Suppl. S1), S4–S11. [Google Scholar] [CrossRef]
- Leske, M.C.; Heijl, A.; Hyman, L.; Bengtsson, B.; Dong, L.; Yang, Z. Predictors of long-term progression in the early manifest glaucoma trial. Ophthalmology 2007, 114, 1965–1972. [Google Scholar] [CrossRef] [PubMed]
- Heijl, A.; Bengtsson, B.; Hyman, L.; Leske, M.C. Natural history of open-angle glaucoma. Ophthalmology 2009, 116, 2271–2276. [Google Scholar] [CrossRef] [PubMed]
- Hyman, L.; Heijl, A.; Leske, M.C.; Bengtsson, B.; Yang, Z. Natural history of intraocular pressure in the early manifest glaucoma trial: A 6-year follow-up. Arch. Ophthalmol. 2010, 128, 601–607. [Google Scholar] [CrossRef]
- Himori, N.; Kunikata, H.; Kawasaki, R.; Shiga, Y.; Omodaka, K.; Takahashi, H.; Miyata, T.; Nakazawa, T. The association between skin autofluorescence and mean deviation in patients with open-angle glaucoma. Br. J. Ophthalmol. 2017, 101, 233–238. [Google Scholar] [CrossRef]
- Kadoh, Y.; Takayanagi, Y.; Sasaki, J.; Tanito, M. Fingertip-Measured Skin Carotenoids and Advanced Glycation End Product Levels in Glaucoma. Antioxidants 2022, 11, 1138. [Google Scholar] [CrossRef]
- Shirakami, T.; Yamanaka, M.; Fujihara, J.; Matsuoka, Y.; Gohto, Y.; Obana, A.; Tanito, M. Advanced Glycation End Product Accumulation in Subjects with Open-Angle Glaucoma with and without Exfoliation. Antioxidants 2020, 9, 755. [Google Scholar] [CrossRef]
- Singh, R.; Barden, A.; Mori, T.; Beilin, L. Advanced glycation end-products: A review. Diabetologia 2001, 44, 129–146. [Google Scholar] [CrossRef]
- Dawczynski, J.; Vater, C.; Kasper, M.; Franke, S.; Augsten, R.; Jurkutat, S.; Strobel, J.; Königsdörffer, E. Advanced glycation end products and pseudoexfoliation—Correlation between clinical outcome and histological findings. Klin. Monbl. Augenheilkd. 2006, 223, 748–751. [Google Scholar] [CrossRef]
- Alvarado, J.A.; Murphy, C.G. Outflow obstruction in pigmentary and primary open angle glaucoma. Arch. Ophthalmol. 1992, 110, 1769–1778. [Google Scholar] [CrossRef]
- Tanito, M.; Kaidzu, S.; Takai, Y.; Ohira, A. Status of systemic oxidative stresses in patients with primary open-angle glaucoma and pseudoexfoliation syndrome. PLoS ONE 2012, 7, e49680. [Google Scholar] [CrossRef] [PubMed]
- Tanito, M.; Kaidzu, S.; Takai, Y.; Ohira, A. Correlation between Systemic Oxidative Stress and Intraocular Pressure Level. PLoS ONE 2015, 10, e0133582. [Google Scholar] [CrossRef] [PubMed]
- Zhou, L.; Li, Y.; Yue, B.Y. Oxidative stress affects cytoskeletal structure and cell-matrix interactions in cells from an ocular tissue: The trabecular meshwork. J. Cell Physiol. 1999, 180, 182–189. [Google Scholar] [CrossRef]
- Umeno, A.; Shichiri, M.; Ishida, N.; Hashimoto, Y.; Abe, K.; Kataoka, M.; Yoshino, K.; Hagihara, Y.; Aki, N.; Funaki, M.; et al. Singlet oxygen induced products of linoleates, 10- and 12-(Z,E)-hydroxyoctadecadienoic acids (HODE), can be potential biomarkers for early detection of type 2 diabetes. PLoS ONE 2013, 8, e63542. [Google Scholar] [CrossRef]
- Umeno, A.; Tanito, M.; Kaidzu, S.; Takai, Y.; Horie, M.; Yoshida, Y. Comprehensive measurements of hydroxylinoleate and hydroxyarachidonate isomers in blood samples from primary open-angle glaucoma patients and controls. Sci. Rep. 2019, 9, 2171. [Google Scholar] [CrossRef]
- Yoshida, Y.; Umeno, A.; Shichiri, M. Lipid peroxidation biomarkers for evaluating oxidative stress and assessing antioxidant capacity in vivo. J. Clin. Biochem. Nutr. 2013, 52, 9–16. [Google Scholar] [CrossRef]
- Umeno, A.; Tanito, M.; Kaidzu, S.; Takai, Y.; Yoshida, Y. Involvement of free radical-mediated oxidation in the pathogenesis of pseudoexfoliation syndrome detected based on specific hydroxylinoleate isomers. Free Radic. Biol. Med. 2020, 147, 61–68. [Google Scholar] [CrossRef]
- Yamanaka, M.; Matsumura, T.; Ohno, R.; Fujiwara, Y.; Shinagawa, M.; Sugawa, H.; Hatano, K.; Shirakawa, J.; Kinoshita, H.; Ito, K.; et al. Non-invasive measurement of skin autofluorescence to evaluate diabetic complications. J. Clin. Biochem. Nutr. 2016, 58, 135–140. [Google Scholar] [CrossRef]
- Thornalley, P.J. Pharmacology of methylglyoxal: Formation, modification of proteins and nucleic acids, and enzymatic detoxification--a role in pathogenesis and antiproliferative chemotherapy. Gen. Pharmacol. 1996, 27, 565–573. [Google Scholar] [CrossRef]
- Thornalley, P.J.; Westwood, M.; Lo, T.W.; McLellan, A.C. Formation of methylglyoxal-modified proteins in vitro and in vivo and their involvement in AGE-related processes. Contrib. Nephrol. 1995, 112, 24–31. [Google Scholar] [PubMed]
- Ando, K.; Beppu, M.; Kikugawa, K.; Nagai, R.; Horiuchi, S. Membrane proteins of human erythrocytes are modified by advanced glycation end products during aging in the circulation. Biochem. Biophys. Res. Commun. 1999, 258, 123–127. [Google Scholar] [CrossRef]
- Fu, M.X.; Requena, J.R.; Jenkins, A.J.; Lyons, T.J.; Baynes, J.W.; Thorpe, S.R. The advanced glycation end product, Nepsilon-(carboxymethyl)lysine, is a product of both lipid peroxidation and glycoxidation reactions. J. Biol. Chem. 1996, 271, 9982–9986. [Google Scholar] [CrossRef] [PubMed]
- Ritch, R.; Schlötzer-Schrehardt, U.; Konstas, A.G. Why is glaucoma associated with exfoliation syndrome? Prog. Retin. Eye Res. 2003, 22, 253–275. [Google Scholar] [CrossRef] [PubMed]
- Schlotzer-Schrehardt, U.; Khor, C.C. Pseudoexfoliation syndrome and glaucoma: From genes to disease mechanisms. Curr. Opin. Ophthalmol. 2021, 32, 118–128. [Google Scholar] [CrossRef]
- Schlötzer-Schrehardt, U. Molecular pathology of pseudoexfoliation syndrome/glaucoma—New insights from LOXL1 gene associations. Exp. Eye Res. 2009, 88, 776–785. [Google Scholar] [CrossRef]
- Sugihara, K.; Takai, Y.; Kawasaki, R.; Nitta, K.; Katai, M.; Kitaoka, Y.; Yokoyama, Y.; Omodaka, K.; Naito, T.; Yamashita, T.; et al. Comparisons between retinal vessel calibers and various optic disc morphologic parameters with different optic disc appearances: The Glaucoma Stereo Analysis Study. PLoS ONE 2021, 16, e0250245. [Google Scholar] [CrossRef]
- Takai, Y.; Tanito, M.; Omura, T.; Kawasaki, R.; Kawasaki, Y.; Ohira, A. Comparisons of retinal vessel diameter and glaucomatous parameters between both eyes of subjects with clinically unilateral pseudoexfoliation syndrome. PLoS ONE 2017, 12, e0179663. [Google Scholar] [CrossRef]
- Kawasaki, R.; Wang, J.J.; Rochtchina, E.; Lee, A.J.; Wong, T.Y.; Mitchell, P. Retinal vessel caliber is associated with the 10-year incidence of glaucoma: The Blue Mountains Eye Study. Ophthalmology 2013, 120, 84–90. [Google Scholar] [CrossRef]
- López-Otín, C.; Blasco, M.A.; Partridge, L.; Serrano, M.; Kroemer, G. Hallmarks of aging: An expanding universe. Cell 2023, 186, 243–278. [Google Scholar] [CrossRef]
- Schoepf, I.C.; Esteban-Cantos, A.; Thorball, C.W.; Rodés, B.; Reiss, P.; Rodríguez-Centeno, J.; Riebensahm, C.; Braun, D.L.; Marzolini, C.; Seneghini, M.; et al. Epigenetic ageing accelerates before antiretroviral therapy and decelerates after viral suppression in people with HIV in Switzerland: A longitudinal study over 17 years. Lancet Healthy Longev. 2023, 4, e211–e218. [Google Scholar] [CrossRef] [PubMed]
- Christopher, M.; Nakahara, K.; Bowd, C.; Proudfoot, J.A.; Belghith, A.; Goldbaum, M.H.; Rezapour, J.; Weinreb, R.N.; Fazio, M.A.; Girkin, C.A.; et al. Effects of Study Population, Labeling and Training on Glaucoma Detection Using Deep Learning Algorithms. Transl. Vis. Sci. Technol. 2020, 9, 27. [Google Scholar] [CrossRef]
- Bentata, R.; Cougnard-Grégoire, A.; Delyfer, M.N.; Delcourt, C.; Blanco, L.; Pupier, E.; Rougier, M.B.; Rajaobelina, K.; Hugo, M.; Korobelnik, J.F.; et al. Skin autofluorescence, renal insufficiency and retinopathy in patients with type 2 diabetes. J. Diabetes Complicat. 2017, 31, 619–623. [Google Scholar] [CrossRef]
- Gerrits, E.G.; Lutgers, H.L.; Kleefstra, N.; Graaff, R.; Groenier, K.H.; Smit, A.J.; Gans, R.O.; Bilo, H.J. Skin autofluorescence: A tool to identify type 2 diabetic patients at risk for developing microvascular complications. Diabetes Care 2008, 31, 517–521. [Google Scholar] [CrossRef] [PubMed]
- Yasuda, M.; Shimura, M.; Kunikata, H.; Kanazawa, H.; Yasuda, K.; Tanaka, Y.; Konno, H.; Takahashi, M.; Kokubun, T.; Maruyama, K.; et al. Relationship of skin autofluorescence to severity of retinopathy in type 2 diabetes. Curr. Eye Res. 2015, 40, 338–345. [Google Scholar] [CrossRef] [PubMed]
- Kiuchi, Y.; Inoue, T.; Shoji, N.; Nakamura, M.; Tanito, M. The Japan Glaucoma Society guidelines for glaucoma 5th edition. Jpn. J. Ophthalmol. 2023, 67, 189–254. [Google Scholar] [CrossRef]
- den Hollander, N.C.; Mulder, D.J.; Graaff, R.; Thorpe, S.R.; Baynes, J.W.; Smit, G.P.; Smit, A.J. Advanced glycation end products and the absence of premature atherosclerosis in glycogen storage disease Ia. J. Inherit. Metab. Dis. 2007, 30, 916–923. [Google Scholar] [CrossRef]
- McIntyre, N.J.; Fluck, R.J.; McIntyre, C.W.; Taal, M.W. Skin autofluorescence and the association with renal and cardiovascular risk factors in chronic kidney disease stage 3. Clin. J. Am. Soc. Nephrol. 2011, 6, 2356–2363. [Google Scholar] [CrossRef]


| Parameter | Control | POAG | EXG | p Value a | |||
|---|---|---|---|---|---|---|---|
| Mean ± SD or N (%) | 95% CI or N (%) | Mean ± SD or N (%) | 95% CI or N (%) | Mean ± SD or N (%) | 95% CI or N (%) | ||
| N | 79 eyes | 79 subjects | 79 eyes | 79 subjects | 79 eyes | 79 subjects | - |
| Sex, N (%) | Male, 35 (44) | Female, 44 (56) | Male, 37 (47) | Female, 42 (53) | Male, 39 (49) | Female, 40 (51) | 0.84 |
| BMI, kg/m2 | 22.6 ± 3.8 | 21.8, 23.5 | 23.0 ± 3.4 | 22.2, 23.7 | 22.8 ± 2.9 | 22.1, 23.4 | 0.81 |
| SBP, mmHg | 141.4 ± 23.9 | 136.0, 146.7 | 144.7 ± 21.1 | 139.9, 149.4 | 149.4 ± 20.4 | 144.8, 154.0 | 0.07 |
| DBP, mmHg | 75.9 ± 14.2 | 72.8, 79.1 | 78.1 ± 12.8 | 75.2, 81.0 | 78.9 ± 13.3 | 75.9, 81.9 | 0.37 |
| HR, cpm | 76.1 ± 13.5 | 64.9, 67.8 | 74.1 ± 11.8 | 71.4, 76.7 | 76.0 ± 12.4 | 73.2, 78.8 | 0.51 |
| Diabetes | Yes, 11 (14) | No, 68 (86) | Yes, 17 (22) | No, 62 (78) | Yes, 15 (19) | No, 64 (81) | 0.50 |
| BCVA, LogMAR | 0.2 ± 0.2 | 0.1, 0.3 | 0.3 ± 0.5 | 0.2, 0.4 | 0.4 ± 0.6 | 0.2, 0.5 | 0.06 |
| SERE, D | −0.7 ± 2.4 | −1.3, −0.2 | −2.1 ± 3.2 | −2.8, −1.4 | −1.4 ± 2.1 | −1.8, −0.9 | 0.006 ** |
| p Value b, vs. Control | - | 0.004 ** | 0.29 | - | |||
| p Value b, vs. POAG | - | - | 0.20 | - | |||
| Lens status | Phakia, 70 (89) | IOL, 9 (11) | Phakia, 31 (39) | IOL, 48 (61) | Phakia, 22 (28) | IOL, 57 (72) | <0.0001 ** |
| p Value b, vs. Control | - | <0.0001 ** | < 0.0001 ** | - | |||
| p Value b, vs. POAG | - | - | 0.18 | - | |||
| IOP, mmHg | 14.5 ± 2.9 | 13.9, 15.2 | 20.6 ± 8.5 | 18.7, 22.5 | 27.9 ± 11.7 | 25.3, 30.5 | <0.0001 ** |
| p Value b, vs. Control | - | <0.0001 ** | < 0.0001 ** | - | |||
| p Value b, vs. POAG | - | - | < 0.0001 ** | - | |||
| Parameter | Control | POAG | EXG | p Value a | |||
|---|---|---|---|---|---|---|---|
| Mean ± SD | 95% CI | Mean ± SD | 95% CI | Mean ± SD | 95% CI | ||
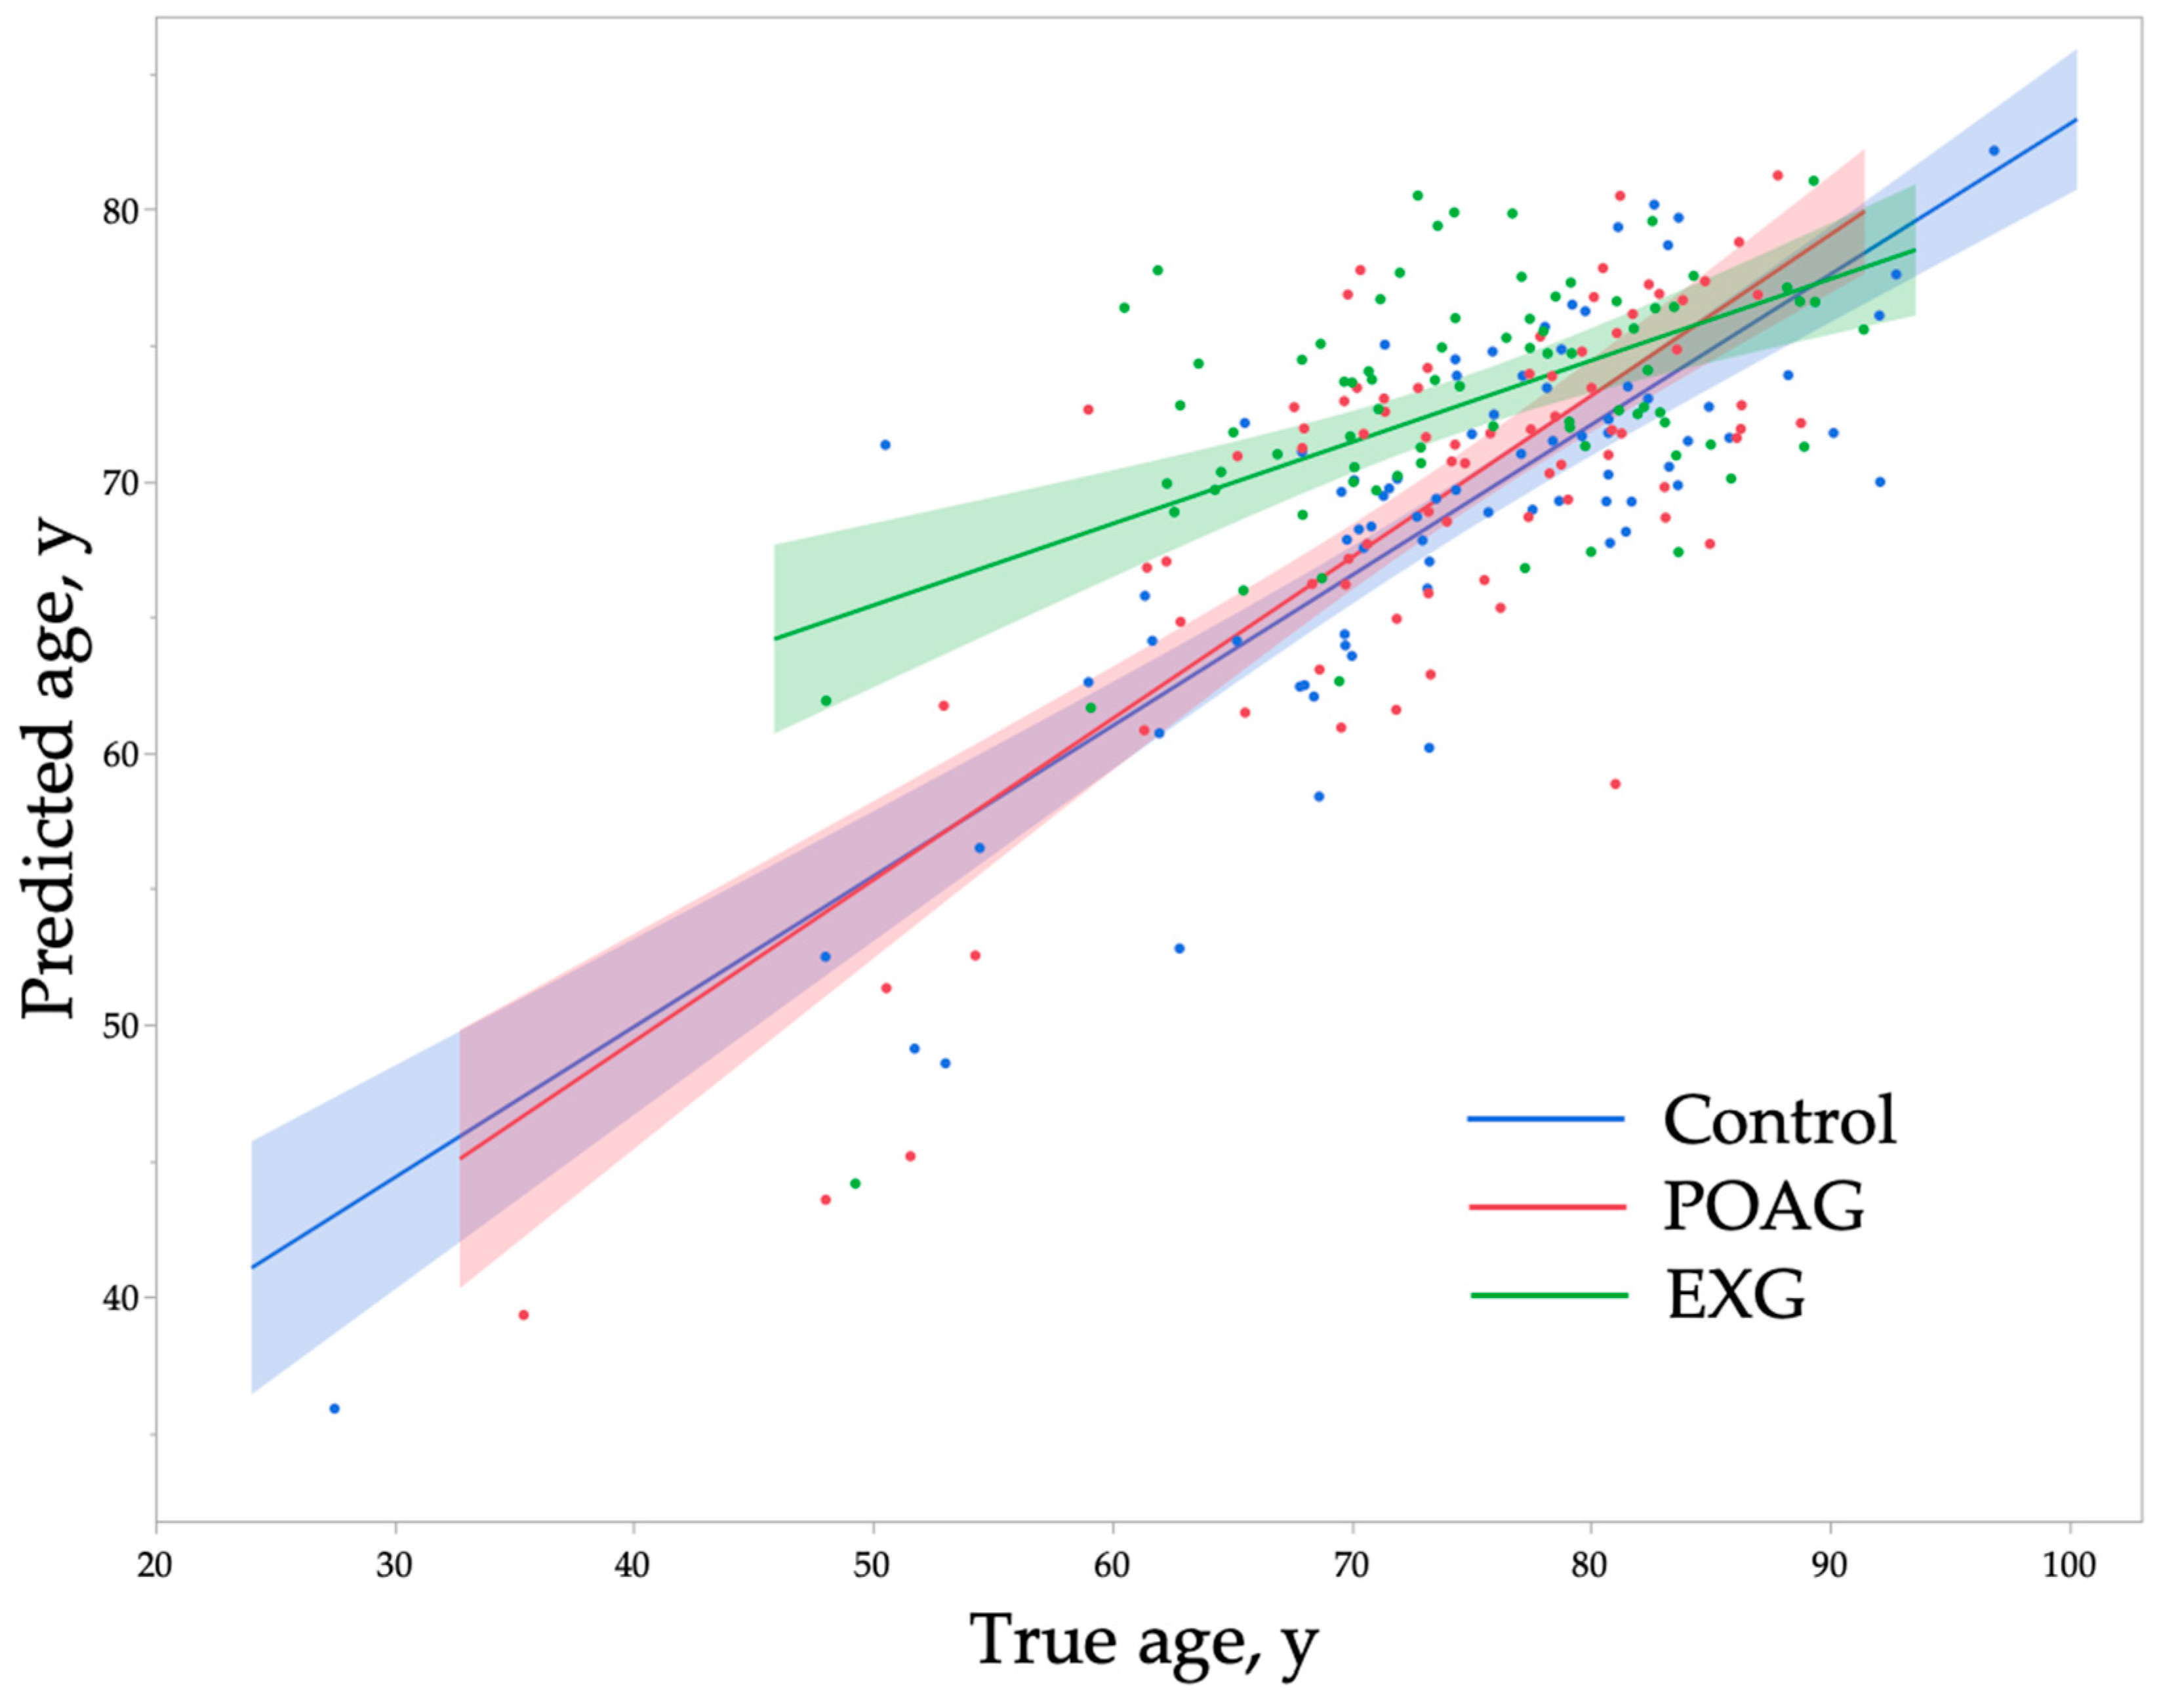
| True age, y | 74.0 ± 11.1 | 71.5, 76.4 | 73.7 ± 10.1 | 71.4, 75.9 | 74.6 ± 8.8 | 72.6, 76.6 | 0.84 |
| Predicted age, y | 68.7 ± 0.8 | 67.0, 70.4 | 69.4 ± 7.8 | 67.6, 71.1 | 72.8 ± 0.8 | 71.3, 74.3 | 0.0005 ** |
| p Value b, vs. Control | - | 0.82 | 0.0008 ** | - | |||
| p Value b, vs. POAG | - | - | 0.006 ** | - | |||
| Prediction difference, y | −5.3 ± 6.6 | −7.7, −3.8 | −4.3 ± 6.5 | −5.8, −2.9 | −1.8 ± 7.6 | −3.5, −0.1 | 0.006 ** |
| p Value b, vs. Control | - | 0.67 | 0.006 ** | - | |||
| p Value b, vs. POAG | - | - | 0.06 | - | |||
| Parameter | Estimate | 95% CI | p Value | VIF |
|---|---|---|---|---|
| True age, /y | −0.50 | −0.57, −0.43 | <0.0001 ** | 1.3 |
| Sex, F/M | 0.82 | −0.45, 2.09 | 0.20 | 1.1 |
| BMI, /cm/kg2 | 0.01 | −0.17, 0.20 | 0.90 | 1.1 |
| SBP, /mmHg | −0.03 | −0.06,0.01 | 0.15 | 1.6 |
| DBP, /mmHg | 0.04 | −0.02, 0.10 | 0.15 | 1.7 |
| HR, /cpm | 0.03 | −0.02, 0.08 | 0.20 | 1.1 |
| Diabetes, yes/no | 0.71 | −0.95, 2.36 | 0.40 | 1.1 |
| BCVA, /logMAR | 0.50 | −1.00, 2.00 | 0.51 | 1.2 |
| SERE, /D | 0.05 | −0.20, 0.31 | 0.67 | 1.2 |
| Lens, IOL/phakia | 1.98 | 0.44, 2.53 | 0.01 * | 1.6 |
| IOP, /mmHg | 0.04 | −0.04, 0.11 | 0.36 | 1.6 |
| EXG/Control | 2.13 | 0.19, 4.08 | 0.03 * | 2.3 |
| POAG/Control | −0.34 | −2.09, 1.41 | 0.70 | 1.8 |
| T1 (≤70.8 y) | T2 (70.8–79.2 y) | T3 (>79.2 y) | |||||||
|---|---|---|---|---|---|---|---|---|---|
| Control | POAG | EXG | Control | POAG | EXG | Control | POAG | EXG | |
| N | 26 | 27 | 26 | 26 | 26 | 27 | 27 | 26 | 26 |
| Predicted age, y | |||||||||
| Mean ± SD | 61.8 ± 8.4 | 64.4 ± 10.1 | 69.6 ± 6.7 | 70.6 ± 3.5 | 70.0 ± 3.6 | 74.6 ± 3.4 | 73.5 ± 4.0 | 73.9 ± 4.7 | 74.1 ± 3.4 |
| 95% CI | 56.8, 59.7 | 61.1, 67.6 | 66.3, 73.0 | 69.2, 72.0 | 68.5, 71.4 | 73.2, 75.9 | 71.9, 75.1 | 72.1, 75.8 | 72.7, 75.5 |
| p value | 0.005 ** | <0.0001 ** | 0.86 | ||||||
| Prediction difference, y | |||||||||
| Mean ± SD | −0.6 ± 6.5 | 1.3 ± 5.2 | 4.7 ± 5.6 | −4.2 ± 3.4 | −5.1 ± 3.8 | −0.3 ± 4.3 | −10.7 ± 5.1 | −9.3 ± 5.1 | −9.8 ± 4.2 |
| 95% CI | −3.3, 2.0 | −0.7, 3.4 | 2.4, 6.9 | −5.6, −2.9 | −6.7, −3.6 | −2.0, 1.4 | −12.7, −8.7 | −11.4, −7.3 | −111.5, −8.1 |
| p value | 0.006 ** | <0.0001 ** | 0.58 | ||||||
| T1 (≤70.8 y) | T2 (70.8–79.2 y) | T3 (>79.2 y) | ||||
|---|---|---|---|---|---|---|
| ρ | p-Value | ρ | p-Value | ρ | p-Value | |
| True age, y | 0.02 | 0.89 | 0.16 | 0.15 | 0.12 | 0.29 |
| Predicted age, y | 0.04 | 0.74 | 0.34 | 0.002 ** | −0.04 | 0.70 |
| Prediction difference, y | 0.03 | 0.79 | 0.22 | 0.048 * | −0.09 | 0.41 |
Disclaimer/Publisher’s Note: The statements, opinions and data contained in all publications are solely those of the individual author(s) and contributor(s) and not of MDPI and/or the editor(s). MDPI and/or the editor(s) disclaim responsibility for any injury to people or property resulting from any ideas, methods, instructions or products referred to in the content. |
© 2025 by the authors. Licensee MDPI, Basel, Switzerland. This article is an open access article distributed under the terms and conditions of the Creative Commons Attribution (CC BY) license (https://creativecommons.org/licenses/by/4.0/).
Share and Cite
Tanito, M.; Koyama, M. Accelerated Biological Aging in Exfoliation Glaucoma Assessed by Fundus-Derived Predicted Age and Advanced Glycation End Products. Int. J. Mol. Sci. 2025, 26, 4725. https://doi.org/10.3390/ijms26104725
Tanito M, Koyama M. Accelerated Biological Aging in Exfoliation Glaucoma Assessed by Fundus-Derived Predicted Age and Advanced Glycation End Products. International Journal of Molecular Sciences. 2025; 26(10):4725. https://doi.org/10.3390/ijms26104725
Chicago/Turabian StyleTanito, Masaki, and Makoto Koyama. 2025. "Accelerated Biological Aging in Exfoliation Glaucoma Assessed by Fundus-Derived Predicted Age and Advanced Glycation End Products" International Journal of Molecular Sciences 26, no. 10: 4725. https://doi.org/10.3390/ijms26104725
APA StyleTanito, M., & Koyama, M. (2025). Accelerated Biological Aging in Exfoliation Glaucoma Assessed by Fundus-Derived Predicted Age and Advanced Glycation End Products. International Journal of Molecular Sciences, 26(10), 4725. https://doi.org/10.3390/ijms26104725