Article

Genome-Wide Identification of 109 NAC Genes and Dynamic Expression Profiles Under Cold Stress in Madhuca longifolia

College of Forestry and Landscape Architecture, South China Agricultural University, Guangzhou 510642, China
*
Author to whom correspondence should be addressed.
Int. J. Mol. Sci. 2025, 26(10), 4713; https://doi.org/10.3390/ijms26104713
Submission received: 4 March 2025 / Revised: 6 May 2025 / Accepted: 12 May 2025 / Published: 14 May 2025
(This article belongs to the Special Issue Molecular Research in Bamboo, Tree, Grass, and Other Forest Products)

Abstract

Madhuca longifolia (M. longifolia), a tropical tree valued for its medicinal, nutritional, and industrial applications, exhibits severe sensitivity to low-temperature stress in subtropical regions, particularly during seedling establishment. To address this challenge, this study systematically identified 109 NAC genes in M. longifolia and characterized their functional roles in cold adaptation via multi-omics analyses. All NAC proteins were hydrophilic. Key members (e.g., MlNAC026, MlNAC077, MlNAC076) were localized in the nucleus. Phylogenetic analysis grouped them with ANAC072 (RD26), a homolog involved in leaf senescence and ABA-regulated cold stress responses. The NAC family expanded primarily through segmental duplication. And low Ka/Ks ratios (<1) indicated purifying selection. Promoter analysis highlighted the prevalence of dehydration-responsive DRE and LTR cis-acting elements. Transcriptomic profiling under cold stress identified five continuous differentially expressed genes (MlNAC026, MlNAC040, MlNAC059, MlNAC077, and MlNAC078) linked to regulatory functions. Homology modeling predicted 3D structures of cold-responsive NAC proteins, and STRING network analysis indicated independent regulatory mechanisms due to the absence of prominent interaction nodes. These findings advance our understanding of NAC-mediated cold tolerance and offer genetic targets to enhance M. longifolia resilience in subtropical climates.

1. Introduction

Madhuca longifolia (M. longifolia), a traditionally significant medicinal plant in India, is valued for its flowers, seeds, and bark, which exhibit antidiabetic, anti-inflammatory, antimicrobial, and antioxidant properties [1]. Studies highlight the potential of its seed oil in food industries and pharmaceutical development, while its flowers show efficacy in combating anemia and metabolic disorders [2]. Based on our previous study revealing the cold damage symptoms of M. longifolia under low-temperature stress after its introduction to southern subtropical China, this paper further investigates the functional roles of MlNAC genes in response to cold adaptation challenges. Our earlier findings demonstrated that autumn and winter cold spells (air temperature dropping to ~10 °C) during bud emergence from soil severely impair young shoots and leaves, causing irreversible wilting, growth arrest, and even seedling death despite subsequent temperature recovery [3]. These symptoms align with typical cold injury (>0 °C) mechanisms, including membrane rigidification, protein complex destabilization, and water loss-induced cellular dehydration. Breeding cold-resistant varieties is critical to expanding its cultivation under climate change [4]. Genomic studies targeting cold-responsive genes (e.g., NAC transcription factors) could provide molecular tools for breeding [3].
NAC transcription factors are plant-specific regulatory proteins with a conserved N-terminal DNA-binding domain and a variable C-terminal regulatory region, playing vital roles in growth and stress responses. Under cold stress, NAC transcription factors enhance cold tolerance by regulating downstream genes involved in antioxidant enzyme synthesis and osmotic adjustment. For example, the S-acylation cycle of the transcription factor MtNAC80 has an impact on the cold stress response of alfalfa (Medicago sativa) [5]. Meta-analysis indicates that NAC overexpression (e.g., PbeNAC1, SlNAC) activates cold-responsive pathways, stabilizing cell membranes and enhancing reactive oxygen species scavenging [6]. These findings underscore the pivotal role of NAC transcription factors in cold adaptation, with their molecular mechanisms and gene-editing applications holding promise for developing stress-resistant crops.
Members of the NAC family have been identified in various plant species, including Arabidopsis thaliana [7,8], Oryza sativa (rice) [9], chenopodium quinoa [10], Malus domestica (apple) [11], Actinidia spp. (kiwifruit) [12], Solanum tuberosum [13], Solanum lycopersicum (tomato) [14], Zea mays (maize) [15], Brassica rapa (Chinese cabbage) [16], and Manihot esculenta (cassava) [17]. Although comprehensive identification and analysis of the NAC gene family have been conducted in model plants, exploration in non-model species, particularly tropical woody trees, remains limited. With the completion of the M. longifolia genome sequencing, we identified 109 NAC genes and performed detailed analyses of their phylogenetic relationships, genomic structures, conserved motifs, expansion patterns, and expression profiles under low-temperature stress. Multi-dimensional evolutionary analyses were conducted to elucidate functional roles, while the correlation between cis-regulatory element abundance and cold-responsive expression profiles revealed potential regulatory mechanisms in tropical trees. Three-dimensional homology modeling of key cold-regulated proteins and construction of NAC protein interaction networks further explored their roles in cold stress at the proteomic level [18]. Integrating genomic, transcriptomic, and proteomic data enabled a multi-omics approach to uncover the potential functions of these genes [19].
The prolonged growth cycles of woody plants and the challenges in establishing genetic transformation systems have significantly hindered their improvement. However, our exploration of non-model woody plants should not cease. This study identifies key cold-responsive MlNAC genes using integrated transcriptomic and genomic data, offering insights for enhancing cold tolerance in M. longifolia and related species.

2. Results

2.1. Identification of NAC Transcription Factors and Analysis of Protein Physicochemical Properties in M. longifolia

Through the BLAST function in TBtools (v2.110) and the prediction by HMMER 3.0, we finally identified 109 MlNAC genes from M. longifolia genome. These genes were named MlNAC001MlNAC109 according to their positions on the chromosomes (Supplementary Table S1). The number of amino acids encoded by MlNAC genes ranges from 111 to 1121, with an average of approximately 369. The molecular weight spans from 12,421.07 kDa to 123,393.1 kDa. The isoelectric point varies from 4.46 to 10.7. The aliphatic amino acid index ranges from 46.58 to 85.17, and the average is 65.08. The instability index ranges from 24.26 to 62.95. The instability index indicates that 22 proteins are stable (instability index < 40), while the remaining proteins are unstable. All proteins are hydrophilic, as evidenced by their negative average hydrophilicity values. According to the prediction of subcellular localization, we mainly localized the 109 proteins in the nucleus. A small number is present in the cytoplasm, mitochondria, and other locations (Table 1).

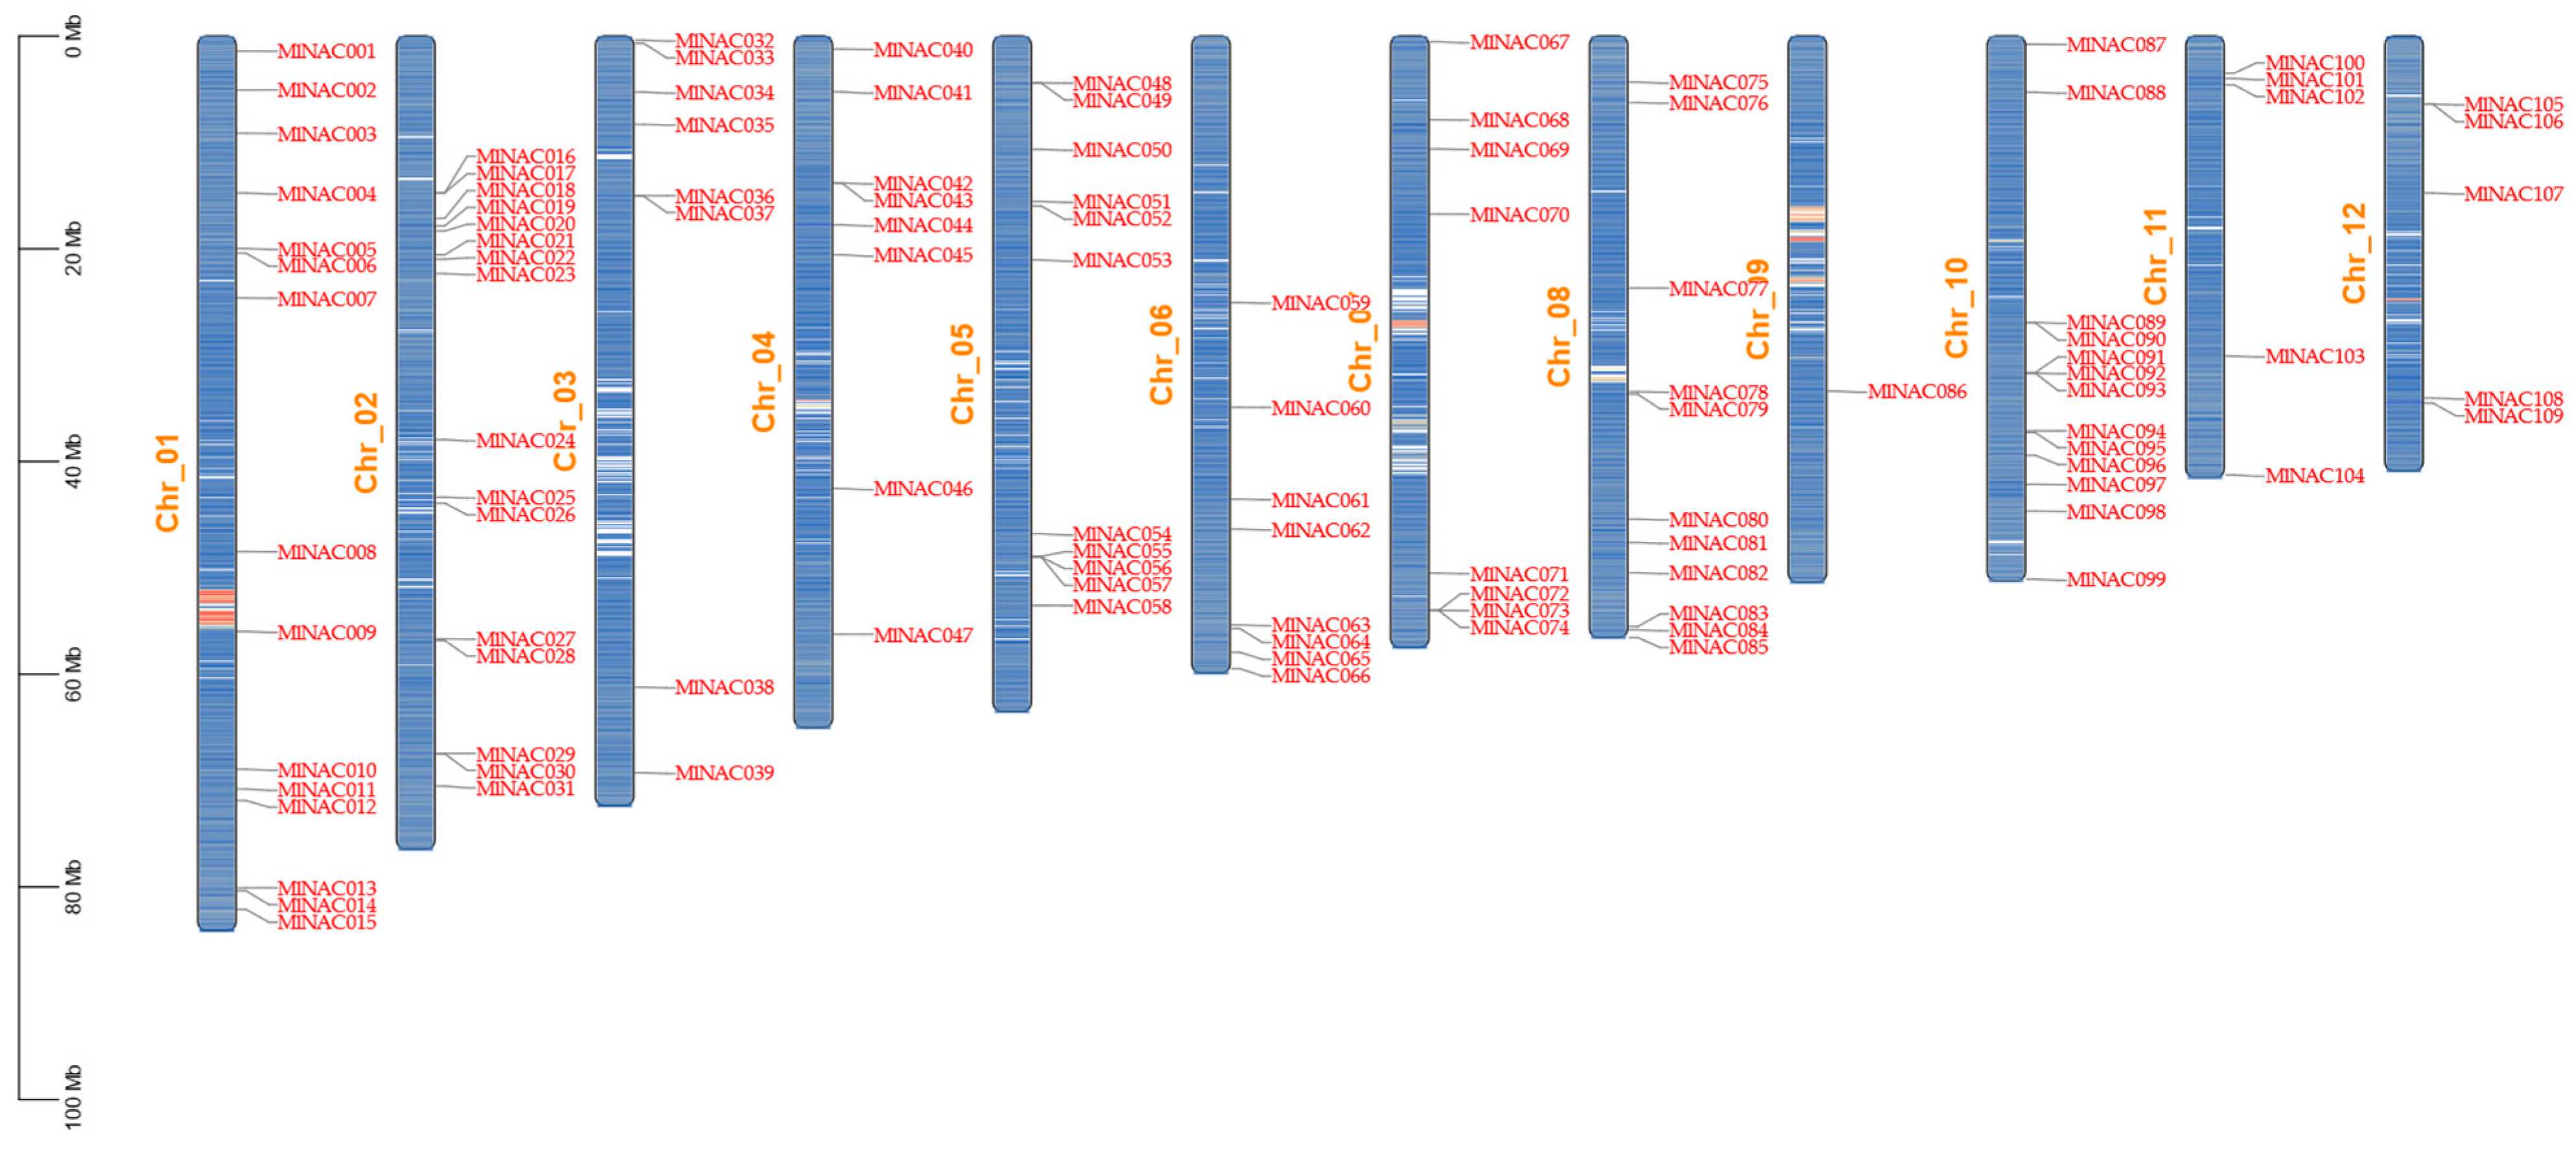
2.2. Chromosomal Localization of MlNAC Gene Family Members

According to the annotation file, we unevenly mapped 109 MlNAC genes onto 12 chromosomes (Figure 1). Chromosome 1 contains the largest number of NAC genes, with 16 in total. Chromosome 9 has the fewest MlNAC members, with only 1 MlNAC gene. It is worth noting that some MlNAC genes exist in clusters of two or three, while others exist individually. Some of the genes that exist in clusters are closely related in the phylogenetic tree, and they may jointly perform the same functions (such as MlNAC42 and MlNAC43, MlNAC73 and MlNAC74). In addition, most of the genes on the same chromosome belong to different subfamilies in the phylogenetic tree. It is speculated that the genes on the same chromosome may perform different functions.

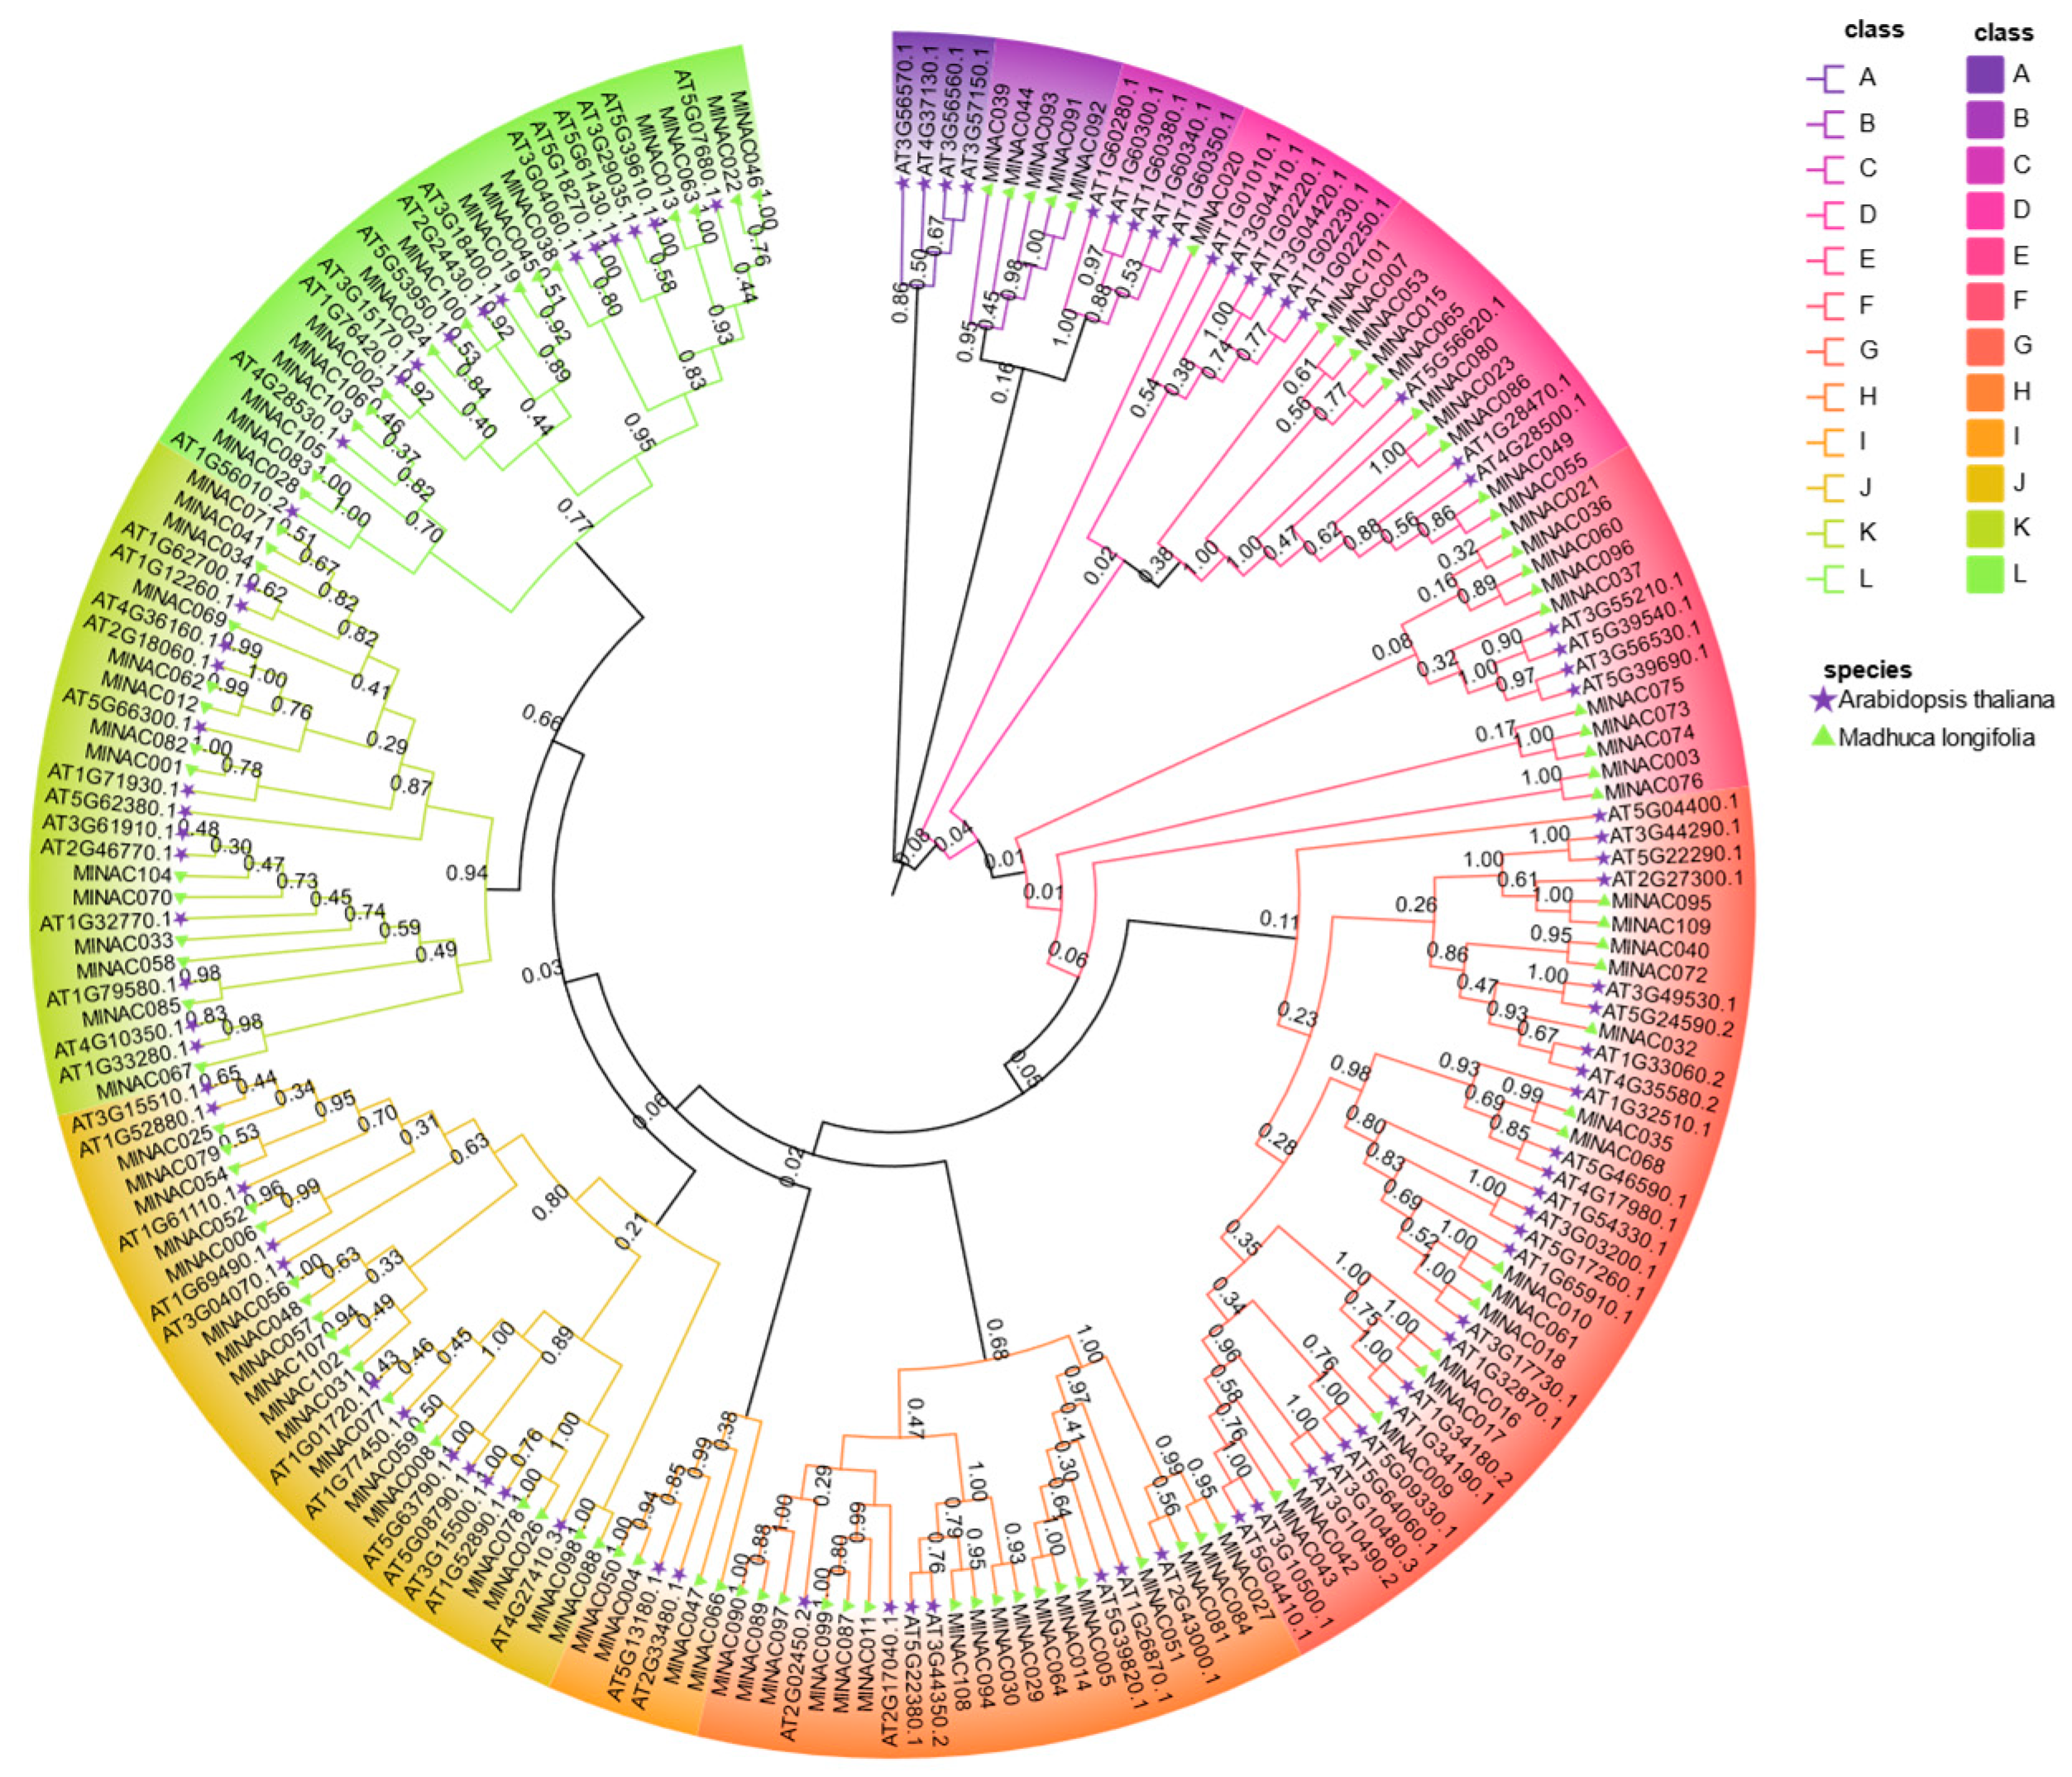
2.3. Phylogenetic Studies of the NAC Transcription Factor Family in M. longifolia

The phylogenetic tree of MlNAC proteins enables us to classify the NAC protein family in M. longifolia into eight subfamilies (Figure 2). For the sake of simplicity, these subfamilies are designated as A to H in alphabetical order. Among these subgroups, the largest one is Subfamily E, which contains 19 genes. The smallest subgroup is Subfamily A, which only contains four genes.
To further explore the evolutionary interrelationships of MlNAC genes, we constructed a phylogenetic tree using 94 NAC proteins from Arabidopsis thaliana and the NAC protein sequences of M. longifolia. These proteins were jointly classified into 12 groups (Figure 3). Based on the evolutionary relationships, we were able to further infer the functions of the genes in M. longifolia that have a close evolutionary relationship with those in Arabidopsis thalian.
Similarly, we also constructed a phylogenetic tree using NAC protein sequences from Malus domestica and M. longifolia. These proteins were classified into nine distinct groups (Figure 4). Based on the evolutionary relationships, we inferred the potential functions of MlNAC protein closely related to apple NAC genes by referencing the well-characterized roles of apple genes. MdNACs, particularly involved in pigment regulation (e.g., anthocyanin biosynthesis), may provide a useful reference to understand the corresponding MlNAC roles.
Based on the phylogenetic analysis of NAC protein sequences from Medicago truncatula and M. longifolia, we categorized these proteins into 11 distinct clades (Figure 5). Although MtNAC80 and MlNAC030 were found to share a relatively close evolutionary relationship, the low bootstrap support value (0.63 < 0.7) raises uncertainty regarding the robustness of this clustering. Consequently, whether MlNAC030 possesses an S-acylation cycle analogous to that of MtNAC80—a mechanism critical for regulating cold stress responses in Medicago truncatula through nuclear translocation and activation of antioxidant pathways like MtGSTU1—remains to be experimentally validated [20,21]. We need to have a further investigation on MlNAC30 (e.g., functional assays and expressional profiling under cold stress).

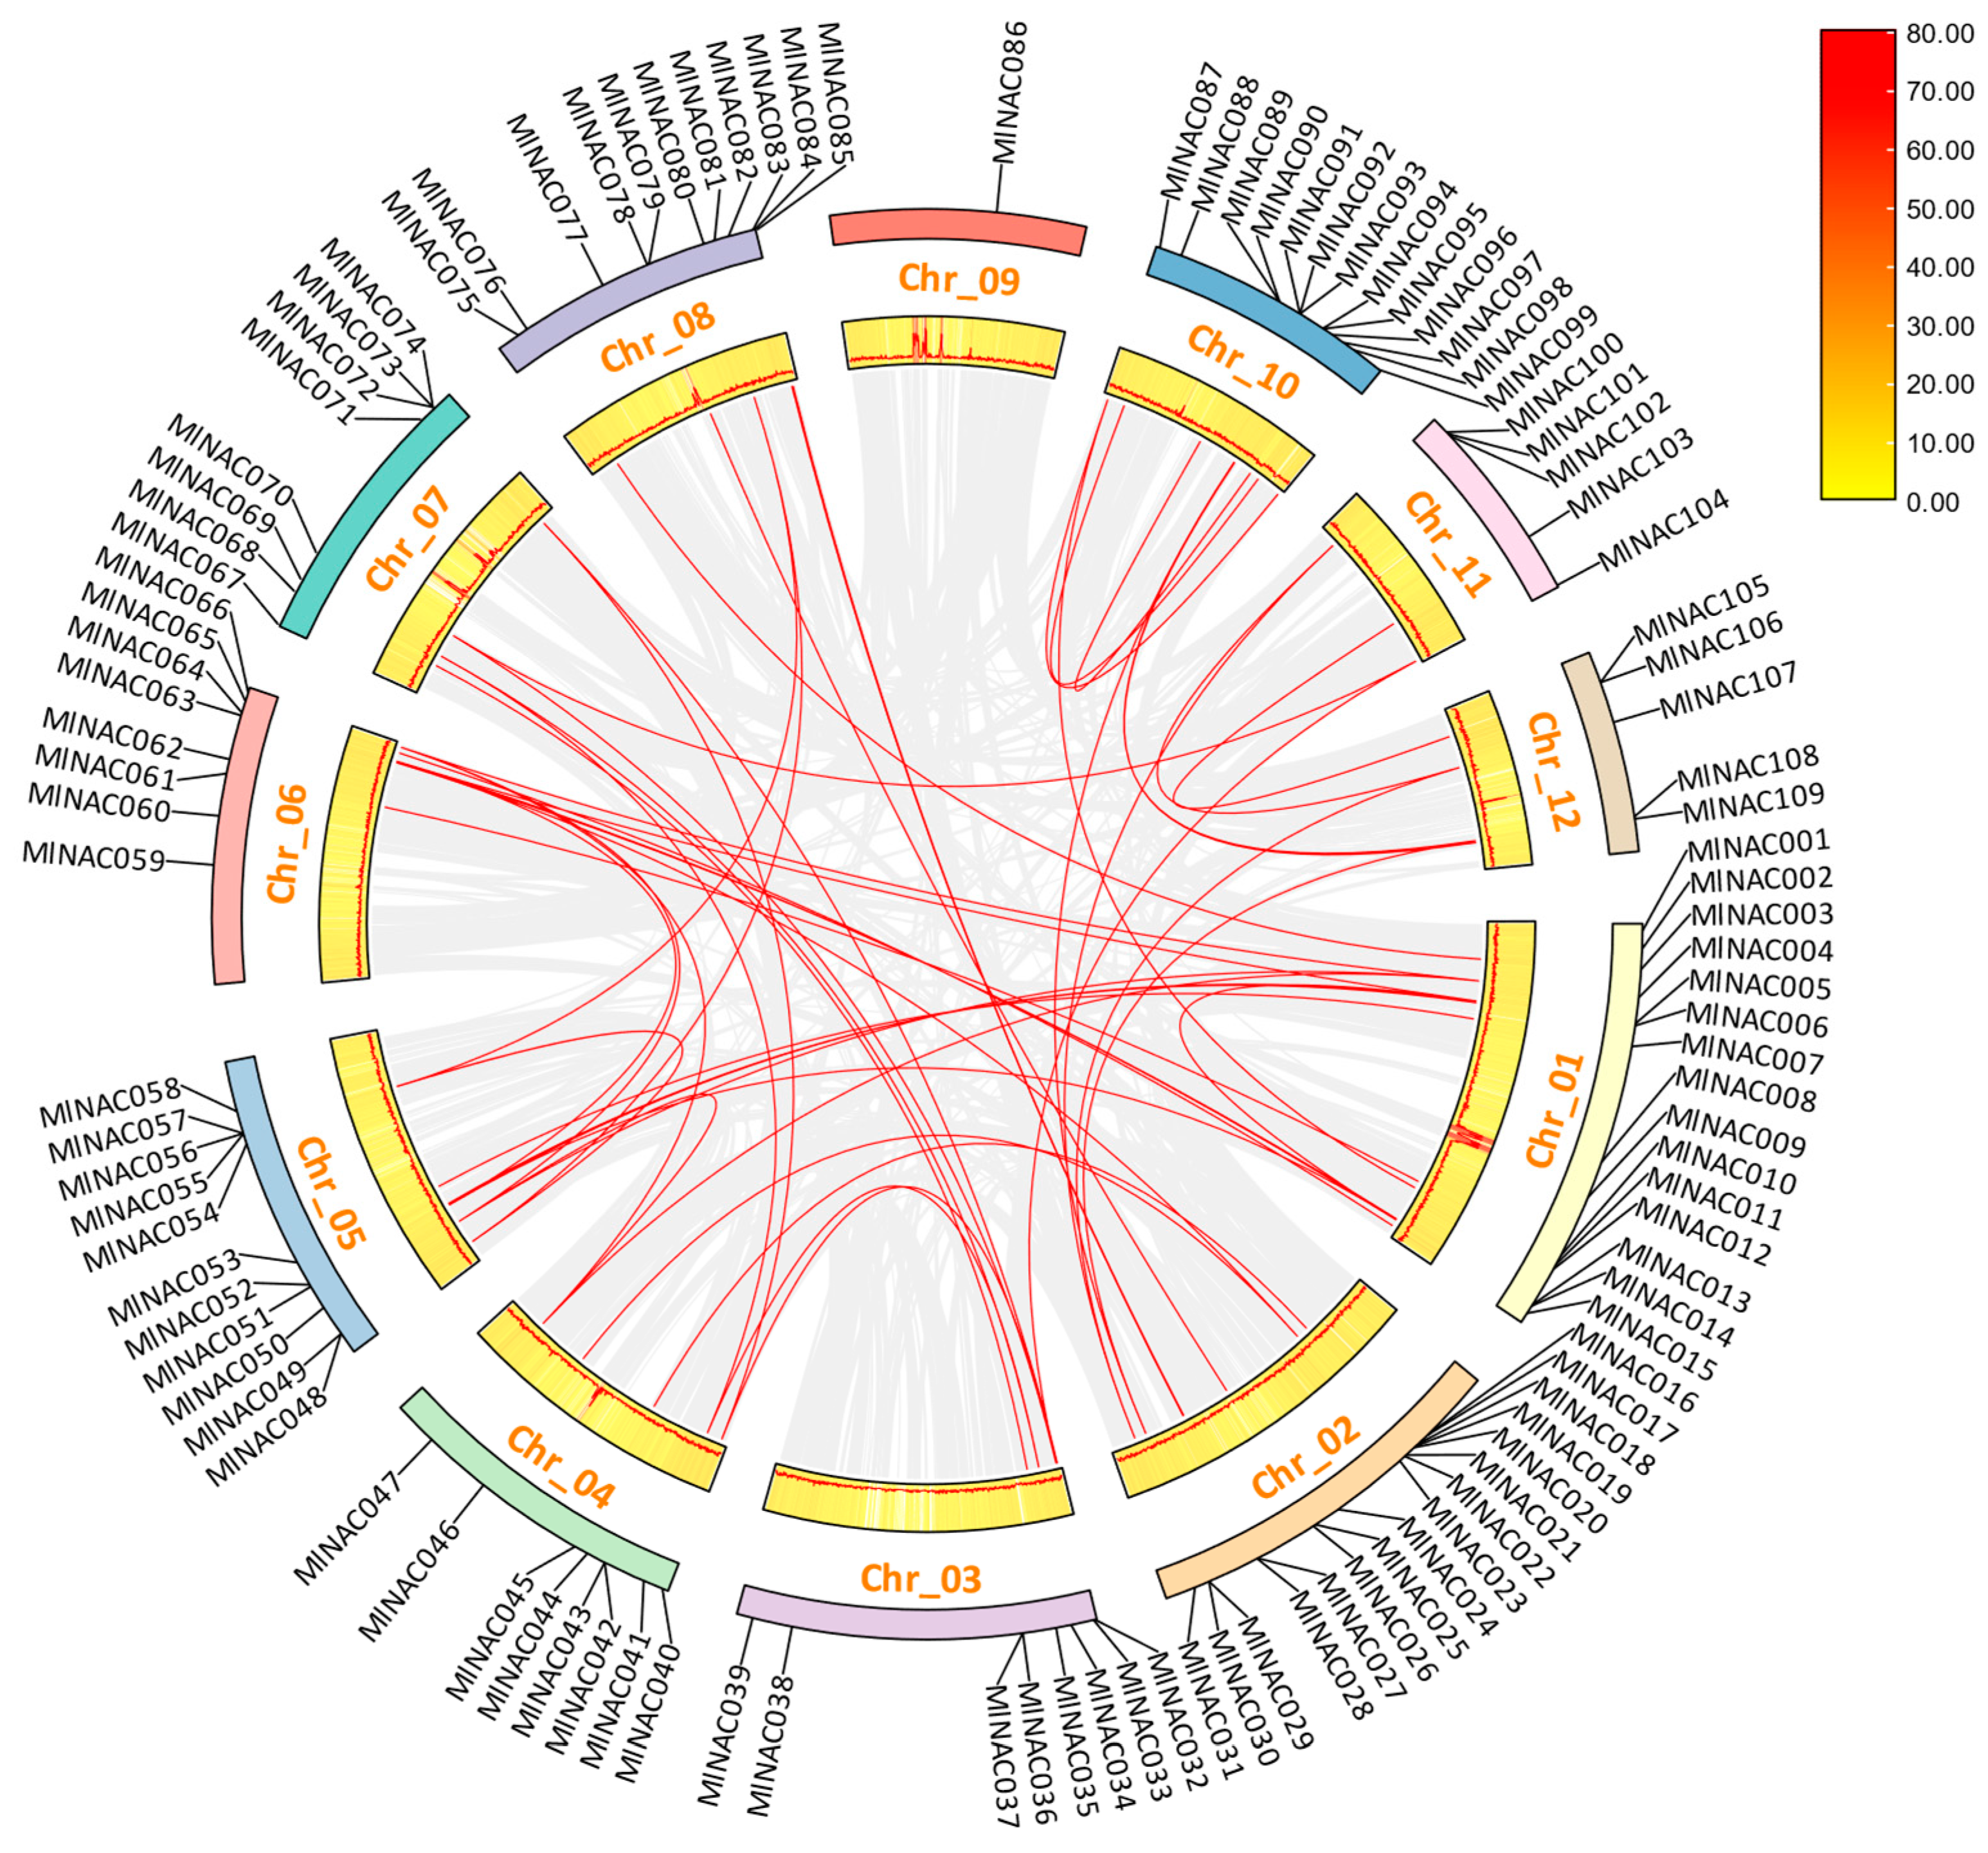
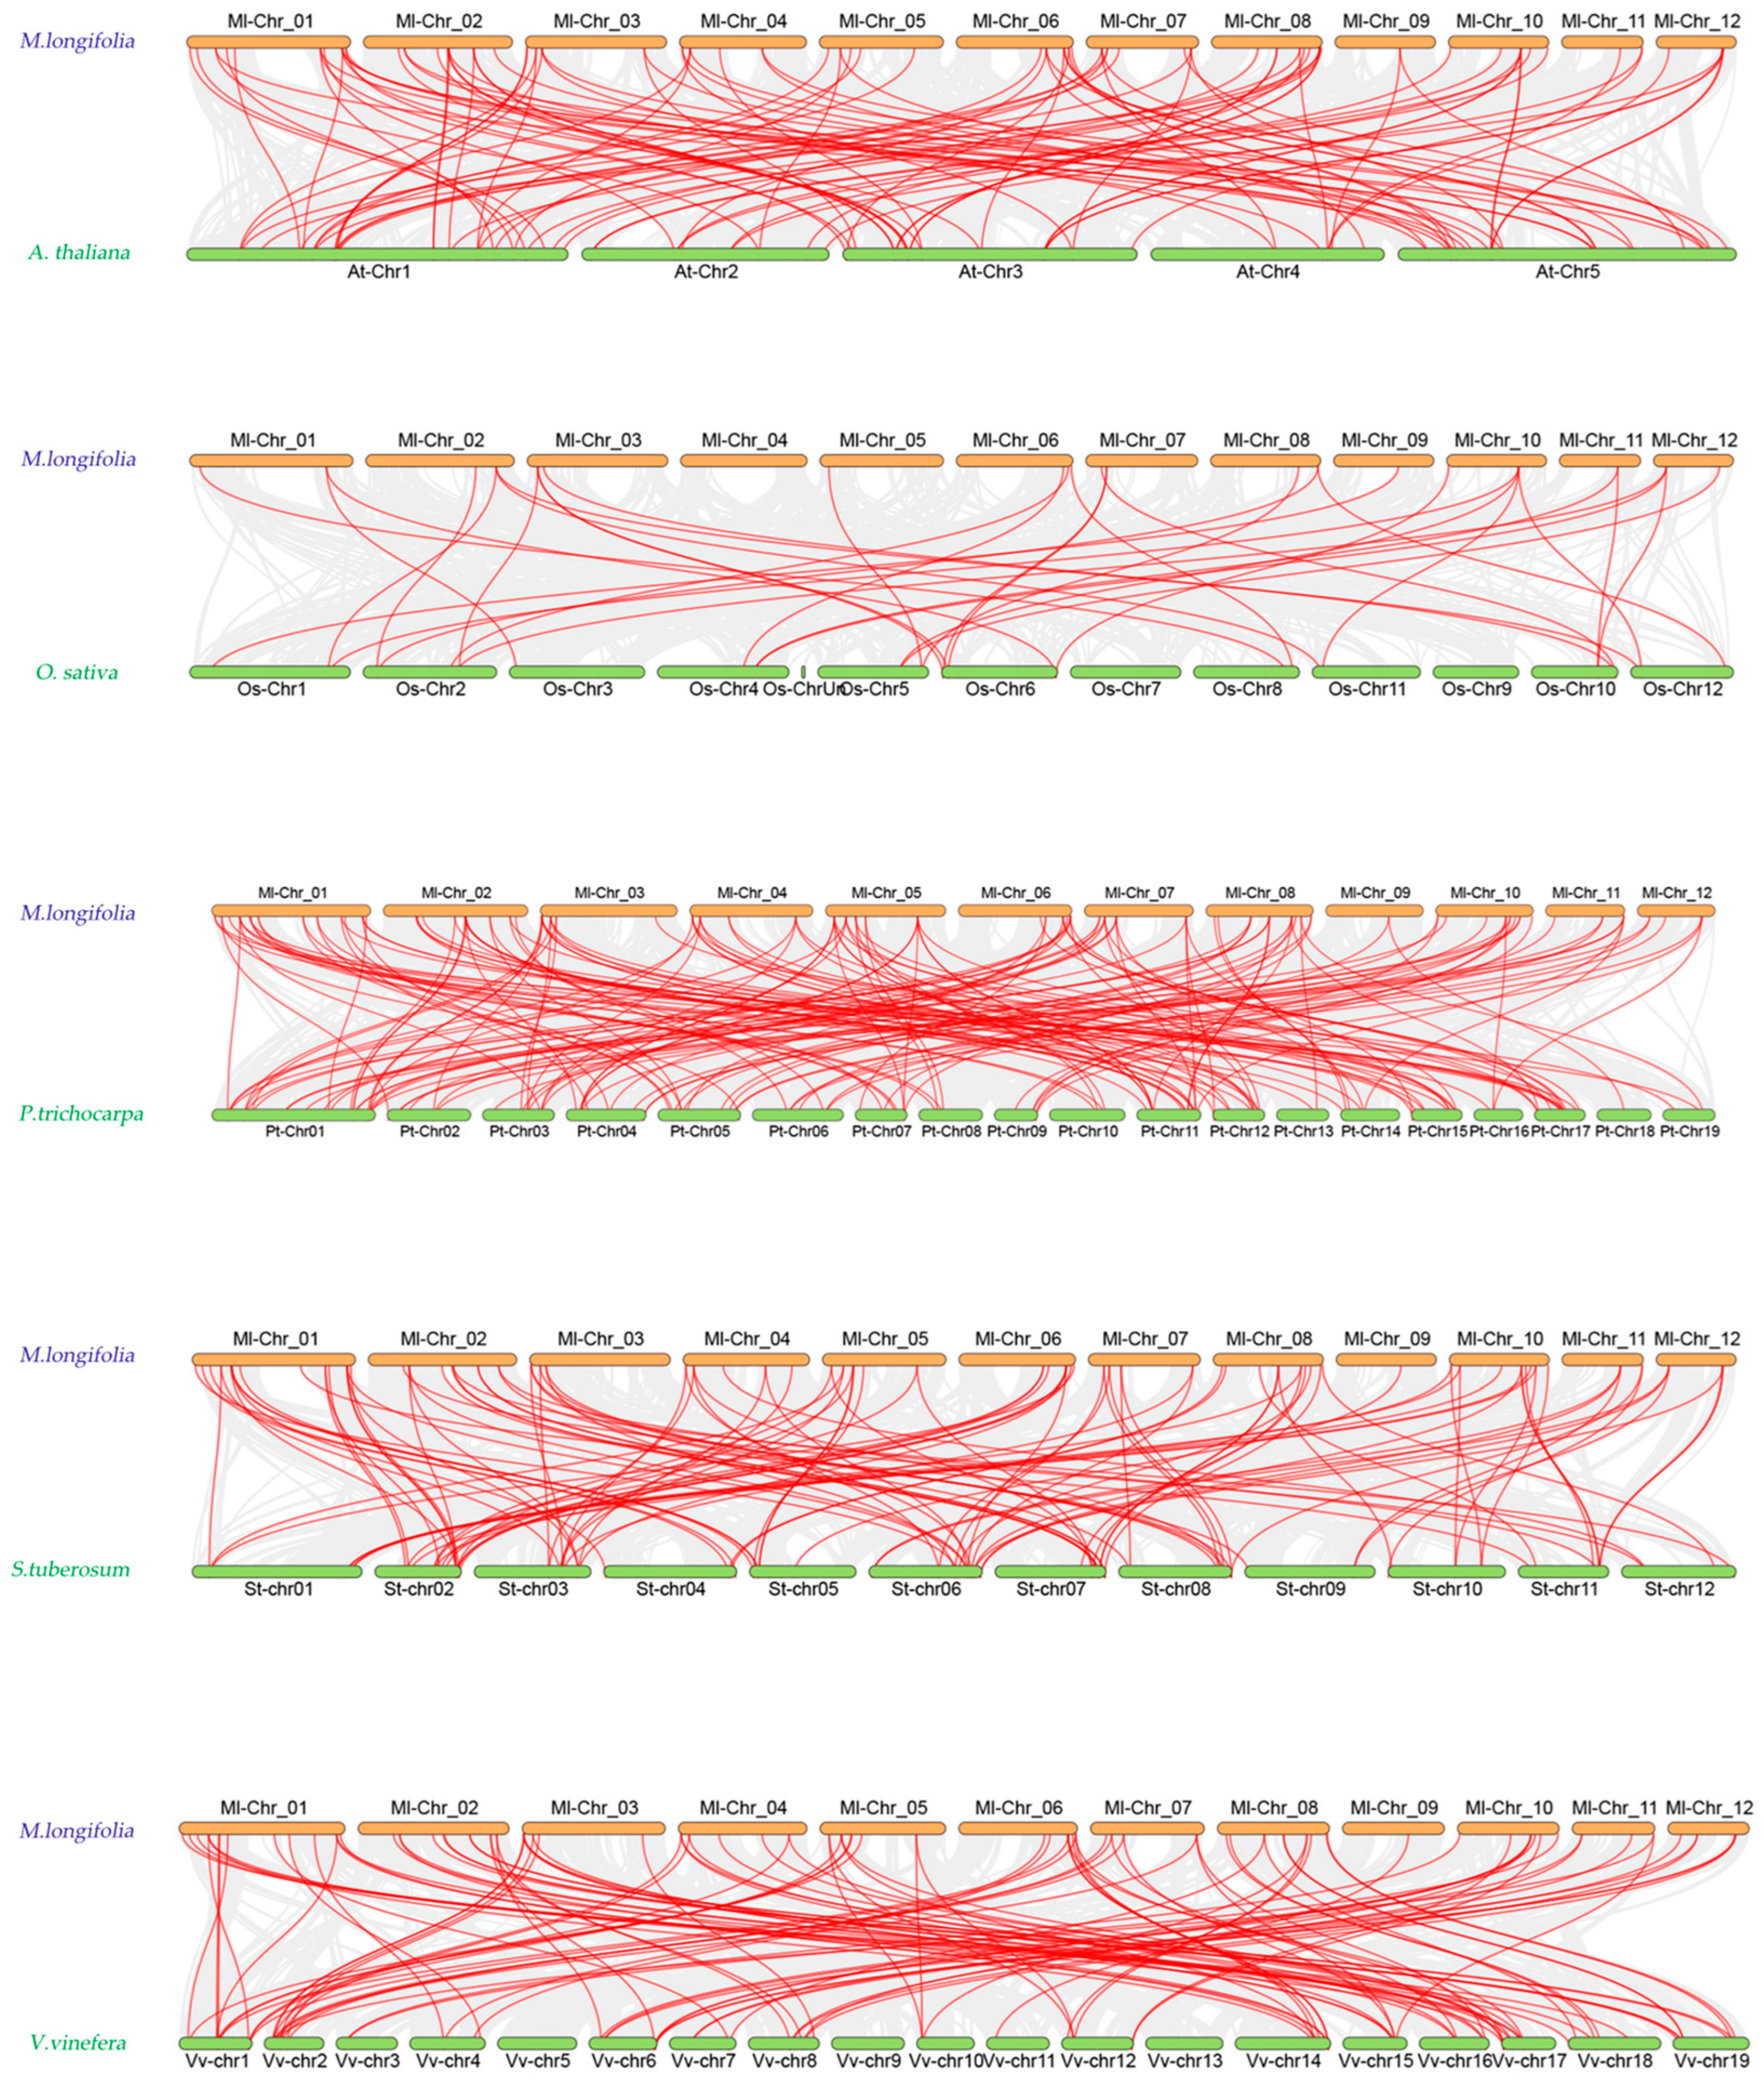
2.4. Analysis of Intraspecific and Interspecific Collinearity of NAC Family Genes in M. longifolia

Gene duplication occurs through multiple mechanisms, with segmental duplication, tandem duplication, and whole-genome duplication (WGD). WGD is the primary driver of gene family expansion during evolution [22,23,24,25,26]. These duplication events contribute to the diversification of plant physiological and morphological traits. A comparative analysis of NAC protein sequences in M. longifolia revealed 50 segmental duplication pairs (Figure 6) and six tandem duplication pairs among its 109 MlNAC genes. These findings suggest that segmental duplication events played a significant role in the evolutionary expansion of the MlNACs.
The Ka/Ks ratio serves as a pivotal indicator for evaluating evolutionary selection pressures (Table 2). When the Ka/Ks ratio is consistently observed to be less than 1, it strongly suggests that the gene has undergone purifying selection, a process that filters out deleterious mutations to maintain functional stability of the encoded protein.
To further explore the evolutionary relationships of NAC genes across different species, we conducted an interspecific collinearity analysis between M. longifolia and Populus trichocarpa, Arabidopsis thaliana, Oryza sativa, Vitis vinifera and Solanum tuberosum (Figure 7). The NAC family members of M. longifolia exhibited the highest number of collinear pairs (162 pairs) with Populus trichocarpa, indicating a close evolutionary relationship between these two species. In contrast, M. longifolia showed the fewest collinear pairs (33 pairs) with Oryza sativa, reflecting their distant evolutionary divergence. Dicotyledonous plants (e.g., Populus trichocarpa and M. longifolia) share stronger collinearity due to shared whole-genome duplication (WGD) events. Monocotyledons (e.g., Oryza sativa) exhibit fewer collinear pairs with dicots. This observation aligns with the broader pattern. Additionally, examining whether a single gene corresponds to multiple homologs could further elucidate functional diversification within the M. longifolia NAC family, as gene duplication is a key driver of NAC family expansion and functional innovation.

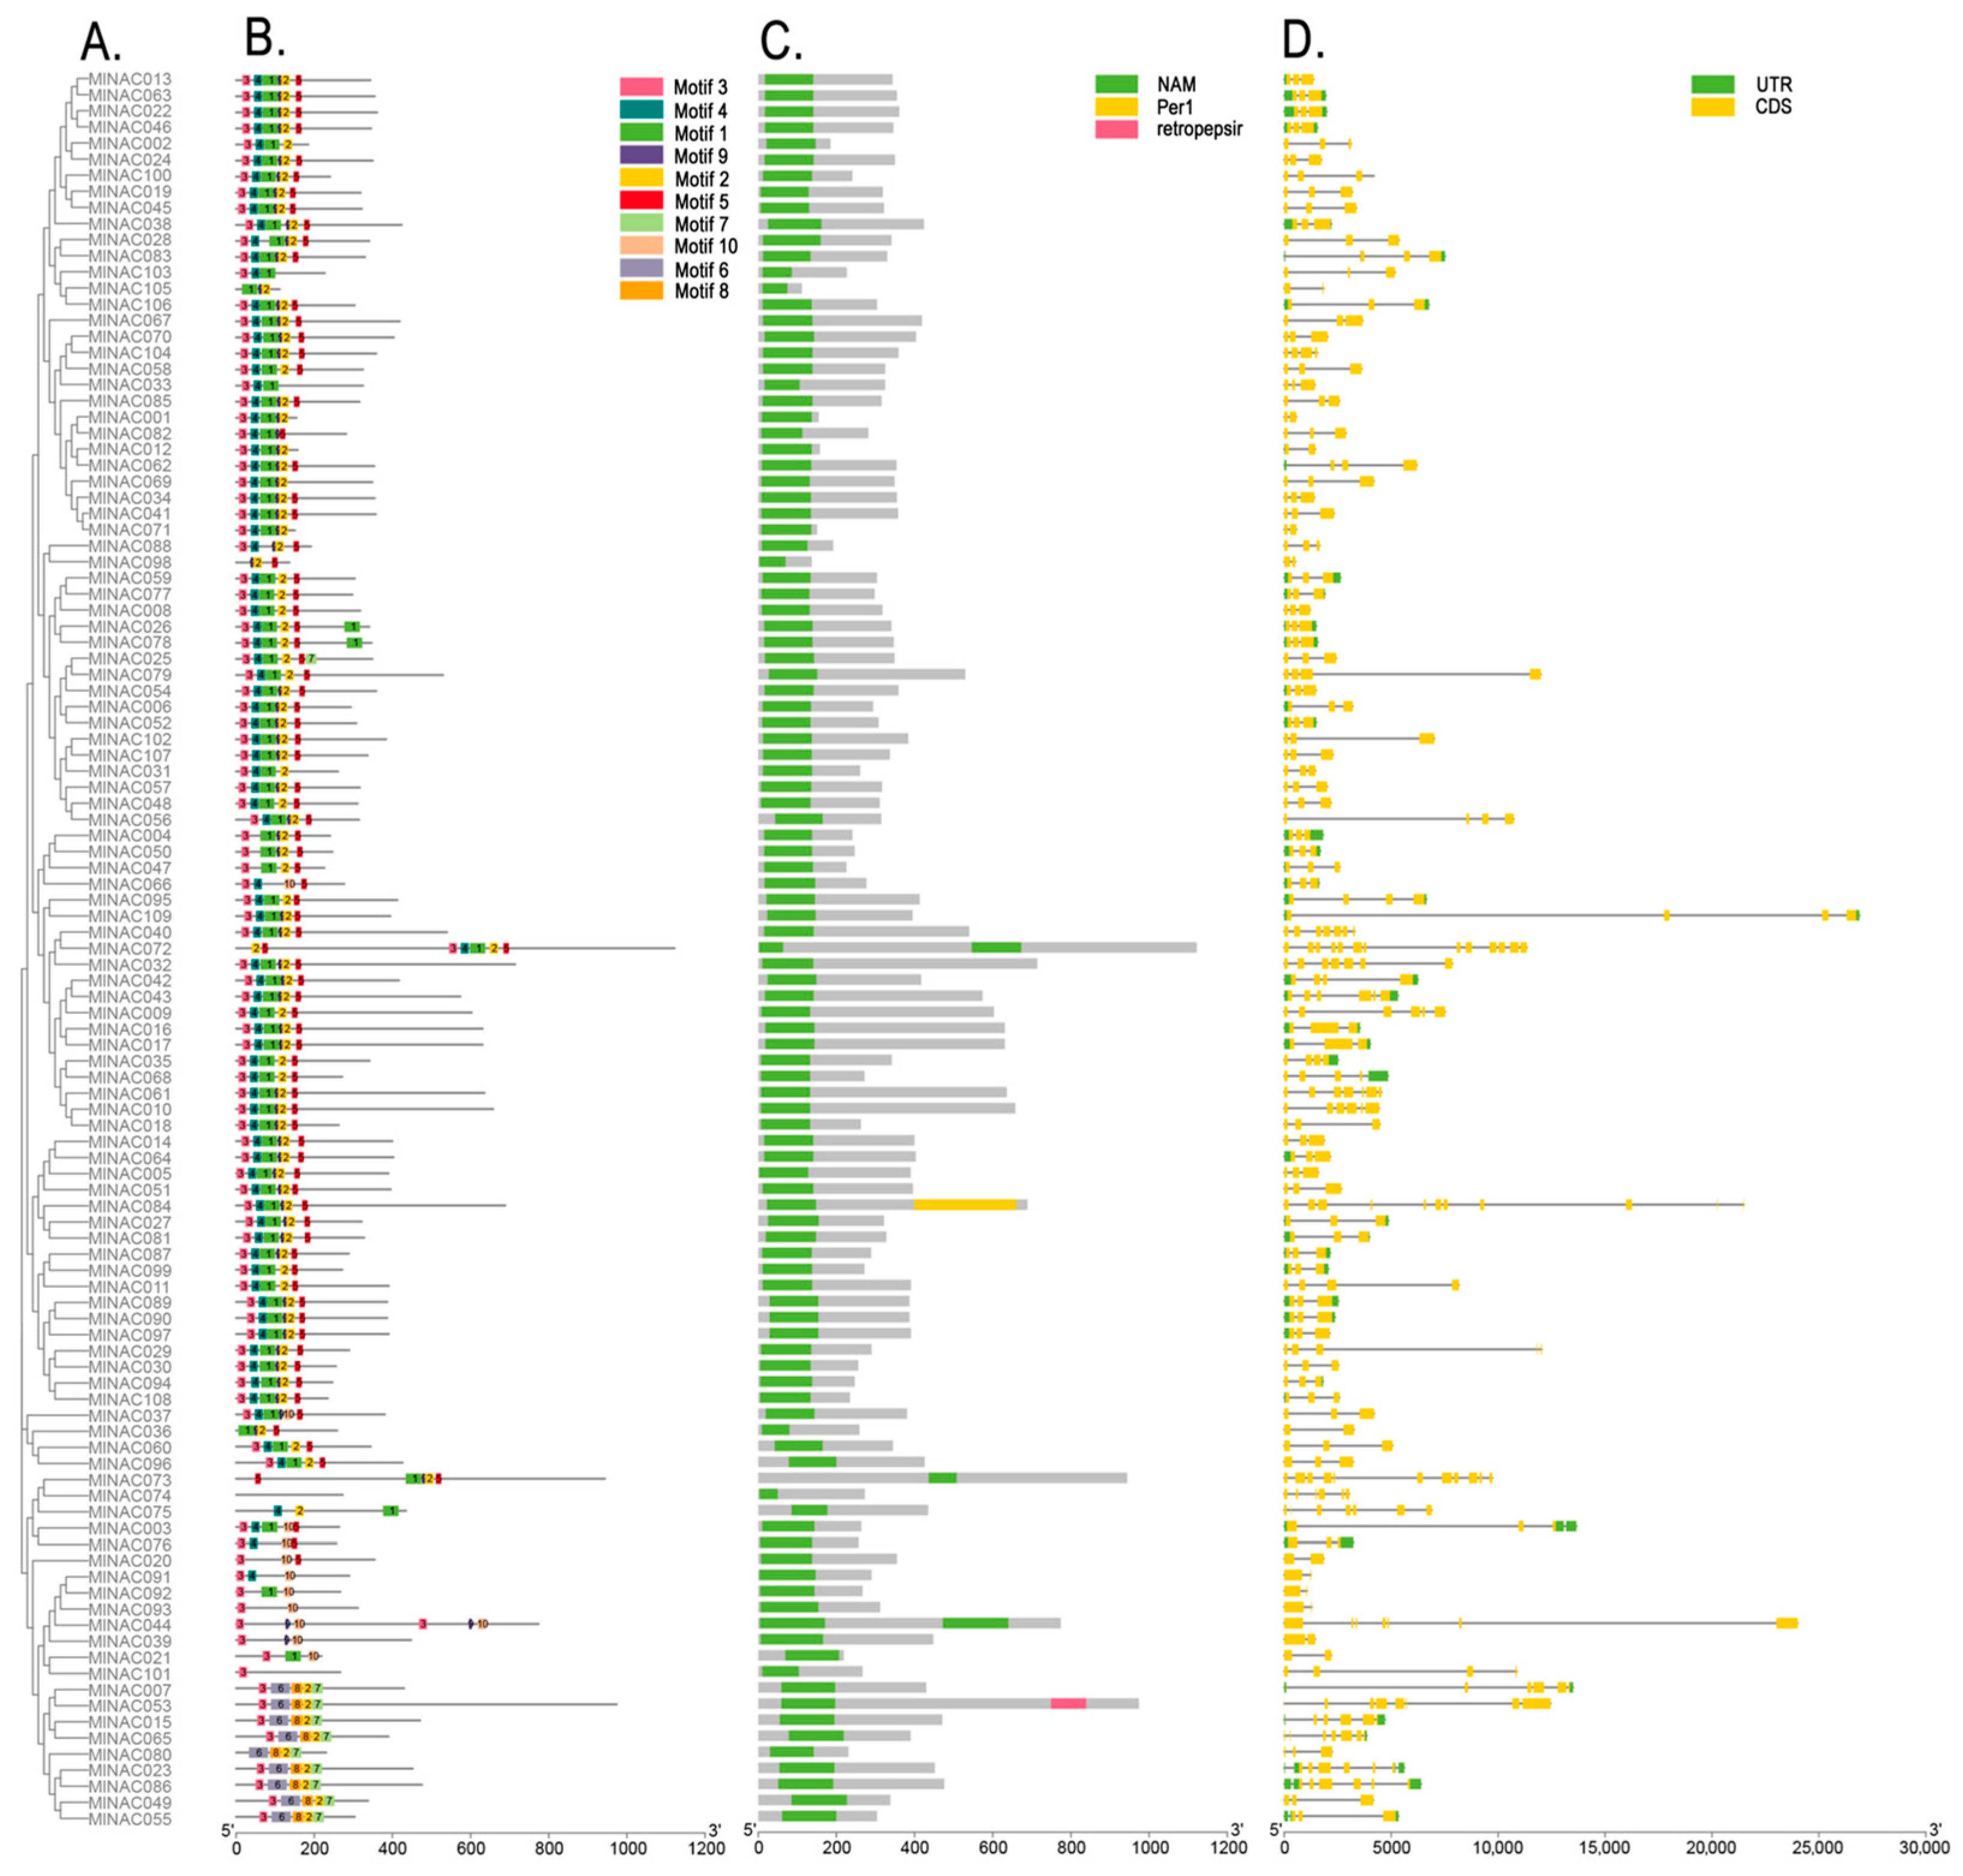
2.5. Motifs and Gene Structures of the MlNAC Transcription Factor Family

NAC proteins possess a conserved NAM domain that is used for DNA binding. This domain is a crucial region for the biological functions of NAC proteins. Therefore, in order to understand the functional differences in NAC proteins and further explore the relationships among the members of the MlNAC genes, we analyzed the phylogeny, gene structures, the conserved domain, and conserved motifs of the MlNAC transcription factor family (Figure 8). We identified ten conserved motifs among the 109 MlNAC proteins (Supplementary Table S2). The lengths of their amino acids ranged from 8 to 41. Most of the genes contain Motifs 1 to 5, and they are likely to have a certain relationship with the functions of these genes. Although a few genes with close phylogenetic relationships have different motifs, most genes with a relatively close genetic distance possess the same motifs. Notably, certain gene models (e.g., MlNAC101 and MlNAC74) lack the conserved NAC domain and display divergent gene structures. These anomalies suggest misannotations that should be corrected using transcriptomic evidence to ensure the genes are correctly identified.

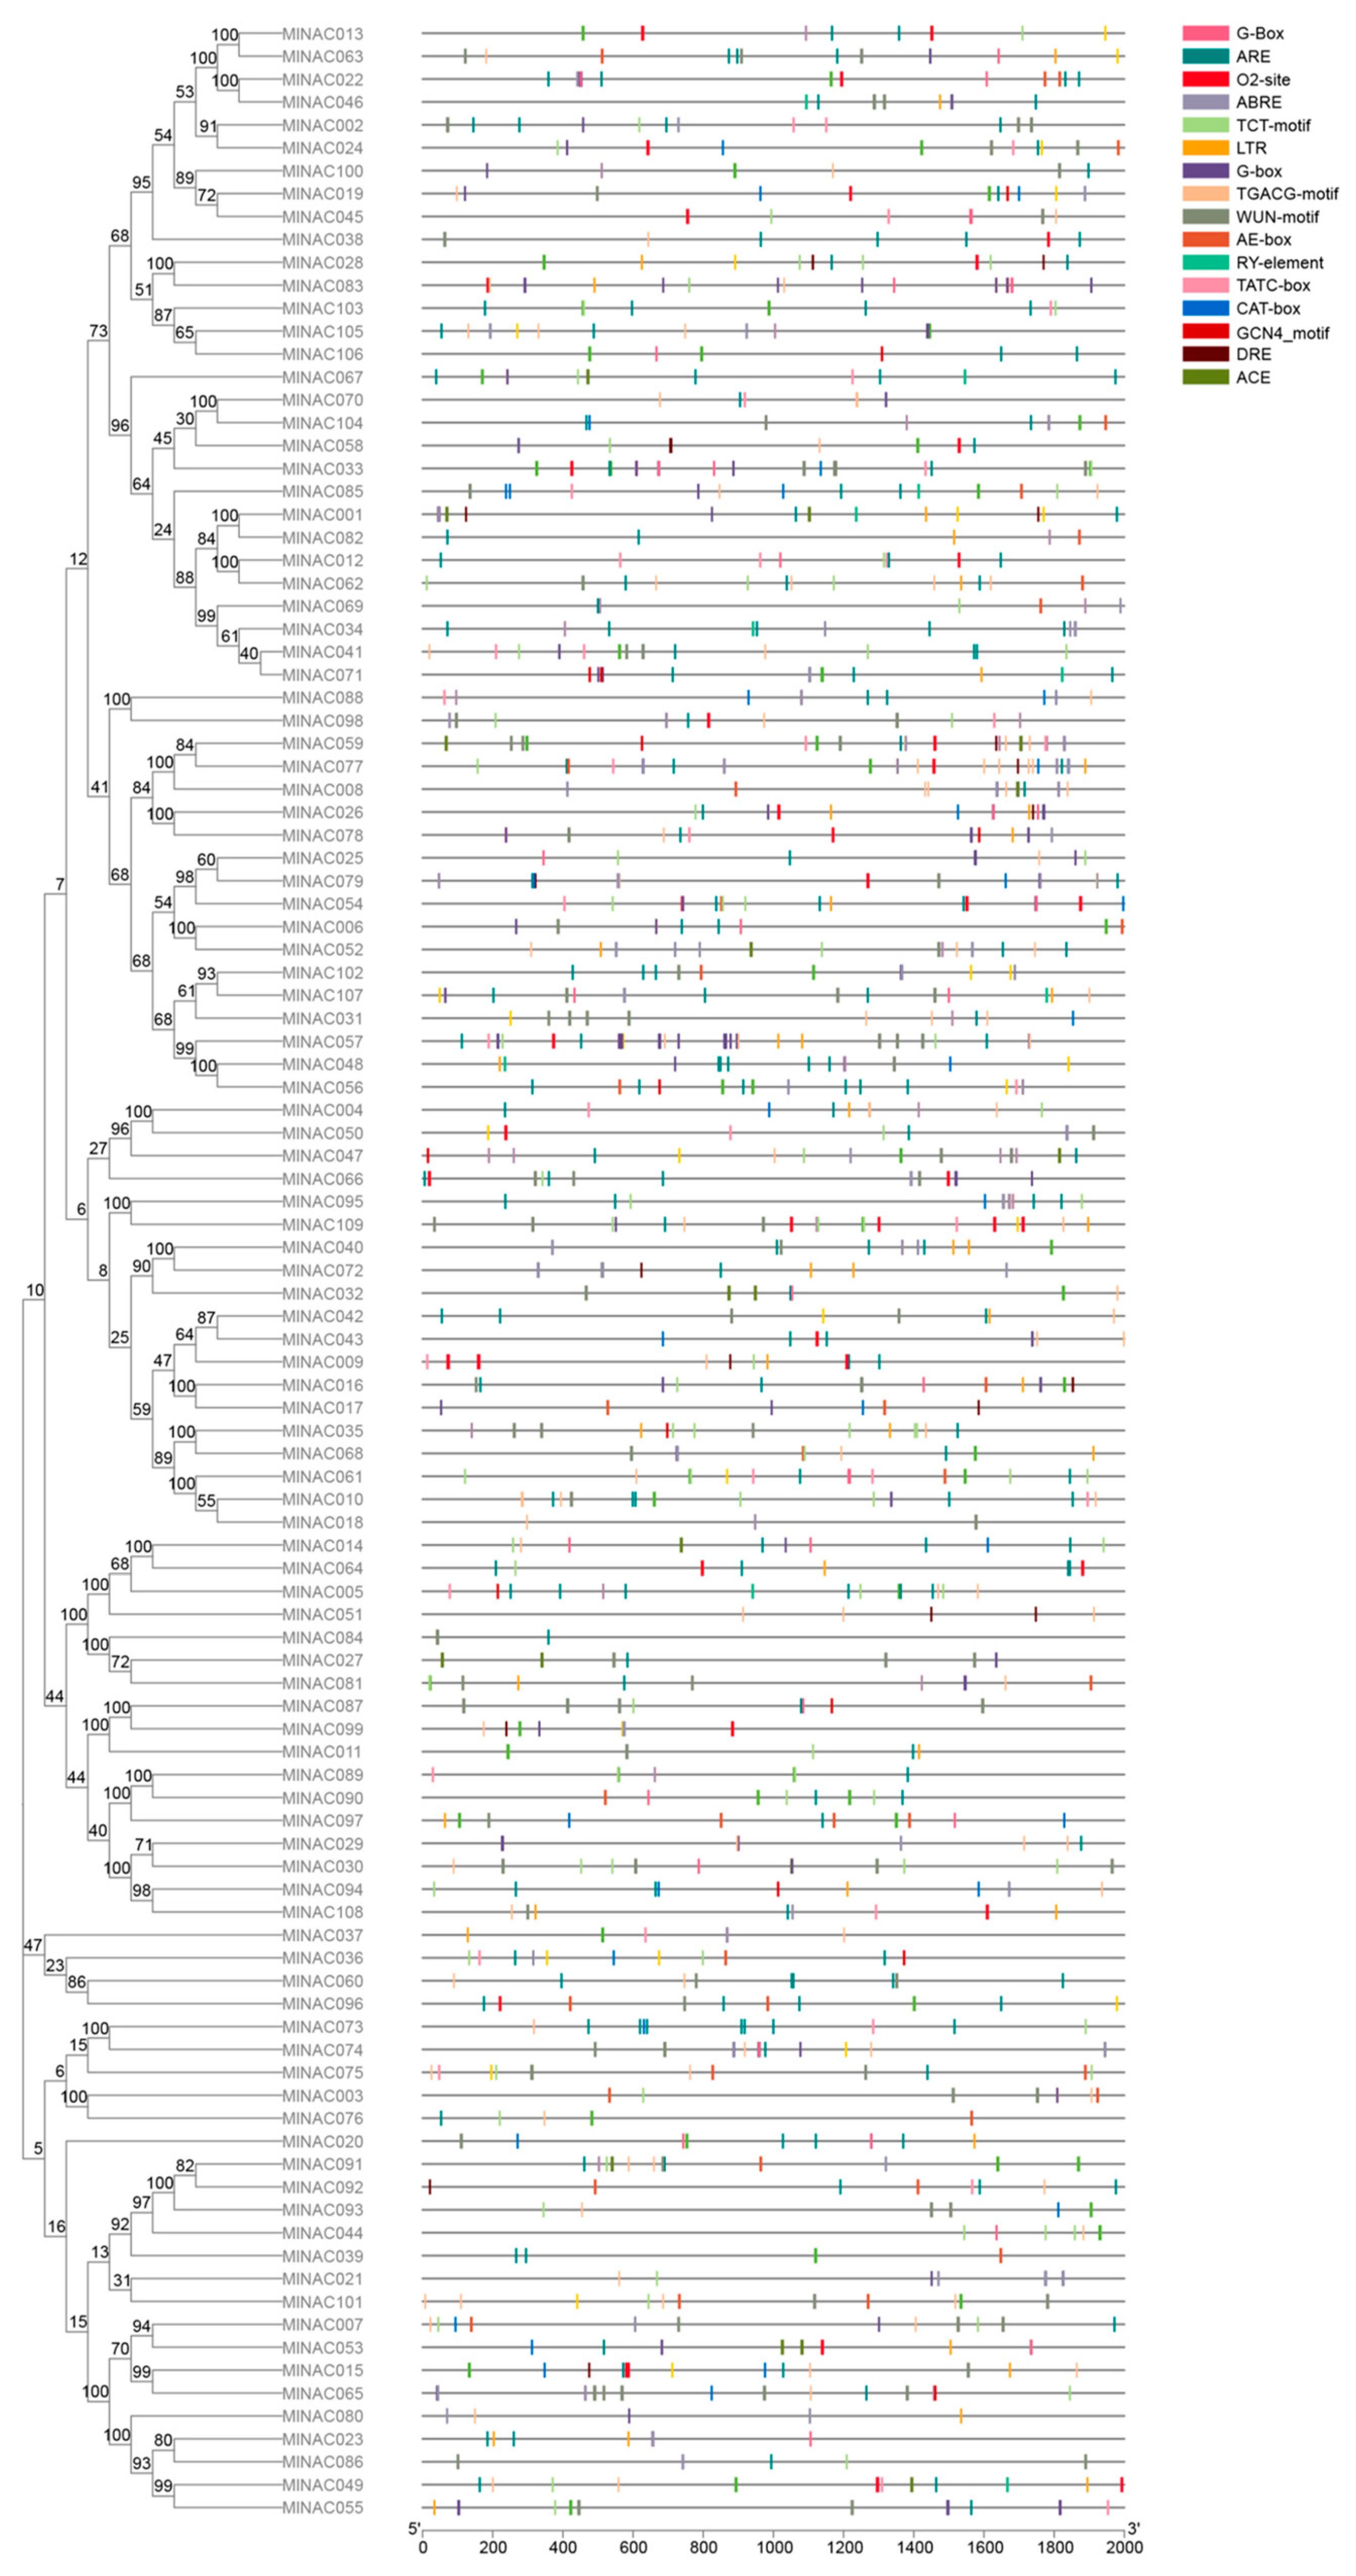
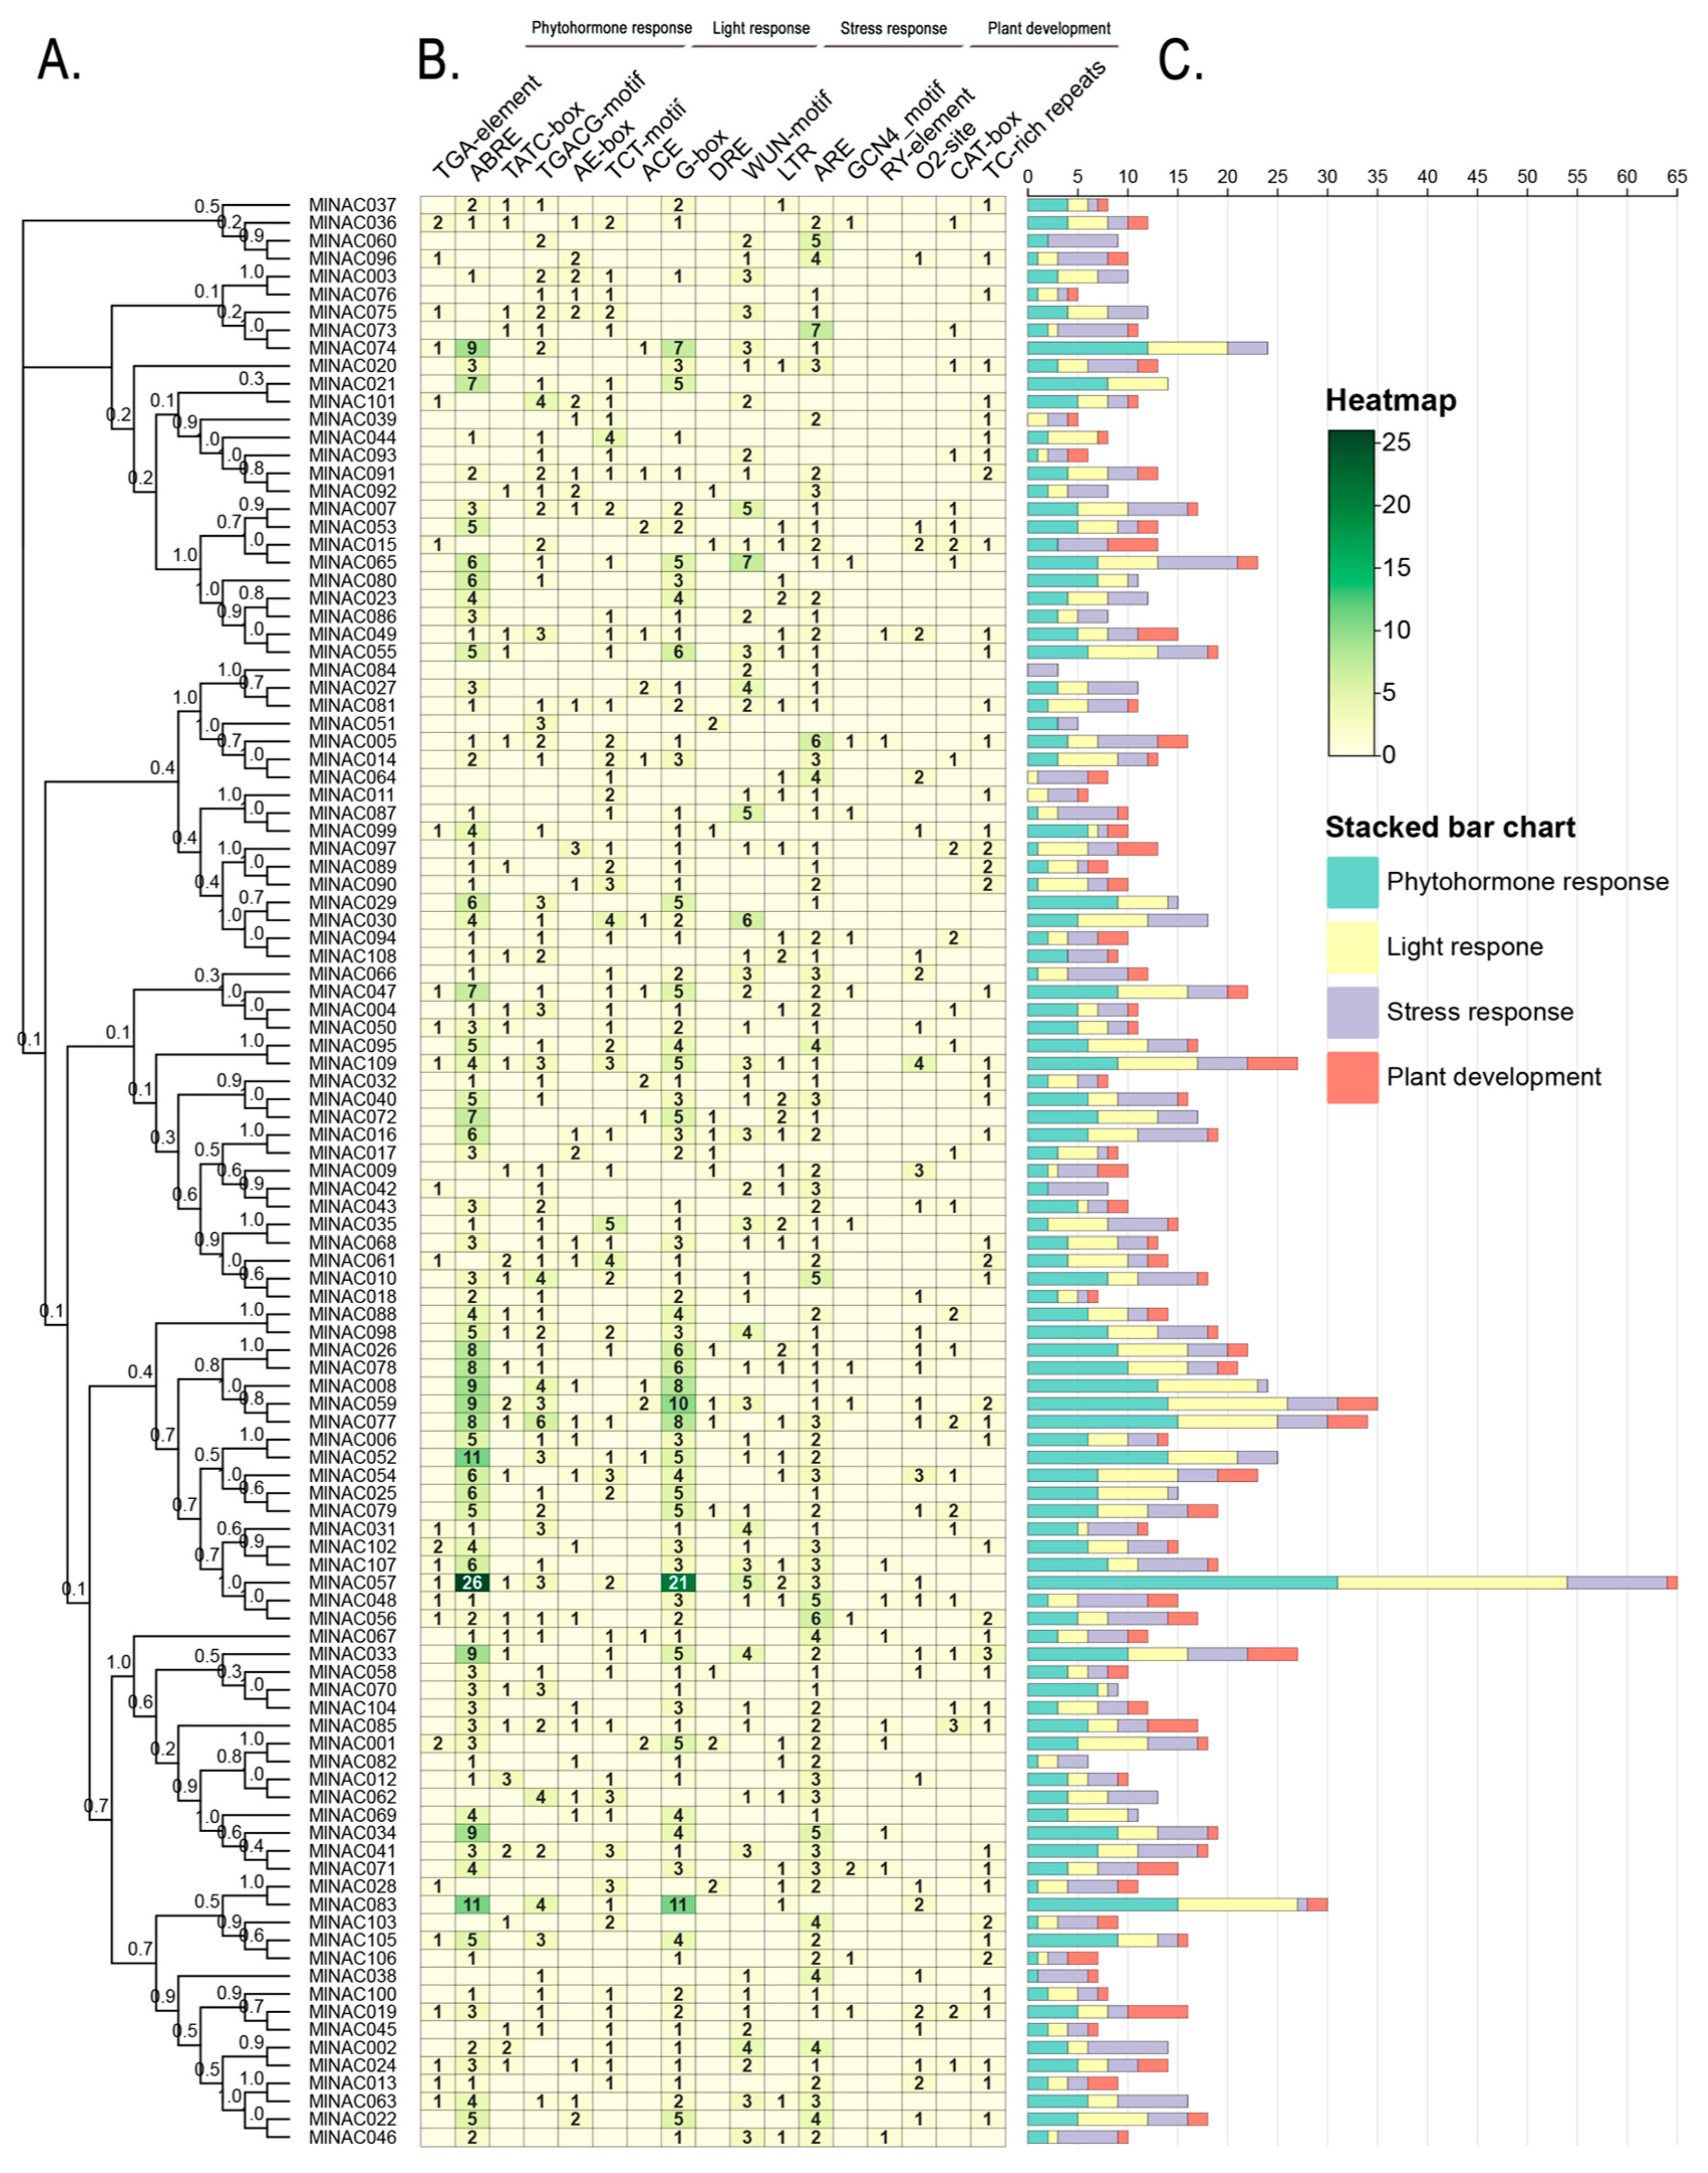
2.6. Analysis of Cis-Acting Elements in the NAC Transcription Factor Family of M. longifolia

The 2 kb sequence upstream of the MlNAC gene was intercepted for cis-acting element analysis. Many cis-acting elements related phytohormone response, light response, stress response and plant development were identified (Supplementary Table S3). Among them, the ones related to the light response were the most abundant. We demonstrated their distribution in the upstream region (Figure 9). We speculate that MlNAC transcription factors (TFs) are widely involved in the response of M. longifolia to various abiotic and biotic stresses and may possess numerous potential functions in enhancing the stress resistance of M. longifolia.
To further investigate the relationship between cis-acting elements (e.g., LTR and DRE) and gene expression regulation in M. longifolia, we conducted statistical analysis of promoter-region elements of each NAC gene (Figure 10). The results revealed that the majority of differentially expressed genes (DEGs) contained these low-temperature-stress-related elements in their promoter regions. It suggests that their potential synergistic roles in transcriptional regulation under cold stress.

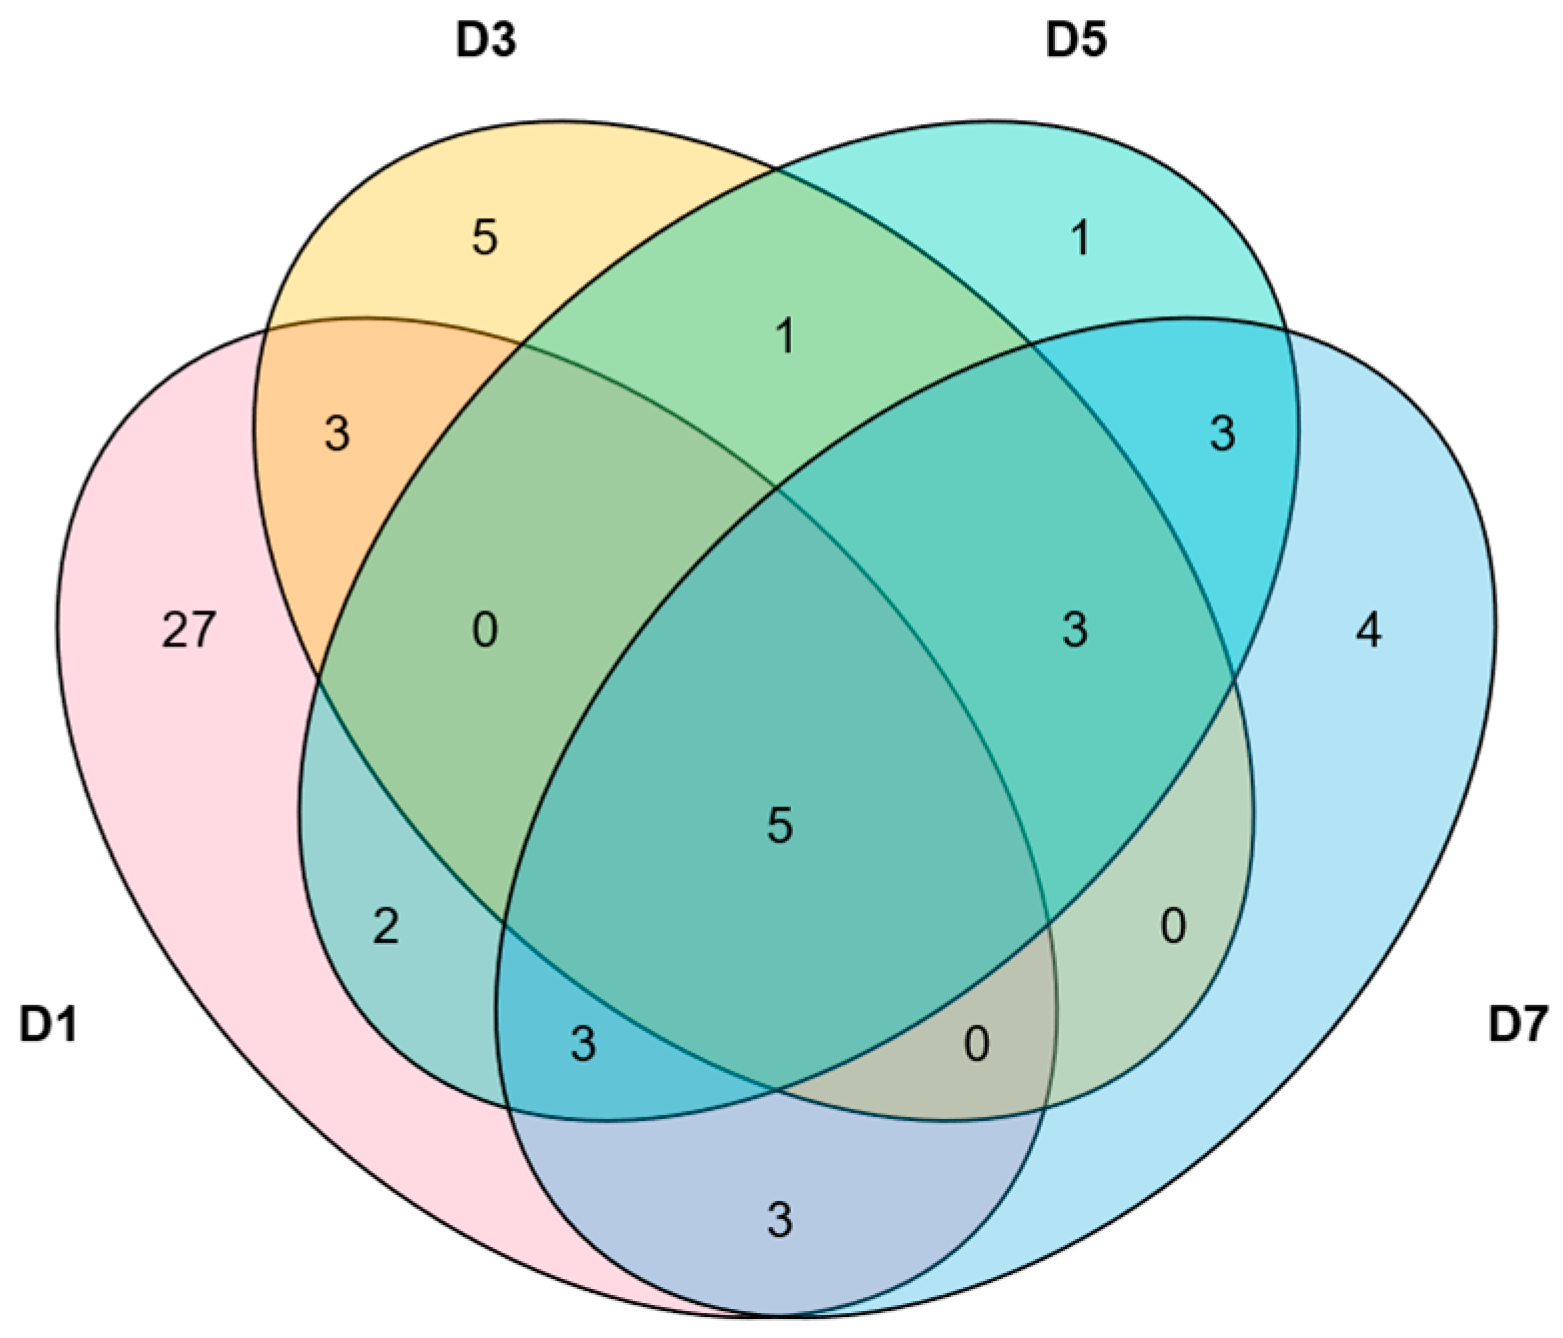
2.7. Analysis of the Expression Patterns of MlNAC Genes Under Low Temperature

Harnessing the acquired transcriptome data, our research cohort meticulously executed a differential expression analysis of the NAC transcription factor family (Supplementary S4–S7). Through simple mathematical statistics, we pinpointed a subset of five genes that manifested consistent differential expression profiles (Figure 11). Under the condition of low-temperature treatment, in comparison with the control group, MlNAC040, MlNAC077, MlNAC059, MlNAC078, and MlNAC026 emerged as the pivotal entities within this differential expression paradigm. Moreover, MlNAC043, MlNAC042 and MlNAC016 showed differential expression on the 3rd, 5th and 7th days.
We noticed an interesting phenomenon regarding the relationship between MlNAC077 and MlNAC078. These two genes not only possess an exceedingly close evolutionary ancestry but are also spatially located in close vicinity on the chromosome. Such findings strongly insinuate that they may collaborate synergistically to exert a significant impact on the regulatory mechanisms triggered under low-temperature conditions.
To present the expression levels of the transcription factor family in M. longifolia under low-temperature conditions more intuitively, we created a heatmap of the expression levels of M. longifolia under low-temperature treatment (Figure 12). We found that MlNAC059, MlNAC077, MlNAC078, MlNAC008 and MlNAC026 all exhibited significant differential expressions. Moreover, they have a very close evolutionary relationship, and all belong to the F group.

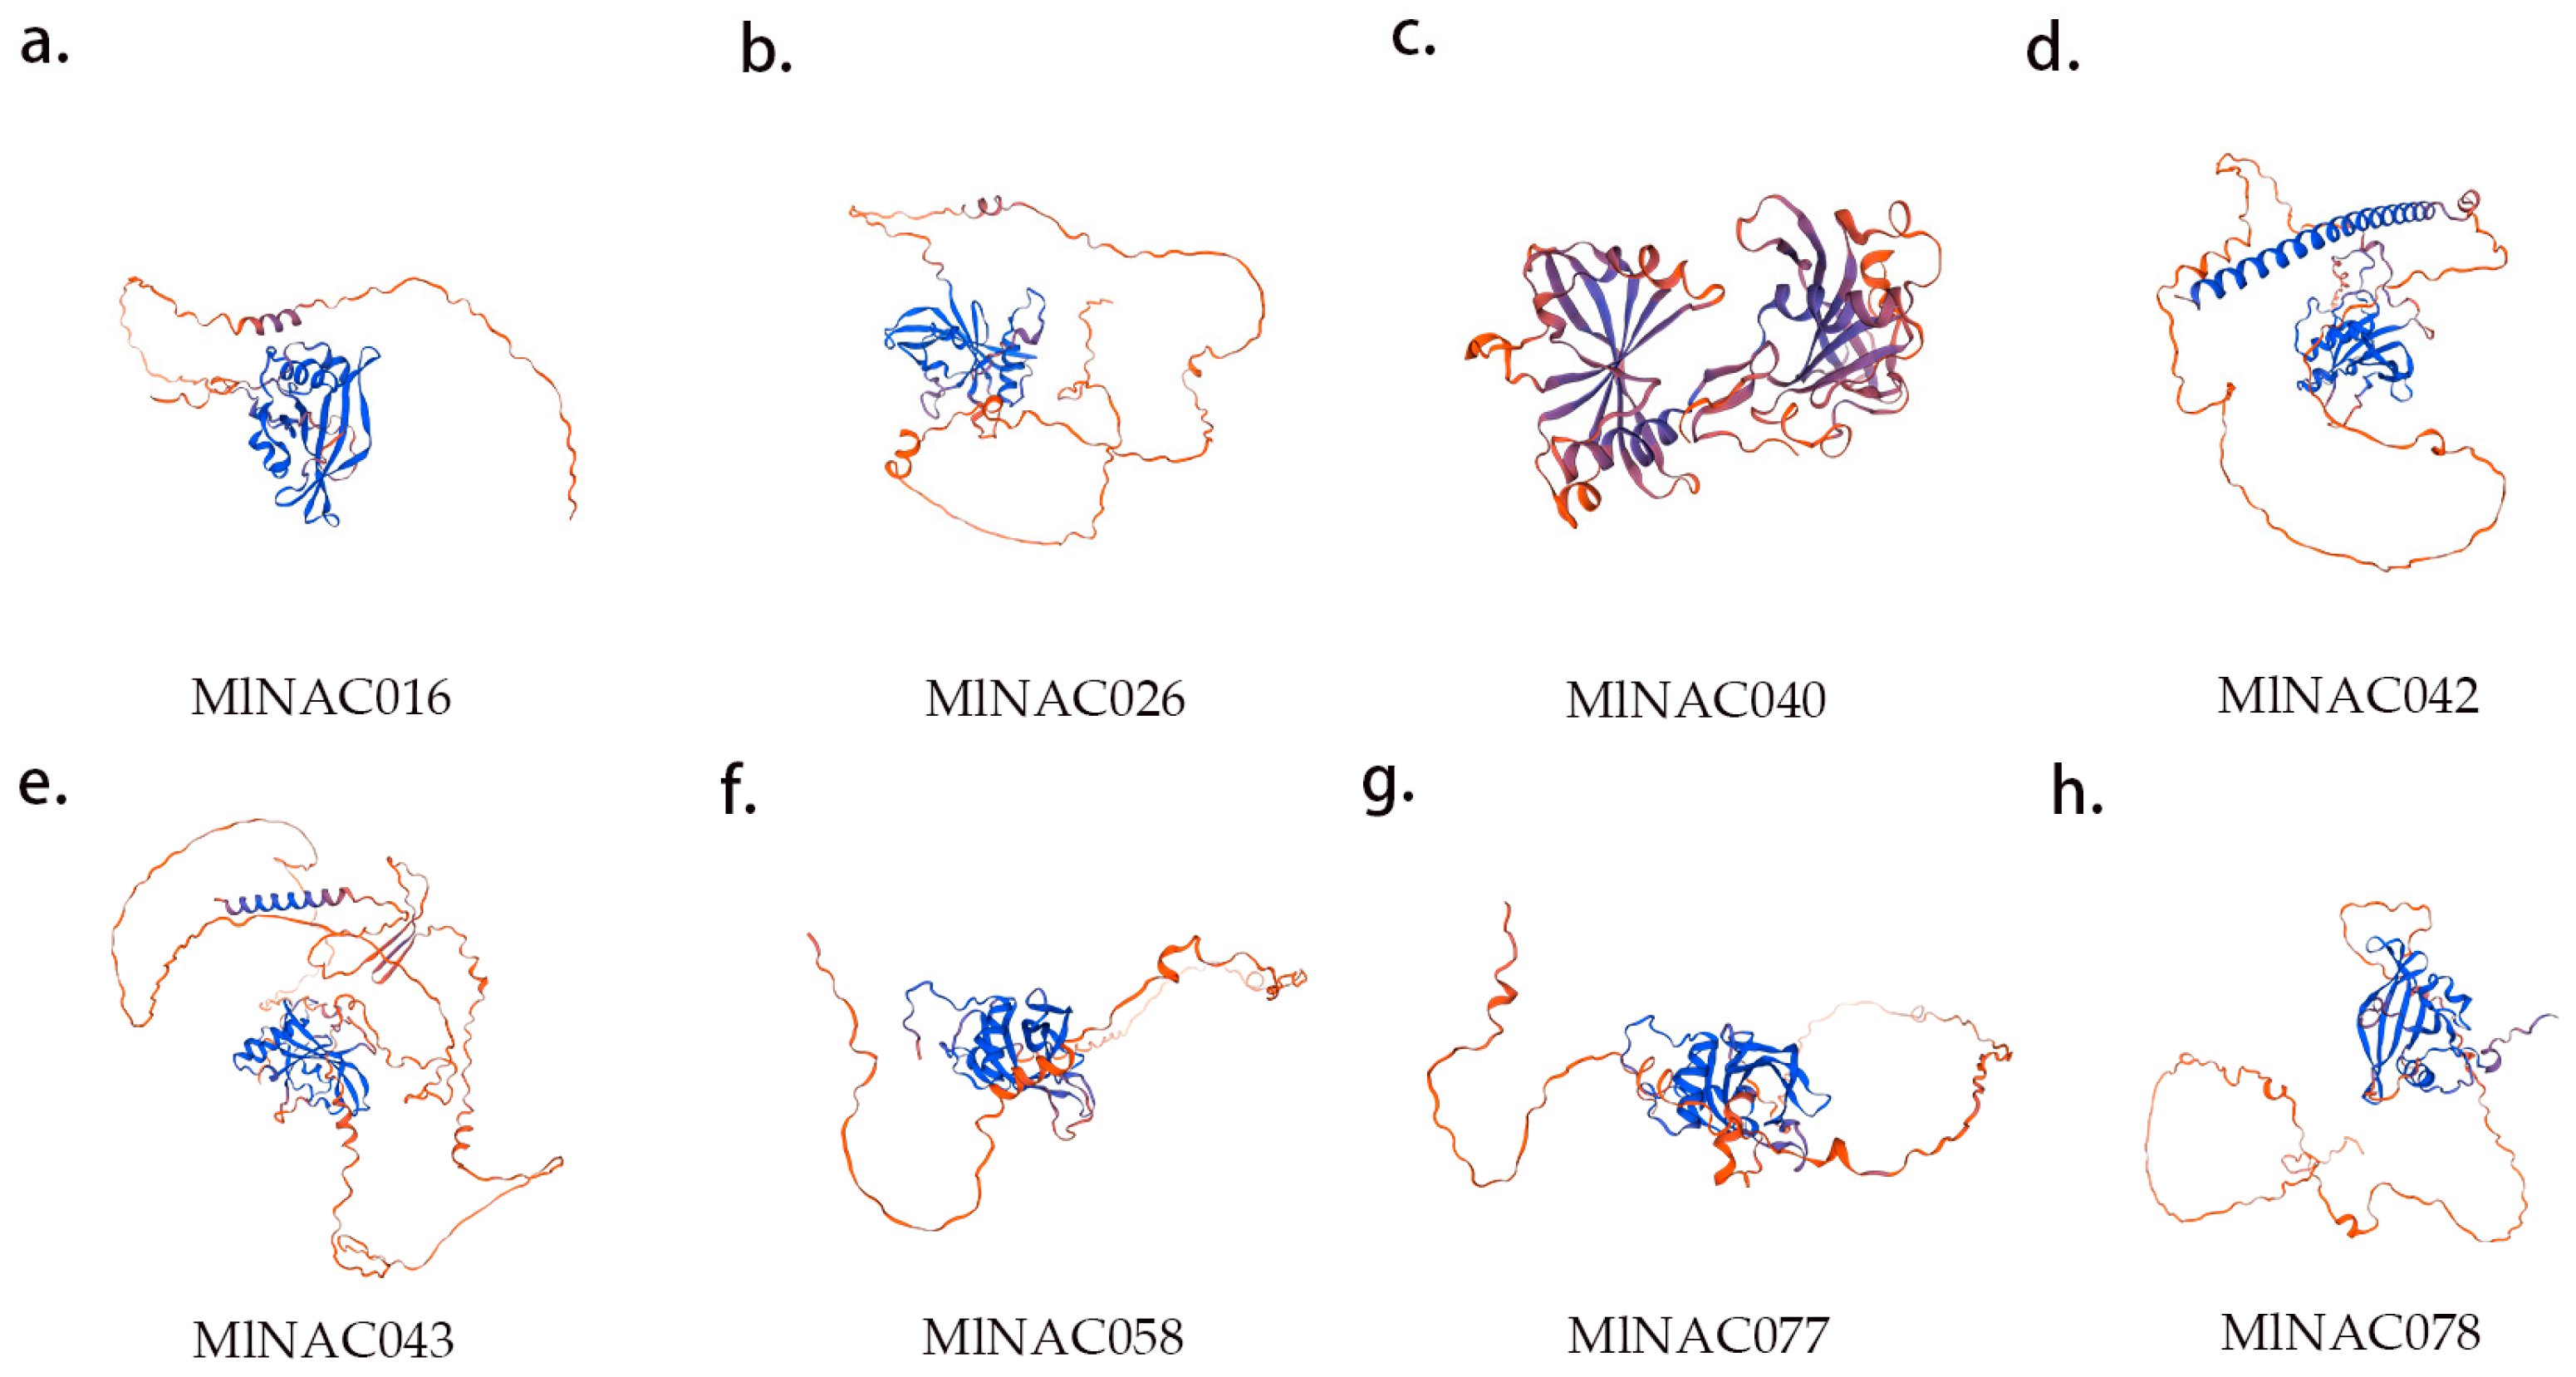
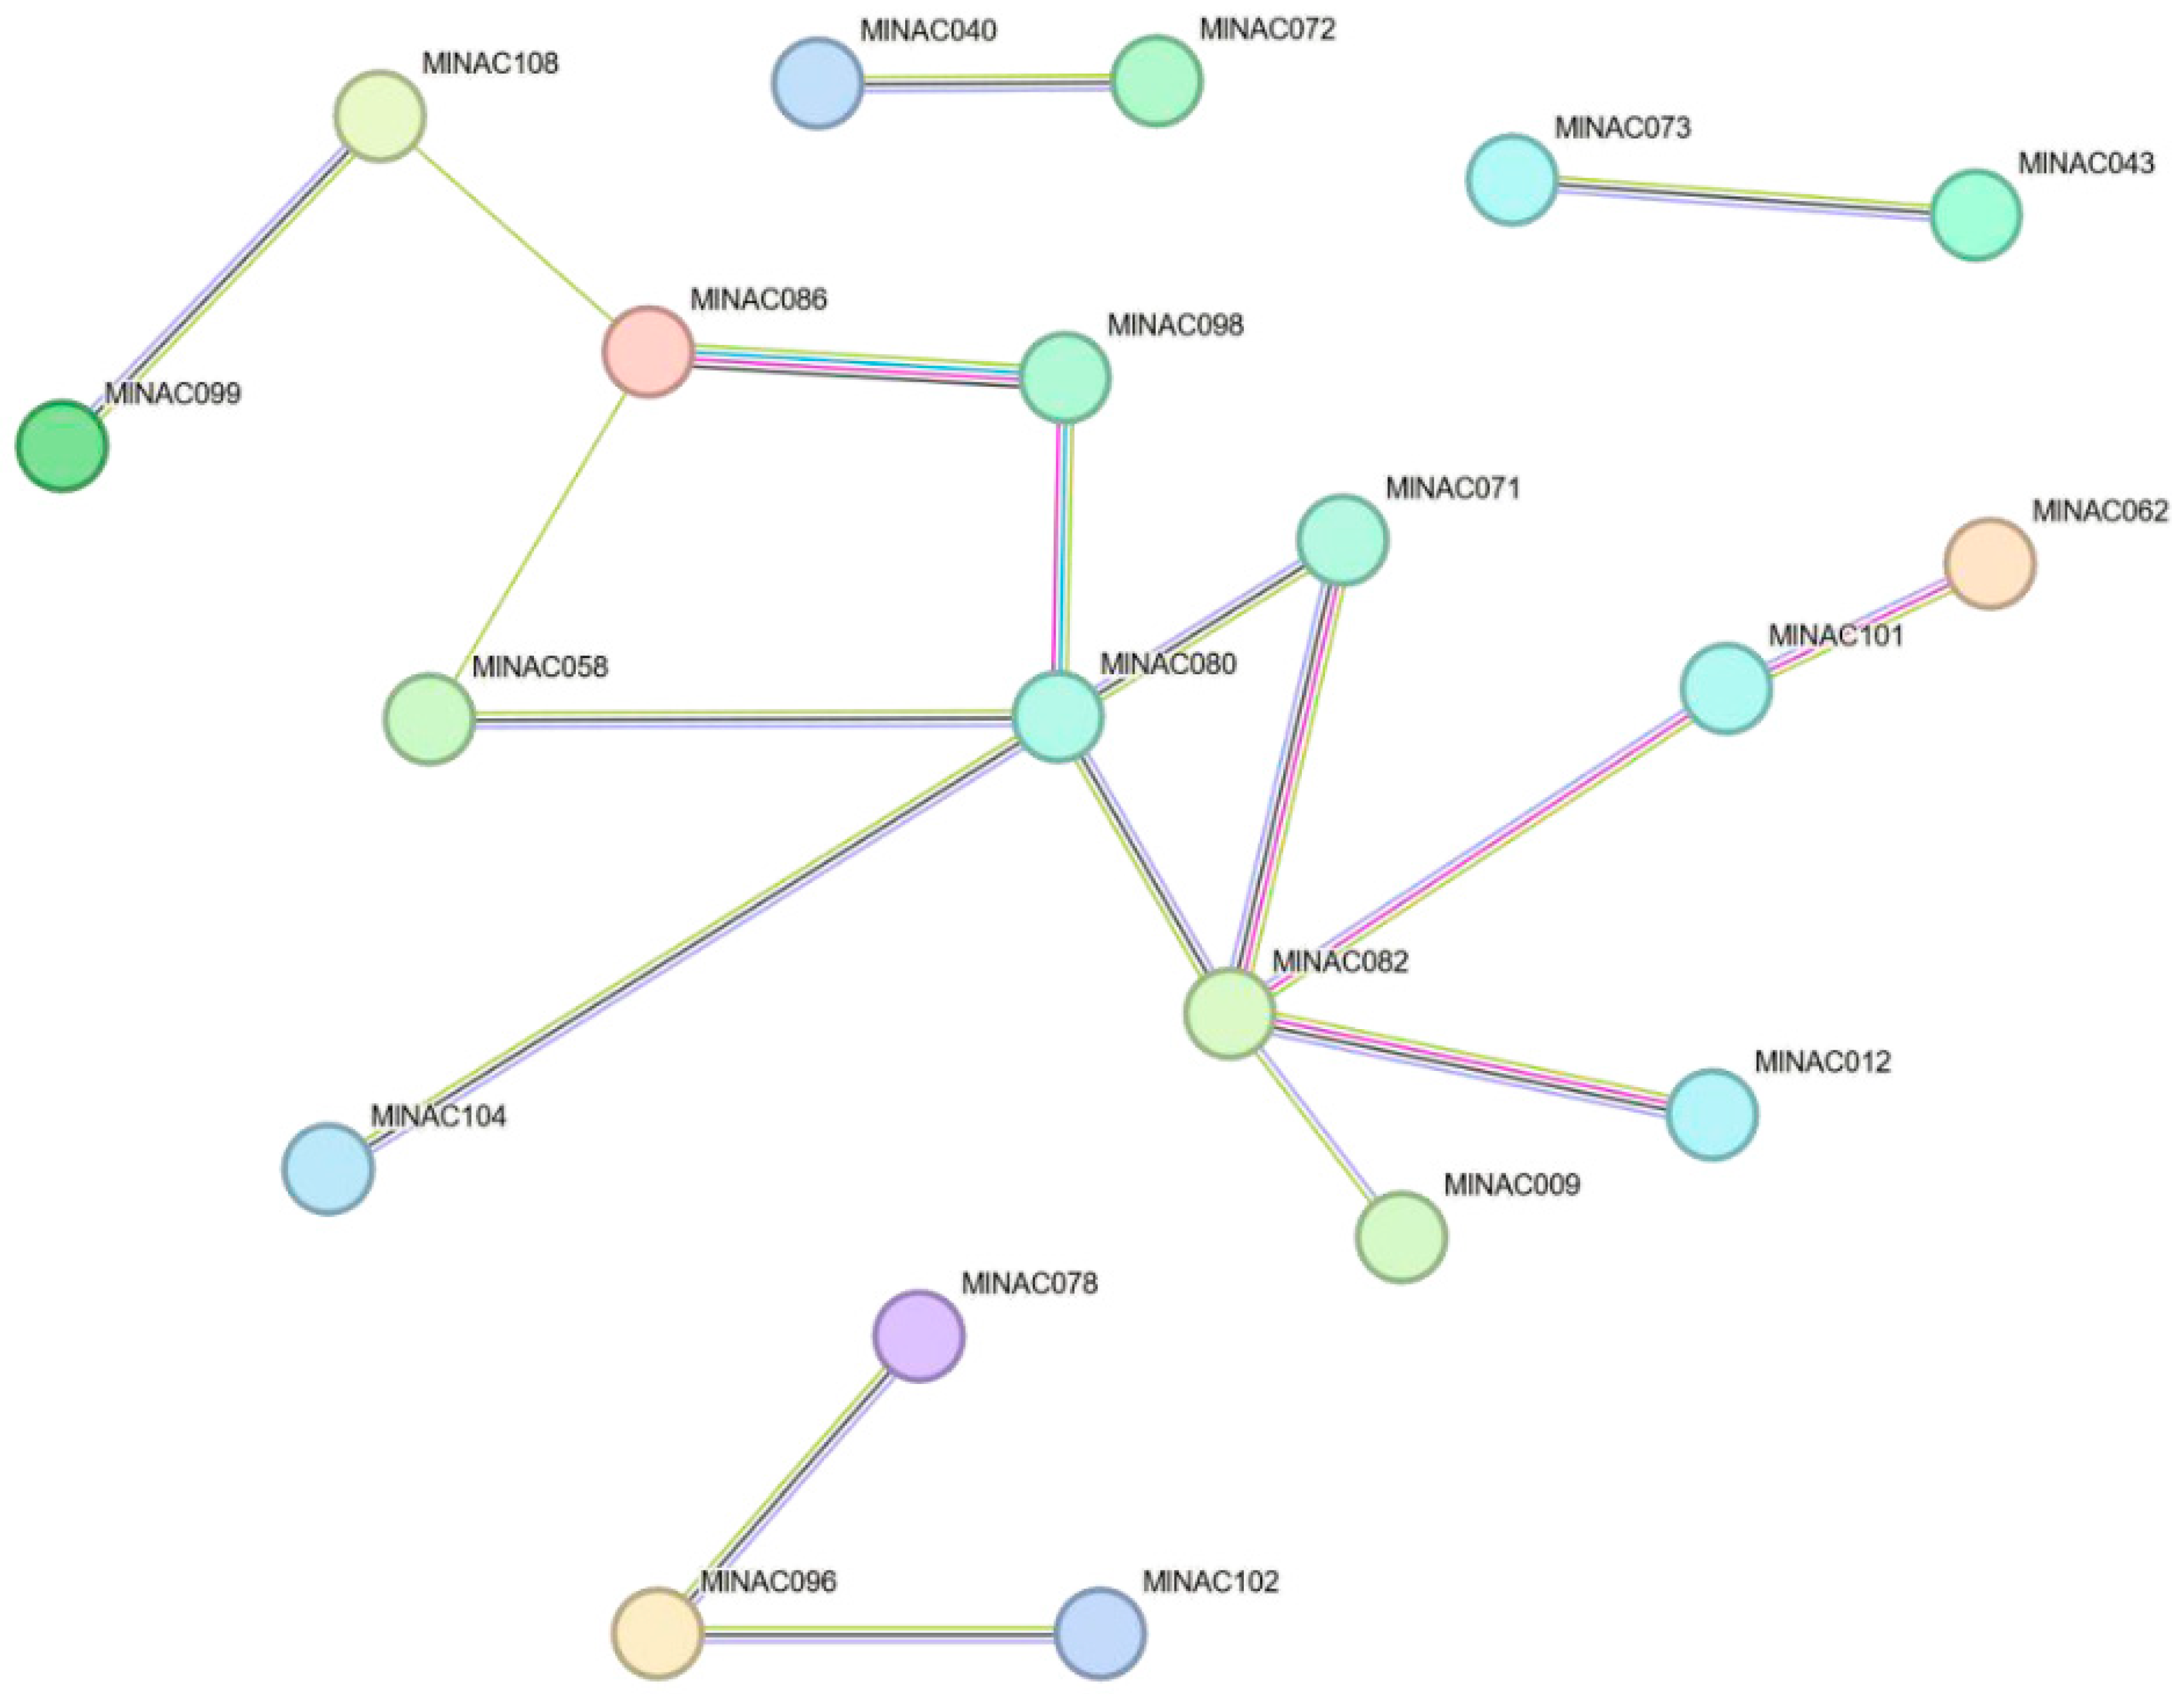
2.8. Key Protein Structure Prediction and NAC Protein Interaction Network Prediction

The structure of proteins is one of the focuses in the field of bioinformatics. Through structure prediction, we could gain in-depth insights into the functions of proteins, their interactions, and the biological processes. In this study, we utilized the Swiss-model online website to conduct structural prediction on the key MlNAC proteins under cold regulation (Figure 13) (Supplementary Table S8). The research results show that MlNAC proteins within the same subfamily exhibit a high degree of structural similarity, while there are significant structural differences among proteins from different subgroups. Such structural differences are somewhat related to the distinctions in their functions. It is highly likely that the structures of these proteins are closely associated with the functions they perform during the process of cold regulation. In subsequent research, we will focus on the adaptive relationship between protein structure and function and conduct in-depth exploration of the underlying mechanisms.
Figure 12. Heatmap of the expression levels of MlNAC genes under cold treatment. In the gap in the circle, CK indicates the control group, and D1, D3, D5 and D7 represent exposure to low temperature for 1 day, 3 days, 5 days, and 7 days, respectively. The single figure shows gene relationship and gene expression together by using the phylogenic tree of MlNACs as a core.
Ijms 26 04713 g012
In the prediction of protein–protein interaction (PPIs) within the MlNAC gene family, we implemented a dual-confidence threshold screening strategy (scores 0.4 and 0.7) to enhance prediction reliability (Figure 14). Notably, six core members (MlNAC058, MlNAC080, MlNAC082, MlNAC086, MlNAC098, and MlNAC101) consistently met the stringent 0.7 confidence threshold. It suggests that they may form stable interaction modules (Figure 14). This finding indicates that MlNACs likely mediate signaling transduction and execute diverse biological functions through dynamically organized PPI networks. They may potentially involve the formation of transcriptional regulatory complexes and coordinate activation of downstream target genes. The application of this rigorous confidence threshold (0.7) effectively minimized false positives while retaining high-confidence interactions. It provides reliable candidates for subsequent functional validation studies.

3. Discussion

3.1. Evolution and Duplication

The NAC transcription factor family represents one of the largest plant-specific regulatory gene families. NAC plays pivotal roles in both biotic and abiotic stress responses [27,28]. In this study, we performed the first genome-wide identification of 109 NAC genes in M. longifolia, exceeding the numbers reported in pepper (61) and hemp (69) [29,30], but smaller than those in Arabidopsis (117) [7,8], rice (151) [9], soybean (151) [31], and maize (148) [15]. Phylogenetic analysis revealed that MlNAC genes exhibited evolutionary conservation. Low Ka/Ks ratios (<1) indicated strong purifying selection [32]. Notably, segmental duplication (50 pairs) dominated over tandem duplication (6 pairs). It suggests that segmental expansion is the primary driver of NAC family diversification in M. longifolia.

3.2. Functional Prediction

Given that this study focuses more on the functional insights provided by the phylogenetic tree, it did not perform rigorous grouping of NAC sequences between the target species and other species. This has somewhat affected the robustness of the phylogenetic tree and needs to be further addressed in future research.
Conserved domain analysis demonstrated that NAC subfamilies shared similar gene structures and motif compositions, with motif variations primarily distinguishing different subclades. However, we still need to correct gene structures with obvious errors based on the transcriptome (e.g., MlNAC074 and MlNAC101). Strikingly, according to the phylogenic tree, which was constructed by Madchua longifolia and Arabidopsis thaliana, MlNAC026 and MlNAC076 clustered with Arabidopsis ANAC072 (AT4G27410) and ANAC019 (AT1G52890) in a highly supported subclade. Given that ANAC072 regulates ABA/drought/salt/cold responses via antioxidant enzyme activation [33,34,35], and ANAC019 mediates JA signaling and reproductive development [36,37,38], the conserved clustering and cold-induced expression patterns of MlNAC026/076 suggest possible potential functions in low-temperature adaptation. Notably, MlNAC77 showed phylogenetic proximity to ANAC002 (AT1G01720), which mitigates Cu2⁺ toxicity via ROS scavenging in mitochondria/vacuoles [8]. Although lacking high sequence homology, functional convergence warrants investigation.

3.3. Compartive Insights

This study investigated the potential functions of MlNAC proteins through systematic comparisons with NAC proteins from apple (Malus domestica) and Medicago truncatula. In apples, MdNAC42 interacts with the key anthocyanin regulator MdMYB10 to significantly promote anthocyanin accumulation in red-fleshed apples. The high homology between MlNAC054 and MdNAC042 suggests a similar regulatory role in anthocyanin biosynthesis in M. longifolia [39]. Notably, MlNAC054 exhibits stable expression under both cold-stressed and non-stressed conditions, indicating its potential independence from low-temperature responses. Another apple NAC transcription factor, MdNAC52, directly binds to the promoters of MdMYB9 and MdMYB11 to activate anthocyanin and proanthocyanidin biosynthesis [40]. Homology-based speculation suggests that MlNAC002, which shares high homology with MdNAC052, may have analogous functions. The consistently low expression of MlNAC002 under cold stress further supports its irrelevance to cold adaptation. Phylogenetic analysis of NAC proteins from Medicago truncatula and M. longifolia classified them into 11 distinct clades (Figure 5). Although MtNAC80 and MlNAC030 showed relatively close evolutionary relationships, the low bootstrap support value (0.63 < 0.7) reduces confidence in this clustering. Thus, whether MlNAC030 shares a mechanism with MtNAC80—such as mediating antioxidant pathways (e.g., activating MtGSTU1) via S-acylation cycling to regulate cold stress responses—requires experimental validation [5]. Transcriptomic data revealed that MlNAC30 displayed a blue color in the control (CK), while its heatmap color shifted significantly in cold-treated groups (D1–D7). Although not reaching strict differential expression thresholds, the distinct heatmap pattern implies potential functional specificity. Future studies should integrate functional assays and expression profiling under cold stress to elucidate MlNAC30’s regulatory mechanisms and potential similarities to MtNAC80.

3.4. Cis-Acting Elements and PPI Analysis

Promoter cis-acting element analysis revealed that cold-induced MlNACs harbor cis-regulatory elements associated with cold stress. Intriguingly, MlNAC077 uniquely possesses a DRE (drought-responsive element) motif absent in MlNAC076. It suggests distinct regulatory mechanisms—either local regulation of adjacent genes or long-distance transcriptional control. Classification of cis-elements into four categories (stress, phytohormone, light, and plant development) confirmed MlNACs’ dual roles in growth-regulation and stress adaptation.
From the perspective of protein analysis, we conducted two investigations: protein structure prediction and construction of protein–protein interaction (PPI) networks using STRING. Theoretically, the three-dimensional structure of transcription factors (TFs) determines their function in binding specific cis-acting elements to regulate target gene expression [41,42,43]. This functional execution often requires TFs to form dimers with interacting proteins, which explains our focus on predicting key protein structures. These predictions not only reveal structural features but also lay the foundation for identifying specific binding sites in future studies. PPI network analysis via homology mapping is limited by its reliance on conserved sequence homology for interaction inference, with results inherently speculative. Using two confidence thresholds (0.7 and 0.3), we observed no cold stress-related interactions under stringent thresholds. By relaxing the threshold to 0.3, we identified two intriguing protein pairs: MlNAC040-MlNAC072 and MlNAC043-MlNAC073. Although these interactions had low confidence scores, transcriptional heatmap visualization revealed sustained upregulation of MlNAC040 and MlNAC072 under cold stress, suggesting their collaborative roles in cold adaptation. In contrast, MlNAC043 and MlNAC073 showed minimal expression changes, leaving their functional significance in cold response uncertain.

3.5. Future Directions

For functional validation, we propose two feasible strategies: (1) establishing M. longifolia transformation systems to overexpress ANAC072/ANAC019 homologs (e.g., MlNAC026/076) for phenotypic analysis under drought/cold stress, (2) heterologous expression of MlNAC026/076/077 in Arabidopsis to dissect their cross-species functionality, or (3) conducting detailed predictions of nucleotide-binding sites for cold stress-responsive NAC transcription factors and validate potential dimer-forming protein partners via yeast two-hybrid assays. Given the above predicted functions among these genes, combinatorial overexpression (single/multi-gene vectors) could elucidate their individual function and synergistic functions. This research theoretically proposes gene functions in M. longifolia, and we are currently conducting experimental validation.

4. Materials and Methods

4.1. Plant Material

The fallen mature seeds of M. longifolia were collected in Tianhe District (23°11′7.3″ N, 113°21′50″ E), Guangdong Province, China, specifically at the South China National Botanical Garden.
To investigate cold stress responses in M. longifolia, we conducted controlled experiments under simulated cold conditions. Naturally shed seeds from maternal plants previously used for DNA isolation were collected for germination. Seedlings were initially cultivated on moist filter paper until embryonic root emergence, then transferred to peat-based substrate under standardized growth conditions matching those described in Section 2.1. Uniform 9-month-old specimens were selected for climate chamber exposure (5 °C, 65% RH, 12 h photoperiod, 17,600 lux). Leaf samples were collected at five timepoints: baseline (CK), and after 1 (D1), 3 (D3), 5 (D5) and 7 (D7) days of cold exposure, with triplicate biological replicates per timepoint. CK serves as a control, providing baseline gene expression without cold stress. D1 (1 day) captures early stress responses as plants activate rapid defenses. D3 (3 days) and D5 (5 days) focus on mid-term regulatory changes during physiological and metabolic adjustments. D7 (7 days) targets long-term adaptation, examining gene expression under prolonged cold stress. Together, these timepoints enable systematic analysis of M. longifolia gene expression during cold stress.
RNA extraction employed TRIzol reagent (Invitrogen), followed by quality verification through Agilent 2100 Bioanalyzer analysis and RNase-free agarose gel electrophoresis. Poly(A) + mRNA enrichment used oligo(dT) beads, with subsequent fragmentation and cDNA synthesis performed via NEB Next Ultra RNA Library Prep Kit (NEB #7530). Sequencing libraries were processed on Illumina NovaSeq6000 platforms at Gene Denovo Biotechnology (Guangzhou, China). Paired-end clean reads were used for mapping to the reference genome. This experimental design allows systematic analysis of transcriptional changes during cold acclimation while maintaining consistent genetic background through maternal seed sourcing. The dual RNA quality assessment approach ensures data reliability for downstream expression analyses.

4.2. Genome-Wide Identification of the NAC Transcription Factor Family and Prediction of Physicochemical Properties

The genome of M. longifolia was assembled by us in a previous study [3]. The genome data of Arabidopsis thaliana and AtNAC protein sequences were downloaded from the TAIR database (https://www.arabidopsis.org/, accessed on 20 January 2025) [44]. The Hidden Markov Model (HMM) file for the NAM domain (PF02365) was retrieved from the InterPro website (https://www.ebi.ac.uk/interpro/ accessed on 17 November 2024) [45]. Using the NAM domain, we searched for MlNAC protein sequences with the HMMER 3.0 software with an E-value threshold of 1 × 10⁻³. under an E-value cutoff of 1 × 10⁻⁵, we used the BLASTP function in TBtools to screen candidate members of the gene family from M. longifolia [46]. Considering both the results of the HMMER model and the alignment, we identified 109 NAC proteins. Finally, all candidate MlNAC genes were validated using the Conserved Domain Search tool (https://www.ncbi.nlm.nih.gov/Structure/cdd/wrpsb.cgi, accessed on 21 January 2025). We predicted physicochemical properties such as molecular weight (MW) and isoelectric point (pI) using an online website (https://web.expasy.org/compute_pi/, accessed on 21 January 2025) [47]. The subcellular localization of MlNAC proteins was predicted using the online website (https://wolfpsort.hgc.jp/, accessed on 21 January 2025) [48].

4.3. Phylogenetic Analysis of NAC Proteins in M. longifolia

MtNAC protein sequences were downloaded from a website (https://link.springer.com/article/10.1007/s12298-017-0421-3, accessed on 24 February 2025) [20]. In the MEGA 11 (v11.0.13) [49], we used the Muscle tool with default parameter settings to perform multiple protein sequence alignments on 109 MlNAC of M. longifolia. The results of these alignments were then used to construct a phylogenetic tree via the neighbor-joining method, with the p-distance model, a bootstrap value of 1000, and other default parameters, based on which all members of the M. longifolia NAC protein family were classified. Similarly, three phylogenetic trees were generated with protein sequences (MlNAC and AtNAC, MlNAC and MtNAC, MlNAC and MdNAC) All phylogenetic trees were beautified using the ChiPlot website (https://chiplot.online/tvbot.html, accessed on 22 January and 24 February 2025) [50], where different subfamilies were distinguished by different colors.

4.4. Chromosomal Distribution

We used the annotation file from the M. longifolia genome in the TBtools software (v2.110) to obtain the chromosomal localization information of MlNAC genes. Then, we employed TBtools to analyze the distribution of MlNAC genes on chromosomes and the gene density of each chromosome and to create a corresponding map. In the “Gene Density Profile” function, the “Bin Size” parameter was set to 100 kb, and the remaining parameters were set to their default values.

4.5. Collinearity Analysis

To investigate the expansion patterns of the NAC gene family in M. longifolia, we performed a self-alignment analysis of the genome using the MCScanX tool in TBtools with an E-value threshold of 1 × 10⁻¹⁰. The collinearity results were integrated with gene density profiles and visualized using the Advanced Circos module. For further exploration of NAC family expansion mechanisms, we quantified the numbers of segmentally and tandemly duplicated NAC gene pairs based on collinearity analysis. To assess selective pressures acting on duplicated NAC genes, we calculated the Ka/Ks ratios for these gene pairs using the Simple Ka/Ks Calculator (NG) implemented in TBtools. Gene pairs (with Ka/Ks < 1, =1, or >1) were interpreted as undergoing purifying selection, neutral evolution, or positive selection, respectively. This integrated approach combines collinearity-based duplication detection to elucidate the driving forces behind MlNAC family expansion.
To investigate the evolutionary relationships of the NAC gene family in M. longifolia, interspecific collinearity analysis was performed using the “MCscanX” tool embedded in TBtools. Genomic data of five species (Populus trichocarpa, Arabidopsis thaliana, Oryza sativa, Vitis vinifera, and Solanum tuberosum) were retrieved from the Phytozome database (https://phytozome-next.jgi.doe.gov/, accessed on 13 February 2025) [51]. Genome-wide alignment results were processed by “MCscanX” to identify collinear gene pairs between M. longifolia and each target species, with an E-value threshold of 1 × 10⁻¹⁰. Potential gene duplication events (e.g., tandem or segmental duplications) were examined by filtering collinear regions where a single gene corresponded to multiple homologs. Visualization of syntenic blocks was achieved via the “Dual Systeny Plot” module in TBtools, with customized chromosome order and color schemes to highlight evolutionary patterns. The analysis focused on collinear pair counts and chromosomal distribution patterns to elucidate genomic drivers of evolutionary divergence.

4.6. Analysis of NAC Protein Structure and Conserved Motifs

The conserved motifs of NAC proteins were analyzed using the MEME tool (v5.5.7) (http://meme-suite.org/index.html, accessed on 22 January 2025) [52]. The gene structure was analyzed using the TBtools software. Then, the gene structures, conserved motifs and the conserved domain of MlNAC proteins were visualized using TBtools.

4.7. Analysis of Cis-Acting Elements of NAC Proteins

Use the “GXF Sequence Extraction” tool in TBtools software to extract the 2 kb upstream sequences of MlNAC genes. Subsequently, analyze and compare these sequences with the online PlantCare database (https://bioinformatics.psb.ugent.be/webtools/plantcare/html/, accessed on 24 January 2025) to identify and retrieve the cis-acting elements of the MlNACs [53]. Then, integrate these elements with the phylogenetic tree of M. longifolia and visualize them using the “Basic BIOsequence View” tool in TBtools. We used Python (v3.7.6) programming to perform statistical analysis on the number of genetic elements, generated a genetic element matrix, and visualized it using the ChiPlot website (https://chiplot.online/tvbot.html, accessed on 1 May 2025).

4.8. Expression Patterns of NAC Proteins Under Low Temperature

Differential expression analysis of RNAs was conducted using DESeq2 between different groups and edgeR between two samples. Genes/transcripts with a false discovery rate (FDR) below 0.05 and an absolute fold change ≥ 2 were identified as differentially expressed. Specifically, DESeq2 was applied for comparisons across distinct experimental groups, while edgeR was utilized for pairwise sample comparisons [54,55]. The analysis employed a negative binomial distribution model to handle count data, with statistical significance determined by the combined thresholds of FDR < 0.05 (to control false positives) and a minimum two-fold change magnitude (to ensure biological relevance). This dual-criterion approach effectively balances statistical rigor and biological significance in identifying differentially expressed genes/transcripts.
First, extract the FPKM expression values of NAC transcription factors in M. longifolia under low-temperature stress (control CK, D1, D3, D5, D7 timepoints) from RNA-seq data. Then, organize them into a matrix with genes as rows and samples as columns. Next, import the data into TBtools using the “Heatmap” function, and apply “Log2(value + 1)” normalization to the raw FPKM values to eliminate scale differences and enhance the visualization of low-expression genes. At the same time, use the phylogenetic tree of MlNAC proteins to cluster expression profile, which aims to show NAC relationship and expression together. Finally, adjust color gradient and export the map.

4.9. Key Protein Structure and NAC Protein Interaction Network Prediction

The 3D structures of MlNAC proteins were constructed by homology modeling using the SWISS-MODEL online tool (https://swissmodel.expasy.org/, accessed on 26 January 2025) [56]. Perform protein–protein interaction prediction for the NAC protein family in M. longifolia using the STRING 12.0 tool (https://string-db.org/, accessed on 14 February 2025) with a confidence score threshold of 0.4 and removal of isolated nodes [57].

5. Conclusions

This study comprehensively characterized NAC transcription factors in M. longifolia. We identified 109 MlNACs distributed across 12 chromosomes. Phylogenetic analysis indicated that MlNACs could be divided into eight distinct sub-families. Expression profiling under low-temperature stress revealed widespread responsiveness of MlNACs to cold stimuli. Notably, five genes—MlNAC040, MlNAC077, MlNAC059, MlNAC078, and MlNAC026—exhibited sustained differential expression, highlighting their potential functional importance. The 3D structural models of key NAC proteins were predicted. By integrating genomic and transcriptomic analyses, this work establishes a foundation for investigating NAC functions in cold adaptation in M. longifolia. These findings hold significant promise for guiding genetic engineering and molecular breeding strategies to enhance cold tolerance in this species.

Supplementary Materials

The following supporting information can be downloaded at: https://www.mdpi.com/article/10.3390/ijms26104713/s1.

Author Contributions

L.Z. secured the funding, supervised the project, and edited the manuscript. Y.C. conceived and designed the study, identified the target gene family, performed integrated multi-omics analyses and data visualization (spanning genomic, transcriptomic and proteomic profiling), interpreted the results, and drafted/revised the manuscript as the primary intellectual contributor. S.W. generated and processed genomic and transcriptomic datasets, conducted resource surveys, and contributed to data visualization. H.L. participated in experimental validation and preliminary analyses, while S.Y. assisted in material preparation. J.Q. and Z.W. coordinated interdisciplinary workflows and constantly cared for Madhuca longifolia in the nursery. J.W. also participated in this work. All authors have read and agreed to the published version of the manuscript.

Funding

This work was funded by the National Natural Science Foundation of China [No. 32371742], Central Forestry and Grassland Ecological Protection and Restoration Fund (National Key Wildlife and Plant Conservation Subsidy) [No. 202422], the Wildlife Conservation and Management Projects of the Guangdong Forestry Bureau in 2022 and 2023, and the Forestry Department of Guangdong Province, China, for the research on non-commercial ecological forests [No. 2020STGYL0019].

Institutional Review Board Statement

Not applicable.

Informed Consent Statement

Not applicable.

Data Availability Statement

We have already stored the genomic sequence data used in this article in the Genome Warehouse of the National Genomics Data Center at the Beijing Institute of Genomics, Chinese Academy of Sciences/China National Center for Bioinformation. The access number is GWHDTZT00000000. These data are publicly available at https://ngdc.cncb.ac.cn/gwh (accessed on 3 September 2024).

Acknowledgments

The authors would like to express their gratitude to Gene Denovo Biotechnology Co. (Guangzhou, China) for the support provided to this project.

Conflicts of Interest

The authors declare that they have no conflicts of interest.

References

  1. Yadav, P.; Singh, D.; Mallik, A.; Nayak, S. Madhuca longifolia (Sapotaceae): A review of its traditional uses, phytochemistry and pharmacology. Int. J. Biomed. Res. 2012, 3, 291–305. [Google Scholar] [CrossRef]
  2. Sinha, J.; Singh, V.; Singh, J.; Rai, A.K. Phytochemistry, ethnomedical uses and future prospects of Mahua (Madhuca longifolia) as a food: A review. J. Nutr. Food Sci. 2017, 7, 1000573. [Google Scholar] [CrossRef]
  3. Wang, S.; Lin, H.; Ye, S.; Jiao, Z.; Chen, Z.; Ma, Y.; Zhang, L. High-quality chromosome-level genomic insights into molecular adaptation to low-temperature stress in Madhuca longifolia in southern subtropical China. BMC Genom. 2024, 25, 877. [Google Scholar] [CrossRef]
  4. Zhou, L.; Ullah, F.; Zou, J.; Zeng, X. Molecular and Physiological Responses of Plants that Enhance Cold Tolerance. Int. J. Mol. Sci. 2025, 26, 1157. [Google Scholar] [CrossRef] [PubMed]
  5. Ye, Q.; Zheng, L.; Liu, P.; Liu, Q.; Ji, T.; Liu, J.; Gao, Y.; Liu, L.; Dong, J.; Wang, T. The S-acylation cycle of transcription factor MtNAC80 influences cold stress responses in Medicago truncatula. Plant Cell 2024, 36, 2629–2651. [Google Scholar] [CrossRef]
  6. Figueroa, N.; Gómez, R. Bolstered plant tolerance to low temperatures by overexpressing NAC transcription factors: Identification of critical variables by meta-analysis. Planta 2022, 256, 92. [Google Scholar] [CrossRef]
  7. Xie, Q.; Frugis, G.; Colgan, D.; Chua, N.H. Arabidopsis NAC1 transduces auxin signal downstream of TIR1 to promote lateral root development. Genes. Dev. 2000, 14, 3024–3036. [Google Scholar] [CrossRef]
  8. He, X.; Mu, R.; Cao, W.; Zhang, Z.; Zhang, J.; Chen, S. AtNAC2, a transcription factor downstream of ethylene and auxin signaling pathways, is involved in salt stress response and lateral root development. Plant J. 2005, 44, 903–916. [Google Scholar] [CrossRef]
  9. Nuruzzaman, M.; Manimekalai, R.; Sharoni, A.M.; Satoh, K.; Kondoh, H.; Ooka, H.; Kikuchi, S. Genome-wide analysis of NAC transcription factor family in rice. Gene 2010, 465, 30–44. [Google Scholar] [CrossRef]
  10. Li, F.; Guo, X.; Liu, J.; Zhou, F.; Liu, W.; Wu, J.; Zhang, H.; Cao, H.; Su, H.; Wen, R. Genome-Wide Identification, Characterization, and Expression Analysis of the NAC Transcription Factor in Chenopodium quinoa. Genes 2019, 10, 500. [Google Scholar] [CrossRef]
  11. Su, H.; Zhang, S.; Yuan, X.; Chen, C.; Wang, X.; Hao, Y. Genome-wide analysis and identification of stress-responsive genes of the NAM-ATAF1,2-CUC2 transcription factor family in apple. Plant Physiol. Biochem. 2013, 71, 11–21. [Google Scholar] [CrossRef] [PubMed]
  12. Jia, D.; Jiang, Z.; Fu, H.; Chen, L.; Liao, G.; He, Y.; Huang, C.; Xu, X. Genome-wide identification and comprehensive analysis of NAC family genes involved in fruit development in kiwifruit (Actinidia). BMC Plant Biol. 2021, 21, 44. [Google Scholar] [CrossRef] [PubMed]
  13. Singh, A.K.; Sharma, V.; Pal, A.K.; Acharya, V.; Ahuja, P.S. Genome-wide organization and expression profiling of the NAC transcription factor family in potato (Solanum tuberosum L.). DNA Res. 2013, 20, 403–423. [Google Scholar] [CrossRef]
  14. Jin, J.F.; Wang, Z.Q.; He, Q.Y.; Wang, J.Y.; Li, P.F.; Xu, J.M.; Zheng, S.J.; Fan, W.; Yang, J.L. Genome-wide identification and expression analysis of the NAC transcription factor family in tomato (Solanum lycopersicum) during aluminum stress. BMC Genom. 2020, 21, 288. [Google Scholar] [CrossRef] [PubMed]
  15. Peng, X.; Zhao, Y.; Li, X.; Wu, M.; Chai, W.; Sheng, L.; Wang, Y.; Dong, Q.; Jiang, H.; Cheng, B. Genomewide identification, classification and analysis of NAC type gene family in maize. J. Genet. 2015, 94, 377–390. [Google Scholar] [CrossRef]
  16. Liu, T.; Song, X.; Duan, W.; Huang, Z.; Liu, G.; Li, Y.; Hou, X. Genome-Wide Analysis and Expression Patterns of NAC Transcription Factor Family Under Different Developmental Stages and Abiotic Stresses in Chinese Cabbage. Plant Mol. Biol. Rep. 2014, 32, 1041–1056. [Google Scholar] [CrossRef]
  17. Abdoulaye, A.H.; Yuhua, C.; Xiaoyan, Z.; Yiwei, Y.; Wang, H.; Yinhua, C. Computational analysis and expression profiling of NAC transcription factor family involved in biotic stress response in Manihot esculenta. Plant Biol. 2024, 26, 1247–1259. [Google Scholar] [CrossRef]
  18. Aslam, B.; Basit, M.; Nisar, M.A.; Khurshid, M.; Rasool, M.H. Proteomics: Technologies and Their Applications. J. Chromatogr. Sci. 2017, 55, 182–196. [Google Scholar] [CrossRef]
  19. Karahalil, B. Overview of Systems Biology and Omics Technologies. Curr. Med. Chem. 2016, 23, 4221–4230. [Google Scholar] [CrossRef]
  20. Ling, L.; Song, L.; Wang, Y.; Guo, C. Genome-wide analysis and expression patterns of the NAC transcription factor family in Medicago truncatula. Physiol. Mol. Biol. Plants 2017, 23, 343–356. [Google Scholar] [CrossRef]
  21. Wang, Q.; Wu, J.; Di, G.; Zhao, Q.; Gao, C.; Zhang, D.; Wang, J.; Shen, Z.; Han, W. Identification of Cold Tolerance Transcriptional Regulatory Genes in Seedlings of Medicago sativa L. and Medicago falcata L. Int. J. Mol. Sci. 2024, 25, 10345. [Google Scholar] [CrossRef] [PubMed]
  22. Soltis, P.S.; Soltis, D.E. Ancient WGD events as drivers of key innovations in angiosperms. Curr. Opin. Plant Biol. 2016, 30, 159–165. [Google Scholar] [CrossRef]
  23. Wu, S.; Han, B.; Jiao, Y. Genetic Contribution of Paleopolyploidy to Adaptive Evolution in Angiosperms. Mol. Plant 2020, 13, 59–71. [Google Scholar] [CrossRef]
  24. Landis, J.B.; Soltis, D.E.; Li, Z.; Marx, H.E.; Barker, M.S.; Tank, D.C.; Soltis, P.S. Impact of whole-genome duplication events on diversification rates in angiosperms. Am. J. Bot. 2018, 105, 348–363. [Google Scholar] [CrossRef]
  25. Clark, J.W.; Donoghue, P.C.J. Whole-Genome Duplication and Plant Macroevolution. Trends Plant Sci. 2018, 23, 933–945. [Google Scholar] [CrossRef]
  26. Ren, R.; Wang, H.; Guo, C.; Zhang, N.; Zeng, L.; Chen, Y.; Ma, H.; Qi, J. Widespread Whole Genome Duplications Contribute to Genome Complexity and Species Diversity in Angiosperms. Mol. Plant 2018, 11, 414–428. [Google Scholar] [CrossRef] [PubMed]
  27. Han, K.; Zhao, Y.; Sun, Y.; Li, Y. NACs, generalist in plant life. Plant Biotechnol. J. 2023, 21, 2433–2457. [Google Scholar] [CrossRef] [PubMed]
  28. Sun, L.; Li, D.; Zhang, H.; Song, F. Functions of NAC transcription factors in biotic and abiotic stress responses in plants. Yi Chuan 2012, 34, 993–1002. [Google Scholar] [CrossRef]
  29. Diao, W.; Snyder, J.C.; Wang, S.; Liu, J.; Pan, B.; Guo, G.; Ge, W.; Dawood, M.H.S.A. Genome-Wide Analyses of the NAC Transcription Factor Gene Family in Pepper (Capsicum annuum L.): Chromosome Location, Phylogeny, Structure, Expression Patterns, Cis-Elements in the Promoter, and Interaction Network. Int. J. Mol. Sci. 2018, 19, 1028. [Google Scholar] [CrossRef]
  30. Li, Q.; Zhang, H.; Yang, Y.; Tang, K.; Yang, Y.; Ouyang, W.; Du, G. Genome-Wide Identification of NAC Family Genes and Their Expression Analyses in Response to Osmotic Stress in Cannabis sativa L. Int. J. Mol. Sci. 2024, 25, 9466. [Google Scholar] [CrossRef]
  31. Wang, X.; Li, D.; Jiang, J.; Dong, Z.; Ma, Y. Soybean NAC gene family: Sequence analysis and expression under low nitrogen supply. Biol. Plant. 2017, 61, 473–482. [Google Scholar] [CrossRef]
  32. Mohanta, T.K.; Yadav, D.; Khan, A.; Hashem, A.; Tabassum, B.; Khan, A.L.; Abd Allah, E.F.; Al-Harrasi, A. Genomics, molecular and evolutionary perspective of NAC transcription factors. PLoS ONE 2020, 15, e0231425. [Google Scholar] [CrossRef]
  33. Zhu, X.; Chen, J.; Xie, Z.; Gao, J.; Ren, G.; Gao, S.; Zhou, X.; Kuai, B. Jasmonic acid promotes degreening via MYC2/3/4-and ANAC019/055/072-mediated regulation of major chlorophyll catabolic genes. Plant J. 2015, 84, 597–610. [Google Scholar] [CrossRef]
  34. Huang, J.; Piater, L.A.; Dubery, I.A. The NAC transcription factor gene ANAC072 is differentially expressed in Arabidopsis thaliana in response to microbe-associated molecular pattern (MAMP) molecules. Physiol. Mol. Plant Pathol. 2012, 80, 19–27. [Google Scholar] [CrossRef]
  35. Li, S.; Gao, J.; Yao, L.; Ren, G.; Zhu, X.; Gao, S.; Qiu, K.; Zhou, X.; Kuai, B. The role of ANAC072 in the regulation of chlorophyll degradation during age- and dark-induced leaf senescence. Plant Cell Rep. 2016, 35, 1729–1741. [Google Scholar] [CrossRef]
  36. Sukiran, N.L.; Ma, J.C.; Ma, H.; Su, Z. ANAC019 is required for recovery of reproductive development under drought stress in Arabidopsis. Plant Mol. Biol. 2019, 99, 161–174. [Google Scholar] [CrossRef]
  37. Bu, Q.; Jiang, H.; Li, C.; Zhai, Q.; Zhang, J.; Wu, X.; Sun, J.; Xie, Q.; Li, C. Role of the Arabidopsis thaliana NAC transcription factors ANAC019 and ANAC055 in regulating jasmonic acid-signaled defense responses. Cell Res. 2008, 18, 756–767. [Google Scholar] [CrossRef]
  38. Kang, M.; Kim, S.; Kim, H.J.; Shrestha, P.; Yun, J.; Phee, B.; Lee, W.; Nam, H.G.; Chang, I. The C-Domain of the NAC Transcription Factor ANAC019 Is Necessary for pH-Tuned DNA Binding through a Histidine Switch in the N-Domain. Cell Rep. 2018, 22, 1141–1150. [Google Scholar] [CrossRef]
  39. Zhang, S.; Chen, Y.; Zhao, L.; Li, C.; Yu, J.; Li, T.; Yang, W.; Zhang, S.; Su, H.; Wang, L. A novel NAC transcription factor, MdNAC42, regulates anthocyanin accumulation in red-fleshed apple by interacting with MdMYB10. Tree Physiol. 2020, 40, 413–423. [Google Scholar] [CrossRef] [PubMed]
  40. Sun, Q.; Jiang, S.; Zhang, T.; Xu, H.; Fang, H.; Zhang, J.; Su, M.; Wang, Y.; Zhang, Z.; Wang, N.; et al. Apple NAC transcription factor MdNAC52 regulates biosynthesis of anthocyanin and proanthocyanidin through MdMYB9 and MdMYB11. Plant Sci. 2019, 289, 110286. [Google Scholar] [CrossRef] [PubMed]
  41. Xiong, H.; He, H.; Chang, Y.; Miao, B.; Liu, Z.; Wang, Q.; Dong, F.; Xiong, L. Multiple roles of NAC transcription factors in plant development and stress responses. J. Integr. Plant Biol. 2025, 67, 510–538. [Google Scholar] [CrossRef]
  42. Nakashima, K.; Takasaki, H.; Mizoi, J.; Shinozaki, K.; Yamaguchi-Shinozaki, K. NAC transcription factors in plant abiotic stress responses. Biochim. Biophys Acta 2012, 1819, 97–103. [Google Scholar] [CrossRef]
  43. Mathew, I.E.; Das, S.; Mahto, A.; Agarwal, P. Three Rice NAC Transcription Factors Heteromerize and Are Associated with Seed Size. Front. Plant Sci. 2016, 7, 1638. [Google Scholar] [CrossRef]
  44. Lamesch, P.; Berardini, T.Z.; Li, D.; Swarbreck, D.; Wilks, C.; Sasidharan, R.; Muller, R.; Dreher, K.; Alexander, D.L.; Garcia-Hernandez, M.; et al. The Arabidopsis Information Resource (TAIR): Improved gene annotation and new tools. Nucleic Acids Res. 2012, 40, D1202–D1210. [Google Scholar] [CrossRef]
  45. Paysan-Lafosse, T.; Andreeva, A.; Blum, M.; Chuguransky, S.R.; Grego, T.; Pinto, B.L.; Salazar, G.A.; Bileschi, M.L.; Llinares-Lopez, F.; Meng-Papaxanthos, L.; et al. The Pfam protein families database: Embracing AI/ML. Nucleic Acids Res. 2025, 53, D523–D534. [Google Scholar] [CrossRef] [PubMed]
  46. Chen, C.; Chen, H.; Zhang, Y.; Thomas, H.R.; Frank, M.H.; He, Y.; Xia, R. TBtools: An Integrative Toolkit Developed for Interactive Analyses of Big Biological Data. Mol. Plant 2020, 13, 1194–1202. [Google Scholar] [CrossRef]
  47. Duvaud, S.; Gabella, C.; Lisacek, F.; Stockinger, H.; Ioannidis, V.; Durinx, C. Expasy, the Swiss Bioinformatics Resource Portal, as designed by its users. Nucleic Acids Res. 2021, 49, W216–W227. [Google Scholar] [CrossRef]
  48. Horton, P.; Park, K.; Obayashi, T.; Fujita, N.; Harada, H.; Adams-Collier, C.J.; Nakai, K. WoLF PSORT: Protein localization predictor. Nucleic Acids Res. 2007, 35, W585–W587. [Google Scholar] [CrossRef]
  49. Tamura, K.; Stecher, G.; Kumar, S. MEGA11: Molecular Evolutionary Genetics Analysis Version 11. Mol. Biol. Evol. 2021, 38, 3022–3027. [Google Scholar] [CrossRef]
  50. Xie, J.; Chen, Y.; Cai, G.; Cai, R.; Hu, Z.; Wang, H. Tree Visualization By One Table (tvBOT): A web application for visualizing, modifying and annotating phylogenetic trees. Nucleic Acids Res. 2023, 51, W587–W592. [Google Scholar] [CrossRef]
  51. Goodstein, D.M.; Shu, S.; Howson, R.; Neupane, R.; Hayes, R.D.; Fazo, J.; Mitros, T.; Dirks, W.; Hellsten, U.; Putnam, N.; et al. Phytozome: A comparative platform for green plant genomics. Nucleic Acids Res. 2012, 40, D1178–D1186. [Google Scholar] [CrossRef]
  52. Bailey, T.L.; Johnson, J.; Grant, C.E.; Noble, W.S. The MEME Suite. Nucleic Acids Res. 2015, 43, W39–W49. [Google Scholar] [CrossRef]
  53. Lescot, M.; Dehais, P.; Thijs, G.; Marchal, K.; Moreau, Y.; Van de Peer, Y.; Rouze, P.; Rombauts, S. PlantCARE, a database of plant cis-acting regulatory elements and a portal to tools for in silico analysis of promoter sequences. Nucleic Acids Res. 2002, 30, 325–327. [Google Scholar] [CrossRef]
  54. Robinson, M.D.; McCarthy, D.J.; Smyth, G.K. edgeR: A Bioconductor package for differential expression analysis of digital gene expression data. Bioinformatics 2010, 26, 139–140. [Google Scholar] [CrossRef]
  55. Love, M.I.; Huber, W.; Anders, S. Moderated estimation of fold change and dispersion for RNA-seq data with DESeq2. Genome Biol. 2014, 15, 550. [Google Scholar] [CrossRef]
  56. Waterhouse, A.; Bertoni, M.; Bienert, S.; Studer, G.; Tauriello, G.; Gumienny, R.; Heer, F.T.; de Beer, T.A.P.; Rempfer, C.; Bordoli, L.; et al. SWISS-MODEL: Homology modelling of protein structures and complexes. Nucleic Acids Res. 2018, 46, W296–W303. [Google Scholar] [CrossRef]
  57. Szklarczyk, D.; Gable, A.L.; Nastou, K.C.; Lyon, D.; Kirsch, R.; Pyysalo, S.; Doncheva, N.T.; Legeay, M.; Fang, T.; Bork, P.; et al. The STRING database in 2021: Customizable protein-protein networks, and functional characterization of user-uploaded gene/measurement sets. Nucleic Acids Res. 2021, 49, D605–D612. [Google Scholar] [CrossRef]
Figure 1. Chromosomal localization of MlNAC genes. Chromosome numbers are displayed at the middle point of each chromosome. The scale bars on the left denote genomic length in mega-bases (Mb). Red regions on each chromosome signify high gene density. Blue regions indicate low gene density.
Ijms 26 04713 g001
Figure 2. Phylogenetic analysis of MlNAC genes. A neighbor-joining (NJ) phylogenetic tree was constructed by MEGA 11.0, using full-length MlNAC protein sequences with 1000 bootstrap replicates. The 109 NAC proteins were classified into eight distinct subgroups (A–H). We highlighted each subgroup by a unique color.
Ijms 26 04713 g002
Figure 3. Phylogenetic analysis of Madhuca longifolia and Arabidopsis thalian NAC genes. An NJ phylogenetic tree was generated by MEGA 11.0, based on full-length NAC gene sequences from both species with 1000 bootstrap replicates. Purple pentagrams preceding AtNAC entries denote A. thaliana genes. Green triangles preceding MlNAC entries represent M. longifolia genes. All NAC genes were classified into 12 distinct subfamilies (A–L). Each subgroup was labeled with a unique color.
Ijms 26 04713 g003
Figure 4. Phylogenetic analysis of Madhuca longifolia and Malus domestica NAC genes. An NJ phylogenetic tree was constructed by MEGA 11.0, using full-length MlNAC and MdNAC sequences with 1000 bootstrap replicates. Purple pentagrams preceding MlNAC entries denote M. longifolia genes. Green markers preceding MdNAC entries represent M. domestica genes. The 109 NAC genes were classified into nine distinct subfamilies (A–I). Each subgroup was highlighted with a unique color.
Ijms 26 04713 g004
Figure 5. Phylogenetic analysis of Madhuca longifolia and Medicago truncatula NAC genes. An NJ phylogenetic tree was constructed using NAC gene sequences from both species (1000 bootstrap replications). Purple pentagrams preceding MtNAC entries denote M. truncatula genes. Green triangles preceding MlNAC entries represent M. longifolia genes. All NAC genes were classified into 12 distinct subfamilies (A–J), each highlighted with a unique color.
Ijms 26 04713 g005
Figure 6. The collinearity analysis of 109 NAC genes is visualized in a circular layout. Gray lines within the inner circle denote intrachromosomal collinear blocks in M. longifolia. Red lines highlight replication events associated with MlNAC genes. Chromosome names and NAC gene names are, respectively, labeled on the inner and outer sides of each chromosome. Heatmap and lines illustrate gene density distribution. The redder the color, the higher the gene density.
Ijms 26 04713 g006
Figure 7. Perform interspecific synteny analysis on Madhuca longifolia (M. longifolia) with Populus trichocarpa (P. trichocarpa), Arabidopsis thaliana (A. thaliana), Oryza sativa (O. sativa), Vitis vinifera (V. vinifera), and Solanum tuberosum (S. tuberosum). The gray lines in the background represent syntenic blocks between M. longifolia and the other species. The red lines highlight the syntenic NAC gene pairs.
Ijms 26 04713 g007
Figure 8. The gene structure of the NAC gene family in M. longifolia. (A) The neighbor-joining phylogenetic tree of MlNAC genes. (B) The conserved motifs of MlNAC genes. The digit in the box represents the motif number. (C) The conserved domain of MlNAC genes. (D) The exon and intron structure of MlNAC genes. The green boxes represent untranslated regions. The yellow boxes indicate the coding sequences. The gray line signify the intron structure of MlNAC genes.
Ijms 26 04713 g008
Figure 9. The cis-acting elements of the promoter sequences of NAC genes in M. longifolia were predicted. The 17 squares on the right represent the various cis-acting elements of the promoter. And the Neighbor-Joining phylogenetic tree on the left indicates the similarities among NAC genes.
Ijms 26 04713 g009
Figure 10. Analysis of the number of cis-acting elements in M. longifolia. (A) The phylogenic tree of NAC genes in M. longifolia. (B) Heatmap of the number of cis-acting elements in the corresponding gene. The count of cis-acting elements is in the box. (C) The stacked bar chart visualizes the number of four-kind elements. The elements are classified into four groups: Phytohormone, Light response and Plant development.
Ijms 26 04713 g010
Figure 11. Venn diagram of MlNAC genes with differential expression on the 1st, 3rd, 5th, and 7th days (D1, D3, D5 and D7) under low temperature conditions.
Ijms 26 04713 g011
Figure 13. Three-dimensional structure of 8 key MlNAC proteins. (a) Three-dimensional structure of the protein in sub-family F, MlNAC006. (b) Three-dimensional structure of the protein in sub-family E, MlNAC016. (c) Three-dimensional structure of the protein in sub-family F, MlNAC26. (d) Three-dimensional structure of the protein in sub-family E, MlNAC040. (e) Three-dimensional structure of the protein in sub-family E, MlNAC042. (f) Three-dimensional structure of the protein in sub-family E, MlNAC043. (g) Three-dimensional structure of the protein in sub-family F, MlNAC077. (h) Three-dimensional structure of the protein in sub-family F, MlNAC078.
Ijms 26 04713 g013
Figure 14. Visualization of the protein–protein interaction of MlNACs using the STRING 12.0 online tool with Arabidopsis thaliana as the reference genome. Notably, the proteins (MlNAC058, MlNAC080, MlNAC082, MlNAC086, MlNAC098, and MlNAC101) are present even at high confidence levels. They are more likely to be key nodes.
Ijms 26 04713 g014
Table 1. Prediction of physicochemical properties and subcellular localization of MlNAC proteins.
Sequence IDNumber of Amino AcidMolecular WeightTheoretical pIInstability IndexAliphatic IndexGrand Average of HydropathicitySubcellular Localization
MlNAC00115418,067.569.0230.7862.01−0.736cyto
MlNAC00218421,329.258.6438.5562.55−0.723cyto
MlNAC00326329,405.188.1843.9970.08−0.488cyto
MlNAC00424027,362.788.6543.8860.88−0.789nucl
MlNAC00538943,528.928.6659.1859.46−0.54nucl
MlNAC00629333,207.459.1732.862.25−0.68nucl
MlNAC00742948,232.665.0450.3267.67−0.796chlo
MlNAC00831736,579.045.855.161.32−0.792cyto
MlNAC00960266,549.725.1141.4773.22−0.361nucl
MlNAC01065774,134.145.8751.8567.84−0.615plas
MlNAC01139044,480.426.1949.7872.97−0.482nucl
MlNAC01215718,572.198.6638.9762.74−0.743mito
MlNAC01334338,898.955.4446.9160.52−0.678nucl
MlNAC01439944,718.466.0345.3459.67−0.603nucl
MlNAC01547052,209.884.8549.9664.96−0.683nucl
MlNAC01663070,689.884.7550.0764.83−0.647nucl
MlNAC01763070,690.554.949.0767.33−0.588nucl
MlNAC01826230,223.445.4347.559.16−0.858nucl
MlNAC01931835,802.996.1441.5563.24−0.615nucl
MlNAC02035438,681.944.4633.9474.72−0.421cyto
MlNAC02121824,918.814.8447.8860.78−0.753nucl
MlNAC02236040,498.048.1333.370.42−0.523nucl
MlNAC02345150,548.996.3346.3859.02−0.908nucl
MlNAC02434938,608.437.1148.7364.04−0.494nucl
MlNAC02534838,494.097.8142.2969.83−0.63nucl
MlNAC02634038,058.88.9141.2362.5−0.586nucl
MlNAC02732136,823.036.6131.964.39−0.856cysk
MlNAC02834037,832.756.9848.3561.59−0.518nucl
MlNAC02928933,036.785.3853.963.77−0.684nucl
MlNAC03025529,119.46.4658.4449.33−0.908nucl
MlNAC03126029,481.48.942.3363.04−0.669nucl
MlNAC03271379,667.295.5657.4569.16−0.651nucl
MlNAC03332436,182.555.0243.5759.26−0.8nucl
MlNAC03435441,066.816.1955.2757.32−0.891pero
MlNAC03534138,750.115.1248.4148.53−0.734nucl
MlNAC03625829,094.26.5545.853.64−0.99nucl
MlNAC03738043,909.445.1956.1358.71−1.016nucl
MlNAC03842348,492.125.8545.252.03−0.861nucl
MlNAC03944750,537.865.1348.3976.51−0.599cyto
MlNAC04053960,286.635.4440.6367.46−0.619nucl
MlNAC04135741,689.576.0153.2963.05−0.889pero
MlNAC04241646,467.245.5744.9975.31−0.6chlo
MlNAC04357363,561.844.5638.9472.67−0.472chlo
MlNAC04477385,627.265.9152.3573.95−0.446nucl
MlNAC04532136,140.68.3247.467.13−0.621nucl_plas
MlNAC04634538,756.198.6634.9173.71−0.492nucl
MlNAC04722525,293.488.9646.1563.24−0.644cyto_nucl
MlNAC04831035,162.776.3341.4571.71−0.555nucl
MlNAC04933737,586.418.5441.5771.1−0.69nucl
MlNAC05024627,882.268.9743.1754.63−0.784nucl
MlNAC05139545,035.597.6445.5360.99−0.701nucl
MlNAC05230734,989.17.6534.3361.01−0.777cyto_nucl
MlNAC053973108,909.95.7145.277.81−0.561nucl
MlNAC05435839,441.277.7935.2463.24−0.649nucl
MlNAC05530333,915.896.6748.7768.84−0.76nucl
MlNAC05631435,957.946.8448.6375.13−0.624nucl
MlNAC05731635,537.076.9643.9266.36−0.552nucl
MlNAC05832436,754.935.0842.1563.77−0.741chlo
MlNAC05930335,187.927.1247.2659.27−0.753nucl
MlNAC06034439,365.825.0552.9761.22−0.802nucl
MlNAC06163572,052.485.3644.3769.24−0.613chlo
MlNAC06235340,551.195.2553.5763.77−0.775nucl
MlNAC06335440,320.375.3437.0264.44−0.626nucl
MlNAC06440245,228.786.4644.7760.65−0.607cyto
MlNAC06538943,220.15.5741.7965.86−0.74nucl
MlNAC06627631,309.619.2752.0264.2−0.704nucl
MlNAC06741847,169.167.1242.957.18−0.877nucl
MlNAC06827131,244.468.9433.2160.74−0.65nucl
MlNAC06934840,141.645.9256.366.41−0.791nucl
MlNAC07040345,594.456.0152.5563.37−0.831nucl
MlNAC07115017,312.428.4938.2559.8−0.808pero
MlNAC0721121123,393.14.9347.1268.22−0.622nucl
MlNAC073943104,588.34.844.6966.31−0.674chlo
MlNAC07427230,613.575.2736.770.26−0.526nucl
MlNAC07543447,312.695.8449.0871.27−0.54nucl
MlNAC07625628,836.658.6754.6879.61−0.308cyto
MlNAC07729733,866.326.6749.7664.07−0.669nucl
MlNAC07834638,621.38.1733.9967.08−0.575nucl
MlNAC07952958,847.399.9752.8364.18−0.792nucl
MlNAC08023026,459.879.7642.9260.04−0.957nucl
MlNAC08132736,894.078.246.7667.09−0.654cyto_nucl
MlNAC08228132,135.795.5524.863.49−0.721cyto
MlNAC08332937,165.147.9346.7959.85−0.561nucl
MlNAC08468879,660.68.6240.5885.17−0.189plas
MlNAC08531536,187.756.8439.1163.78−0.714pero
MlNAC08647553,104.026.4747.4662.25−0.829nucl
MlNAC08728833,471.356.4239.1573.82−0.59cyto_nucl
MlNAC08819121,771.364.9345.1566.81−0.57nucl
MlNAC08938643,746.996.775765.52−0.697nucl
MlNAC09038643,742.126.815765−0.688nucl
MlNAC09128933,014.055.6449.4873.49−0.762nucl
MlNAC09226629,885.385.6438.2567.78−0.759nucl
MlNAC09331135,639.335.4949.1974.6−0.662nucl
MlNAC09424627,940.257.0158.5953.94−0.78nucl
MlNAC09541245,789.476.6362.9574.51−0.592E.R._plas
MlNAC09642548,121.786.2543.3863.72−0.82nucl
MlNAC09739044,041.146.655.2770.51−0.613nucl
MlNAC09813615,415.935.5655.6950.07−0.828nucl
MlNAC09927131,334.046.9742.2969.11−0.616nucl
MlNAC10024027,139.79.3329.8658.58−0.668mito
MlNAC10126631,598.328.6845.9273.61−0.719cyto
MlNAC10238343,051.055.844.5864.73−0.652nucl
MlNAC10322625,452.485.1244.0871.15−0.496chlo
MlNAC10435840,926.245.8148.3960.75−0.846nucl_cyto
MlNAC10511112,421.0710.724.2646.58−0.636chlo
MlNAC10630334,512.56.0644.665.58−0.684chlo
MlNAC10733638,148.585.4243.9867.65−0.739nucl
MlNAC10823426,713.288.8947.8164.96−0.63nucl_plas
MlNAC10939444,477.227.5353.1469.52−0.608golg
Table 2. Analysis of gene duplication types and Ka/Ks ratios for MlNAC duplicate gene pairs.
Gene NameGene NameKaKsKa/Ks
MlNAC016MlNAC0170.193660.540.357643
MlNAC056MlNAC0570.378871.940.194812
MlNAC072MlNAC0730.265210.430.613301
MlNAC073MlNAC0740.179470.220.812852
MlNAC092MlNAC0930.183830.440.415911
MlNAC105MlNAC1060.360740.460.779525
MlNAC005MlNAC0140.25421.850.137437
MlNAC004MlNAC0470.305352.10.145468
MlNAC004MlNAC0500.105980.830.128115
MlNAC005MlNAC0510.260971.130.231595
MlNAC006MlNAC0520.188140.90.209433
MlNAC007MlNAC0530.143920.580.247552
MlNAC014MlNAC0510.3131.990.15738
MlNAC010MlNAC0610.195890.890.2205
MlNAC013MlNAC0630.129920.70.18503
MlNAC014MlNAC0640.12250.450.27049
MlNAC015MlNAC0650.180740.630.287519
MlNAC004MlNAC0660.403892.420.166574
MlNAC005MlNAC0640.254991.580.161317
MlNAC003MlNAC0760.186730.440.427734
MlNAC011MlNAC0870.246093.030.081343
MlNAC022MlNAC0460.119640.60.199585
MlNAC019MlNAC0450.140770.760.184086
MlNAC022MlNAC0630.250311.10.228258
MlNAC027MlNAC0840.145830.770.189329
MlNAC028MlNAC0830.180560.640.28242
MlNAC026MlNAC0780.091750.70.131836
MlNAC029MlNAC0940.326892.290.142457
MlNAC031MlNAC1020.390161.710.228424
MlNAC031MlNAC1070.405843.570.113673
MlNAC029MlNAC1080.345061.50.230004
MlNAC032MlNAC0400.491472.360.208597
MlNAC034MlNAC0410.189191.490.126941
MlNAC033MlNAC0700.191031.20.158538
MlNAC034MlNAC0690.118230.870.135643
MlNAC035MlNAC0680.16360.890.183472
MlNAC032MlNAC0720.62261.980.314718
MlNAC033MlNAC1040.282461.950.144742
MlNAC047MlNAC0500.36597NaNNaN
MlNAC047MlNAC0660.521992.020.258471
MlNAC040MlNAC0720.347010.760.45545
MlNAC041MlNAC0690.21561.80.119882
MlNAC048MlNAC0560.161411.040.155259
MlNAC049MlNAC0550.128890.680.189038
MlNAC050MlNAC0660.407282.880.141278
MlNAC051MlNAC0640.340922.040.167518
MlNAC055MlNAC0800.266421.740.152886
MlNAC049MlNAC0800.255891.970.129971
MlNAC070MlNAC1040.295091.880.157362
MlNAC088MlNAC0980.139611.110.125641
MlNAC087MlNAC0990.15411.490.103642
MlNAC089MlNAC0970.17660.920.192336
MlNAC094MlNAC1080.173621.090.159737
MlNAC095MlNAC1090.209890.670.315408
MlNAC103MlNAC1060.234340.650.361058
MlNAC102MlNAC1070.16650.730.226942
Disclaimer/Publisher’s Note: The statements, opinions and data contained in all publications are solely those of the individual author(s) and contributor(s) and not of MDPI and/or the editor(s). MDPI and/or the editor(s) disclaim responsibility for any injury to people or property resulting from any ideas, methods, instructions or products referred to in the content.

