Figure 1.
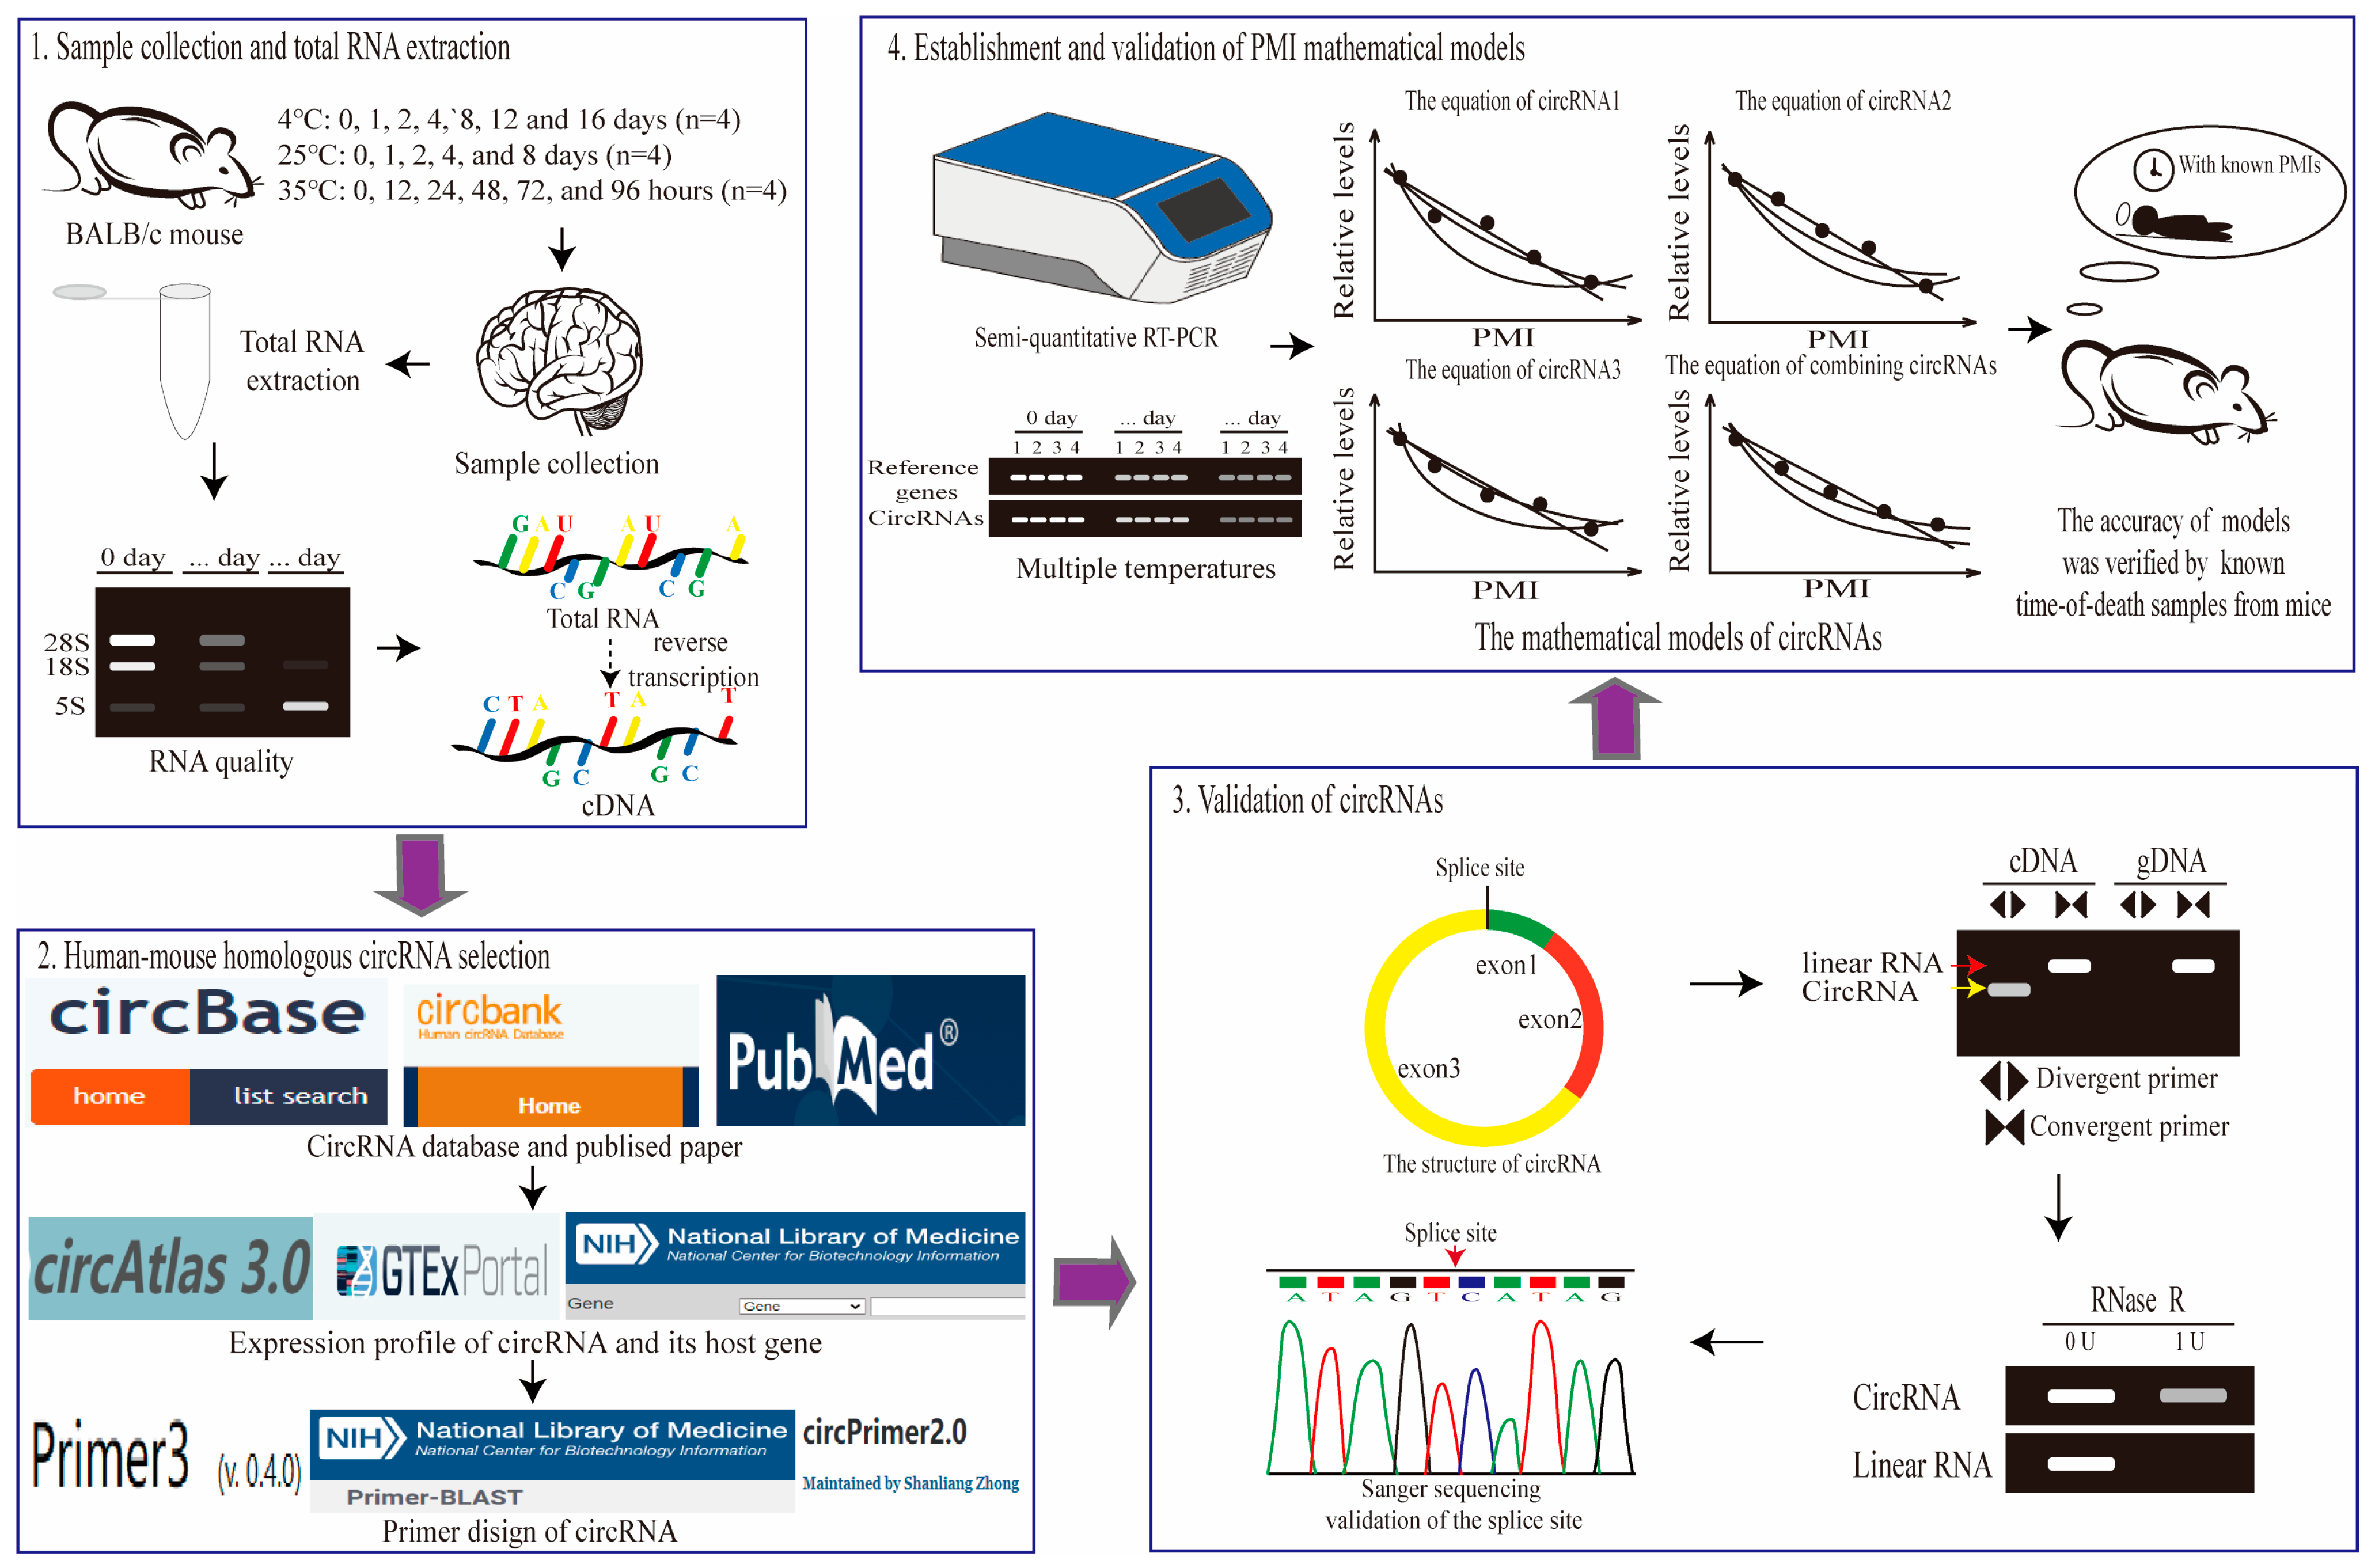
The experimental and analytical workflow in this study. To construct PMI estimation models based on circRNAs at multiple temperatures, the following workflow will be performed. This workflow consists of four main parts: sample collection and total RNA extraction, human–mouse homologous circRNAs selection, validation of circRNAs, and establishment and validation of PMI estimation models.
Figure 1.
The experimental and analytical workflow in this study. To construct PMI estimation models based on circRNAs at multiple temperatures, the following workflow will be performed. This workflow consists of four main parts: sample collection and total RNA extraction, human–mouse homologous circRNAs selection, validation of circRNAs, and establishment and validation of PMI estimation models.
Figure 2.
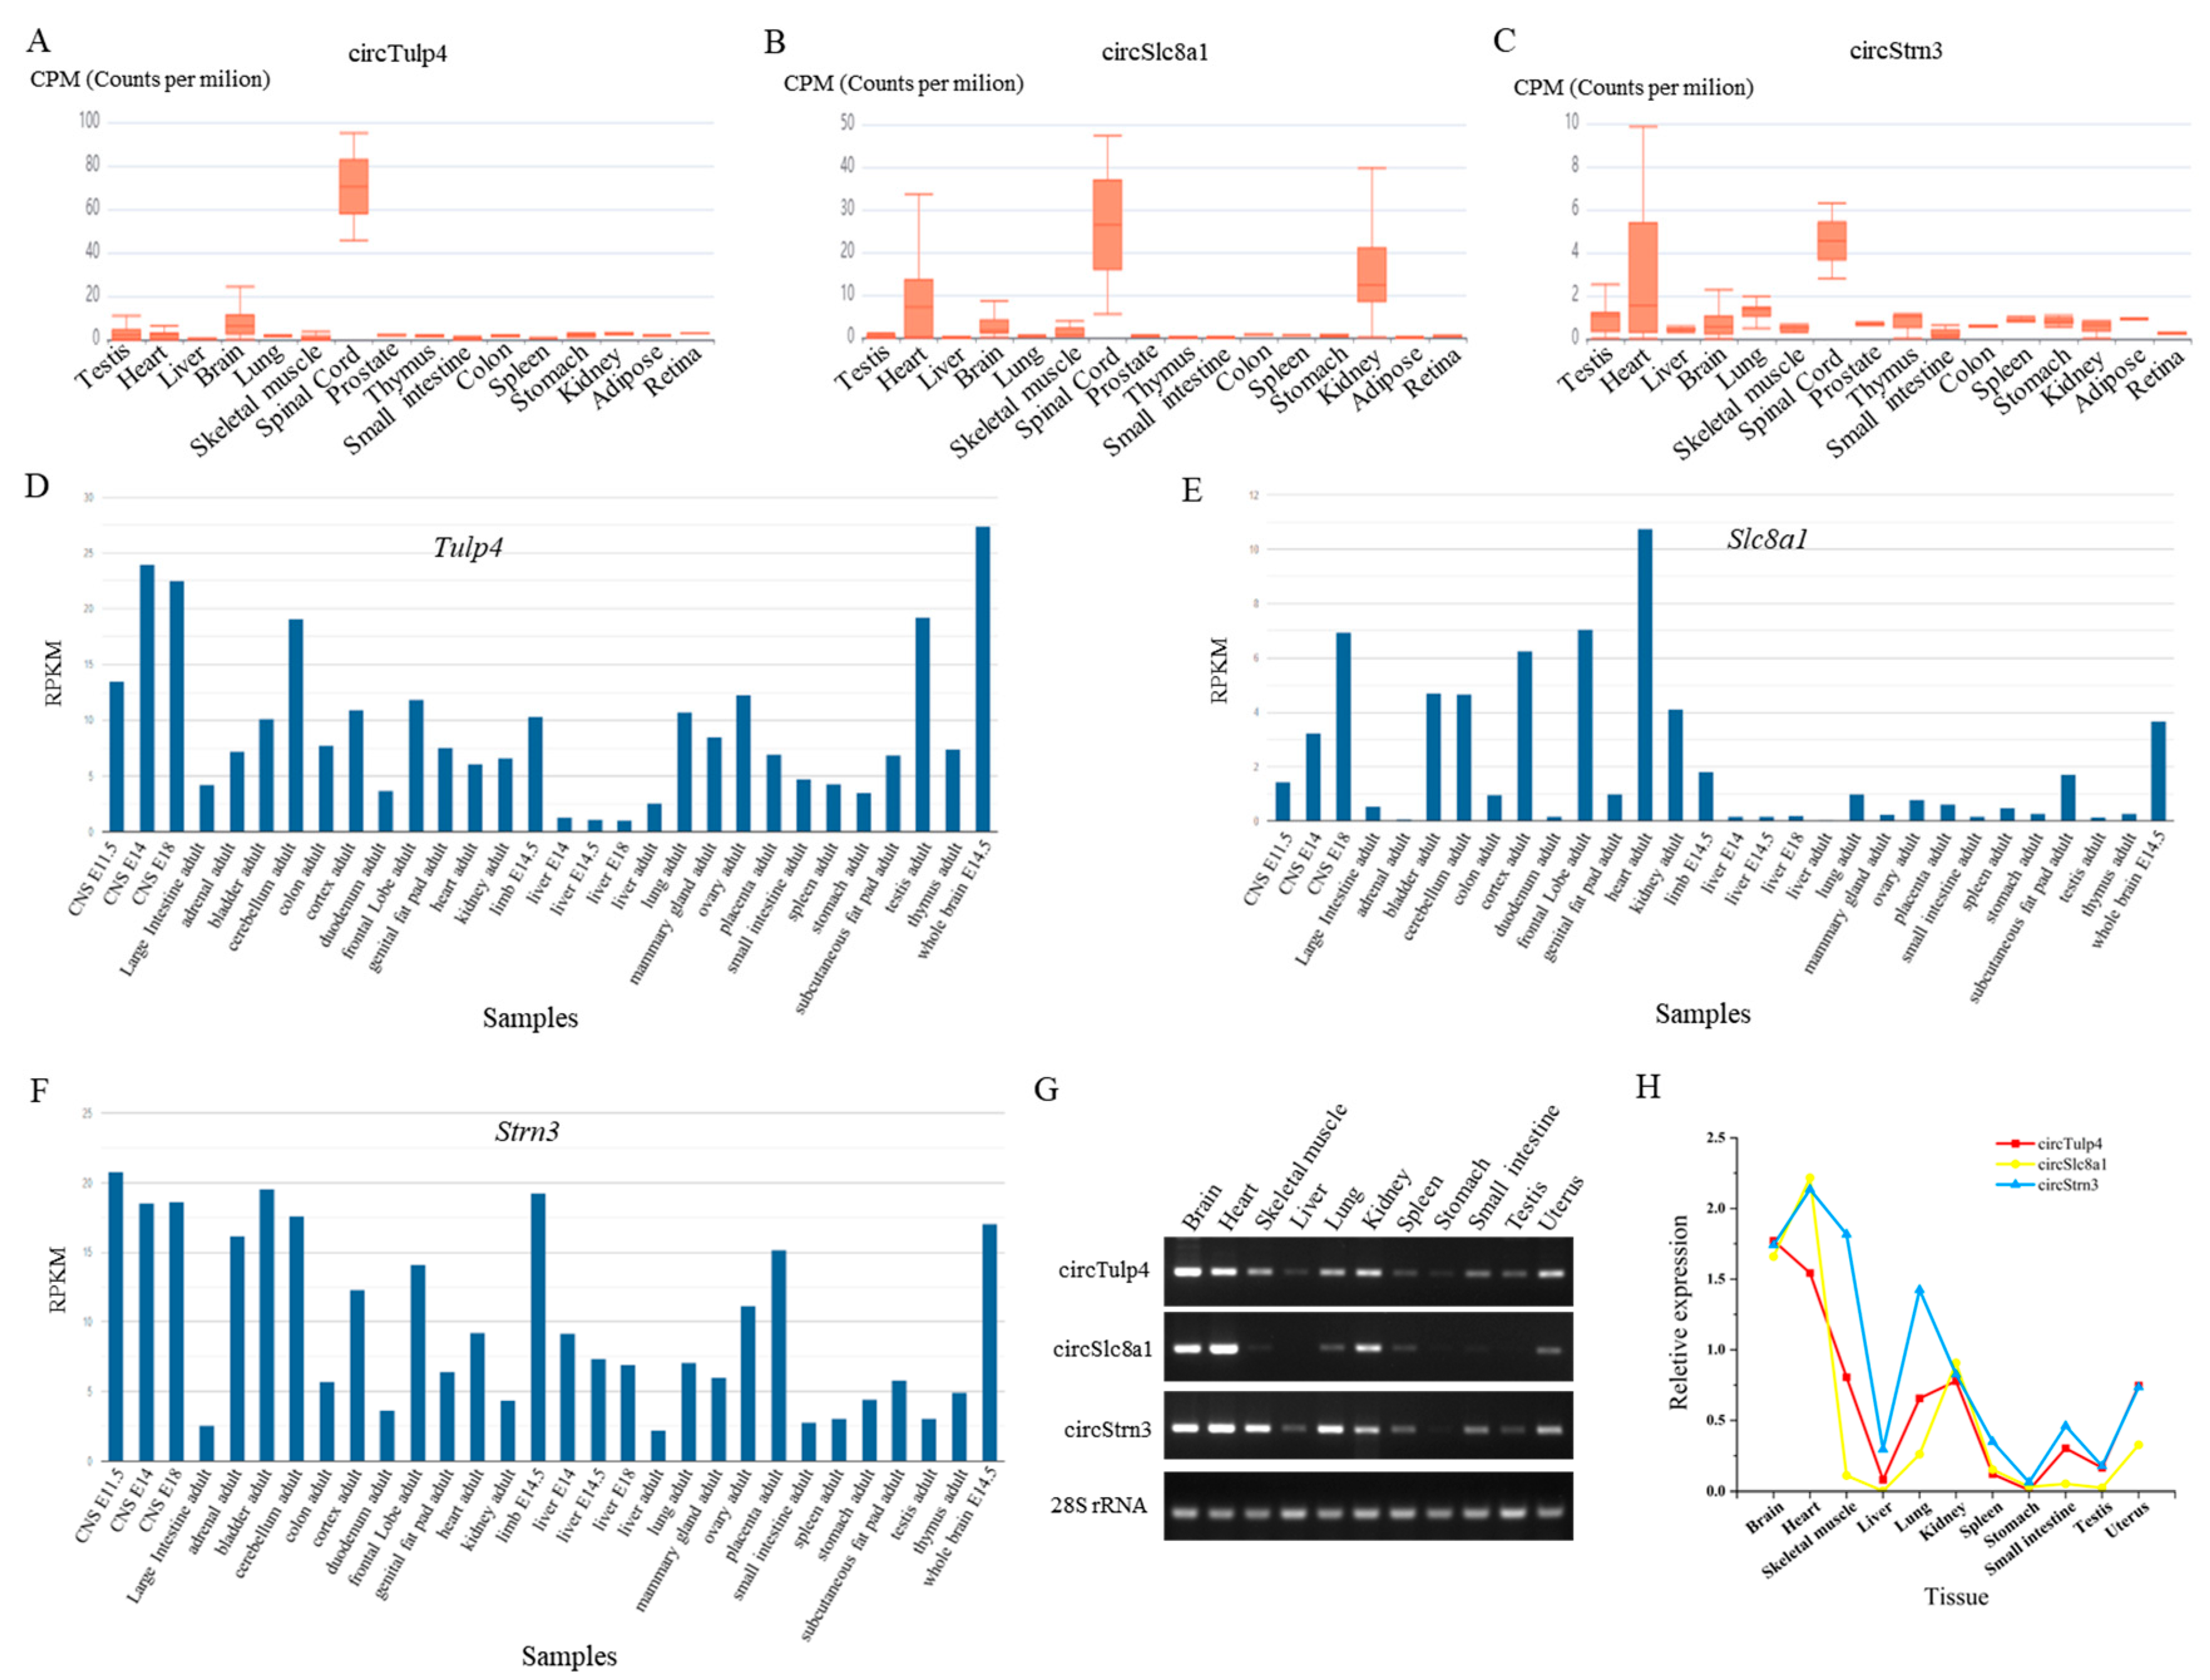
The expression of circRNAs and their host genes in different mouse tissues. (A–C) The expression of circTulp4 (mmu_circ_0000723), circSlc8a1 (mmu_circ_0000823), and circStrn3 (mmu_circ_0000372) in multiple tissues based on the circAtlas database. (D–F) The expression of Tulp4, Slc8a1, and Strn3 genes in multiple tissues based on the NCBI database. (G) The agarose gel electrophoresis results of circTulp4, circSlc8a1, circStrn3, and 28S rRNA in 11 different tissues. (H) The relative expression of circTulp4, circSlc8a1, and circStrn3 in 11 different tissues.
Figure 2.
The expression of circRNAs and their host genes in different mouse tissues. (A–C) The expression of circTulp4 (mmu_circ_0000723), circSlc8a1 (mmu_circ_0000823), and circStrn3 (mmu_circ_0000372) in multiple tissues based on the circAtlas database. (D–F) The expression of Tulp4, Slc8a1, and Strn3 genes in multiple tissues based on the NCBI database. (G) The agarose gel electrophoresis results of circTulp4, circSlc8a1, circStrn3, and 28S rRNA in 11 different tissues. (H) The relative expression of circTulp4, circSlc8a1, and circStrn3 in 11 different tissues.
Figure 3.
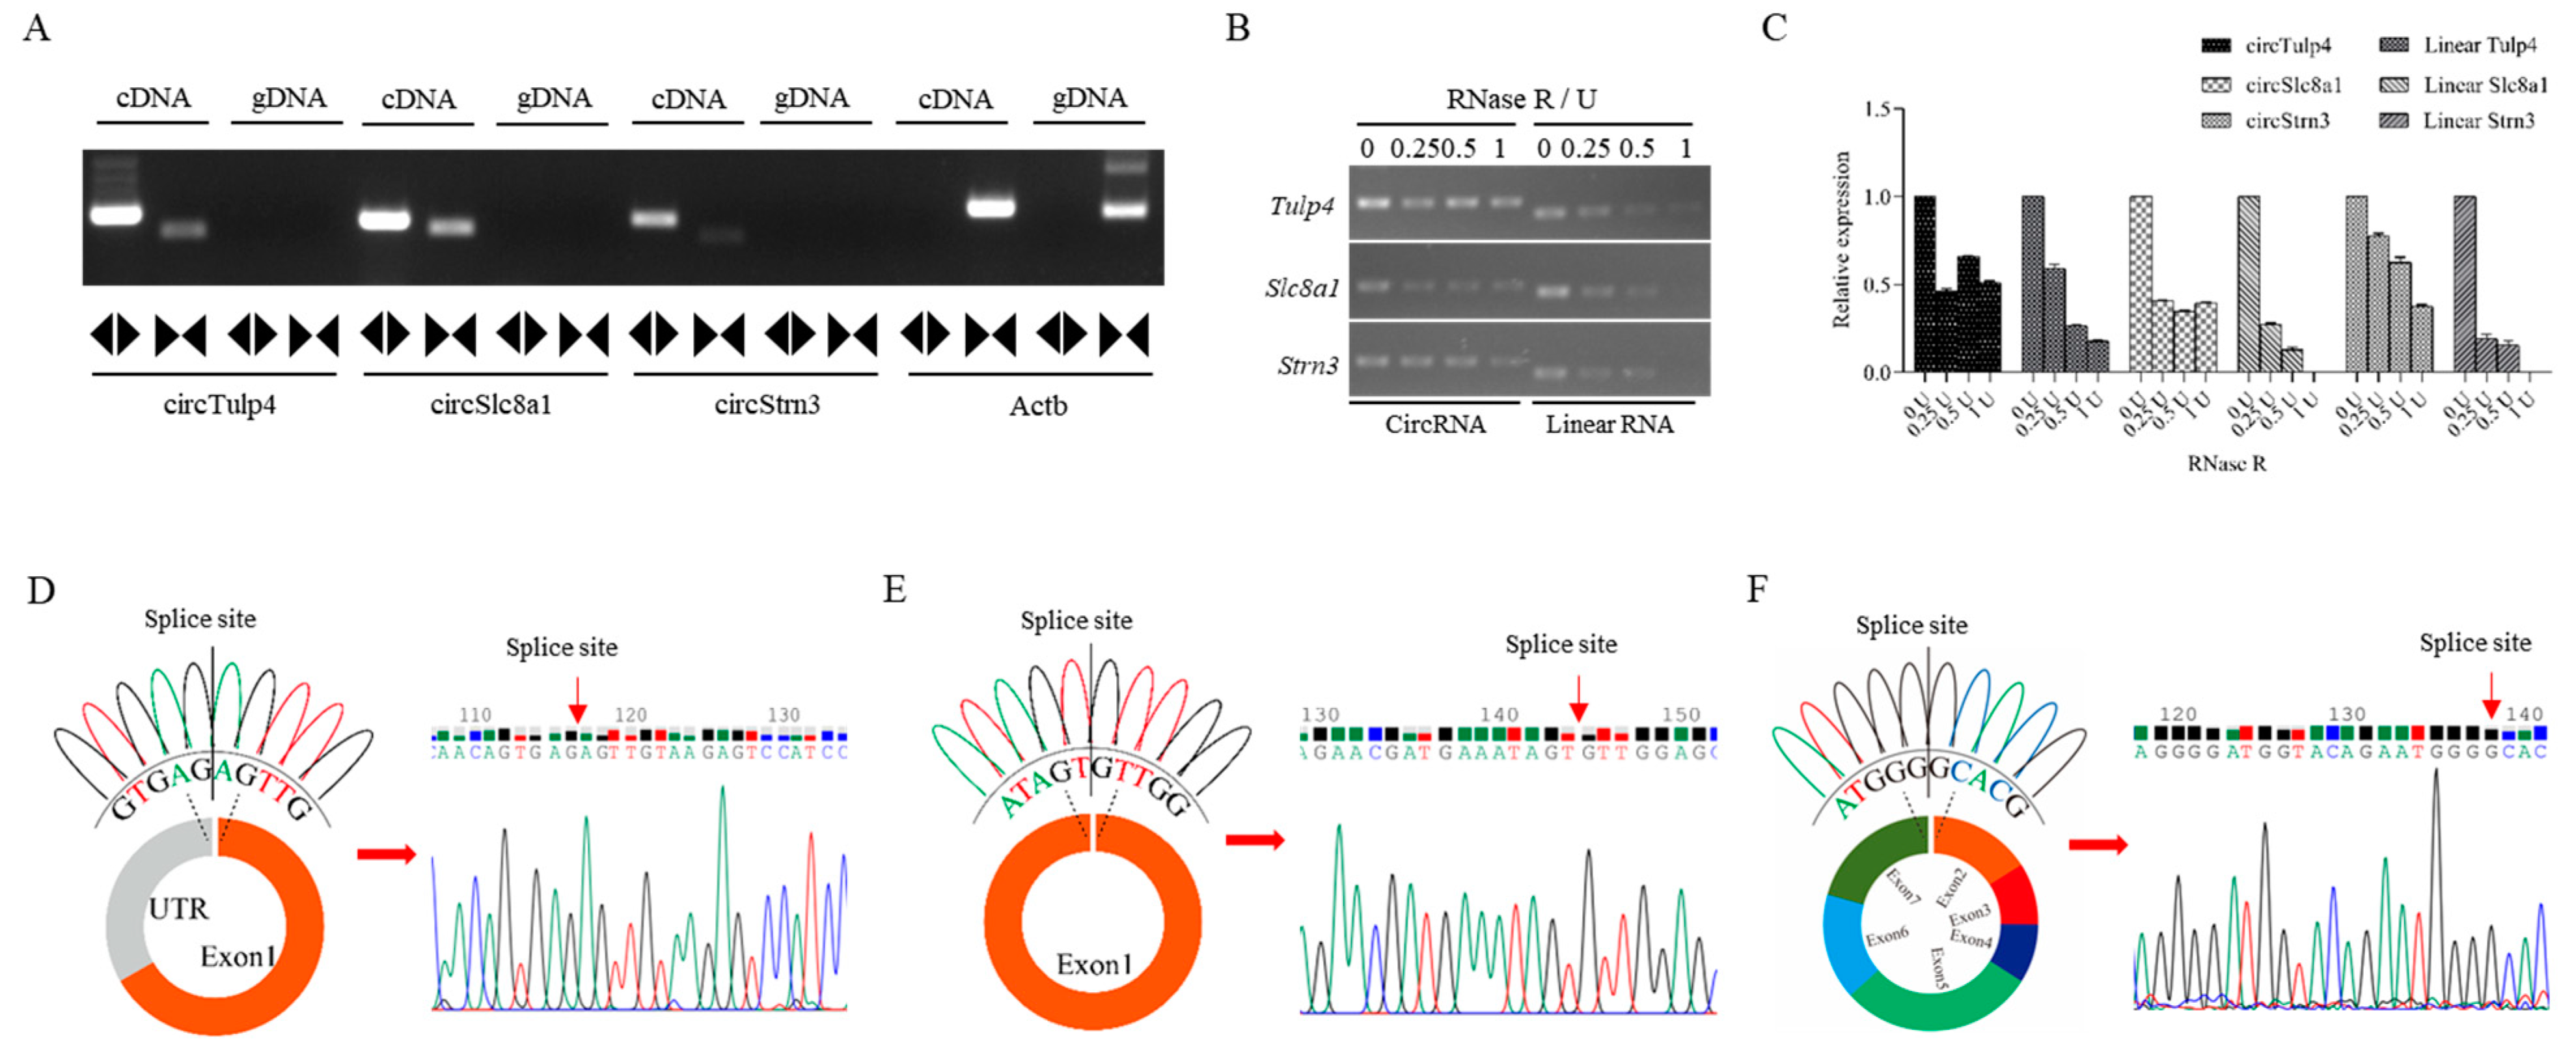
Validation of circTulp4, circSlc8a1, and circStrn3 in mouse brain tissue. (A) The electrophoresis analysis of convergent and divergent primers of circTulp4, circSlc8a1, circStrn3, and Actb in cDNA and gDNA samples. (B) The RNase R digestion analysis of circRNAs and their corresponding linear RNAs in 0 U, 0.25 U, 0.5 U, and 1 U groups. (C) The data analysis of the relative expression of circRNAs and their corresponding linear RNAs after the RNase R digestion. (D–F) The circular structure of circTulp4, circSlc8a1, and circStrn3 and the results of Sanger sequencing. Colored peaks represent individual bases in the sequencing chromatogram: green = A, red = T, blue = C, and black = G.
Figure 3.
Validation of circTulp4, circSlc8a1, and circStrn3 in mouse brain tissue. (A) The electrophoresis analysis of convergent and divergent primers of circTulp4, circSlc8a1, circStrn3, and Actb in cDNA and gDNA samples. (B) The RNase R digestion analysis of circRNAs and their corresponding linear RNAs in 0 U, 0.25 U, 0.5 U, and 1 U groups. (C) The data analysis of the relative expression of circRNAs and their corresponding linear RNAs after the RNase R digestion. (D–F) The circular structure of circTulp4, circSlc8a1, and circStrn3 and the results of Sanger sequencing. Colored peaks represent individual bases in the sequencing chromatogram: green = A, red = T, blue = C, and black = G.
Figure 4.
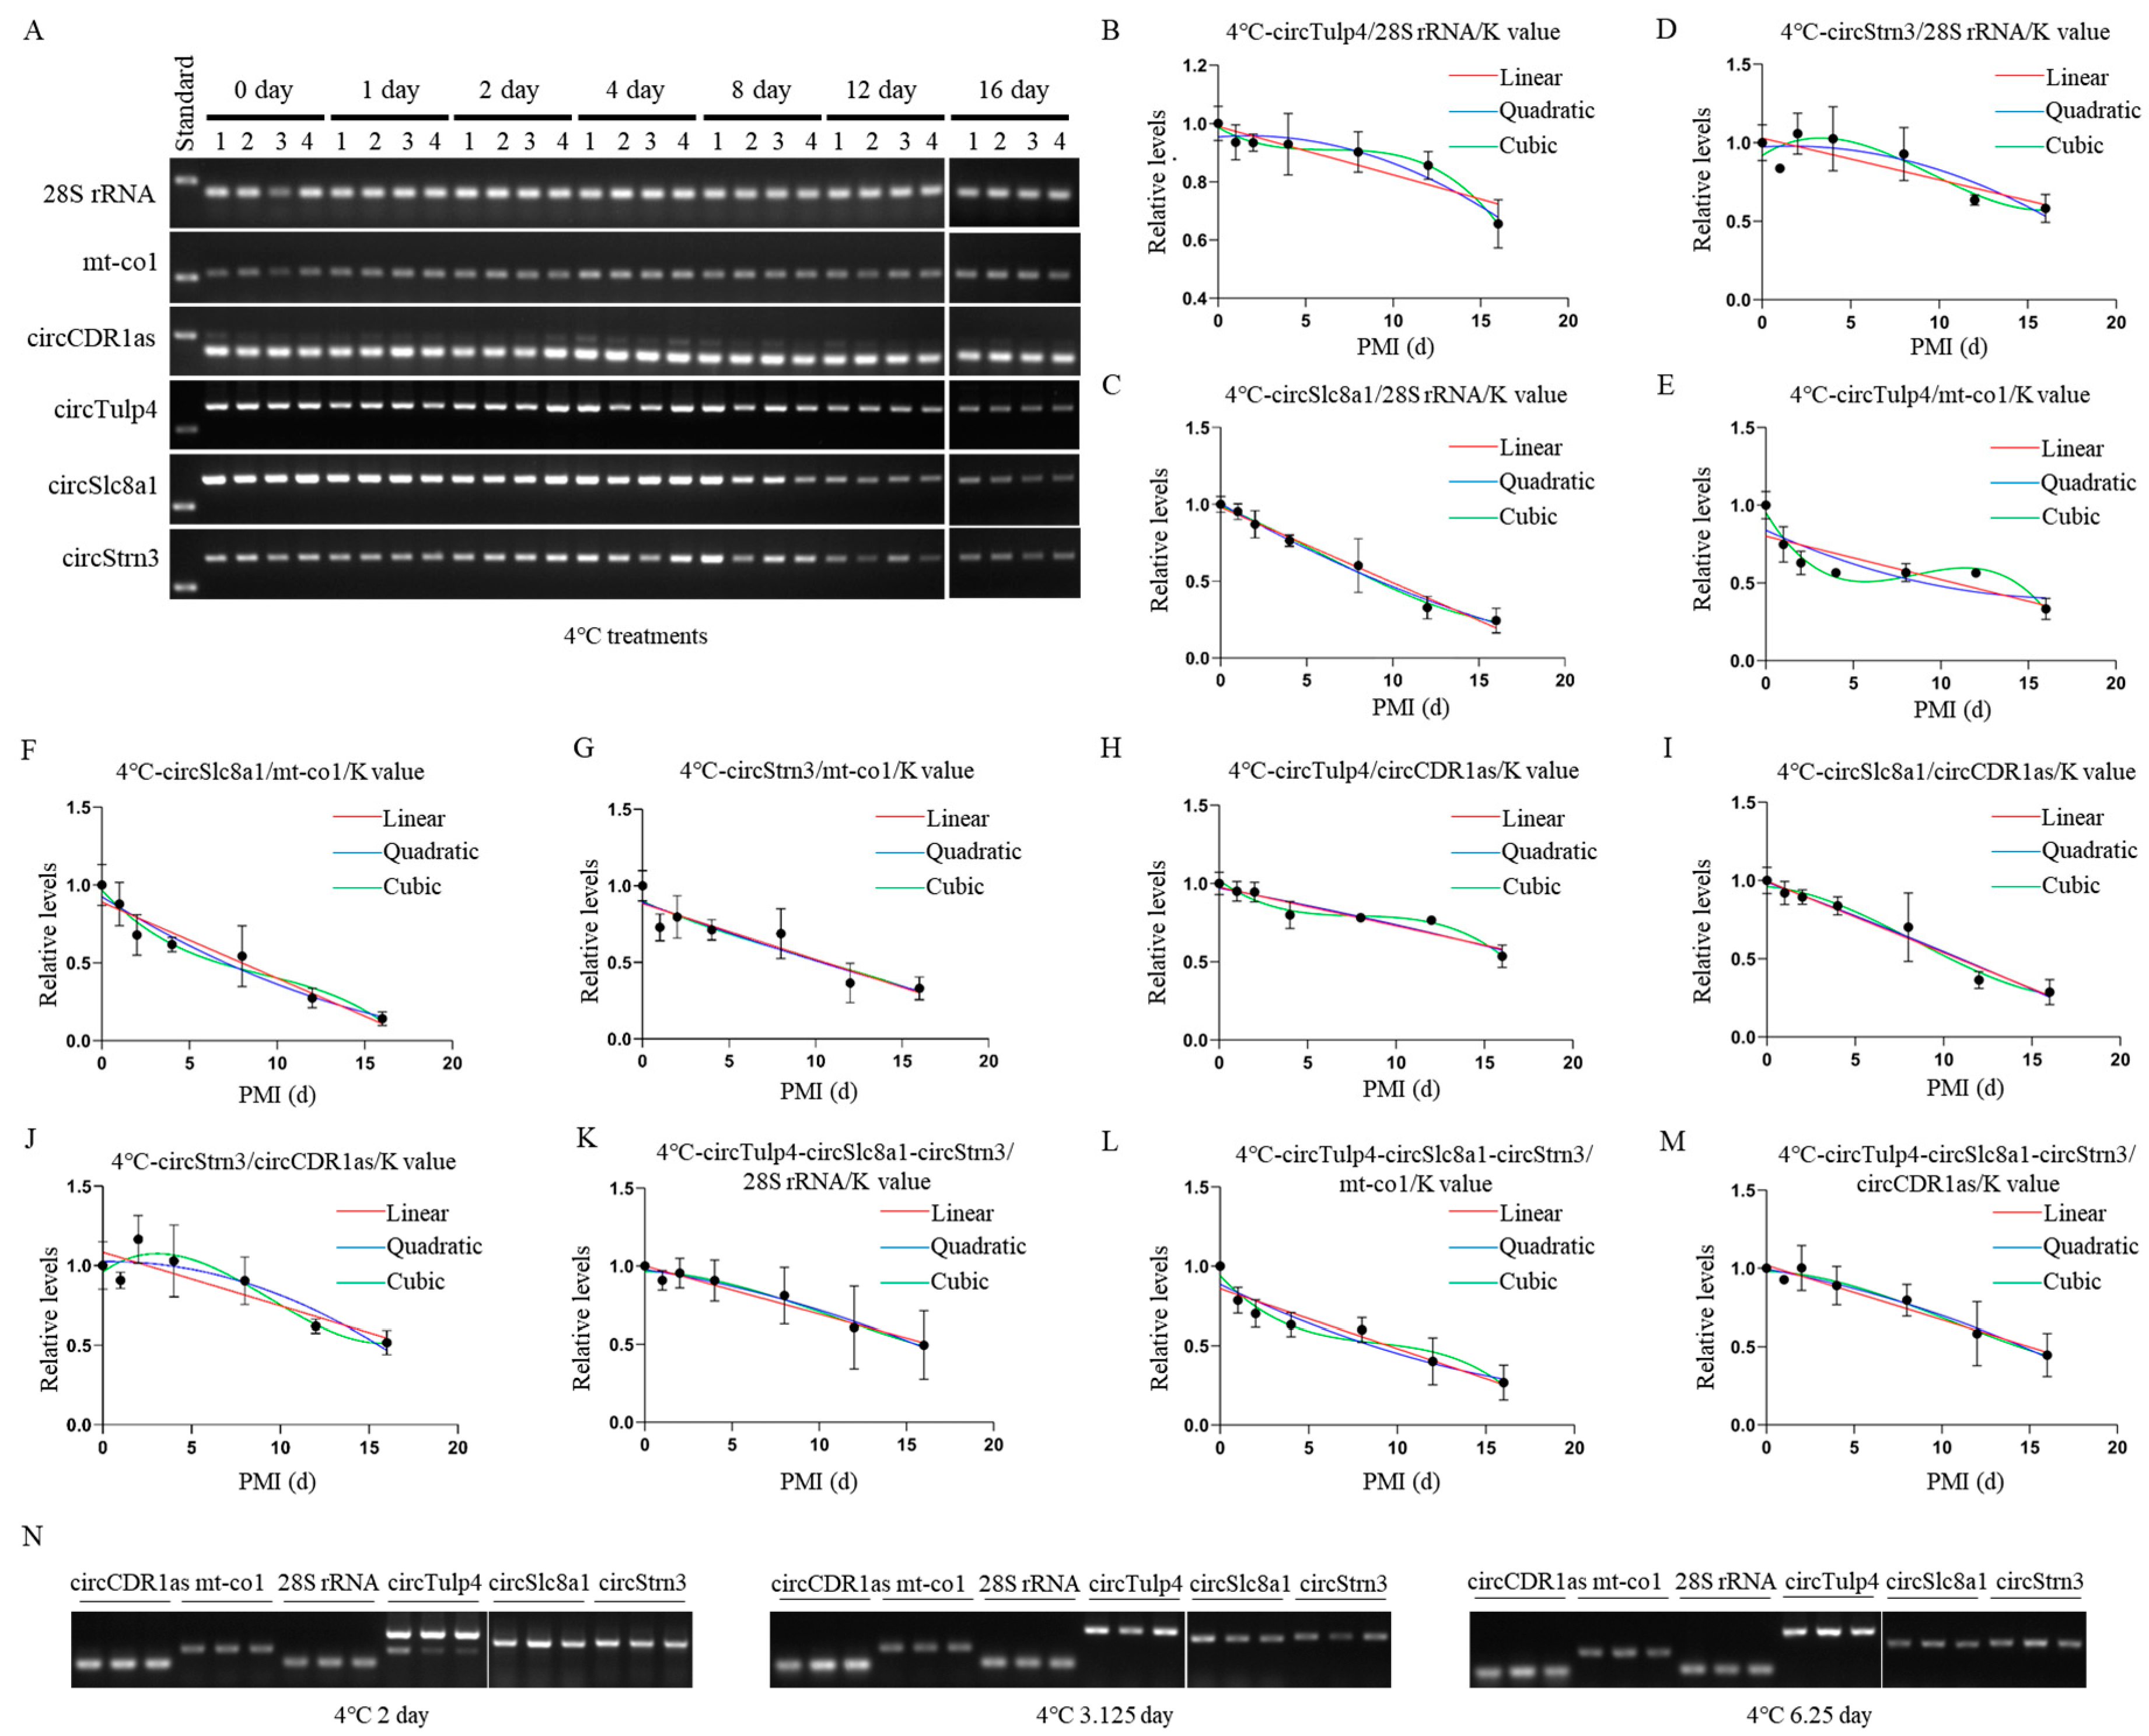
Construction and validation of 4 °C PMI estimation models. (A) The postmortem levels of reference genes 28S rRNA, mt-co1, circCDR1as and the biomarkers circTulp4, circSlc8a1, and circStrn3 in brain tissue on days 0, 1, 2, 4, 8, 12, and 16 at 4 °C. (B–D) The linear, quadratic, and cubic equations constructed at 4 °C based on circTulp4 and the three reference genes 28S rRNA, mt-co1, and circCDR1as, respectively. (E–G) The linear, quadratic, and cubic equations constructed at 4 °C based on circSlc8a1 and the three reference genes 28S rRNA, mt-co1, and circCDR1as, respectively. (H–J) The linear, quadratic, and cubic equations constructed at 4 °C based on circStrn3 and the three reference genes 28S rRNA, mt-co1, and circCDR1as, respectively. (K–M) After the combination of circRNAs, the linear, quadratic, and cubic equations were constructed at 4 °C based on the three reference genes 28S rRNA, mt-co1, and circCDR1as, respectively. (N) The electrophoresis results of the validation samples for the 4 °C equation at 2, 3.125, and 6.25 days.
Figure 4.
Construction and validation of 4 °C PMI estimation models. (A) The postmortem levels of reference genes 28S rRNA, mt-co1, circCDR1as and the biomarkers circTulp4, circSlc8a1, and circStrn3 in brain tissue on days 0, 1, 2, 4, 8, 12, and 16 at 4 °C. (B–D) The linear, quadratic, and cubic equations constructed at 4 °C based on circTulp4 and the three reference genes 28S rRNA, mt-co1, and circCDR1as, respectively. (E–G) The linear, quadratic, and cubic equations constructed at 4 °C based on circSlc8a1 and the three reference genes 28S rRNA, mt-co1, and circCDR1as, respectively. (H–J) The linear, quadratic, and cubic equations constructed at 4 °C based on circStrn3 and the three reference genes 28S rRNA, mt-co1, and circCDR1as, respectively. (K–M) After the combination of circRNAs, the linear, quadratic, and cubic equations were constructed at 4 °C based on the three reference genes 28S rRNA, mt-co1, and circCDR1as, respectively. (N) The electrophoresis results of the validation samples for the 4 °C equation at 2, 3.125, and 6.25 days.
![Ijms 26 04495 g004]()
Figure 5.
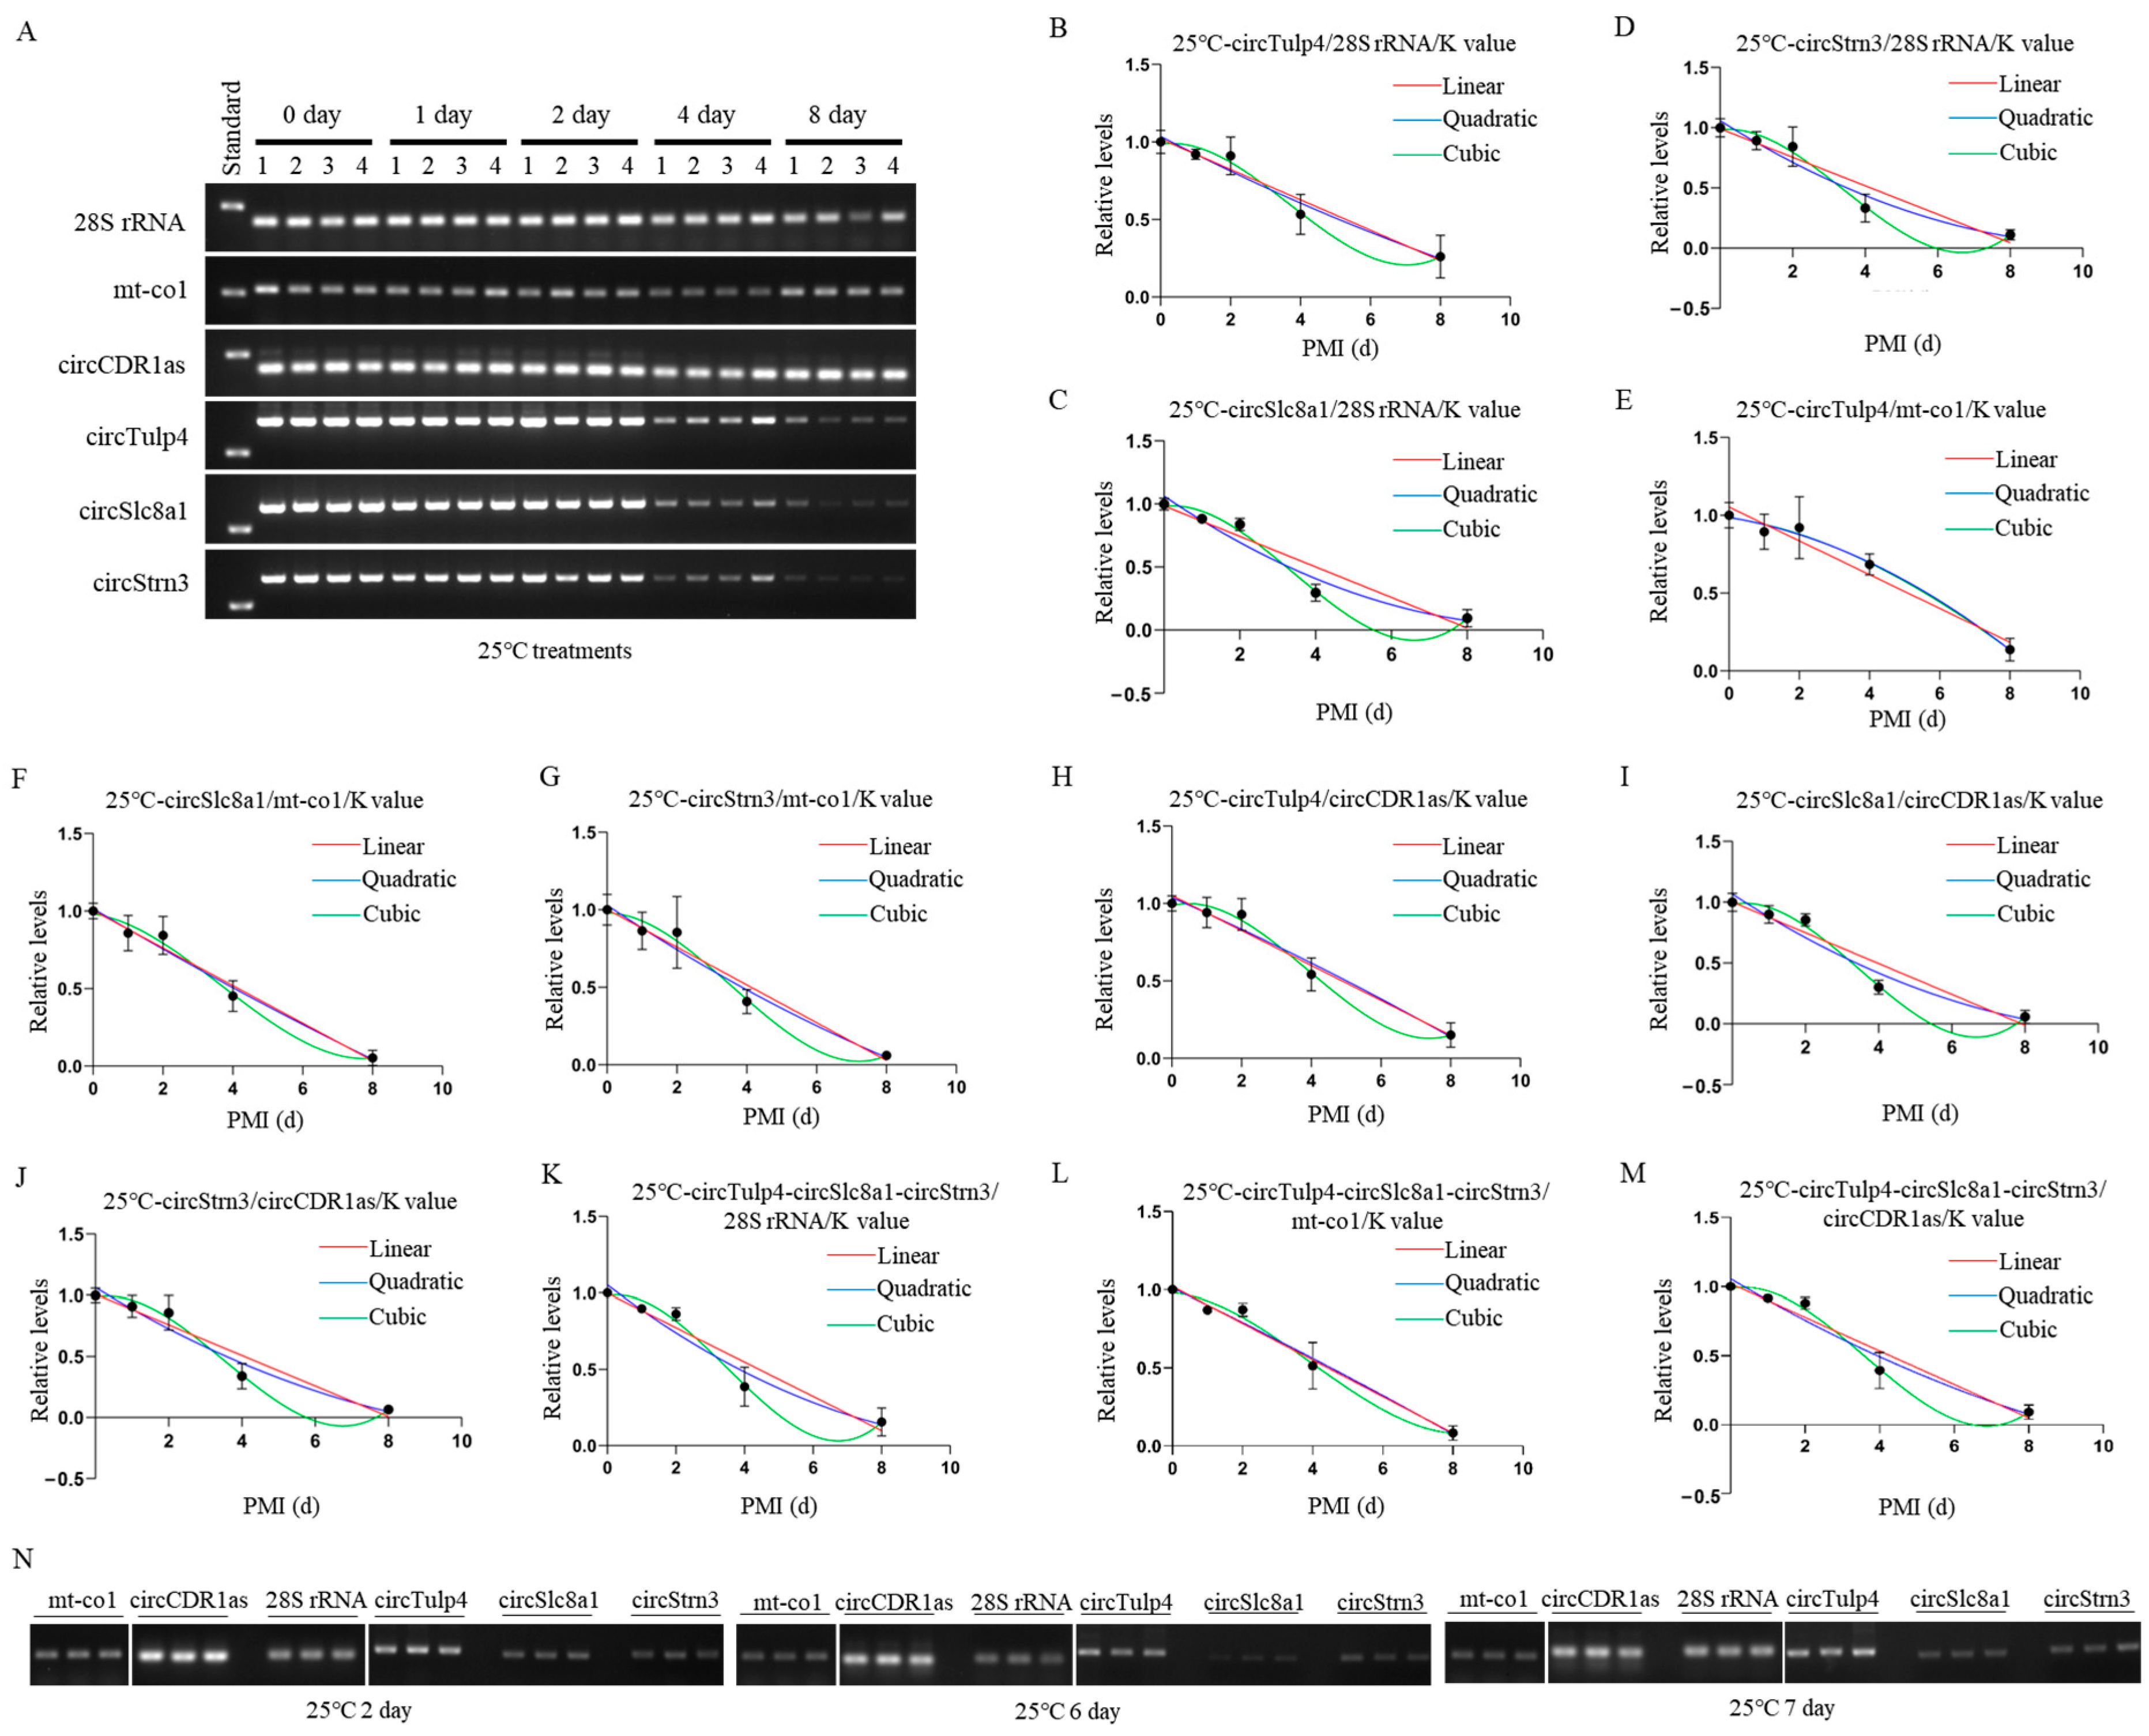
Construction and validation of 25 °C PMI estimation models. (A) The postmortem levels of reference genes 28S rRNA, mt-co1, circCDR1as and the biomarkers circTulp4, circSlc8a1, and circStrn3 in brain tissue on days 0, 1, 2, 4, and 8 at 25 °C. (B–D) The linear, quadratic, and cubic equations constructed at 25 °C based on circTulp4 and the three reference genes 28S rRNA, mt-co1, and circCDR1as, respectively. (E–G) The linear, quadratic, and cubic equations constructed at 25 °C based on circSlc8a1 and the three reference genes 28S rRNA, mt-co1, and circCDR1as, respectively. (H–J) The linear, quadratic, and cubic equations constructed at 25 °C based on circStrn3 and the three reference genes 28S rRNA, mt-co1, and circCDR1as, respectively. (K–M) After the combination of circRNAs, the linear, quadratic, and cubic equations were constructed at 25 °C based on the three reference genes, 28S rRNA, mt-co1, and circCDR1as, respectively. (N) The electrophoresis results of the validation samples for the 25 °C equation at 2, 6, and 7 days.
Figure 5.
Construction and validation of 25 °C PMI estimation models. (A) The postmortem levels of reference genes 28S rRNA, mt-co1, circCDR1as and the biomarkers circTulp4, circSlc8a1, and circStrn3 in brain tissue on days 0, 1, 2, 4, and 8 at 25 °C. (B–D) The linear, quadratic, and cubic equations constructed at 25 °C based on circTulp4 and the three reference genes 28S rRNA, mt-co1, and circCDR1as, respectively. (E–G) The linear, quadratic, and cubic equations constructed at 25 °C based on circSlc8a1 and the three reference genes 28S rRNA, mt-co1, and circCDR1as, respectively. (H–J) The linear, quadratic, and cubic equations constructed at 25 °C based on circStrn3 and the three reference genes 28S rRNA, mt-co1, and circCDR1as, respectively. (K–M) After the combination of circRNAs, the linear, quadratic, and cubic equations were constructed at 25 °C based on the three reference genes, 28S rRNA, mt-co1, and circCDR1as, respectively. (N) The electrophoresis results of the validation samples for the 25 °C equation at 2, 6, and 7 days.
![Ijms 26 04495 g005]()
Figure 6.
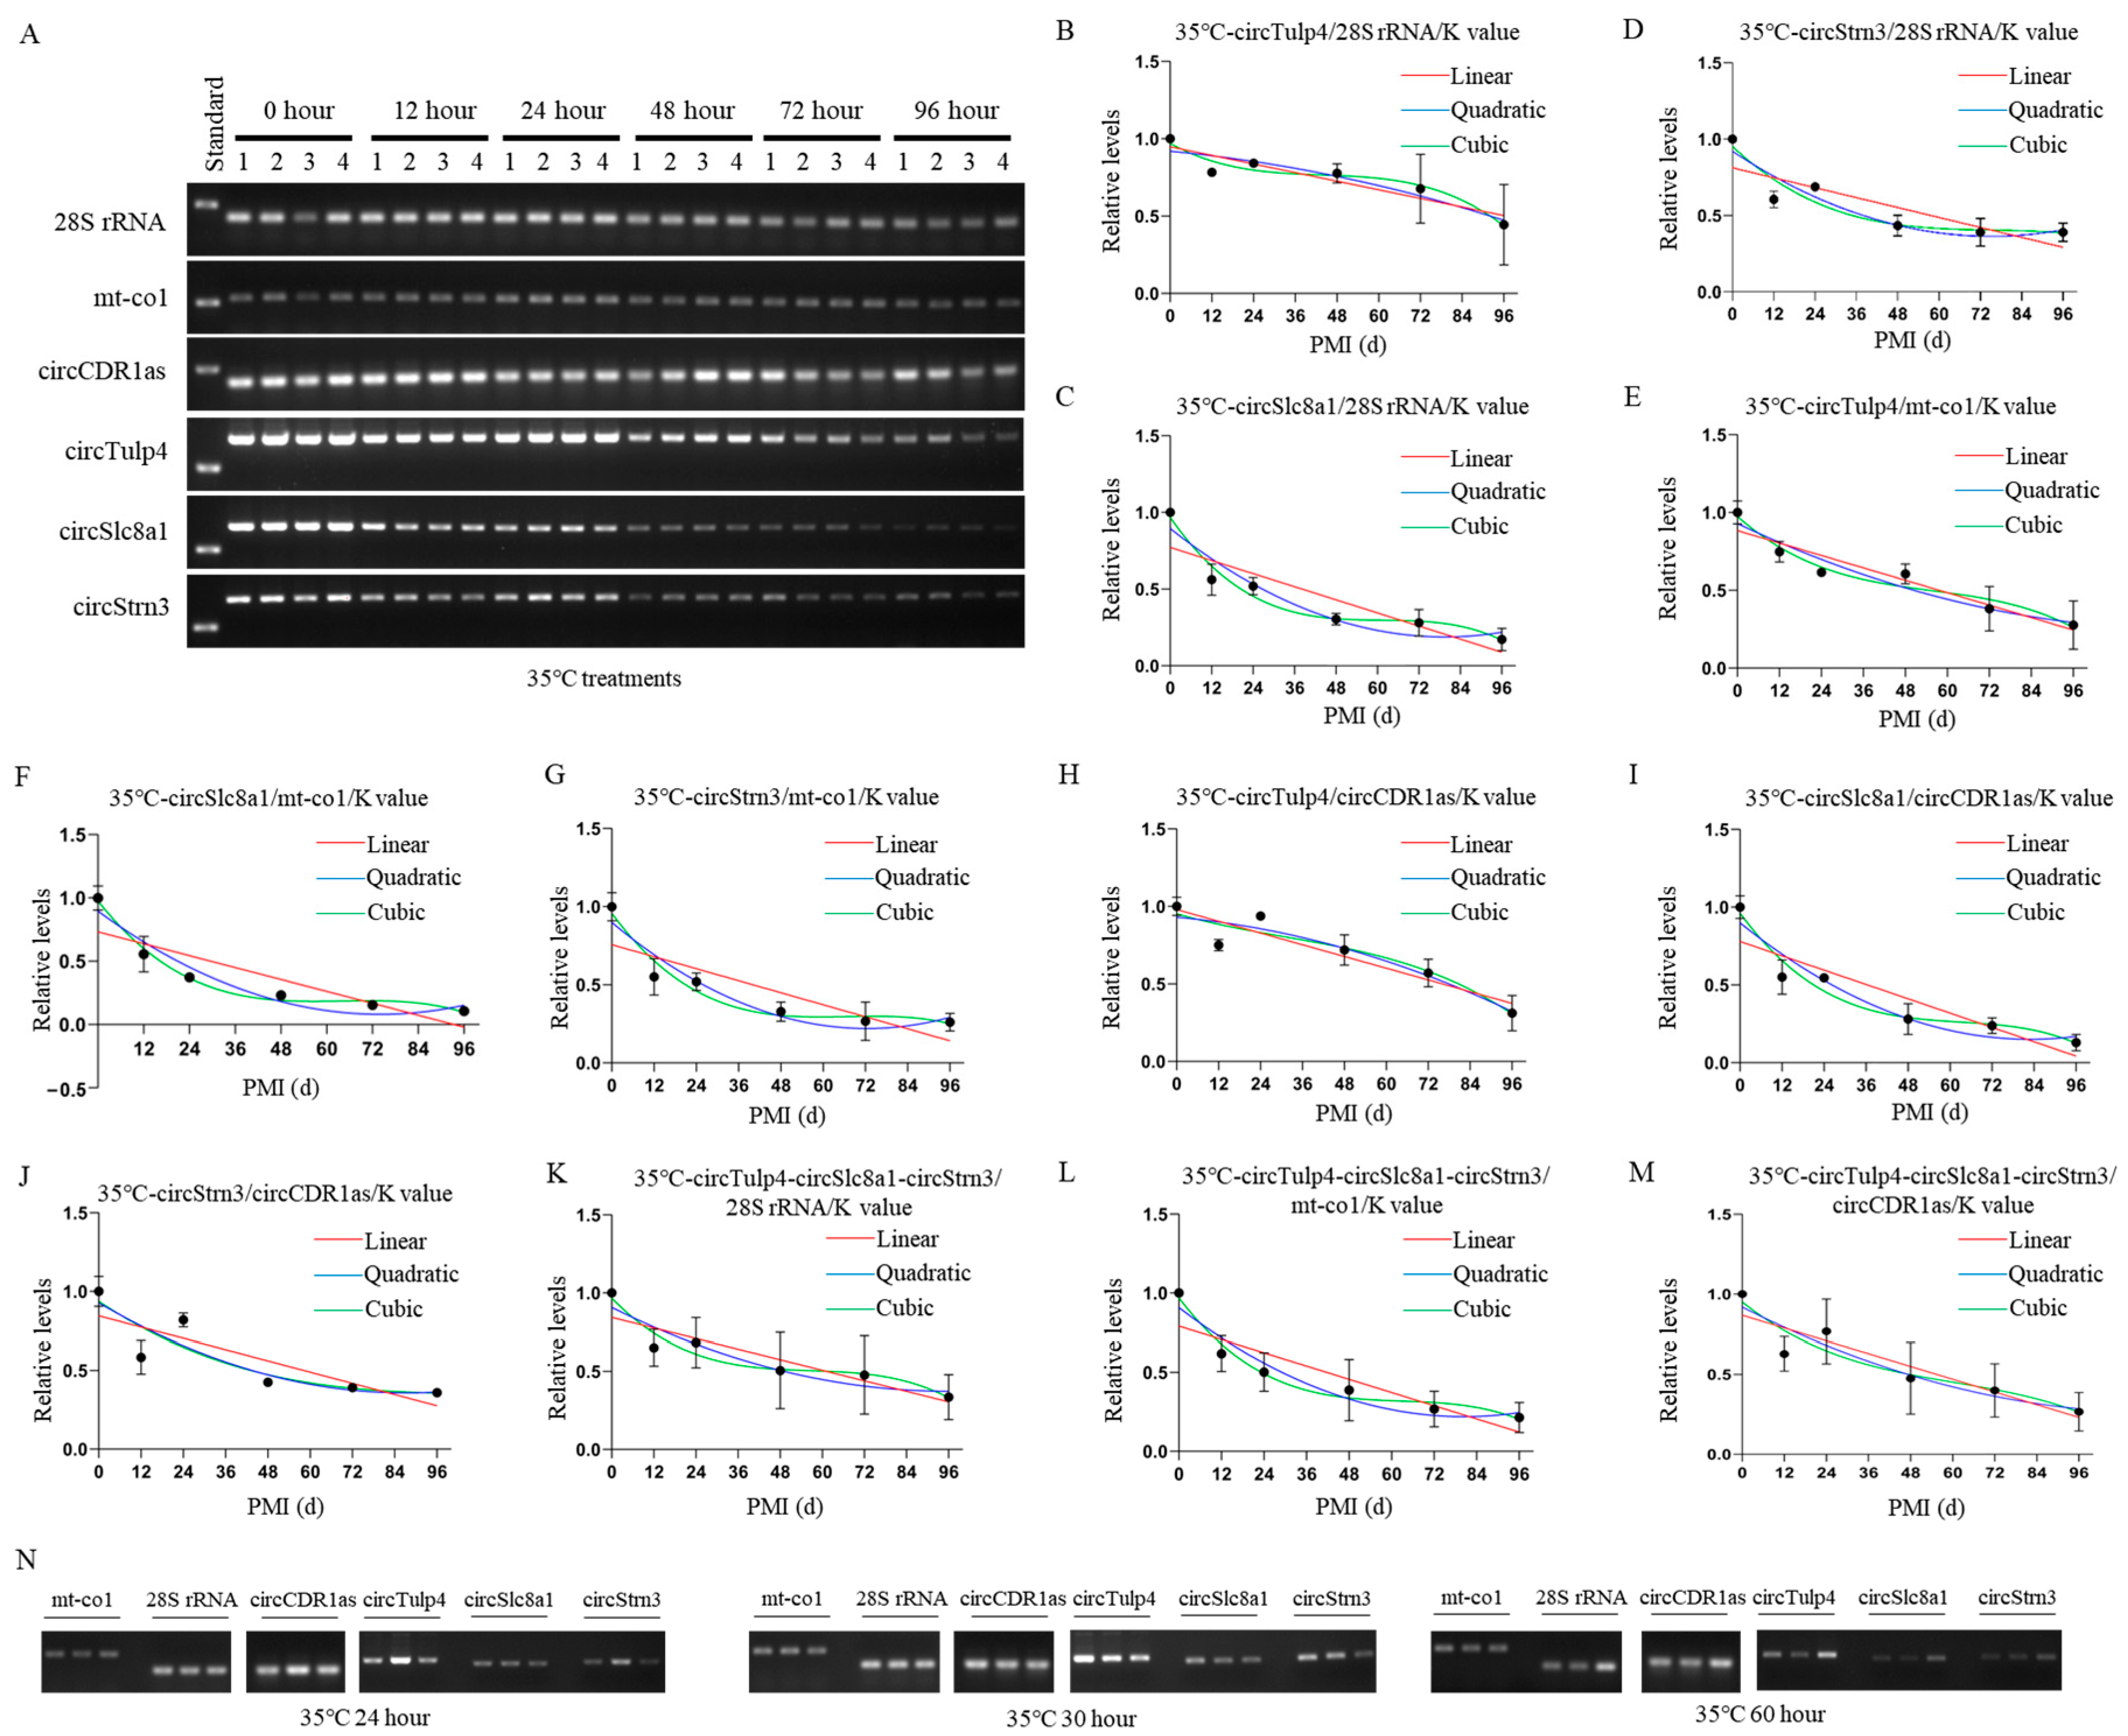
Construction and validation of 35 °C PMI estimation models. (A) The postmortem levels of reference genes 28S rRNA, mt-co1, circCDR1as and the biomarkers circTulp4, circSlc8a1, and circStrn3 in brain tissue on hours 0, 12, 24, 48, 72, and 96 at 35 °C. (B–D) The linear, quadratic, and cubic equations constructed at 35 °C based on circTulp4 and the three reference genes 28S rRNA, mt-co1, and circCDR1as, respectively. (E–G) The linear, quadratic, and cubic equations constructed at 35 °C based on circSlc8a1 and the three reference genes 28S rRNA, mt-co1, and circCDR1as, respectively. (H–J) The linear, quadratic, and cubic equations constructed at 35 °C based on circStrn3 and the three reference genes 28S rRNA, mt-co1, and circCDR1as, respectively. (K–M) After the combination of circRNAs, the linear, quadratic, and cubic equations were constructed at 35 °C based on the three reference genes 28S rRNA, mt-co1, and circCDR1as, respectively. (N) The electrophoresis results of the validation samples for the 35 °C equation at 24, 30, and 60 h.
Figure 6.
Construction and validation of 35 °C PMI estimation models. (A) The postmortem levels of reference genes 28S rRNA, mt-co1, circCDR1as and the biomarkers circTulp4, circSlc8a1, and circStrn3 in brain tissue on hours 0, 12, 24, 48, 72, and 96 at 35 °C. (B–D) The linear, quadratic, and cubic equations constructed at 35 °C based on circTulp4 and the three reference genes 28S rRNA, mt-co1, and circCDR1as, respectively. (E–G) The linear, quadratic, and cubic equations constructed at 35 °C based on circSlc8a1 and the three reference genes 28S rRNA, mt-co1, and circCDR1as, respectively. (H–J) The linear, quadratic, and cubic equations constructed at 35 °C based on circStrn3 and the three reference genes 28S rRNA, mt-co1, and circCDR1as, respectively. (K–M) After the combination of circRNAs, the linear, quadratic, and cubic equations were constructed at 35 °C based on the three reference genes 28S rRNA, mt-co1, and circCDR1as, respectively. (N) The electrophoresis results of the validation samples for the 35 °C equation at 24, 30, and 60 h.
![Ijms 26 04495 g006]()
Figure 7.
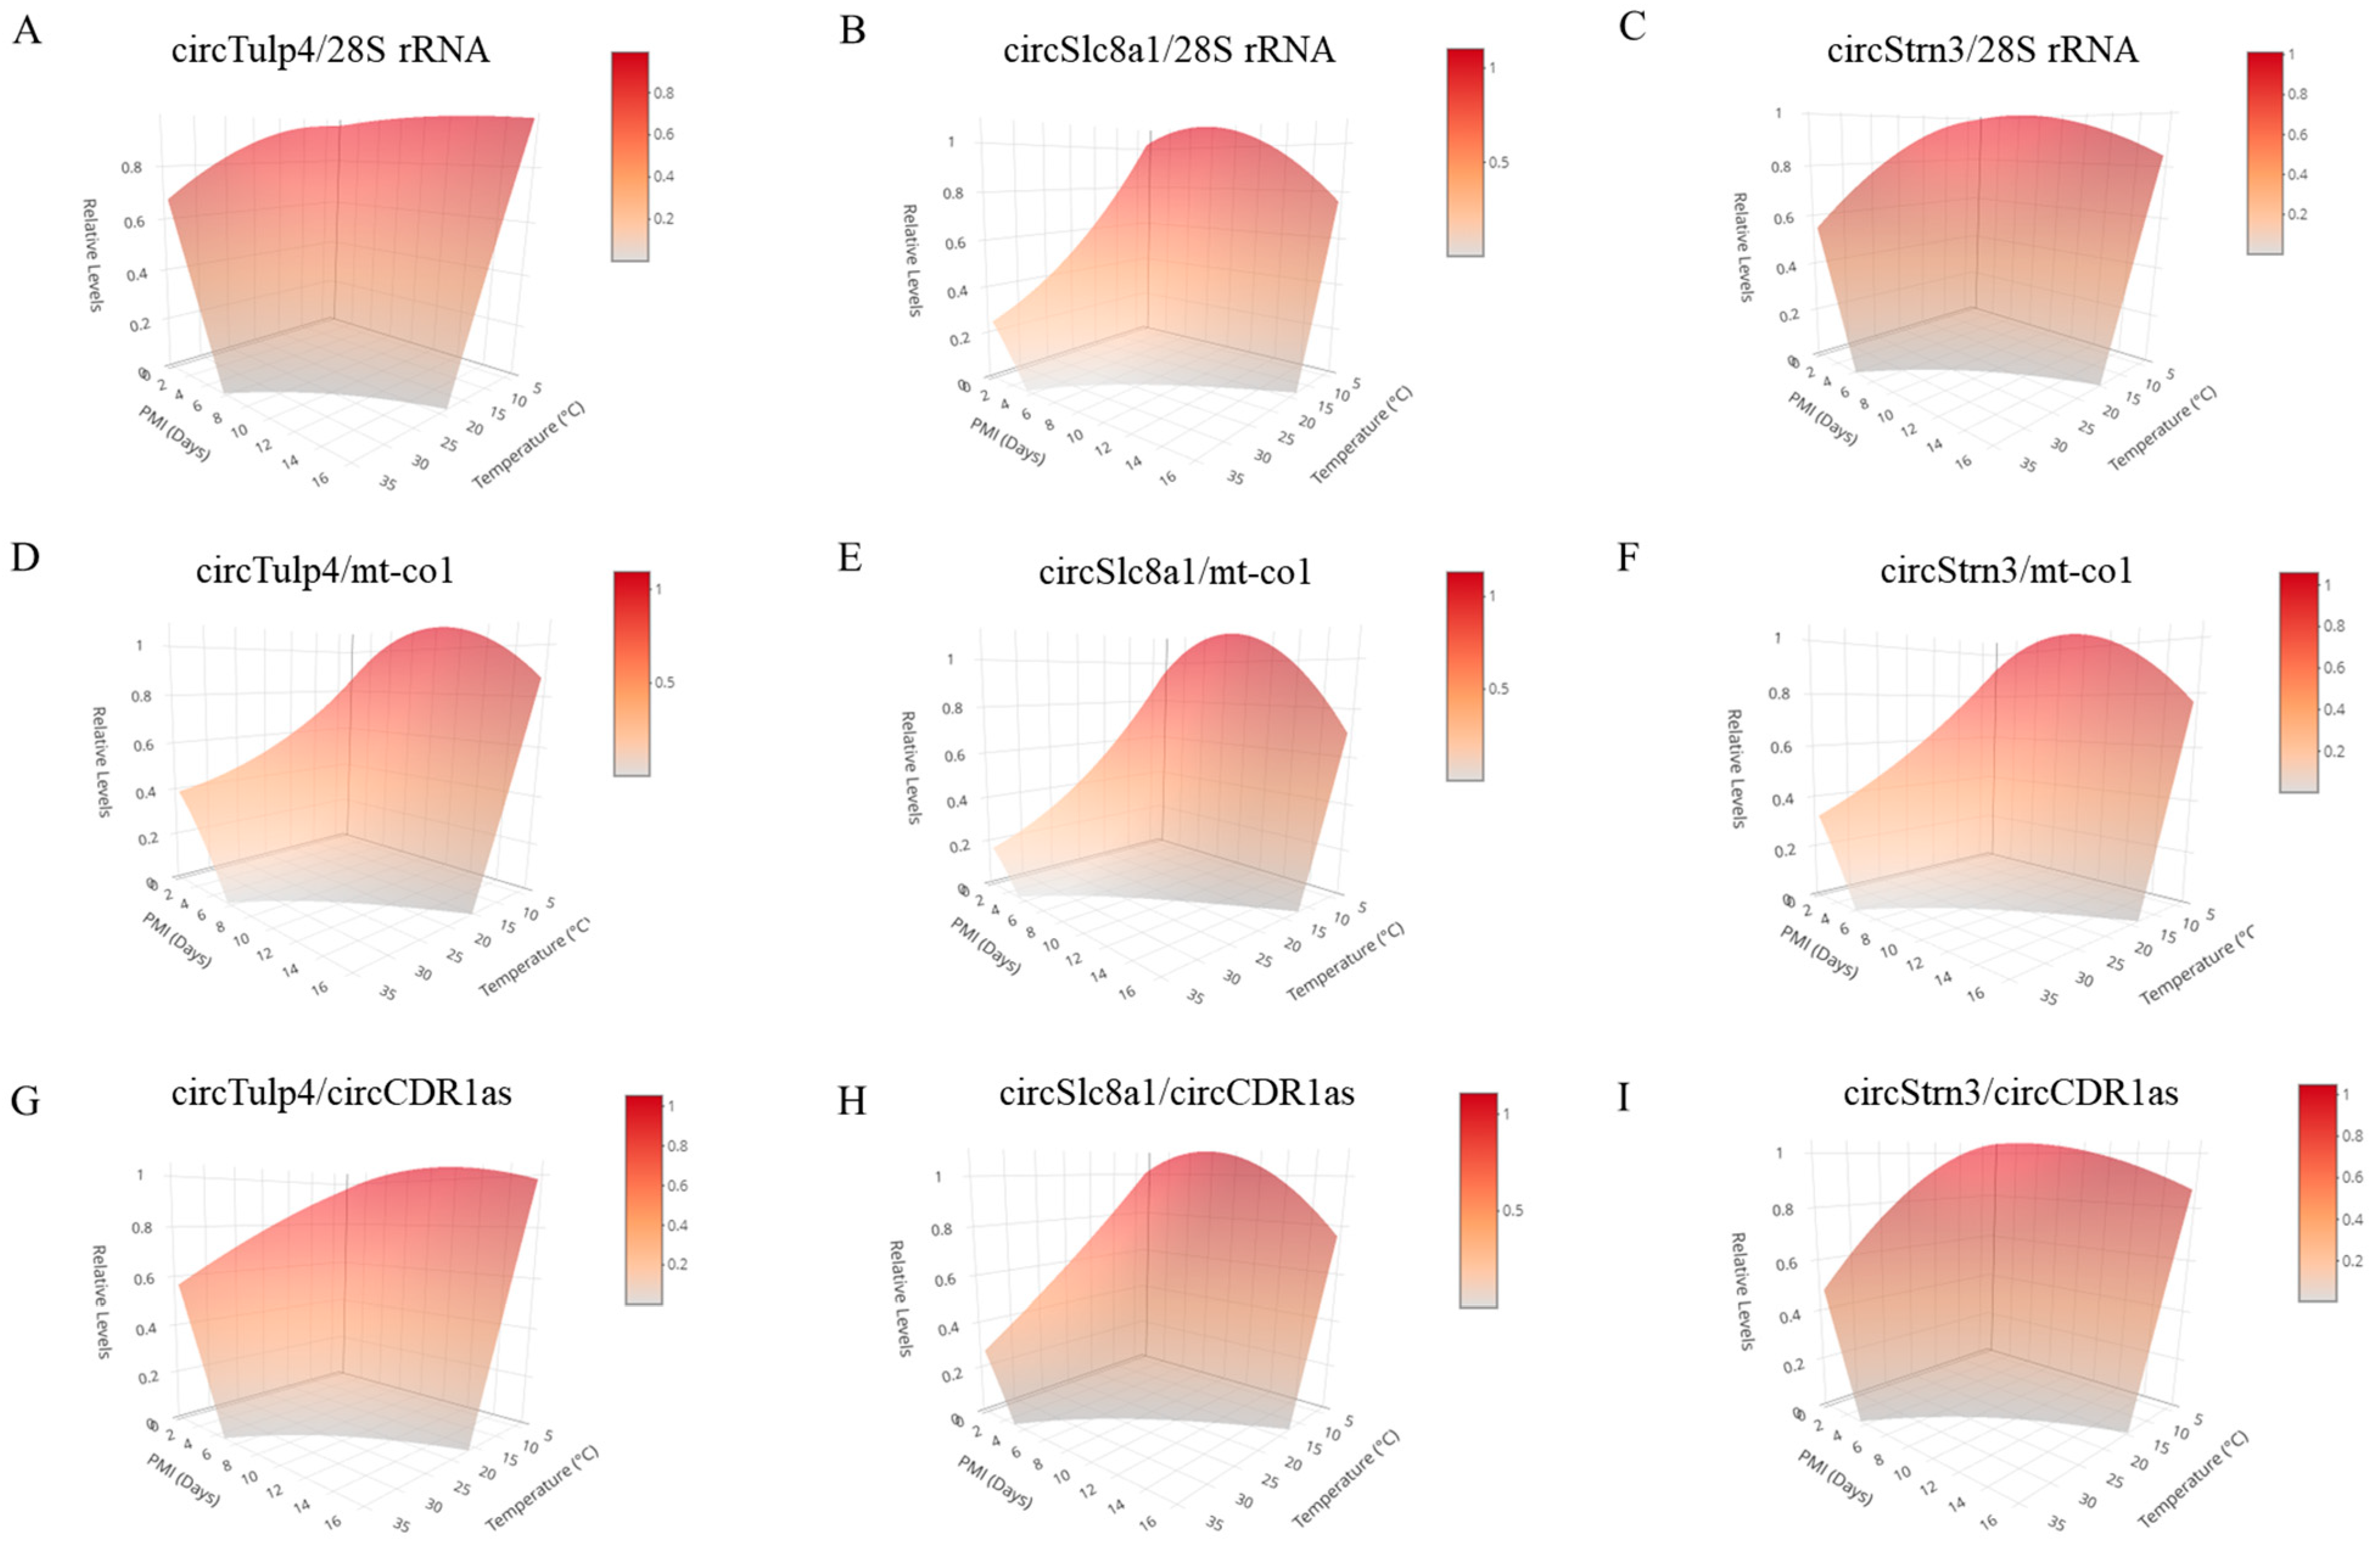
The three-dimensional models for PMI estimation were constructed based on data at 4 °C, 25 °C, and 35 °C. (A–C) These three-dimensional models were constructed using reference gene 28S rRNA in combination with circRNAs, circTulp4, circSlc8a1, and circStrn3, respectively. (D–F) These three-dimensional models were constructed using reference gene mt-co1 in combination with circRNAs, circTulp4, circSlc8a1, and circStrn3, respectively. (G–I) These three-dimensional models were constructed using reference gene circCDR1as in combination with circRNAs, circTulp4, circSlc8a1, and circStrn3, respectively. A color scale bar is included in the top right corner of the 3D plot to indicate the mapping between surface color and circRNA relative expression levels. Warmer colors (red) represent higher expression levels, while cooler tones (gray) correspond to lower expression levels.
Figure 7.
The three-dimensional models for PMI estimation were constructed based on data at 4 °C, 25 °C, and 35 °C. (A–C) These three-dimensional models were constructed using reference gene 28S rRNA in combination with circRNAs, circTulp4, circSlc8a1, and circStrn3, respectively. (D–F) These three-dimensional models were constructed using reference gene mt-co1 in combination with circRNAs, circTulp4, circSlc8a1, and circStrn3, respectively. (G–I) These three-dimensional models were constructed using reference gene circCDR1as in combination with circRNAs, circTulp4, circSlc8a1, and circStrn3, respectively. A color scale bar is included in the top right corner of the 3D plot to indicate the mapping between surface color and circRNA relative expression levels. Warmer colors (red) represent higher expression levels, while cooler tones (gray) correspond to lower expression levels.
Table 1.
Establishment of the mathematical models for 4 °C PMI estimation.
Table 1.
Establishment of the mathematical models for 4 °C PMI estimation.
| Temperature | circRNA | Reference Gene | Equation | R2 | p |
|---|
| 4 °C | circTulp4 | circCDR1as | Linear | Y = −0.02468X + 0.9772 | 0.7854 | 0.0014 |
| | | | Quadratic | Y = 0.9711 − 0.02104X − 0.0002343X2 | 0.7866 | 0.0118 |
| | | | Cubic | Y = 1.021 − 0.08117X + 0.009972X2 − 0.0004237X3 | 0.8574 | 0.0080 |
| | circSlc8a1 | 28S rRNA | Linear | Y = −0.04908X + 0.9818 | 0.9132 | 0.0000 |
| | | | Quadratic | Y = 1.005 − 0.06299X + 0.0008956X2 | 0.9184 | 0.0001 |
| | | | Cubic | Y = 0.9910 − 0.04594X − 0.001997X2 + 0.0001201X3 | 0.9201 | 0.0011 |
| | circStrn3 | mt-co1 | Linear | Y = −0.03643X + 0.8845 | 0.7235 | 0.0023 |
| | | | Quadratic | Y = 0.8930 − 0.04148X + 0.0003255X2 | 0.7245 | 0.0172 |
| | | | Cubic | Y = 0.9002 − 0.05021X + 0.001806X2 − 0.00006147X3 | 0.7251 | 0.0768 |
| | circTulp4/circSlc8a1/circStrn3 | mt-co1 | Linear | Y = −0.03772X + 0.8588 | 0.8066 | 0.0012 |
| | | | Quadratic | Y = 0.8860 − 0.05393X + 0.001044X2 | 0.8172 | 0.0081 |
| | | | Cubic | Y = 0.9411 − 0.1199X + 0.01224X2 − 0.0004650X3 | 0.8547 | 0.0176 |
Table 2.
Verification of the 4 °C mathematical models.
Table 2.
Verification of the 4 °C mathematical models.
| Temperature | circRNA | Reference Gene | Real PMI (Day) | Estimation PMI (Day) | Estimation Error (Day) | Error Rate (%) | Equation |
|---|
| 4 °C | circTulp4 | circCDR1as | 2 | 1.05 | 0.95 | 47.71% | Linear |
| | | | 2 | 0.93 | 1.07 | 53.64% | Quadratic |
| | | | 2 | 0.97 | 1.03 | 51.60% | Cubic |
| | | | 3.125 | 2.63 | 0.49 | 15.83% | Linear |
| | | | 3.125 | 2.71 | 0.41 | 13.17% | Quadratic |
| | | | 3.125 | 1.65 | 1.47 | 47.18% | Cubic |
| | | | 6.25 | 2.41 | 3.84 | 61.40% | Linear |
| | | | 6.25 | 2.47 | 3.78 | 60.45% | Quadratic |
| | | | 6.25 | 1.55 | 4.70 | 75.23% | Cubic |
| | circSlc8a1 | 28S rRNA | 2 | 1.40 | 0.60 | 30.09% | Linear |
| | | | 2 | 1.49 | 0.51 | 25.53% | Quadratic |
| | | | 2 | 1.59 | 0.41 | 20.29% | Cubic |
| | | | 3.125 | 4.61 | 1.48 | 47.45% | Linear |
| | | | 3.125 | 4.21 | 1.09 | 34.74% | Quadratic |
| | | | 3.125 | 4.48 | 1.36 | 43.51% | Cubic |
| | | | 6.25 | 10.97 | 4.72 | 75.52% | Linear |
| | | | 6.25 | 10.48 | 4.23 | 67.62% | Quadratic |
| | | | 6.25 | 10.17 | 3.92 | 62.78% | Cubic |
| | circStrn3 | circCDR1as | 2 | 2.31 | 0.31 | 15.64% | Linear |
| | | | 2 | 3.22 | 1.22 | 60.84% | Quadratic |
| | | | 2 | 0.68 | 1.32 | 65.77% | Cubic |
| | | | 3.125 | 10.01 | 6.89 | 220.37% | Linear |
| | | | 3.125 | 11.42 | 8.29 | 265.28% | Quadratic |
| | | | 3.125 | 10.10 | 6.97 | 223.05% | Cubic |
| | | | 6.25 | 4.06 | 2.19 | 34.99% | Linear |
| | | | 6.25 | 6.20 | 0.05 | 0.74% | Quadratic |
| | | | 6.25 | 6.97 | 0.72 | 11.49% | Cubic |
| | circTulp4/circSlc8a1/circStrn3 | circCDR1as | 2 | 2.93 | 0.93 | 46.64% | Linear |
| | | | 2 | 3.33 | 1.33 | 66.66% | Quadratic |
| | | | 2 | 3.91 | 1.91 | 95.58% | Cubic |
| | | | 3.125 | 6.92 | 3.80 | 121.49% | Linear |
| | | | 3.125 | 7.85 | 4.72 | 151.18% | Quadratic |
| | | | 3.125 | 7.83 | 4.71 | 150.66% | Cubic |
| | | | 6.25 | 6.58 | 0.33 | 5.35% | Linear |
| | | | 6.25 | 7.51 | 1.26 | 20.17% | Quadratic |
| | | | 6.25 | 7.55 | 1.30 | 20.75% | Cubic |
Table 3.
Establishment of the mathematical models for 25 °C PMI estimation.
Table 3.
Establishment of the mathematical models for 25 °C PMI estimation.
| Temperature | circRNA | Reference Gene | Equation | R2 | p |
|---|
| 25 °C | circTulp4 | circCDR1as | Linear | Y = −0.1129X + 1.051 | 0.9157 | 0.0024 |
| | | | Quadratic | Y = 1.038 − 0.09897X − 0.001686X2 | 0.9167 | 0.0306 |
| | | | Cubic | Y = 0.9858 + 0.05610X − 0.06224X2 + 0.005272X3 | 0.9392 | 0.1051 |
| | circSlc8a1 | mt-co1 | Linear | Y = −0.1211X + 1.004 | 0.9299 | 0.0012 |
| | | | Quadratic | Y = 1.016 − 0.1335X + 0.001503X2 | 0.9306 | 0.0194 |
| | | | Cubic | Y = 0.9814 − 0.03132X − 0.03840X2 + 0.003474X3 | 0.9392 | 0.1292 |
| | circStrn3 | circCDR1as | Linear | Y = −0.1252X + 1.010 | 0.8933 | 0.0070 |
| | | | Quadratic | Y = 1.063 − 0.1818X + 0.006860X2 | 0.9069 | 0.0499 |
| | | | Cubic | Y = 0.9836 + 0.05284X − 0.08476X2 + 0.007976X3 | 0.9477 | 0.1074 |
| | circTulp4/circSlc8a1/circStrn3 | mt-co1 | Linear | Y = −0.1171X + 1.020 | 0.9517 | 0.0011 |
| | | | Quadratic | Y = 1.011 − 0.1073X − 0.001189X2 | 0.9522 | 0.0179 |
| | | | Cubic | Y = 0.9815 − 0.02087X − 0.03496X2 + 0.002940X3 | 0.9589 | 0.1329 |
Table 4.
Verification of the 25 °C mathematical models.
Table 4.
Verification of the 25 °C mathematical models.
| Temperature | circRNA | Reference Gene | Real PMI (Day) | Estimation PMI (Day) | Estimation Error (Day) | Error Rate (%) | Equation |
|---|
| 25 °C | circTulp4 | mt-co1 | 2 | 1.53 | 0.47 | 23.30% | Linear |
| | | | 2 | 1.86 | 0.14 | 7.25% | Quadratic |
| | | | 2 | 1.90 | 0.10 | 5.20% | Cubic |
| | | | 6 | 6.21 | 0.21 | 3.49% | Linear |
| | | | 6 | 6.49 | 0.49 | 8.24% | Quadratic |
| | | | 6 | 6.44 | 0.44 | 7.39% | Cubic |
| | | | 7 | 6.06 | 0.94 | 13.42% | Linear |
| | | | 7 | 6.39 | 0.61 | 8.78% | Quadratic |
| | | | 7 | 6.33 | 0.67 | 9.53% | Cubic |
| | circSlc8a1 | 28S rRNA | 2 | 5.08 | 3.08 | 154.18% | Linear |
| | | | 2 | 3.91 | 1.91 | 95.58% | Quadratic |
| | | | 2 | 3.75 | 1.75 | 87.59% | Cubic |
| | | | 6 | 7.00 | 1.00 | 16.63% | Linear |
| | | | 6 | 6.83 | 0.83 | 13.89% | Quadratic |
| | | | 6 | 5.53 | 0.47 | 7.78% | Cubic |
| | | | 7 | 6.50 | 0.50 | 7.13% | Linear |
| | | | 7 | 6.03 | 0.97 | 13.87% | Quadratic |
| | | | 7 | 8.35 | 1.35 | 19.21% | Cubic |
| | circStrn3 | 28S rRNA | 2 | 5.77 | 3.77 | 188.43% | Linear |
| | | | 2 | 5.17 | 3.17 | 158.28% | Quadratic |
| | | | 2 | 4.16 | 2.16 | 108.07% | Cubic |
| | | | 6 | 5.96 | 0.04 | 0.68% | Linear |
| | | | 6 | 5.40 | 0.60 | 10.08% | Quadratic |
| | | | 6 | 4.26 | 1.74 | 28.97% | Cubic |
| | | | 7 | 6.40 | 0.60 | 8.55% | Linear |
| | | | 7 | 5.97 | 1.03 | 14.72% | Quadratic |
| | | | 7 | 8.56 | 1.56 | 22.29% | Cubic |
| | circTulp4/circSlc8a1/circStrn3 | mt-co1 | 2 | 4.33 | 2.33 | 116.38% | Linear |
| | | | 2 | 4.42 | 2.42 | 121.11% | Quadratic |
| | | | 2 | 4.09 | 2.09 | 104.26% | Cubic |
| | | | 6 | 7.05 | 1.05 | 17.50% | Linear |
| | | | 6 | 7.06 | 1.06 | 17.63% | Quadratic |
| | | | 6 | 6.33 | 0.33 | 5.47% | Cubic |
| | | | 7 | 6.54 | 0.46 | 6.54% | Linear |
| | | | 7 | 6.58 | 0.42 | 6.05% | Quadratic |
| | | | 7 | 5.83 | 1.17 | 16.68% | Cubic |
Table 5.
Establishment of the mathematical models for 35 °C PMI estimation.
Table 5.
Establishment of the mathematical models for 35 °C PMI estimation.
| Temperature | circRNA | Reference Gene | Equation | R2 | p |
|---|
| 35 °C | circTulp4 | mt-co1 | Linear | Y = −0.006651X + 0.8839 | 0.7999 | 0.0035 |
| | | | Quadratic | Y = 0.9293 − 0.01059X + 0.00004125X2 | 0.8209 | 0.0189 |
| | | | Cubic | Y = 0.9752 − 0.01976X + 0.0003008X2 − 0.000001796X3 | 0.8477 | 0.0602 |
| | circSlc8a1 | mt-co1 | Linear | Y = −0.007844X + 0.7324 | 0.7186 | 0.0256 |
| | | | Quadratic | Y = 0.8961 − 0.02202X + 0.0001486X2 | 0.8943 | 0.0169 |
| | | | Cubic | Y = 0.9768 − 0.03815X + 0.0006052X2 − 0.000003159X3 | 0.9480 | 0.0145 |
| | circStrn3 | mt-co1 | Linear | Y = −0.006409X + 0.7568 | 0.6557 | 0.0341 |
| | | | Quadratic | Y = 0.8992 − 0.01873X + 0.0001292X2 | 0.8372 | 0.0260 |
| | | | Cubic | Y = 0.9582 − 0.03054X + 0.0004632X2 − 0.000002311X3 | 0.8765 | 0.0666 |
| | circTulp4/circSlc8a1/circStrn3 | mt-co1 | Linear | Y = −0.006968X + 0.7911 | 0.7061 | 0.0152 |
| | | | Quadratic | Y = 0.9082 − 0.01711X + 0.0001064X2 | 0.8181 | 0.0171 |
| | | | Cubic | Y = 0.9700 − 0.02948X + 0.0004564X2 − 0.000002422X3 | 0.8574 | 0.0321 |
Table 6.
Verification of the 35 °C mathematical models.
Table 6.
Verification of the 35 °C mathematical models.
| Temperature | circRNA | Reference Gene | Real PMI (Hour) | Estimation PMI (Hour) | Estimation Error (Hour) | Error Rate (%) | Equation |
|---|
| 35 °C | circTulp4 | 28S rRNA | 24 | 21.41 | 2.59 | 10.80% | Linear |
| | | | 24 | 25.19 | 1.19 | 4.95% | Quadratic |
| | | | 24 | 13.10 | 10.90 | 45.41% | Cubic |
| | | | 30 | 26.53 | 3.47 | 11.57% | Linear |
| | | | 30 | 31.74 | 1.74 | 5.81% | Quadratic |
| | | | 30 | 17.21 | 12.79 | 42.62% | Cubic |
| | | | 60 | 57.33 | 2.67 | 4.45% | Linear |
| | | | 60 | 62.70 | 2.70 | 4.50% | Quadratic |
| | | | 60 | 74.52 | 14.52 | 24.21% | Cubic |
| | circSlc8a1 | circCDR1as | 24 | 51.25 | 27.25 | 113.56% | Linear |
| | | | 24 | 36.40 | 12.40 | 51.69% | Quadratic |
| | | | 24 | 30.95 | 6.95 | 28.97% | Cubic |
| | | | 30 | 33.68 | 3.68 | 12.26% | Linear |
| | | | 30 | 24.60 | 5.40 | 18.01% | Quadratic |
| | | | 30 | 19.64 | 10.36 | 34.52% | Cubic |
| | | | 60 | 70.86 | 10.86 | 18.11% | Linear |
| | | | 60 | 54.93 | 5.07 | 8.44% | Quadratic |
| | | | 60 | 76.67 | 16.67 | 27.78% | Cubic |
| | circStrn3 | mt-co1 | 24 | 52.73 | 28.73 | 119.72% | Linear |
| | | | 24 | 33.29 | 9.29 | 38.72% | Quadratic |
| | | | 24 | 27.67 | 3.67 | 15.29% | Cubic |
| | | | 30 | 38.53 | 8.53 | 28.44% | Linear |
| | | | 30 | 25.15 | 4.85 | 16.16% | Quadratic |
| | | | 30 | 20.30 | 9.70 | 32.35% | Cubic |
| | | | 60 | 82.38 | 22.38 | 37.31% | Linear |
| | | | 60 | 64.41 | 4.41 | 7.36% | Quadratic |
| | | | 60 | 99.49 | 39.49 | 65.82% | Cubic |
| | circTulp4/circSlc8a1/circStrn3 | circCDR1as | 24 | 46.04 | 22.04 | 91.85% | Linear |
| | | | 24 | 38.45 | 14.45 | 60.19% | Quadratic |
| | | | 24 | 35.47 | 11.47 | 47.78% | Cubic |
| | | | 30 | 38.90 | 8.90 | 29.65% | Linear |
| | | | 30 | 32.35 | 2.35 | 7.82% | Quadratic |
| | | | 30 | 28.48 | 1.52 | 5.08% | Cubic |
| | | | 60 | 71.62 | 11.62 | 19.37% | Linear |
| | | | 60 | 65.69 | 5.69 | 9.49% | Quadratic |
| | | | 60 | 74.89 | 14.89 | 24.81% | Cubic |
Table 7.
Establishment of the three-dimensional models for PMI estimation.
Table 7.
Establishment of the three-dimensional models for PMI estimation.
| circRNA | Reference Gene | Equation | R2 | p |
|---|
| circTulp4 | 28S rRNA | Y = 0.9424 + 0.0045T + 0.0188P − 0.0001T2 − 0.0013P2 − 0.0040TP | 0.7639 | 0.0000 |
| | mt-co1 | Y = 0.6807 + 0.0408T − 0.0297P − 0.0010T2 + 0.0011P2 − 0.0036TP | 0.7998 | 0.0000 |
| | circCDR1as | Y = 0.9195 + 0.0132T − 0.0013P − 0.0003T2 − 0.0004P2 − 0.0043TP | 0.8632 | 0.0000 |
| circSlc8a1 | 28S rRNA | Y = 0.9469 + 0.0220T − 0.0615P − 0.0008T2 + 0.0016P2 − 0.0031TP | 0.8760 | 0.0000 |
| | mt-co1 | Y = 0.7840 + 0.0420T − 0.0614P − 0.0013T2 + 0.0017P2 − 0.0033TP | 0.8445 | 0.0000 |
| | circCDR1as | Y = 0.9164 + 0.0257T − 0.0360P − 0.0009T2 + 0.0004P2 − 0.0040TP | 0.8682 | 0.0000 |
| circStrn3 | 28S rRNA | Y = 0.9717 + 0.0069T + 0.0133P − 0.0003T2 − 0.0014P2 − 0.0045TP | 0.7869 | 0.0000 |
| | mt-co1 | Y = 0.7959 + 0.0307T − 0.0332P − 0.0009T2 + 0.0007P2 − 0.0037TP | 0.7881 | 0.0000 |
| | circCDR1as | Y = 1.0302 + 0.0041T + 0.0107P − 0.0002T2 − 0.0017P2 − 0.0046TP | 0.8023 | 0.0000 |


 ,
, 
