Article

Nitrogen Sources Reprogram Carbon and Nitrogen Metabolism to Promote Andrographolide Biosynthesis in Andrographis paniculata (Burm.f.) Nees Seedlings

1
National Center for TCM Inheritance and Innovation, Guangxi Botanical Garden of Medicinal Plants, Nanning 530023, China
2
Guangxi Key Laboratory of Medicinal Resource Protection and Genetic Improvement, Guangxi Botanical Garden of Medicinal Plants, Nanning 530023, China
3
Guangxi Engineering Research Center of TCM Resource Intelligent Creation, Guangxi Botanical Garden of Medicinal Plants, Nanning 530023, China
*
Author to whom correspondence should be addressed.
Int. J. Mol. Sci. 2024, 25(7), 3990; https://doi.org/10.3390/ijms25073990
Submission received: 14 February 2024 / Revised: 23 March 2024 / Accepted: 29 March 2024 / Published: 3 April 2024
(This article belongs to the Section Molecular Plant Sciences)

Abstract

:
Carbon (C) and nitrogen (N) metabolisms participate in N source-regulated secondary metabolism in medicinal plants, but the specific mechanisms involved remain to be investigated. By using nitrate (NN), ammonium (AN), urea (UN), and glycine (GN), respectively, as sole N sources, we found that N sources remarkably affected the contents of diterpenoid lactone components along with C and N metabolisms reprograming in Andrographis paniculata, as compared to NN, the other three N sources raised the levels of 14-deoxyandrographolide, andrographolide, dehydroandrographolide (except UN), and neoandrographolide (except AN) with a prominent accumulation of farnesyl pyrophosphate (FPP). These N sources also raised the photosynthetic rate and the levels of fructose and/or sucrose but reduced the activities of phosphofructokinase (PFK), glyceraldehyde-3-phosphate dehydrogenase (GAPDH), phosphoenolpyruvate carboxylase (PEPC) and pyruvate dehydrogenase (PDH). Conversely, phosphoenolpyruvate carboxykinase (PEPCK) and malate enzyme (ME) activities were upregulated. Simultaneously, citrate, cis-aconitate and isocitrate levels declined, and N assimilation was inhibited. These results indicated that AN, UN and GN reduced the metabolic flow of carbohydrates from glycolysis into the TCA cycle and downstream N assimilation. Furthermore, they enhanced arginine and GABA metabolism, which increased C replenishment of the TCA cycle, and increased ethylene and salicylic acid (SA) levels. Thus, we proposed that the N sources reprogrammed C and N metabolism, attenuating the competition of N assimilation for C, and promoting the synthesis and accumulation of andrographolide through plant hormone signaling. To obtain a higher production of andrographolide in A. paniculata, AN fertilizer is recommended in its N management.

1. Introduction

Secondary metabolites represent important defensive substances in plants and the majority source of natural bioactive ingredients in medicinal plants. Plant secondary metabolism is strongly affected by genetic and environmental factors [1], among which nitrogen (N) is a crucial nutrient [2,3] as it constitutes myriads of life macromolecules that play key roles in plant development and metabolism processes. Plants obtain N mainly from soils with the forms of nitrate (NO3) and ammonium (NH4+) [4]. In addition, soils are rich in organic N, such as amino acids and peptides, which also potentially significantly contribute to plant nutrition [5].
N sources strongly affect the accumulation and component of secondary metabolites in medicinal plants. For example, nitrate elevated the synthesis of berberine, jatrorrhizine and palmatine in Phellodendron amurense [6], stevioside glycoside in Stevia rebaudiana [7], polyphenols in Urtica dioica [8], and total flavone, volatile oil and rosmarinic acid in Perilla frutescens [9]. Studies also revealed that ammonium stimulated the accumulation of andrographolide in Andrographis paniculata [10] and phenolic metabolites in Matricaria chamomilla [11]. Apparently, the preferable N sources required for the accumulation of secondary metabolites varied greatly depending on plant species and chemicals.
Secondary metabolites (including N-containing organic compounds, terpenoids, and phenolic compounds) are derived from primary metabolism pathways such as tricarboxylic acid (TCA) cycle, methylerythritol phosphate pathway (MEP), and mevalonic and shikimic acid pathways [12], among which the TCA cycle bridges the C and N metabolisms and therefore is in the center of regulation on primary and secondary metabolism. The mechanisms by which N sources regulate secondary metabolism in medicinal plants at least include (1) modulating the expression of genes in the synthetic pathway of secondary metabolites [13] and (2) reprogramming primary C and N metabolism. The uptake and assimilation of different N sources affect cytoplasmic pH [14]. Assimilation of NH4+ results in the acidification of cytoplasm [15]. It has been proposed that cytoplasmic pH is the primary factor inducing secondary metabolism in plants [16]. The C-N status regulates plant secondary metabolism [17]. N sources modulate plant metabolite profiles by influencing the expression and activity of enzymes in C and N metabolisms [10,18,19]. The enzymes PEPC, ICDH, MDH, and GDH were involved in NH4+ trigged alteration of C and N metabolisms [20]. Generally, the metabolic flow that tends to increase carbohydrate accumulate and decrease protein synthesis elevates the C/N ratio in plant tissues [21], which is positively correlated with the concentration of secondary metabolites [21,22,23]. It has also been widely corroborated that higher accumulation and exogenous application of sugars promote secondary metabolite biosynthesis in medicinal plants [7,10,21,24,25,26]. To date, however, deciphering the physiological and molecular rationale of N sources on the secondary metabolism of medicinal plants is still challenging due to the complexity of metabolic regulation in plants.
Andrographis paniculata is an important international traditional medicinal plant that originated from South Asia and is widely cultivated in Southeast Asia and South China. It is an herb traditionally used to treat cold, fever, and laryngitis [27]. Its major bioactive ingredients, andrographolide and its derivatives are potential drugs for anticancer, antibacterial, anti-hepatitis and antivirus [28,29], including COVID-19 [30,31,32]. Although the andrographolide biosynthetic pathway has been partially worked out [33,34], only a small amount of information is available on its regulatory mechanism, especially in the aspect of cultivation, including N regimes.
Combining metabolomics and physiological and transcriptional analyses, we aimed to reveal the physiological and molecular mechanism by which N sources triggered metabolic reprogramming in contribution to andrographolide biosynthesis in A. paniculata. We found that N sources affected andrographolide biosynthesis by manipulating C metabolic fluxes from glycolysis into the TCA cycle and downstream N assimilation. The findings provide new insight into the intricate relationship between N sources, C metabolism, and secondary metabolism in medicinal plants.

2. Results

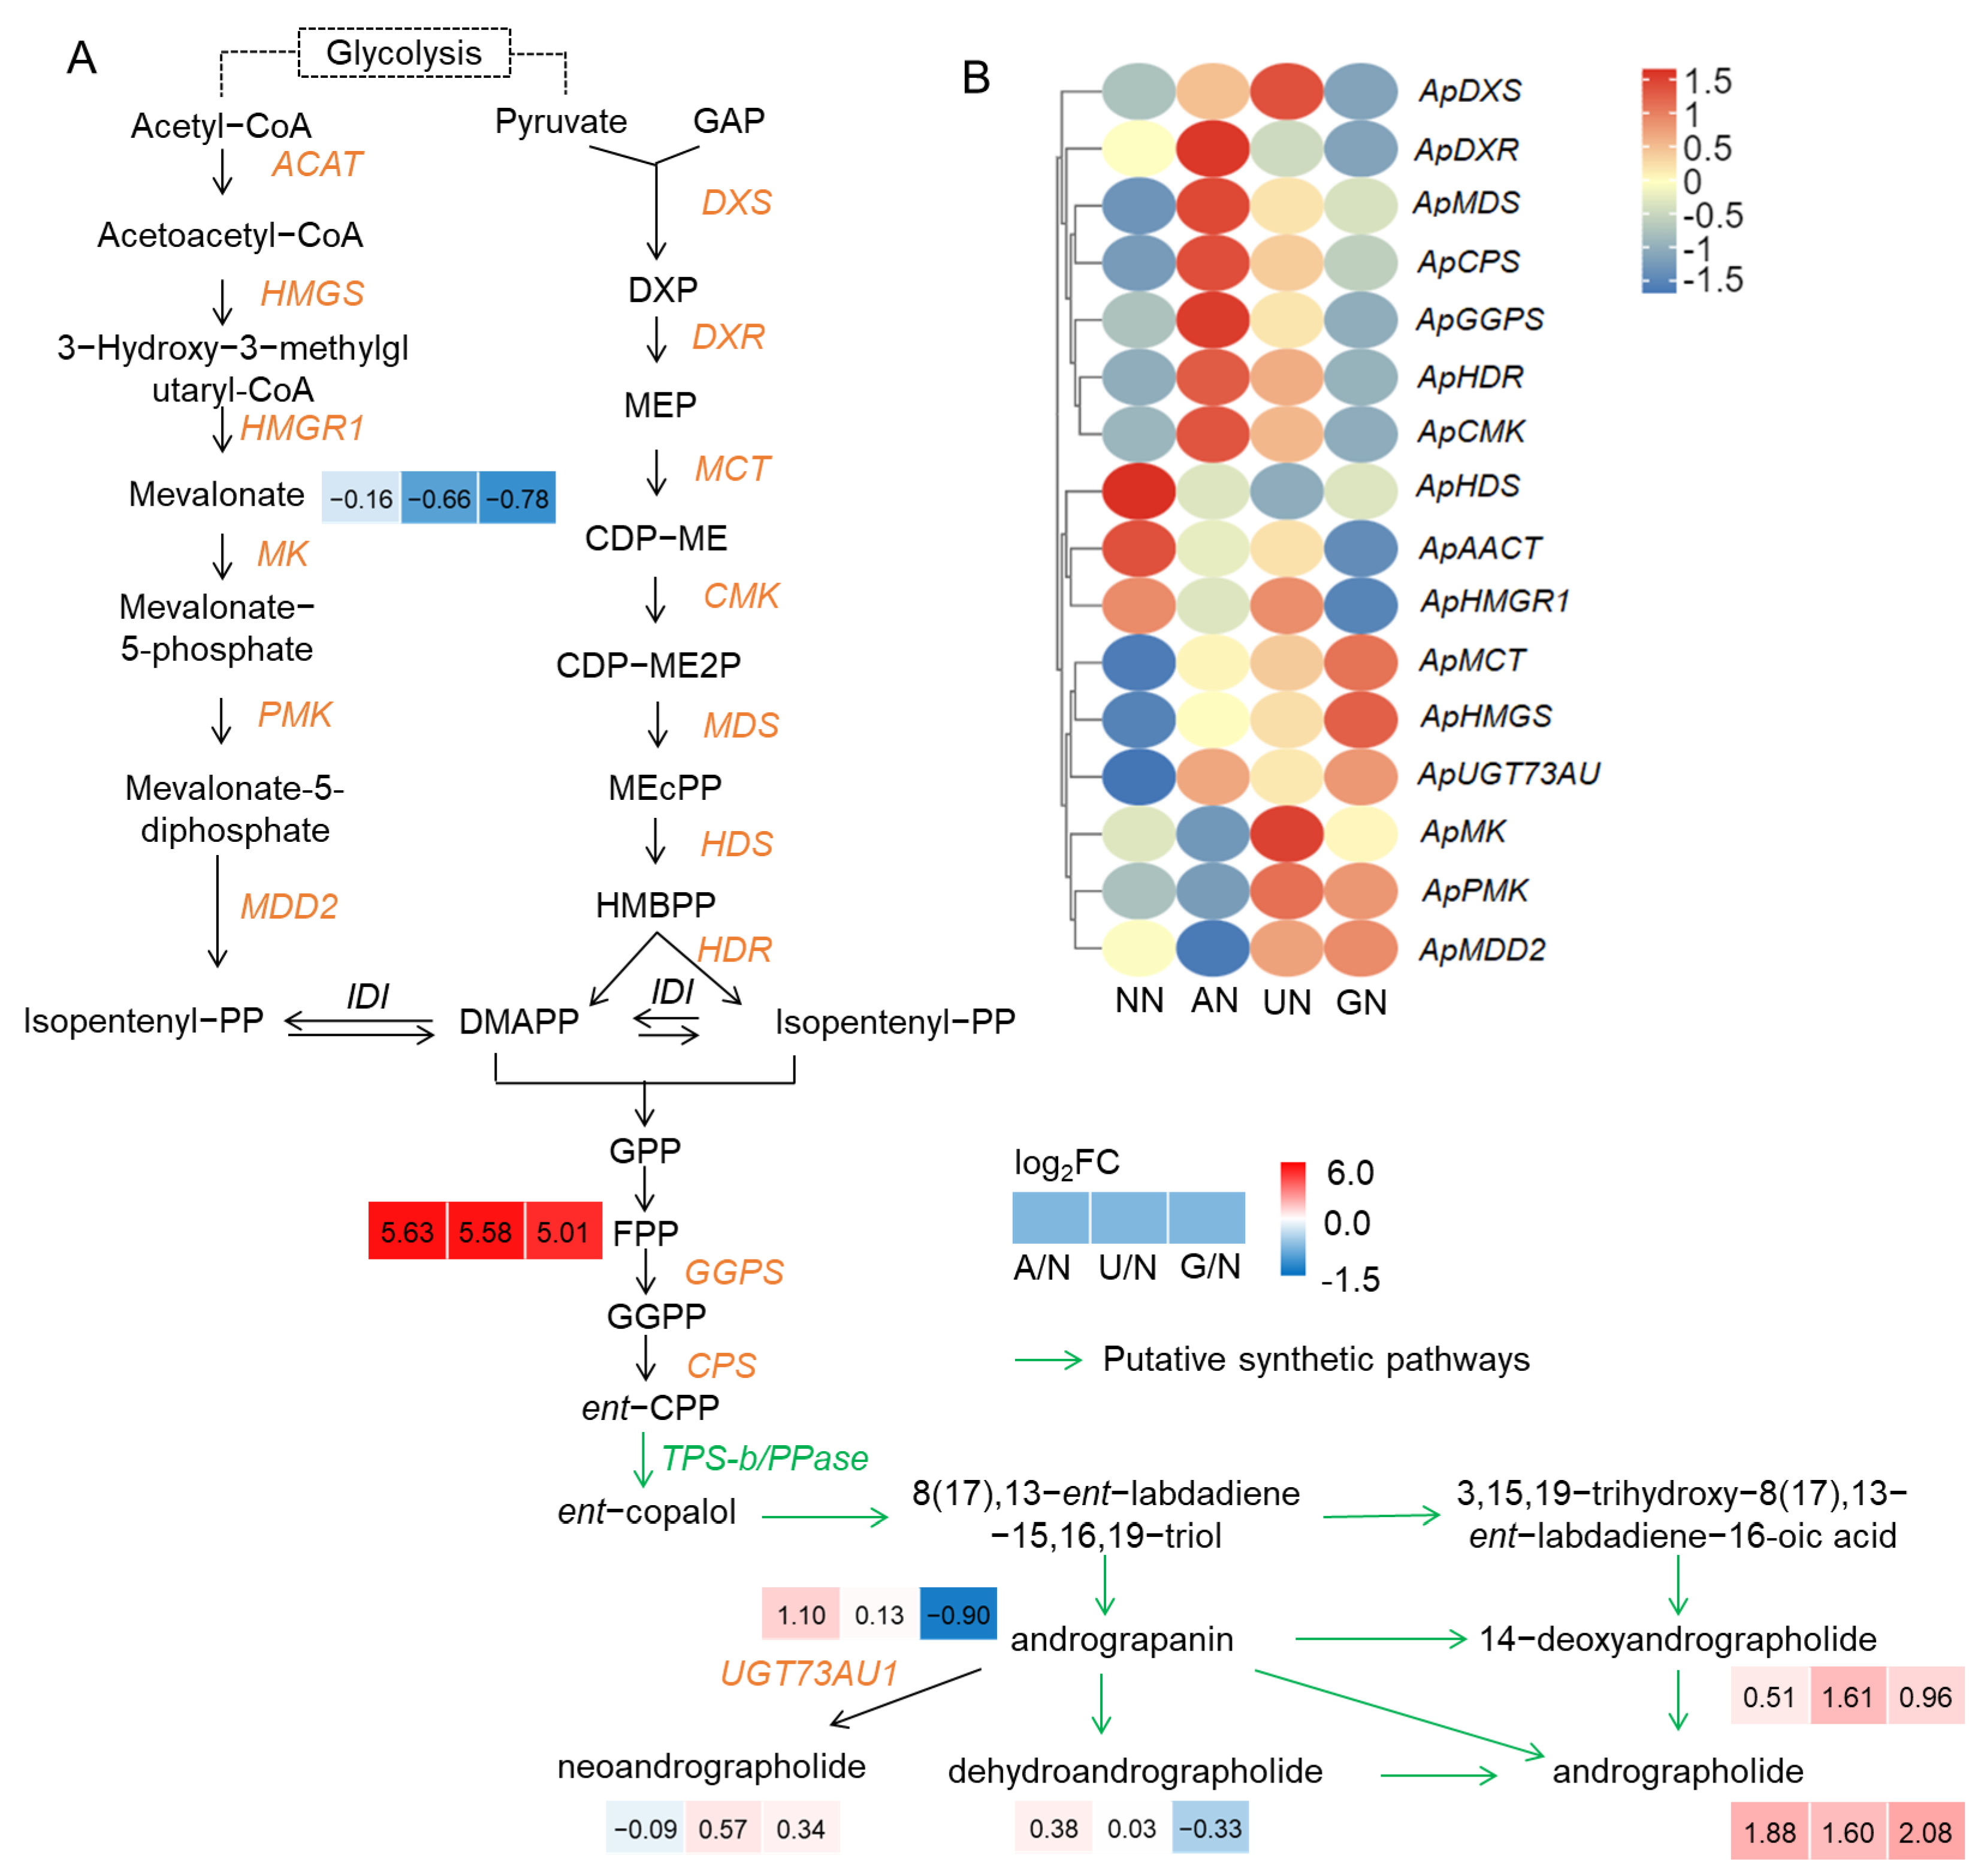
2.1. Diterpenoid Lactone Compounds Affected by N Sources

N sources considerably affected the contents of diterpenoid lactone compounds in A. paniculata plants. In comparison to NN, the other three N sources increased 14-deoxyandrographolide and andrographolide levels. In contrast, GN decreased andrograpanin and dehydroandrographolide levels, and AN slightly decreased neoandrographolide levels (Figure 1A). Farnesyl pyrophosphate (FPP) profoundly accumulated, but mevalonate was reduced under AN and organic N conditions.
Different N sources affected the expression of genes in andrographolide biosynthetic pathways differentially. Compared to NN, AN mainly upregulated the expression of genes in the 2-C-methyl-D-erythritol 4-phosphate (MEP) pathway, including ApDXS, ApDXR, ApCMK, ApMDS, ApHDR, as well as ApGGPS, ApCPS and ApUGT73AU; while the expression of genes in the mevalonate (MVA) pathway were mainly down-regulated. UN increased the expression of genes in MEP and MVA pathways, but the upregulation of ApGGPS, ApCPS and ApUGT73AU was weaker than in AN (Figure 1B). ApMCT, ApHMGS, ApPMK, ApMDD2, and ApUGT73AU1 were upregulated, but other genes were not affected or downregulated by GN (Figure 1B).

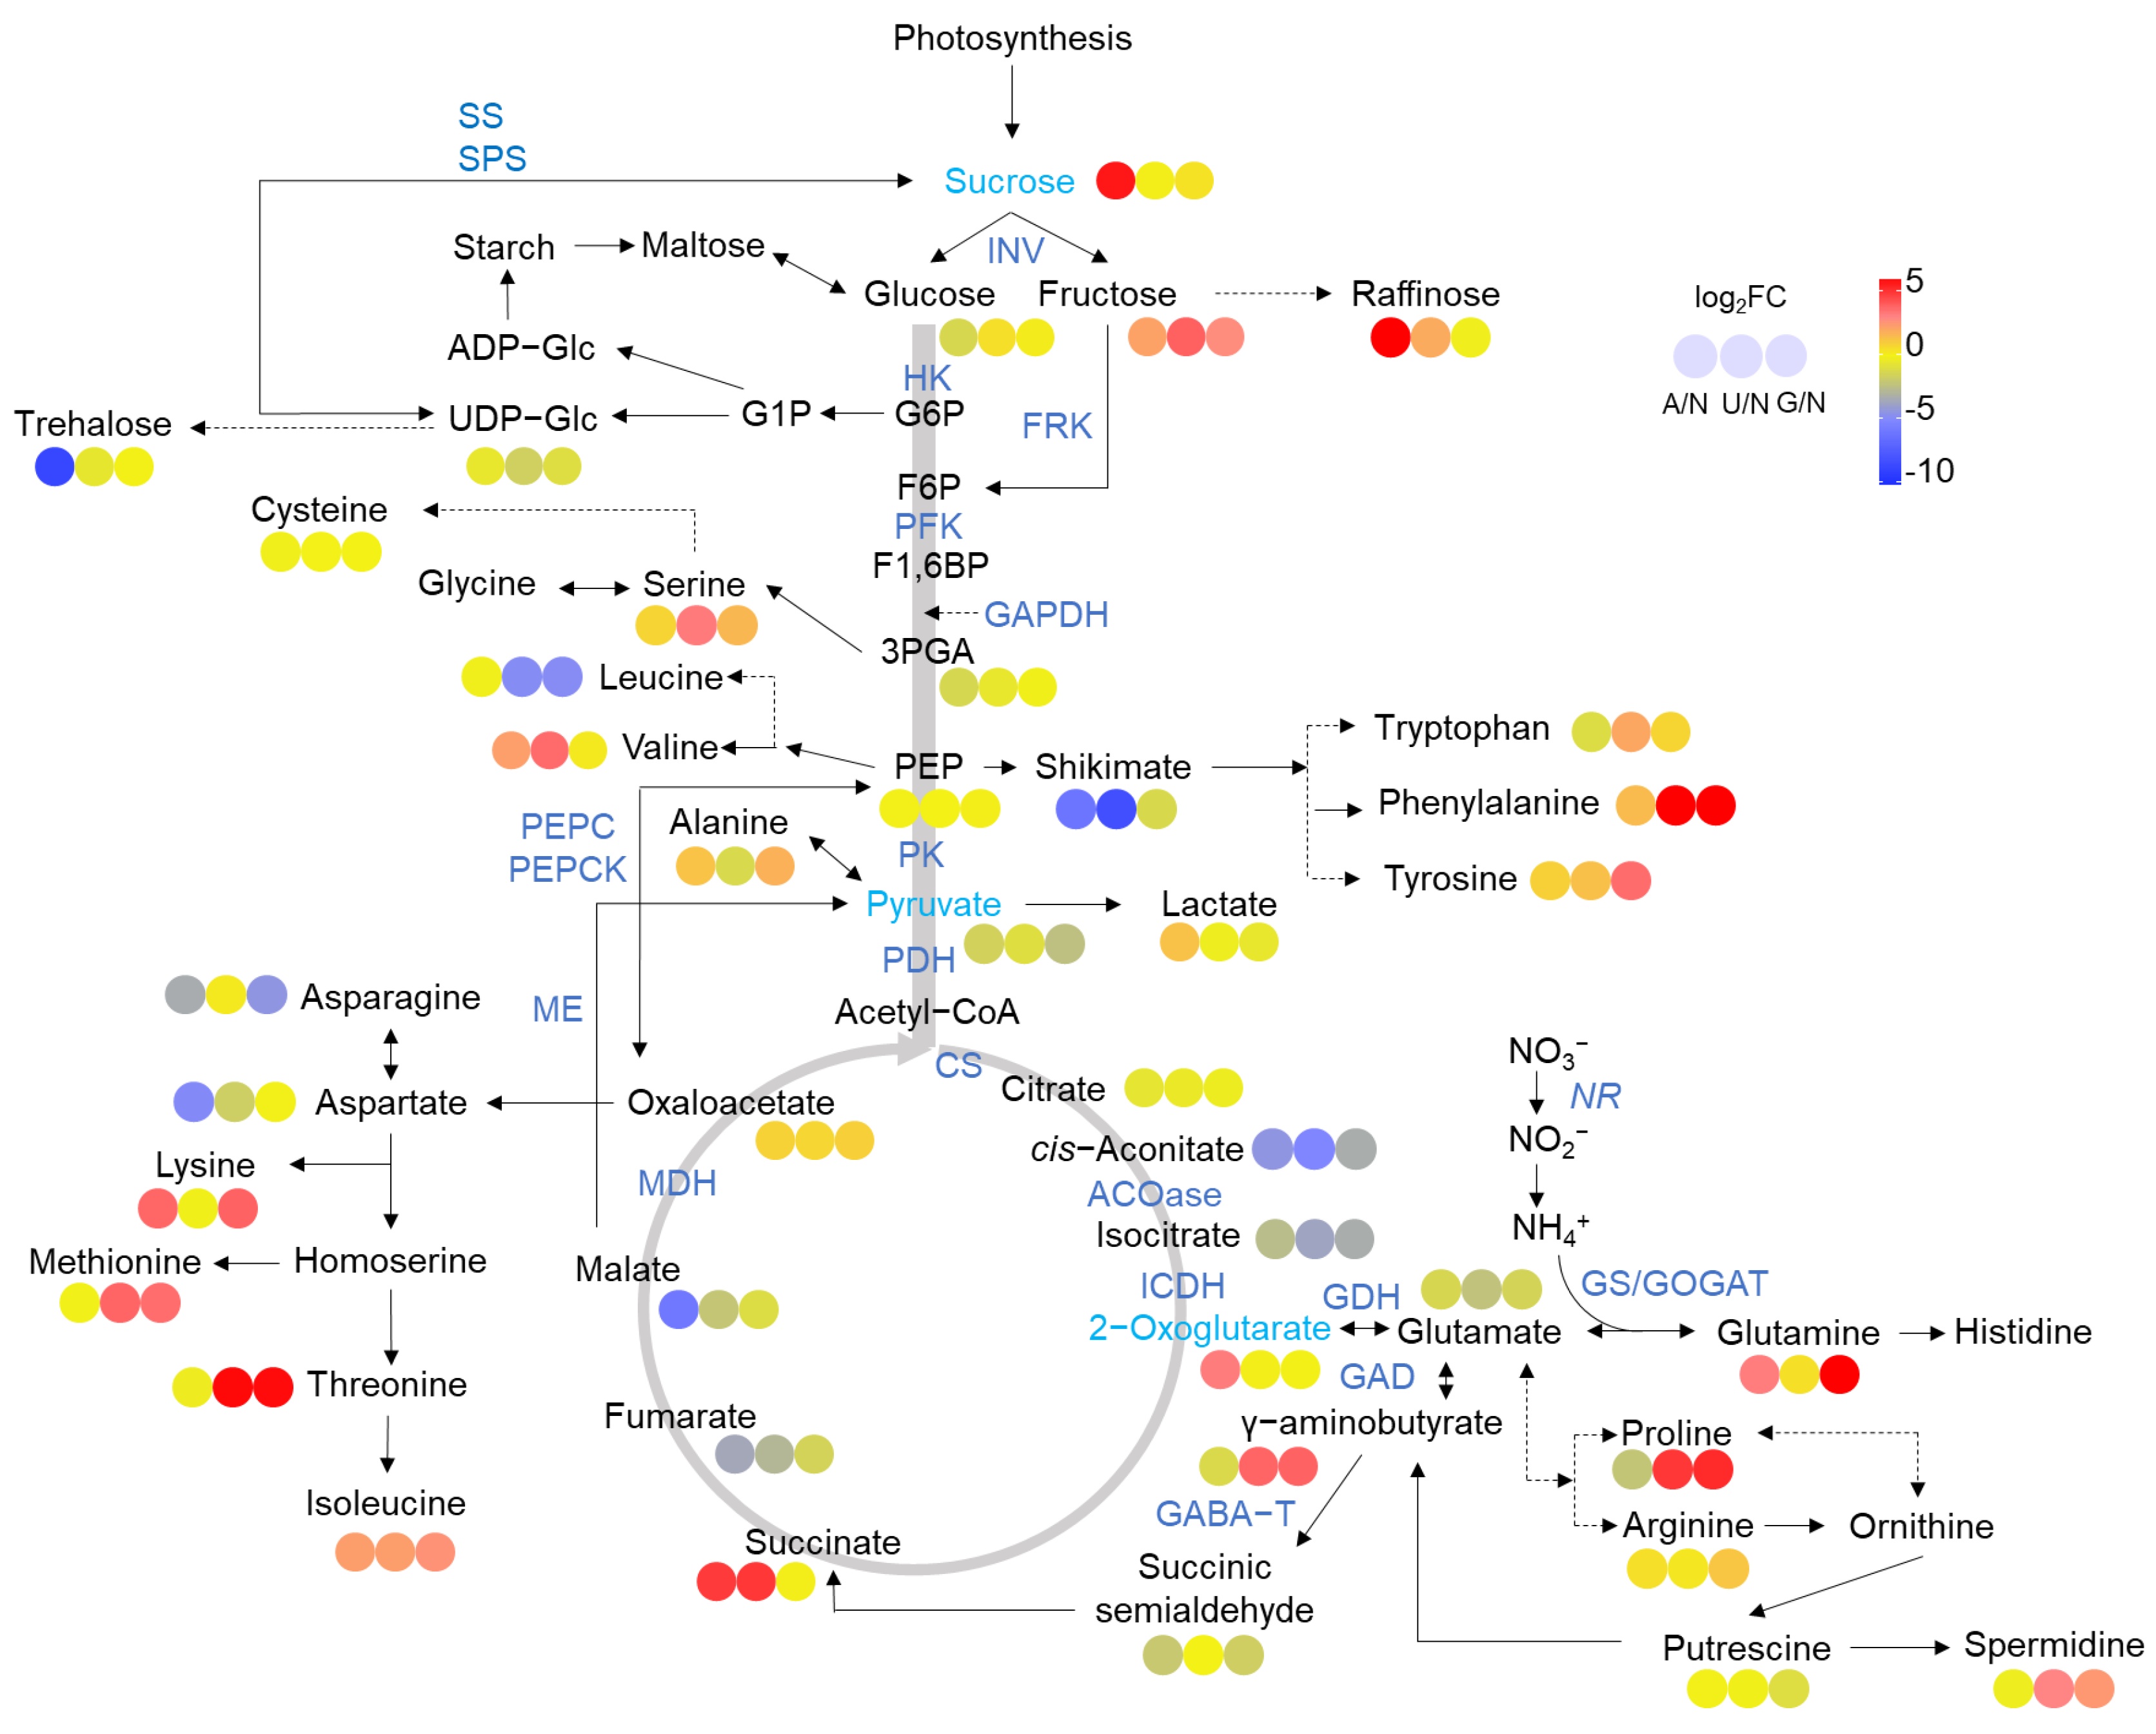
2.2. Glycolysis and the TCA Cycle

As shown in Figure S1A, the CO2 response curve of photosynthesis was slightly different among N sources. Vcmax, Jmax and TPU were relatively higher in AN and UN, with significant differences in Vcmax and TPU between AN and GN (Table S2). AN and UN considerably increased the photosynthesis rate of plants at ambient CO2 concentration (400 μmol·mol−1) (Figure S1B). The chlorophyll content was higher in the plants grown in UN, which was remarkably greater than that in GN (Figure S1C). The specific leaf area (SLA) was remarkably lower in NN than in UN and GN (Figure S1D), while special leaf N (SLN) and photosynthetic N use efficiency (PNUE) were not different among N sources (Figure S1E,F). These results suggested that the photosynthetic productivity of plants grown in NN is relatively lower than that of other N forms.
Compared to NN, AN and organic N increased sucrose (AN only) and fructose (Figure 2). In contrast, UDPG and trehalose levels were decreased by AN and organic N. Intermediates of glycolysis such as 3-phosphoglycerate (3-PGA), PEP, and pyruvate were decreased or unchanged by AN and organic N.
In comparison to NN, the activity of SS was significantly increased by AN and UN, and SPS activity was significantly increased by UN and GN (Figure 3A,B). The HXK activity was remarkably increased by AN and organic N, while the FRK activity was not different among N sources (Figure 3C,D). However, the activities of PFK and GAPDH were remarkably decreased by AN and/or organic N (Figure 3E,F). The activity of PK was not different among N sources (Figure 3G), while the activities of PDH and PEPC were reduced by AN and organic N (Figure 3H,I). In contrast, the PEPCK activity was remarkably increased by AN and organic N (Figure 3J).
The levels of organic acids in the TCA cycle, including citrate, cis-aconitate, isocitrate, fumarate and malate, were reduced. Still, the levels of oxaloacetate, 2-oxoglutarate and succinate were mainly increased by AN. Organic N. Coherently, the activity of MDH was significantly increased in UN and GN, and the ME activity was remarkably increased in AN and organic N (Figure 3K,L). However, the activities of CS and ACO were considerably inhibited by AN and organic N, respectively (Figure 3M,N). The ICDH activity was increased in AN and GN (Figure 3O), while the α-KGDH activity was not significantly different among N sources (Figure 3P). These results suggested that AN and organic N diminished the partitioning of C metabolic flow from glycolysis into the TCA cycle.

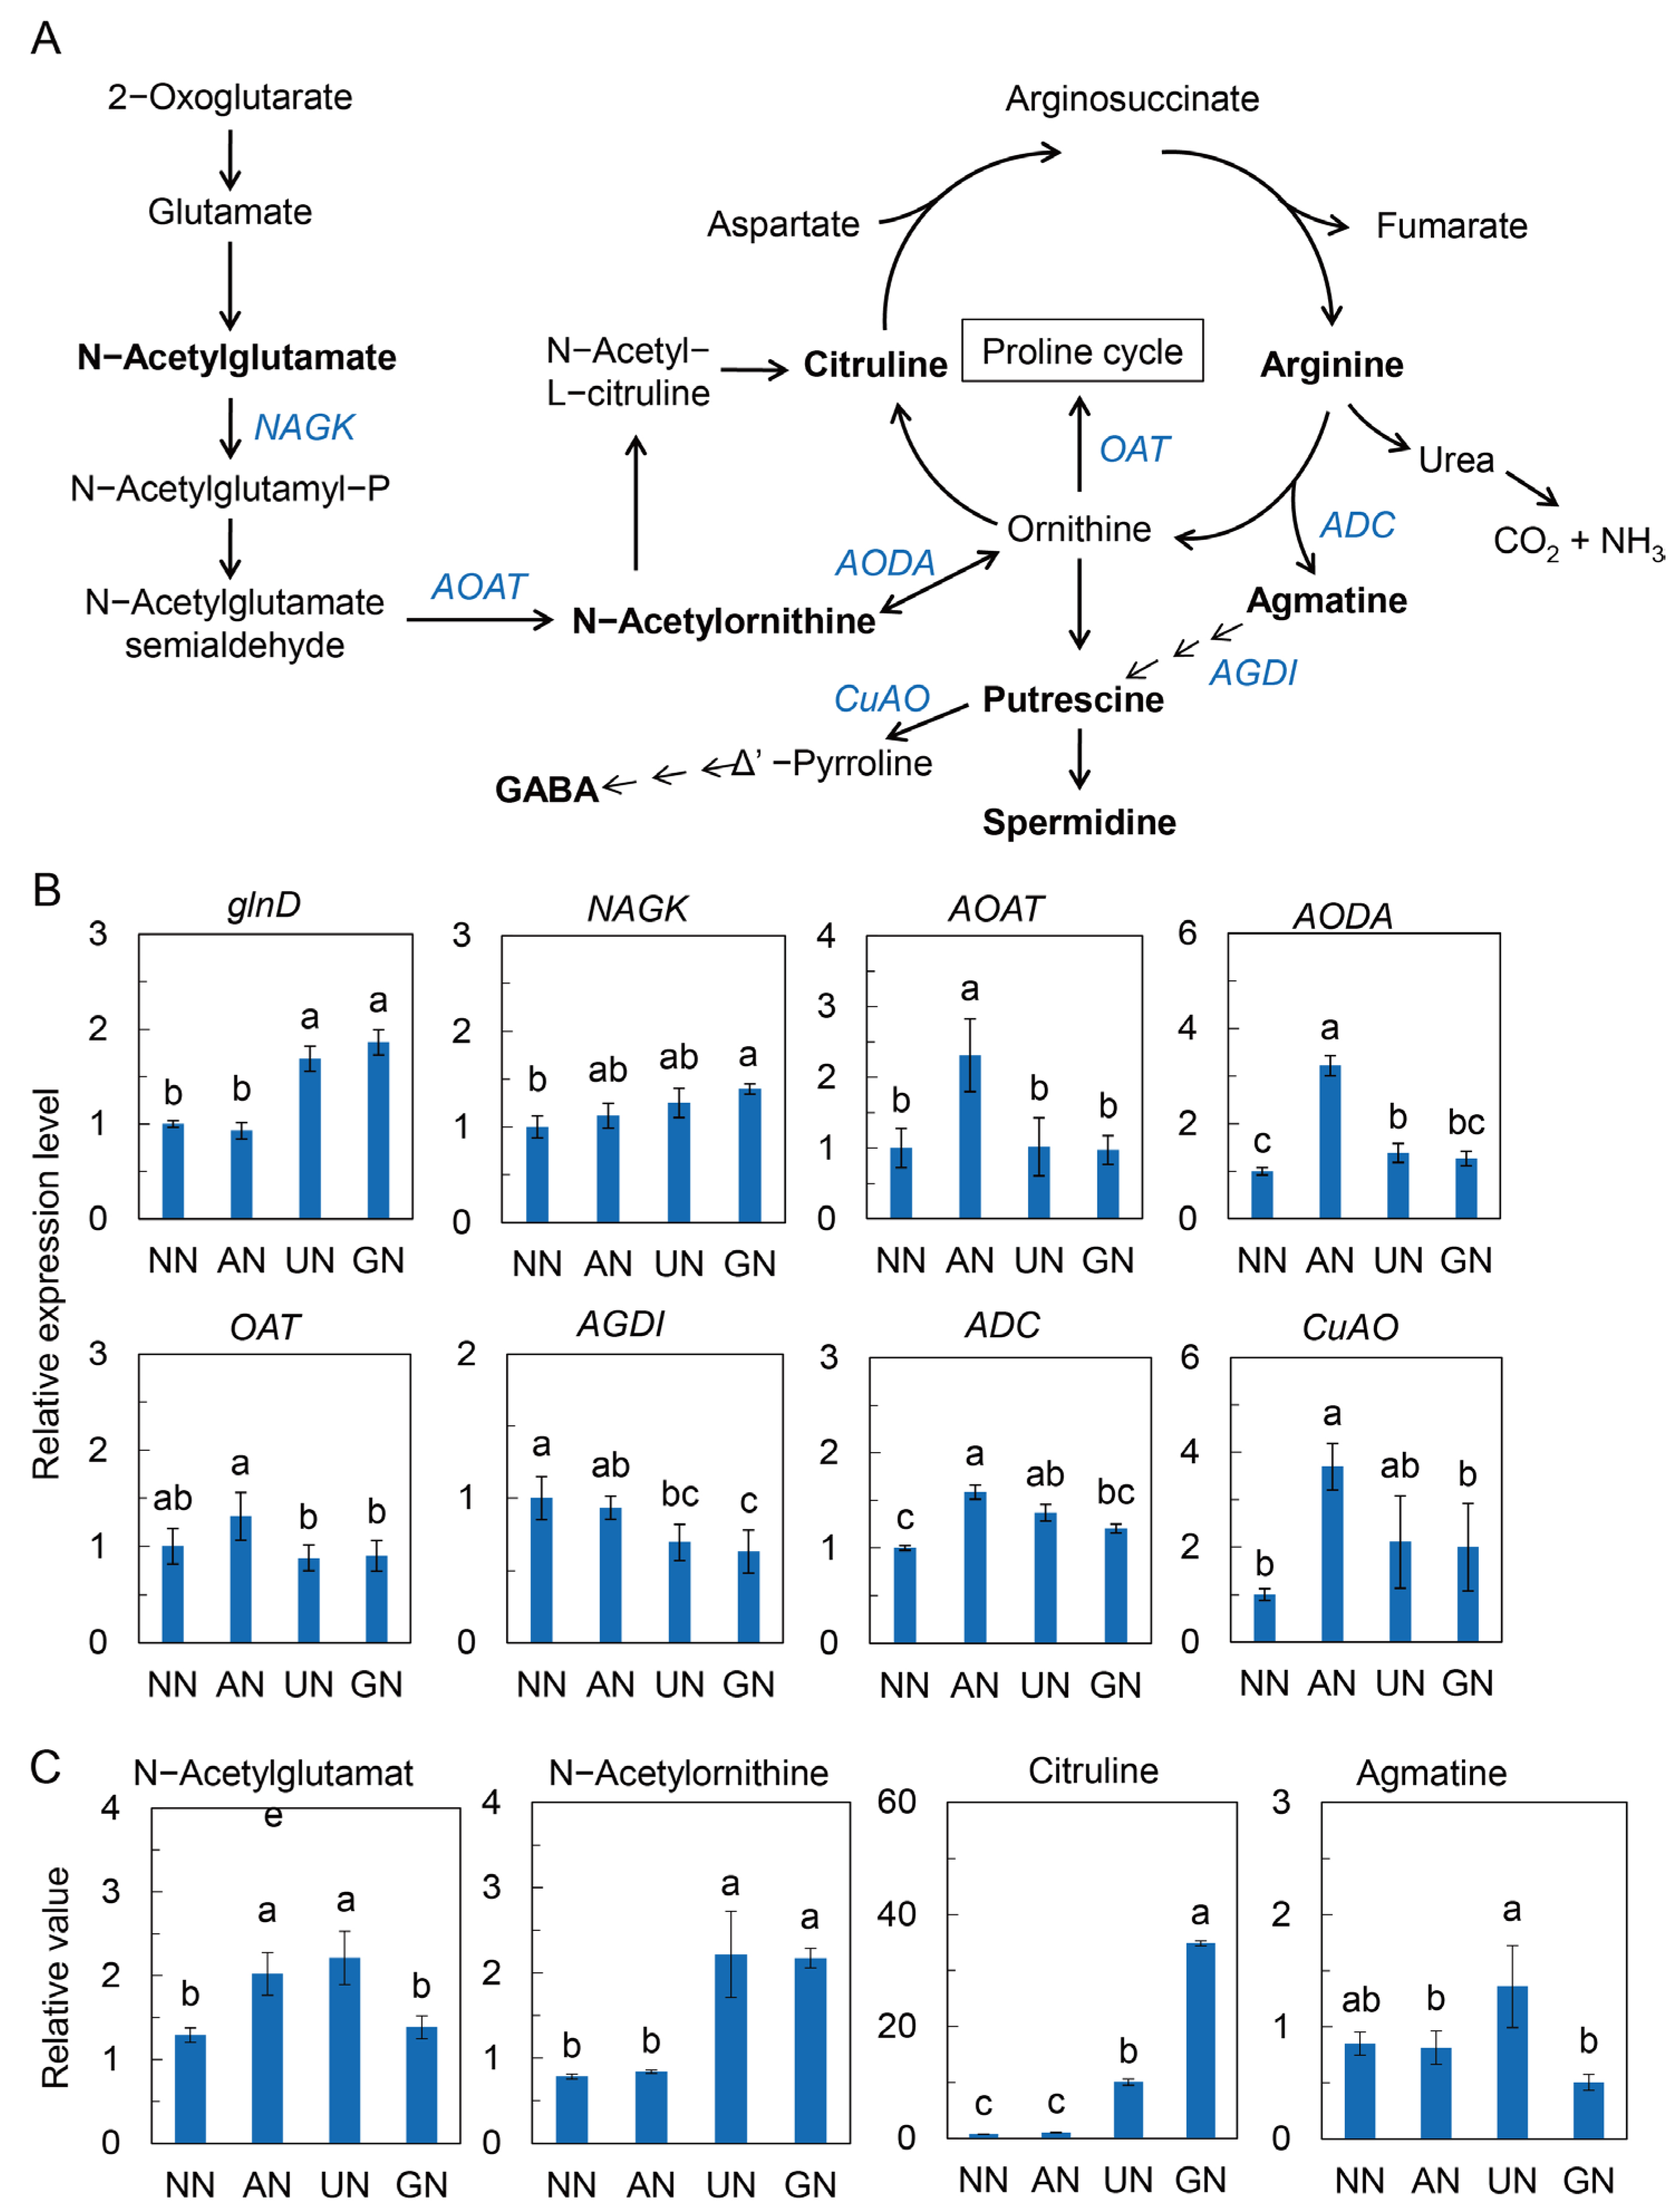
2.3. N Assimilation and Amino Acids Metabolism

Glutamine synthase (GS) activity was relatively higher in UN and GN (Figure 4A), while glutamine-2-oxoglutarate aminotransferase (GOGAT) activity was remarkably reduced by AN and organic N (Figure 4B). In contrast, AN and organic N significantly increased the activity of NAD-dependent glutamate dehydrogenase (NAD-GDH). However, NAD-dependent GDH (NADH-GDH) activity was noticeably lower in AN and UN than in NN (Figure 4C,D). AN and organic N also increased glutamate decarboxylase (GAD) and GABA aminotransferase (GABA-T) activities with the exception of GABA-T in UN. (Figure 4E,F).
The expression of NIA2.1 was substantially lower in AN and organic N in relation to NN (Figure S2A). Organic N sources also repressed the expression of GS1, GS2, NADH-GOGAT, and Fd-GOGAT (Figure S2B–E). The expression of GDH was downregulated by AN but upregulated by GN relative to NN (Figure S2F), while the expression of GAD1 and GABA-TP3 was remarkably upregulated by UN (Figure S2G,H). These results indicated that AN and organic N treatments attenuated plant N assimilation but enhanced GABA shunt, which could reduce the competition for C between N assimilation and secondary metabolism and promote C anaplerosis in the TCA cycle.
AN and organic N promoted the synthesis of aromatic amino acids (Try, Phe and Tyr) and aspartate family amino acids (Lys, Met, and Thr) but reduced glutamate and aspartate levels. However, glutamine was highly accumulated by AN and GN (Figure 2). Proline, arginine, and GABA were increased by organic N. In line with proline and arginine, spermidine was significantly accumulated in organic N as well.
Further analyses of the arginine metabolism showed that AN and/or organic N upregulated the expression of glnD, NAGK, AOAT, and AODA and increased the levels of N-acetylglutamate, N-acetylornithine, and citrulline to a certain extent (Figure 5). Although AGDI expression was repressed by organic N, ADC and CuAO were significantly upregulated by AN, and, to some extent, by organic N. It was suggested that the arginine biosynthesis pathway and its downstream polyamine oxidation were strengthened by AN and organic N (Figure 5).

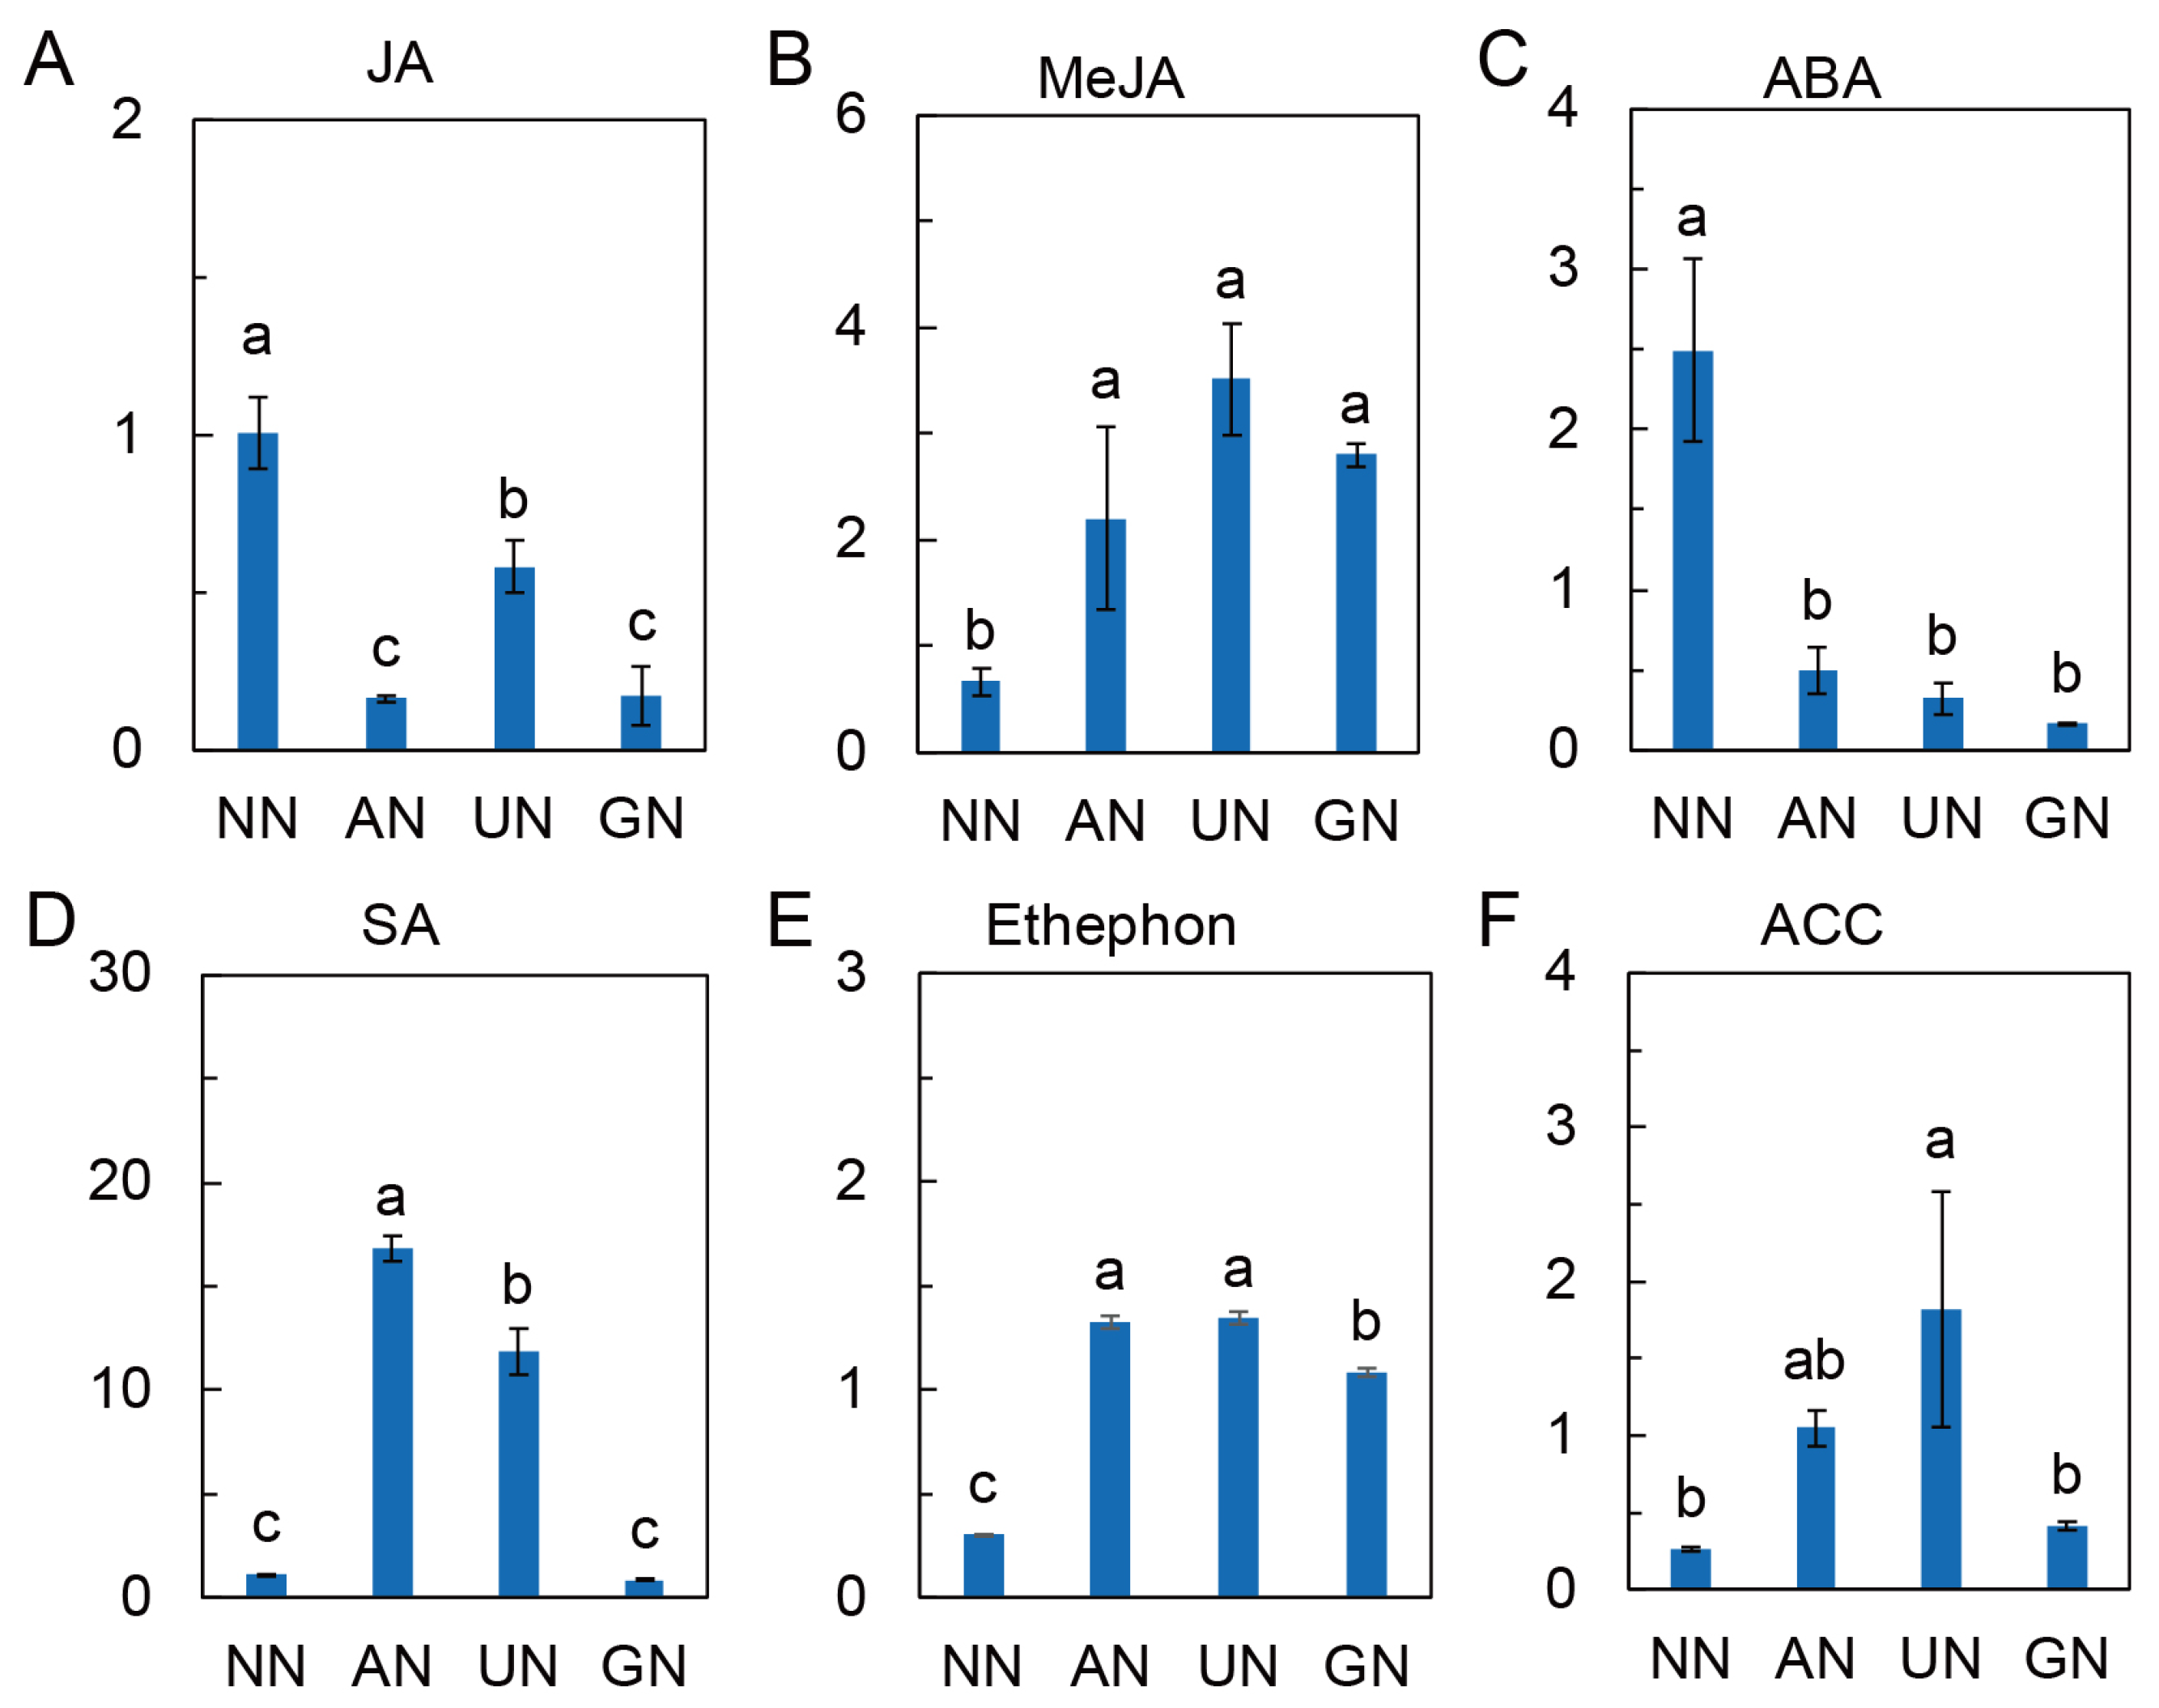
2.4. Phytohormone Levels Affected by N Sources

Jasmonate (including JA and MeJA), salicylic acid (SA), abscisic acid (ABA), 1-aminocyclopropanecarboxylic acid (ACC) and ethephon were detected in different N sources conditions. JA and ABA were remarkably reduced, while MeJA and ethephon were considerably increased by AN and organic N over NN (Figure 6A–C,E). SA and ACC levels were significantly higher in AN and UN compared to NN and GN (Figure 6D,F). The increases in SA and ACC were consistent with the increased precursors and intermediate metabolites and the expression of relative genes (Figures S3 and S4).

3. Discussion

3.1. N Sources Affect Diterpenoid Lactone Components Accumulation

N sources affect the components and content of bioactive ingredients in medicinal plants by modulating the expression of genes in the synthetic pathway [7,13]. Since the complete pathway for the synthesis of andrographolide has not yet been elucidated, studies for the genes of andrographolide biosynthesis mainly focus on those in the MVA and MEP pathways. Both pathways are involved in the biosynthesis of andrographolide in A. paniculata [35,36], but the dominant pathway is influenced by environmental factors [36,37]. It has been reported that NH4+ stimulated the MVA pathway in Arabidopsis thaliana [20]. Herein, we found that NH4+ mainly induced the expression of genes in the MEP pathway, while urea upregulated the genes in both the MEP and MVA pathways, and Gly mainly affected the genes in the MVA pathways (Figure 1B). It was suggested that the transcriptional regulatory mechanism of andrographolide biosynthesis varied with different N sources. Nevertheless, farnesyl pyrophosphate, the skeleton for the synthesis of geranylgeranyl pyrophosphate and subsequently diterpenoids, was extraordinarily highly accumulated under AN and organic N conditions, suggesting a similar metabolic regulatory mechanism of these N sources on andrographolide components.
In this study, we found that N sources affected the main components of diterpenoid lactones in A. paniculata. It is widely accepted that cytochrome P450 monooxygenases (CYP450s) are responsible for the biosynthesis of andrographolide and its derivatives after the formation of diterpene skeleton [38], although those genes have not yet been identified. Andrographolide, 14-deoxyandrographolide, neoandrographolide and dehydrographolide were generally increased under AN and organic N conditions, suggesting that CYP450 genes are the key targets regulated by N forms in the biosynthesis pathway of andrographolide in A. paniculata. The results of this study could help us explore the CYP450 genes in the synthesis pathways of andrographolide.

3.2. N Sources Reprogram C and N Metabolism

Photosynthesis is the initial C source for primary and secondary metabolism. Increasing photosynthesis facilitates plant secondary metabolite synthesis [39]. In this study, AN and UN promoted the biochemical processes of photosynthesis to a certain extent, as Vcmax, Jmax and TPU were higher than those in NN. Additionally, the photosynthetic rate at ambient CO2 concentration (~400 μmol·mol−1) was significantly higher in AN and UN treatments, suggesting that a greater assimilative productivity contributed to increased andrographolide biosynthesis in these N source conditions.
Apart from the production of assimilates, the partitioning of C metabolism also affects the relationship between primary and secondary metabolism [40]. Many studies showed that N-affected secondary metabolism was associated with partitioning C source between growth and defense [21,41], typically manifested as the alteration of the C/N ratio [7]. N sources affect the accumulation of sugars in plants [42]. Although the mechanism underlying the interconnection between sugar and secondary metabolite accumulation has not been well unveiled, there was a positive correlation between them in medicinal plants [10,21]. In the present study, the accumulation of sucrose and fructose was generally higher or not different from NN in AN, UN, and GN. The accumulation of sugars is the result of their anabolism and catabolism. The increased activities of SS and SPS and the reduced activity of PFK could be important factors in sugar accumulation. Gluconeogenesis also regulates the expression and activity of SPS, accelerating sucrose synthesis and accumulation [43]. We found that the activity of PEPCK, the rate-limiting enzyme of gluconeogenesis, was remarkably increased by AN, UN, and GN (Figure 3J). These results suggested that N-source-mediated sugar homeostasis could be involved in the regulation of andrographolide biosynthesis.
Nitrate reductase (NR) and PEPC play essential roles in coordinating the C and N metabolisms in plants [44]. In this study, the expression of NIA2 was extremely suppressed by AN and organic N, and other N metabolic genes were also repressed (Figure S2), indicating that these N sources attenuated plant N assimilation activity. Our previous study proposed that high N assimilation activity is responsible for low andrographolide accumulation in A. paniculata [10,25]. N assimilation is the main process competing with secondary metabolism for C [41]. Thus, reducing N assimilation could stimulate the allocation of carbohydrates to secondary metabolism. The C skeletons required for N assimilation are replenished from glycolysis to the TCA cycle, the central metabolic hub for the C and N metabolism interactions [45,46]. An open mode of the TCA cycle promotes N assimilation by sustaining C skeleton availability [47]. Coleto et al. [20] reported that ammonium-enhanced anaplerotic routes are associated with the TCA cycle. PEPC in the anaplerotic pathway is believed to play a significant role in replenishing C for the TCA cycle via CO2 fixation to support N assimilation [48]. We observed that although the activity of PK was constant among N source treatments, both PEPC and PDH activities were reduced by AN and organic N. In addition, PEP and pyruvate contents were declined in these N source conditions. The above findings suggested that AN and organic N attenuated carbohydrate allocation from glycolysis to the TCA cycle and downstream N assimilation. As a result, more carbohydrates can serve as substrates for production of secondary metabolites and regulators such as plant hormones (discussed later).

3.3. The Center Metabolic Pathway in Mediating Reprogramming of C Metabolism

N assimilation requires 2-oxoglutarate (2-OG) for the C skeleton. 2-OG is derived from sugar respiration and amino acid transamination. In the former biochemical process, 2-OG is produced following glycolysis, the TCA cycle, and the anaplerotic pathway [49]. NAD-GDH oxidizes glutamate to produce 2-OG and NH4+. There is considerable evidence for a GDH shunt to return the C in amino acids back into C metabolism and the TCA cycle [50]. In the current study, AN-induced accumulation of 2-OG could be attributed to increased activities of ICDH and NAD-GDH and decreased activities of NADH-GDH (amination activity) and GOGAT. The accumulation of 2-OG, accompanied by reduced N assimilation, suggested that 2-OG was less likely to act only as a C skeleton. Indeed, 2-OG also acts as a cofactor for dioxygenase enzymes that are important in several phytohormone synthetic pathways and a signal for some enzymes sensing C and N status in plant cells [51]. It has been proposed that the accumulation of 2-OG controls C metabolic flux to N metabolism or other metabolic pathways [45,51]. Its accumulation indicates sufficient C supply for N assimilation, which could allow the allocation of more available C to fuel andrographolide synthesis.
It has been revealed that the PII protein interacts with 2-OG, controlling C metabolic flux in N assimilation [51]. In the present study, we found that the expression of glnD (also known as uridylyltransferase and uridylyl removing (UR) enzyme, which converts PII protein deuridylylation in N-rich conditions) was remarkably upregulated by UN and GN. Glutamine, the first organic product of N assimilation in plants, is commonly considered to be an important intracellular N status signal [52], of which accumulation indicates N enrichment in plants. It binds to the PII protein, and it is only after binding that the PII protein is able to form a complex with and activate NAGK and subsequently trigger the synthesis of arginine [53]. Arginine is an important N storage compound with the lowest C/N ratio in amino acids. It is critical for N reutilization in plants [54]. Here, we observed in AN and organic N treatments that glutamine level and the expression of NAGK and glnD were increased. Simultaneously, the expression of AOAT and AODA and/or the levels of intermediates of arginine metabolism such as N-acetylglutamate, N-acetylornithine and citruline were increased as well. It was indicated that AN and organic N sources enhanced arginine metabolism.
Degradation of polyamine derived from arginine metabolism is an important pathway for GABA synthesis in plants [55,56]. Here, we found that the expression of ADC and CuAO was upregulated by AN and organic N to some extent, which could impulse the synthesis of GABA. In addition, the increases in the levels of GABA and succinate, as well as the increments of GAD and GABA-T activities and their transcript levels, suggested that GABA shunt was strengthened by AN and organic N. Obviously, GABA shunt provides C and N to complement TCA cycle, which could regulate C flux derived from glycolysis. On the other hand, GABA can regulate cytosolic pH [57], which is considered an essential signal mediating plant secondary metabolism [16]. GAD and PEPCK were acidic inducible enzymes [15]; their activities were increased in plants exposed to ammonium [20]. They consume H+ via GABA synthesis and MDH-associated malate decarboxylation, respectively. The activities of GAD, PEPCK, and MDH were consistently elevated by AN and organic N. Our results suggested that GABA, accompanied by malate metabolism, not only regulated C in the TCA cycle but could also participate in plant secondary metabolism via regulating cytosolic acidification. However, the signaling mechanism of N-source-induced TCA metabolism alteration in the regulation of andrographolide biosynthesis is worthy of further study.

3.4. Plant Hormones Involve in N Source Regulated Andrographolide Synthesis

Phytohormones, including JA (and MeJA), SA, ABA, and ethylene, extensively participate in the signaling network of stimuli-triggered plant secondary metabolism [40,58]. The positive regulatory role of ABA in andrographolide biosynthesis has been reported by Guan et al. [59]. In the current study, however, the level of ABA in plants grown in AN and organic N was remarkably lower than that in NN, suggesting that ABA could weakly contribute to N sources-regulated biosynthesis of andrographolide compounds. MeJA and SA are defensive hormones that have profoundly influenced plant secondary metabolism in response to various environmental factors [33,60]. In this study, MeJA was significantly increased by AN and organic N, which aligns with the increases in andrographolide compounds, implying that MeJA could regulate andrographolide compounds biosynthesis under different N source conditions.
SA is another defensive hormone modulating plant secondary metabolism [60,61,62]. Shikimate and chorismate derived from PEP are important precursors for the synthesis of SA [63]. Ding et al. [64] reported that reduced N assimilation stimulates the synthesis of SA and increases plant immunity. We also observed that AN and organic N reduced N assimilation but increased SA synthesis, as revealed by increases in chorismate, phenylpyruvate, and phenylalanine, and decreases in shikimate and trans-cinnamic acid (Figure S3). The increased SA synthetic pathway implied that SA could also participate in biosynthesis of N sources-regulated andrographolide compounds in A. paniculata.
Ethylene and its precursor ACC had effective regulatory functions in plant secondary metabolism [65,66,67]. The N sources stimulate ethylene biosynthesis and signaling by upregulating the transcriptional levels of ACS, ACO, and EIN3, with a greater effect of ammonium relative to nitrate [68,69,70]. In this study, AN and organic N induced the synthesis of methionine, S-adenosyl methionine (SAM) and ACC, as well as the expression of ACO and EIN3. The level of ethephon, which is functionally similar to ethylene [71], was also increased by these N sources. It was suggested that ethylene could also be involved in the N-source-mediated biosynthesis of andrographolide compounds.
There is complex crosstalk between plant hormones in mediating plant secondary metabolism. For example, the interaction between ethylene and MeJA affects phenolic compounds in Catharanthus roseus [72], and the AP2/ERF family often acts as part of signaling cascades induced by JA controlling plant secondary metabolism [73]. Further studies are needed to reveal the specific roles of plant hormones in N sources-regulated andrographolide biosynthesis in A. paniculata.

4. Materials and Methods

4.1. Plant Materials and Growth Conditions

Andrographis paniculata of the Acanthaceae family was used as material in this study. The seeds of A. paniculata were obtained from the seed bank of the Guangxi Botanical Garden of Medicinal Plants and germinated on wet filter papers at room temperature (about 28 °C). Two weeks later, the germinated seedlings were transplanted to a seedling tray for continuous growth until three-pair leaf age in a mixed matrix containing vermiculite and perlite. The seedlings with two pairs of true leaves were fed with 1/10 strength of nutrient solution as described below. The N source was nitrate. Then, the seedlings were transplanted to pots filled with vermiculite and perlite (4:1) for N sources treatments. The seedlings were grown in a climatic room with a temperature of 28 °C, relative humidity of 60–70%, and a 14-h photoperiod of 200 μmol·m−2·s−1 photosynthetic active radiation (PAR).
Nitrate (NN), ammonium (AN), urea (UN), and glycine (GN) were offered by 2 mM KNO3 and 2 mM Ca(NO3)2, 6 mM NH4Cl, 3 mM CO(NH2)2, and 6 mM glycine, respectively, as the sole N source in each treatment. Other mineral nutrients in the nutrient solution contained 1 mM NaH2PO4, 2 mM KCl, 2 mM CaCl2, 1 mM MgSO4, 18 μM H3BO3, 0.15 μM ZnSO4, 0.15 μM CuSO4, 0.52 μM (NH4)6Mo7O24, 9.5 μM MnSO4, and 36 μM Fe-EDTA. In the NN treatment, KCl and CaCl2 were replaced by KNO3 and Ca(NO3)2, respectively, to provide NO3 and maintain a balance of K+ and Ca2+ concentrations. The pH of the solution was adjusted to 5.8–6.0, and 10 mg·L−1 ampicillin was added to inhibit microbes. The nutrient solution was supplied twice a week at 200 mL per pot. A month later, plants grown in different N sources were sampled for analysis. NN was used as a control.

4.2. Photosynthesis and Leaf Nitrogen Allocation Measurements

The photosynthetic CO2 response curve (A-Ci curve) was measured using the LI-6400XT portable photosynthesis system (LI-COR, Lincoln, NE, USA). The fully expanded new leaves on the main stem were placed in the leaf chamber and adapted for 20 min at 1500 μmol·m−2·s−1 PAR and 450 ± 20 μmol·mol−1 ambient CO2 (Ca). Then, the photosynthetic gas exchange was measured at a series of Ca: 1500, 1200, 1000, 800, 600, 400, 300, 200, 150, 100, and 50 μmol·mol−1. The maximum carboxylation rate (Vcmax), maximum electron transport rate (Jmax) and triose phosphate utilization (TPU) were calculated using the A-Ci curve according to the FvCB model [74] by a photosynthesis tool [75]. Photosynthetic N use efficiency (PNUE, μmol·g−1 N·s−1) was calculated as Pn/SLN, where Pn (μmol·m−2·s−1) is the photosynthetic rate at 400 μmol·mol−1 CO2, and SLN was specific leaf N (g·m−2).
After photosynthesis measurement, the N and chlorophyll contents in leaves were determined based on leaf area. The total N was measured by digesting leaf samples in H2SO4-H2O2 and quantified by indophenol blue colorimetry method at 625 nm [76]. (NH4)2SO4 was used as the standard. The chlorophyll was extracted by immersing the leaf samples in acetone and alcohol (v:v = 1:1) for 24 h and measured spectrophotometrically at 663 nm and 645 nm [77].

4.3. Metabolites Analysis

Leaves were sampled and immediately frozen in liquid nitrogen and then stored at −80 °C for metabolite analysis. The frozen samples (about 100 mg) were ground into a fine powder with a mortar and pestle in liquid nitrogen. Then 1 mL cold extraction solvent (methanol/acetonitrile/H2O, 2:1:1, v/v/v) was added to the samples and adequately vortexed, followed by incubating the samples on ice for 20 min and centrifuging at 14,000× g and 4 °C for 20 min. The supernatant was collected and flowed through a 96-well protein precipitation plate, and then the elution was collected and dried in a vacuum centrifuge at 4 °C. For LC-MS analysis, the samples were re-dissolved in 100 μL acetonitrile/water (1:1, v/v) solvent and then transferred to LC vials.
For untargeted metabolomics of polar metabolites, the extracts were analyzed using a quadrupole time-of-flight mass spectrometer (Sciex TripleTOF 6600, Sciex, Framingham, MA, USA) coupled to hydrophilic interaction chromatography via electrospray ionization in Shanghai Applied Protein Technology Co.; Ltd. (Shanghai, China). LC separation took place on an ACQUIY UPLC BEH Amide column (2.1 mm × 100 mm, 1.7 µm particle size (Waters, Wexford, Ireland) using a gradient of solvent A (25 mM ammonium acetate and 25 mM ammonium hydroxide in water) and solvent B (acetonitrile). The gradient was 85% B for 1 min and linearly reduced to 65% in 11 min, and then reduced to 40% in 0.1 min and kept for 4 min, followed by an increase to 85% in 0.1 min. A 5 min re-equilibration period was employed. The flow rate was 0.4 mL·min−1, column temperature was 25 °C, autosampler temperature was 5 °C, and injection volume was 2 µL. The mass spectrometer was operated in both negative ion and positive ionization mode. The ESI source conditions were set as follows: Ion Source Gas1 (Gas1) as 60, Ion Source Gas2 (Gas2) as 60, curtain gas (CUR) as 30, source temperature 600 °C, and IonSpray Voltage Floating (ISVF) ± 5500 V. In MS acquisition, the instrument was set to acquire over the m/z range of 60–1000 Da, and the accumulation time for the TOF MS scan was set at 0.20 s/spectra. In auto MS/MS acquisition, the instrument was set to acquire over the m/z range 25–1000 Da, and the accumulation time for product ion scan was set at 0.05 s/spectra. The product ion scan was acquired using information-dependent acquisition (IDA) in a high-sensitivity mode. The parameters were set as follows: the collision energy (CE) was fixed at 35 V with ±15 eV; declustering potential (DP) at 60 V (+) and −60 V (−); exclude isotopes within 4 Da; and the candidate ions to monitor per cycle was 10.

4.4. Enzymes Assays

The frozen leaf samples (~0.1 g) were homogenized with 50 mM Tris-HCl buffer solution (pH 8.0, containing 2 mM MgSO4, 2 mM DTT and 0.4 M sucrose). The samples were centrifuged at 10,000× g and 4 °C for 10 min, and the supernatant was used for enzyme assays. The activities of glutamine synthase (GS), glutamate synthase (GOGAT), glutamate dehydrogenase (GDH), and isocitrate dehydrogenase (ICDH) were measured in a previous study [78].
The reaction medium of GS contained 40 mM hydroxylamine hydrochloride buffer (pH7.4, containing 40 mM MgSO4, 10 mM glutamate, 10 mM cysteine, and 1 mM EGTA), 10 mM ATP, and 0.5 mL enzyme extract. The total volume was 2 mL. After incubation of the mixture at 37 °C for 60 min, the reaction was terminated by adding acidic FeCl3 (0.37 M FeCl3 and 0.2 M TCA in 0.6 M HCl). The samples were centrifuged at 10,000 rpm for 10 min, and the absorbance at 540 nm (A540) was measured chromometrically. The blank was the absence of hydroxylamine hydrochloride. The GS activity was represented indirectly by the A540 per unit protein per hour.
The reaction mixture of GOGAT consisted of 10 mM a-ketoglutarate, 1 mM KCl, 37.5 mM of Tris-HCl buffer (pH 7.6), 0.6 mM of NADH, 8 mM of l-glutamine, and 0.1 mL of enzymes. The total volume was 1 mL. The activity was calculated by the average rate of NADH oxidation during the first 2 min after the start of the reaction.
The reaction medium of NADH-GDH contained 100 mM of Tris-HCl (pH8.0, containing 2 mM of α-ketoglutarate, 20 mM of NH4Cl), 2 mM of NADH, 10 mM of CaCl2, and 0.1 mL enzyme extract. The total volume was 1 mL. Activity was calculated by the average rate of NADH oxidation during the first 2 min after the start of the reaction.
The reaction medium of NAD-GDH contained 100 mM of Tris-HCl (pH 8.0, containing 100 mM l-glutamate), 10 mM of NAD+, 10 mM of CaCl2, and 0.1 mL of enzyme extract. The total volume was 1 mL. The activity was calculated by the average rate of NAD+ reduction during the first 2 min after the start of the reaction.
The reaction medium of ICDH contained 100 mM of K2HPO4-KH2PO4 (pH 7.5), 50 mM of MgCl2, 1 mM of NADP+, 30 mM of isocitrate, and 0.1 mL of enzyme extract. The total volume was 1 mL. The activity was calculated by the average rate of NADP+ reduction during the first 2 min after the start of the reaction.
Malate dehydrogenase (MDH) and NADP-malate enzyme (NADP-ME) activities were measured according to Kulichikhin et al. [79]. The reaction medium of MDH contained 100 mM HEPES-KOH (pH 7.5), 5 mM MgSO4, 0.2 mM NADH, 2 mM oxaloacetic acid (OAA), and 20 µL of enzyme extract. The total volume was 1 mL. The reaction was started by the addition of OAA. Activity was calculated by the average rate of NADH oxidation during the first 2 min after the start of the reaction. The reaction medium of NADP-ME contained 100 mM of Hepes-KOH (pH 7.5), 5 mM of MgSO4, 0.5 mM of NADP+, 5 mM of l(+)-malate, and 20 µL of enzyme extract. The total volume was 1 mL. The reaction was started by the addition of malic acid. The activity was calculated by the average rate of NADP+ reduction during the first 2 min after the start of the reaction.
Activities of glutamate decarboxylase (GAD) and GABA aminotransferase (GABA-T) were measured according to Deewatthanawong et al. [80]. GAD and GABA-T activities were represented as the generation rate of GABA and alanine, respectively. Frozen leaf samples (~0.1 g) were homogenized with 100 mM Tris-HCl (pH9.1, containing 10% glycerol, 1 mM DTT, 5 mM EDTA, 0.5 mM pyridoxal phosphate, and 1 mM PMSF). The samples were centrifuged at 10,000× g and 4°C for 10 min, and the supernatant was used for enzyme assays.
The reaction medium of GAD contained 100 mM potassium phosphate buffer (pH5.8), 40 μM pyridoxal phosphate, 3 mM l-glutamate, and 0.1 mL enzyme extract. After incubation at 30 °C for 60 min, 0.1 mL of 0.5 M perchloric acid was added to terminate the reaction. The produced GABA was measured in 1 mL reaction medium containing 200 μL potassium phosphate buffer (pH8.6), 150 μL 4 mM NADP+, 50 μL 2 U/mL GABAase, 50 μL 20 mM a-ketoglutarate, and 550 μL terminated reaction mixture. The activity was calculated by the average rate of NADP+ reduction during the first 2 min after the start of the reaction.
The reaction medium of GABA-T contained 50 mM of Tris-HCl (pH8.2, containing 10% glycerol, 1.5 mM of DTT, 0.75 mM of EDTA, 0.1 mM of pyridoxal phosphate, 16 mM of GABA, and 4 mM of pyruvate) and 0.2 mL of enzyme extract. After incubation at 30 °C for 60 min, 0.1 mL of 0.1 M sulfosalicylic acid was added to terminate the reaction. The produced alanine was measured in 1 mL reaction medium containing 50 mM of sodium carbonate buffer (pH10), 1.5 mM of NAD+, 0.02 U of alanine dehydrogenase, and 0.1 mL of terminated reaction mixture. The activity was calculated by the average rate of NAD+ reduction during the first 2 min after the start of the reaction.
Hexokinase (HK), fructokinase (FRK), glyceraldehyde-3-phosphate dehydrogenase (GAPDH), pyruvate kinase (PK) and phosphoenolpyruvate carboxylase (PEPC) activities were measured as previously reported [81].
The reaction system of HK contained 100 mM of Tris-HCl (pH 7.5), 0.2 mM of MgCl2, 2 mM of KCl, 1 mM of ATP, 1 mM of NAD+, 2 mM of glucose, 1 U of glucose-6-phosphate dehydrogenase (G6PDH), and 0.1 mL of enzyme extract. To measure the FRK activity, glucose was replaced by fructose, and 2 U glucose phosphate isomerase was added. The activity was calculated by the average rate of NAD+ reduction during the first 2 min after the start of the reaction.
The reaction medium of GAPDH contained 100 mM Tris-HCl (pH 8.4, containing 10 mM MgCl2 and 3 mM DTT), 5 mM ATP, 5 mM 3-PGA, 1 mM NADH, and 0.1 mL enzyme extract. The total volume was 1 mL. Activity was calculated by the average rate of NADH oxidation during the first 2 min after the start of the reaction.
The reaction medium of PEPC contained, in 1 mL, 100 mM of Hepes-KOH (pH 7.0), 100 mM of KCl, 10 mM of MgCl2, 0.2 mM of NADH, 1.5 mM of ADP and 24 units of l-malate dehydrogenase. The reaction was started by the addition of 10 mM PEP. Activity was calculated by the average rate of NADH oxidation during the first 2 min after the start of the reaction.
The reaction medium of PEPC contained, in 1 mL, 100 mM of Tris–HCl (pH 8.0), 10 mM of MgCl2, 25 mM of NaHCO3, 1 mM of dithiothreitol, 0.2 mM of NADH and 24 units of l-malate dehydrogenase. The measurement was started by the addition of 8 mM of PEP. Activity was calculated by the average rate of NADH oxidation during the first 2 min after the start of the reaction.
PEP carboxykinase (PEPCK) activity was measured according to Walker et al. [82] with some modifications. Crude enzyme extracts were obtained by homogenizing leaf samples in ice-cold 100 mM Tris-HCl (pH 9.8) containing 5 mm dithiothreitol (DTT). After centrifuging at 10,000× g and 4 °C for 10 min, the supernatant was used for determination of PEPCK activity in a continuous assay at 25 °C including 65 mM of Tris-HCl (pH 7.4), 100 mM of KCl, 0.3 mM of OAA, 1 mM of ATP, 10 mM of MnCl2, 4 mM of MgCl2, 71.5 mM mecaptoethanol, 0.1 mM of NADH, 2 units of pyruvate kinase, and 5 units of lactate dehydrogenase.
Phosphofructokinase (PFK) activity was determined by coupling the phosphorylation of fructose-6-phosphate with oxidation of NADH catalyzed by pyruvate kinase and lactate dehydrogenase using a PFK activity colorimetric assay kit (Acmec Biochemical Technology Co., Ltd., Shanghai, China). Citrate synthase (CS) and aconitase (ACOase) activities were measured using colorimetric assay kits (Michy Biology, Suzhou, China) according to the kit instructions.
Sucrose synthase (SS), sucrose phosphate synthase (SPS), and α-ketoglutarate dehydrogenase (α-KGDH) activities were determined using kits (Grace Biotechnology, Nanjing, China). Pyruvate dehydrogenase (PDH) was measured spectrophotometrically at 450 by monitoring the reduction of WST-8 using a kit (Michy Biology, Suzhou, China).

4.5. RNA Extraction, cDNA Synthesis, and q-PCR Profiling

Frozen leaf samples were pulverized in liquid nitrogen, and total RNA was extracted using a Trans Zol Up Plus RNA Kit (TransGen Biotech, Beijing, China). cDNAs were synthesized by the HiScriptIII RT SuperMix for qPCR (+gDNA wiper) Kit (Nanjing Vazyme Biotech Co.; Ltd.; Nanjing, China). The relative expression level of genes was analyzed by a ChamQ Universal SYBR qPCR Master Mix Kit (Nanjing Vazyme Biotech Co.; Ltd.; Nanjing, China) with a real-time qPCR system (QuantStudio 3, Thermofisher, Waltham, MA, USA). The primers used for q-PCR in this study are listed in Table S1. The sequences of genes were obtained from the genome of A. paniculata (NCBI, access number: ASM980555v1), and the primers were designed at primer BLAST of NCBI (https://www.ncbi.nlm.nih.gov/tools/primer-blast, accessed on 1 April 2023). The expression level of genes was normalized to the Actin gene (F: 5′-TAGAGAGTCCCCCGTATGCT-3′, R: 5′-CACAAGAATCCGACACGCAT-3′) by the method of 2−ΔΔCT [83].

4.6. Statistical Analysis

The experiments were conducted using a completely randomized design. There were four biological replications in each treatment. The difference in physiological parameters among N source treatments was evaluated by one-way ANOVA combined with Duncan’s new complex range method. The significance was considered as p < 0.05. The heatmap of log2FC was performed at the Omicshare platform (https://www.omicshare.com/tools/home, accessed on 11 May 2023), and NN treatment was used as a control. A Student’s t-test was applied to determine the significance of differences between two groups of independent samples. p < 0.05 was used to evaluate significant changes in metabolites.

5. Conclusions

In this study, we revealed the physiological and molecular mechanism by which N sources reprogrammed C and N metabolisms to potentially regulate andrographolide biosynthesis in A. paniculata. In comparison to NN, the AN, UN, and GN increased the production of assimilates and reduced the partitioning of C metabolic flow to the TCA cycle and downstream N assimilation. Additionally, the arginine and GABA metabolisms were enhanced, which replenished C and N for the TCA cycle and, therefore, could reduce the C flow from glycolysis to the TCA cycle. As a result, the synthetic pathway of andrographolide can compete for more C, promoting the synthesis and accumulation of andrographolide and its derivatives. The reprogramming of the C and N metabolisms also resulted in the synthesis of salicylic acid and ethylene, which have positive regulatory effects on andrographolide biosynthesis.

Supplementary Materials

The following supporting information can be downloaded at: https://www.mdpi.com/article/10.3390/ijms25073990/s1.

Author Contributions

C.Z. designed the research program. S.J., S.W. and Y.L. performed the experiments. C.Z. and S.J. analyzed the data, conducted the figures, and drafted the manuscript. S.W. revised the manuscript. All authors discussed the results and approved the submitted version. All authors have read and agreed to the published version of the manuscript.

Funding

We thank the National Natural Science Foundation of China (82260744), the Guangxi Natural Science Foundation of China (2022GXNSFAA035542, 2020GXNSFAA159025), the Guangxi Key Laboratory of Medicinal Resource Protection and Genetic Improvement (KL2020ZZ03, KL2020ZZ05), and the Scientific Research Funding Project of Guangxi Botanical Garden of Medicinal Plants (202003) for financial support.

Institutional Review Board Statement

Not applicable.

Informed Consent Statement

Not applicable.

Data Availability Statement

The original contributions presented in the study are included in the article/Supplementary Material; further inquiries can be directed to the corresponding author.

Conflicts of Interest

The authors declare that they have no known competing financial interests or personal relationships that could have appeared to influence the work reported in this paper.

Abbreviations

α-KGDH, α-ketoglutarate dehydrogenase; ABA, abscisic acid; ACAT, acetyl-CoA C-acetyltransferase; ACC, 1-aminocyclopropane-1-carboxylic acid; ACO, ACC aoxidase; ACO, aconitase; ADC, arginine decarboxylase; AGDI, agmatine deiminase; AOAT, acetylornithine aminotransferase; AODA, acetylornithine deacetylase; CMK, 4-diphosphocytidyl-2-C-methyl-D-erythritol kinase; CPS, copalyl diphosphate synthase; CS, citrate synthase; CuAO, copper amine oxidases; DXR, 1-deoxy-D-xylulose-5-phosphate reductoisomerase; DXS, 1-deoxy-D-xylulose-5-phosphate synthase; EIN3, ethylene-insensitive3; FRK, fructokinase; FPP, farnesyl pyrophosphate; GABA, γ-aminobutyric acid; GABA-T, GABA aminotransferase; GAD, Glutamate decarboxylase; GDH, glutamate dehydrogenase; GGPPS, geranylgeranyl diphosphate synthase; GOGAT, glutamine-2-oxoglutarate aminotransferase; GS, glutamine synthase; HDR, 4-hydroxy-3-methylbut-2-en-1-yl diphosphate reductase; HDS, (E)-4-hydroxy-3-methylbut-2-enyl-diphosphate synthase; HMGR, hydroxymethylglutaryl-CoA reductase; HMGS, hydroxymethylglutaryl-CoA synthase; HXK, hexokinase; ICDH, isocitrate dehydrogenase; IDI, isopentenyl-diphosphate delta-isomerase; JA, jasmonic acid; Jmax, maximum electron transport rate; MCT, 2-C-methyl-D-erythritol 4-phosphate cytidylyltransferase; MDD, diphosphomevalonate decarboxylase; MDH, malate dehydrogenase; MDS, 2-C-methyl-D-erythritol 2,4-cyclodiphosphate synthase; ME, malate enzyme; MeJA, methyl jasmonate; MEP, 2-C-Methyl-D-erythritol 4-phosphate pathway; MK, mevalonate kinase; MVA, Mevalonate pathway; NAGK, N-acetylglucosamine kinase; OAT, ornithine aminotransferase; PDH, pyruvate dehydrogenase; PEP, phosphoenolpyruvate; PEPC, PEP carboxylase; PEPCK, PEP carboxykinase; PFK, phosphofructokinase; PK, pyruvate kinase; PMK, phosphomevalonate kinase; SA, salicylic acid; SS, sucrose synthase; SPS, sucrose phosphate synthase; TCA, tricarboxylic acid; TPU, Triose phosphate utilization; UDPG, uridine diphosphate glucose; Vcmax, maximum carboxylation rate.

References

  1. Li, Y.; Kong, D.; Fu, Y.; Sussman, M.R.; Wu, H. The effect of developmental and environmental factors on secondary metabolites in medicinal plants. Plant Physiol. Biochem. 2020, 148, 80–89. [Google Scholar] [CrossRef] [PubMed]
  2. Sakakibara, H.; Takei, K.; Hirose, N. Interactions between nitrogen and cytokinin in the regulation of metabolism and development. Trends Plant Sci. 2006, 11, 440–448. [Google Scholar] [CrossRef]
  3. Nchu, F.; Matanzima, Y.; Laubscher, C.P. Prospects of N fertilization in medicinal plants cultivation. In Nitrogen in Agriculture—Updates; Amanullah, A., Fahad, S., Eds.; IntechOpen: London, UK, 2018; pp. 209–222. [Google Scholar] [CrossRef]
  4. Ye, J.Y.; Tian, W.H.; Jin, C.W. Nitrogen in plants: From nutrition to the modulation of abiotic stress adaptation. Stress Biol. 2022, 2, 4. [Google Scholar] [CrossRef]
  5. Farzadfar, S.; Knight, J.D.; Congreves, K.A. Soil organic nitrogen: An overlooked but potentially significant contribution to crop nutrition. Plant Soil 2021, 462, 7–23. [Google Scholar] [CrossRef]
  6. Li, X.; Yan, X.F.; Liu, J.F. Effect of nitrogen forms on berberine, jatrorrhizine and palmatine content in corktree seedlings. Acta Ecol. Sin. 2005, 25, 2159–2164. [Google Scholar] [CrossRef]
  7. Sun, Y.; Zhang, T.; Xu, X.; Yang, Y.; Tong, H.; Mur, L.A.J.; Yuan, H. Transcriptomic characterization of nitrate-enhanced stevioside glycoside synthesis in stevia (Stevia rebaudiana Bertoni). Int. J. Mol. Sci. 2021, 22, 8549. [Google Scholar] [CrossRef]
  8. Biesiada, A.; Woloszczak, E.; Sokolletowska, A.; Kucharska, A.Z.; Nawirskaolszanska, A. The effect of nitrogen form and dose on yield, chemical composition and antioxidant activity of stinging nettle (Urtica dioica L.). Herba Pol. 2009, 55, 84–93. [Google Scholar]
  9. Sui, L.; Wang, K.; Yi, J.; Ta, H.; Wei, L.; Wei, H. Effect of different nitrogen forms on growth and quality of Perilla Frutescens (L.) Britt. Chin. J. Soil Sci. 2018, 49, 667–672. [Google Scholar] [CrossRef]
  10. Zhong, C.; Jian, S.F.; Chen, D.L.; Huang, X.J.; Miao, J.H. Organic nitrogen sources promote andrographolide biosynthesis by reducing nitrogen metabolism and increasing carbon accumulation in Andrographis paniculata. Plant Physiol. Biochem. 2021, 164, 82–91. [Google Scholar] [CrossRef]
  11. Kováčik, J.; Klejdus, B. Induction of phenolic metabolites and physiological changes in chamomile plants in relation to nitrogen nutrition. Food Chem. 2014, 142, 334–341. [Google Scholar] [CrossRef]
  12. Bruce, S.O.; Onyegbule, F.A. Biosynthesis of natural products. In Bioactive Compounds—Biosynthesis, Characterization and Applications; Zepka, L.Q., Nascimento, T.C.d., Jacob-Lopes, E., Eds.; IntechOpen: London, UK, 2021. [Google Scholar] [CrossRef]
  13. Chen, Y.; Bai, Y.; Zhang, Z.; Zhang, Y.; Jiang, Y.; Wang, S.; Wang, Y.; Sun, Z. Transcriptomics and metabolomics reveal the primary and secondary metabolism changes in Glycyrrhiza uralensis with different forms of nitrogen utilization. Front. Plant Sci. 2023, 14, 1229253. [Google Scholar] [CrossRef]
  14. Feng, H.; Fan, X.; Miller, A.J.; Xu, G. Plant nitrogen uptake and assimilation: Regulation of cellular pH homeostasis. J. Exp. Bot. 2020, 71, 4380–4392. [Google Scholar] [CrossRef]
  15. Hachiya, T.; Inaba, J.; Wakazaki, M.; Sato, M.; Toyooka, K.; Miyagi, A.; Kawai-Yamada, M.; Sugiura, D.; Nakagawa, T.; Kiba, T.; et al. Excessive ammonium assimilation by plastidic glutamine synthetase causes ammonium toxicity in Arabidopsis thaliana. Nat. Commun. 2021, 12, 4944. [Google Scholar] [CrossRef]
  16. Sakano, K. Metabolic regulation of pH in plant cells: Role of cytoplasmic pH in defense reaction and secondary metabolism. Int. Rev. Cytol. 2001, 206, 1–44. [Google Scholar] [CrossRef]
  17. Fritz, C.; Palacios-Rojas, N.; Feil, R.; Stitt, M. Regulation of secondary metabolism by the carbon–nitrogenstatus in tobacco: Nitrate inhibits large sectors of phenylpropanoid metabolism. Plant J. 2006, 46, 533–548. [Google Scholar] [CrossRef]
  18. Xu, X.J.; Li, Q.Y.; Song, X.H.; Shen, Q.R.; Dong, C.X. Dynamic regulation of nitrogen and organic acid metabolism of cherry tomato fruit as affected by different nitrogen forms. Pedosphere 2012, 22, 67–78. [Google Scholar] [CrossRef]
  19. Huang, H.; Yao, Q.; Xia, E.; Gao, L. Metabolomics and transcriptomics analyses reveal nitrogen influences on the accumulation of flavonoids and amino acids in young shoots of tea plant (Camellia sinensis L.) associated with tea flavor. J. Agric. Food Chem. 2018, 66, 9828–9838. [Google Scholar] [CrossRef]
  20. Coleto, I.; Vega-Mas, I.; Glauser, G.; González-Moro, M.B.; Marino, D.; Ariz, I. New insights on Arabidopsis thaliana root adaption to ammonium nutrition by the use of a quantitative proteomic approach. Int. J. Mol. Sci. 2019, 20, 814. [Google Scholar] [CrossRef]
  21. Sun, Y.; Hou, M.; Mur, L.A.J.; Yang, Y.; Zhang, T.; Xu, X.; Huang, S.; Tong, H. Nitrogen drives plant growth to the detriment of leaf sugar and steviol glycosides metabolisms in stevia (Stevia rebaudiana Bertoni). Plant Physiol. Biochem. 2019, 141, 240–249. [Google Scholar] [CrossRef]
  22. Ibrahim, M.H.; Jaafar, H.Z. The relationship of nitrogen and C/N ratio with secondary metabolites levels and antioxidant activities in three varieties of Malaysian kacip Fatimah (Labisia pumila Blume). Molecules 2011, 16, 5514–5526. [Google Scholar] [CrossRef]
  23. Ibrahim, M.H.; Jaafar, H.Z. Involvement of carbohydrate, protein and phenylanine ammonia lyase in up-regulation of secondary metabolites in Labisia pumila under various CO2 and N2 levels. Molecules 2011, 16, 4172–4190. [Google Scholar] [CrossRef]
  24. Morkunas, I.; Ratajczak, L. The role of sugar signaling in plant defense responses against fungal pathogens. Acta Physiol. Plant. 2014, 36, 1607–1619. [Google Scholar] [CrossRef]
  25. Jian, S.F.; Huang, X.J.; Yang, X.N.; Zhong, C.; Miao, J.H. Sulfur regulates the trade-off between growth and andrographolide accumulation via nitrogen metabolism in Andrographis paniculata. Front. Plant Sci. 2021, 12, 687954. [Google Scholar] [CrossRef]
  26. Sun, J.; Guo, H.; Liu, M.; Chen, M.; Zhu, M.; Liu, D.; Tao, J. Histology and transcriptomic profiling reveal the dynamics of seed coat and endosperm formation in tree peony (Paeonia ostii). Hortic. Res. 2022, 9, uhac106. [Google Scholar] [CrossRef]
  27. Subramanian, R.; Asmawi, M.Z.; Sadikun, A. A bitter plant with a sweet future? A comprehensive review of an oriental medicinal plant: Andrographis paniculata. Phytochem. Rev. 2012, 11, 39–75. [Google Scholar] [CrossRef]
  28. Talei, D.; Valdiani, A.; Rafii, M.Y.; Maziah, M. Proteomic analysis of the salt-responsive leaf and root proteins in the anticancer plant Andrographis paniculata Nees. PLoS ONE 2014, 9, e112907. [Google Scholar] [CrossRef]
  29. Valdiani, A.; Talei, D.; Tan, S.G.; Kadir, M.A.; Maziah, M.; Rafii, M.Y.; Sagineedu, S.R. A classical genetic solution to enhance the biosynthesis of anticancer phytochemicals in Andrographis paniculata Nees. PLoS ONE 2014, 9, e87034. [Google Scholar] [CrossRef]
  30. Shi, T.H.; Huang, Y.L.; Chen, C.C.; Pi, W.C.; Hsu, Y.L.; Lo, L.C.; Chen, W.Y.; Fu, S.L.; Lin, C.H. Andrographolide and its fluorescent derivative inhibit the main proteases of 2019-nCoV and SARS-CoV through covalent linkage. Biochem. Biophys. Res. Commun. 2020, 533, 467–473. [Google Scholar] [CrossRef]
  31. Intharuksa, A.; Arunotayanun, W.; Yooin, W.; Sirisa-Ard, P. A comprehensive review of Andrographis paniculata (Burm. f.) Nees and its constituents as potential lead compounds for COVID-19 drug discovery. Molecules 2022, 27, 4479. [Google Scholar] [CrossRef]
  32. Tanuja; Parani, M. Whole transcriptome analysis identifies full-length genes for neoandrographolide biosynthesis from Andrographis alata, an alternate source for antiviral compounds. Gene 2023, 851, 146981. [Google Scholar] [CrossRef]
  33. Sun, W.; Leng, L.; Yin, Q.; Xu, M.; Huang, M.; Xu, Z.; Zhang, Y.; Yao, H.; Wang, C.; Xiong, C.; et al. The genome of the medicinal plant Andrographis paniculata provides insight into the biosynthesis of the bioactive diterpenoid neoandrographolide. Plant J. 2019, 97, 841–857. [Google Scholar] [CrossRef]
  34. Liang, Y.; Chen, S.; Wei, K.; Yang, Z.; Duan, S.; Du, Y.; Qu, P.; Miao, J.; Chen, W.; Dong, Y. Chromosome level genome assembly of Andrographis paniculata. Front. Genet. 2020, 11, 701. [Google Scholar] [CrossRef]
  35. Sharma, S.N.; Jha, Z.; Sinha, R.K.; Geda, A.K. Jasmonate-induced biosynthesis of andrographolide in Andrographis paniculata. Physiol. Plant. 2015, 153, 221–229. [Google Scholar] [CrossRef]
  36. Srivastava, N.; Akhila, A. Biosynthesis of andrographolide in Andrographis paniculata. Phytochemistry 2010, 71, 1298–1304. [Google Scholar] [CrossRef]
  37. Sun, M.; Xu, S.; Li, J.; Gu, Y.; Mei, Y.; Zhang, W.; Zhou, F.; Wang, J. Transcriptome analysis and discovery of genes related to andrographolide synthesis of Andrographis paniculata under UV-C treatment. J. South. Agric. 2022, 53, 618–627. [Google Scholar] [CrossRef]
  38. Garg, A.; Agrawal, L.; Misra, R.C.; Sharma, S.; Ghosh, S. Andrographis paniculata transcriptome provides molecular insights into tissue-specific accumulation of medicinal diterpenes. BMC Genom. 2015, 16, 659. [Google Scholar] [CrossRef]
  39. Li, X.; Zhang, L.; Ahammed, G.J.; Li, Z.X.; Wei, J.P.; Shen, C.; Yan, P.; Zhang, L.P.; Han, W.Y. Stimulation in primary and secondary metabolism by elevated carbon dioxide alters green tea quality in Camellia sinensis L. Sci. Rep. 2017, 7, 7937. [Google Scholar] [CrossRef]
  40. He, Z.; Webster, S.; He, S.Y. Growth-defense trade-offs in plants. Curr. Biol. 2022, 32, R634–R639. [Google Scholar] [CrossRef]
  41. Larbat, R.; Robin, C.; Lillo, C.; Drengstig, T.; Ruoff, P. Modeling the diversion of primary carbon flux into secondary metabolism under variable nitrate and light/dark conditions. J. Theor. Biol. 2016, 402, 144–157. [Google Scholar] [CrossRef]
  42. Si, C.; Shi, C.; Liu, H.; Zhan, X.; Liu, Y. Effects of nitrogen forms on carbohydrate metabolism and storage-root formation of sweet potato. J. Plant Nutr. Soil Sci. 2018, 181, 419–428. [Google Scholar] [CrossRef]
  43. Zhang, L.; Wang, C.; Jia, R.; Yang, N.; Jin, L.; Zhu, L.; Ma, B.; Yao, Y.X.; Ma, F.; Li, M. Malate metabolism mediated by the cytoplasmic malate dehydrogenase gene MdcyMDH affects sucrose synthesis in apple fruit. Hortic. Res. 2022, 9, uhac194. [Google Scholar] [CrossRef]
  44. Nunes-Nesi, A.; Fernie, A.R.; Stitt, M. Metabolic and signaling aspects underpinning the regulation of plant carbon nitrogen interactions. Mol. Plant 2010, 3, 973–996. [Google Scholar] [CrossRef]
  45. Foyer, C.H.; Noctor, G.; Hodges, M. Respiration and nitrogen assimilation: Targeting mitochondria-associated metabolism as a means to enhance nitrogen use efficiency. J. Exp. Bot. 2011, 62, 1467–1482. [Google Scholar] [CrossRef]
  46. Medeiros, D.B.; Aarabi, F.; Rivas, F.J.M.; Fernie, A.R. The knowns and unknowns of intercellular partitioning of carbon and nitrogen, with focus on the organic acid-mediated interplay between mitochondrion and chloroplast. J. Plant Physiol. 2021, 266, 153521. [Google Scholar] [CrossRef]
  47. Vega-Mas, I.; Cukier, C.; Coleto, I.; González-Murua, C.; Limami, A.M.; González-Moro, M.B.; Marino, D. Isotopic labelling reveals the efficient adaptation of wheat root TCA cycle flux modes to match carbon demand under ammonium nutrition. Sci. Rep. 2019, 9, 8925. [Google Scholar] [CrossRef]
  48. Nomura, M.; Mai, H.T.; Fujii, M.; Hata, S.; Izui, K.; Tajima, S. Phosphoenolpyruvate carboxylase plays a crucial role in limiting nitrogen fixation in Lotus japonicus nodules. Plant Cell Physiol. 2006, 47, 613–621. [Google Scholar] [CrossRef]
  49. Foyer, C.H.; Parry, M.; Noctor, G. Markers and signals associated with nitrogen assimilation in higher plants. J. Exp. Bot. 2003, 54, 585–593. [Google Scholar] [CrossRef]
  50. Miflin, B.J.; Habash, D.Z. The role of glutamine synthetase and glutamate dehydrogenase in nitrogen assimilation and possibilities for improvement in the nitrogen utilization of crops. J. Exp. Bot. 2002, 53, 979–987. [Google Scholar] [CrossRef]
  51. Huergo, L.F.; Chandra, G.; Merrick, M. PII signal transduction proteins: Nitrogen regulation and beyond. FEMS Microbiol. Rev. 2013, 37, 251–283. [Google Scholar] [CrossRef]
  52. Gent, L.; Forde, B.G. How do plants sense their nitrogen status? J. Exp. Bot. 2017, 68, 2531–2539. [Google Scholar] [CrossRef]
  53. Chellamuthu, V.R.; Ermilova, E.; Lapina, T.; Lüddecke, J.; Minaeva, E.; Herrmann, C.; Hartmann, M.D.; Forchhammer, K. A widespread glutamine-sensing mechanism in the plant kingdom. Cell 2014, 159, 1188–1199. [Google Scholar] [CrossRef]
  54. Liu, C.; Xue, Z.; Tang, D.; Shen, Y.; Shi, W.; Ren, L.; Du, G.; Li, Y.; Cheng, Z. Ornithine δ-aminotransferase is critical for floret development and seed setting through mediating nitrogen reutilization in rice. Plant J. 2018, 96, 842–854. [Google Scholar] [CrossRef]
  55. Khan, M.I.R.; Jalil, S.U.; Chopra, P.; Chhillar, H.; Ferrante, A.; Khan, N.A.; Ansari, M.I. Role of GABA in plant growth, development and senescence. Plant Gene 2021, 26, 100283. [Google Scholar] [CrossRef]
  56. Wu, Q.; Su, N.; Huang, X.; Cui, J.; Shabala, L.; Zhou, M.; Yu, M.; Shabala, S. Hypoxia-induced increase in GABA content is essential for restoration of membrane potential and preventing ROS-induced disturbance to ion homeostasis. Plant Commun. 2021, 2, 100188. [Google Scholar] [CrossRef]
  57. Ramesh, S.A.; Tyerman, S.D.; Gilliham, M.; Xu, B. γ-Aminobutyric acid (GABA) signalling in plants. Cell. Mol. Life Sci. 2017, 74, 1577–1603. [Google Scholar] [CrossRef]
  58. Ma, W.; Xu, L.; Gao, S.; Lyu, X.; Cao, X.; Yao, Y. Melatonin alters the secondary metabolite profile of grape berry skin by promoting VvMYB14-mediated ethylene biosynthesis. Hortic. Res. 2021, 8, 43. [Google Scholar] [CrossRef]
  59. Guan, R.; Xu, S.; Lu, Z.; Su, L.; Zhang, L.; Sun, W.; Zhang, Y.; Jiang, C.; Liu, Z.; Duan, L.; et al. Genomic characterization of bZIP transcription factors related to andrographolide biosynthesis in Andrographis paniculata. Int. J. Biol. Macromol. 2022, 223, 1619–1631. [Google Scholar] [CrossRef]
  60. Nandy, S.; Das, T.; Dey, A. Role of jasmonic acid and salicylic acid signaling in secondary metabolite production. In Jasmonates and Salicylates Signaling in Plants. Signaling and Communication in Plants; Aftab, T., Yusuf, M., Eds.; Springer: Cham, Switzerland, 2021. [Google Scholar] [CrossRef]
  61. Ali, B. Salicylic acid: An efficient elicitor of secondary metabolite production in plants. Biocatal. Agric. Biotechnol. 2021, 31, 101884. [Google Scholar] [CrossRef]
  62. Ding, M.; Zhang, B.; Zhang, S.; Hao, R.R.; Xia, Y.; Ma, P.; Dong, J. The SmNPR4-SmTGA5 module regulates SA-mediated phenolic acid biosynthesis in Salvia miltiorrhiza hairy roots. Hortic. Res. 2023, 10, uhad066. [Google Scholar] [CrossRef]
  63. Hasanuzzaman, M.; Nahar, K.; Bhuiyan, T.F.; Anee, T.I.; Inafuku, M.; Oku, H.; Fujita, M. Salicylic acid: An all-rounder in regulating abiotic stress responses in plants. In Phytohormones—Signaling Mechanisms and Crosstalk in Plant Development and Stress Responses; El-Esawi, M., Ed.; InTech: Rijeka, Croatia, 2017. [Google Scholar] [CrossRef]
  64. Ding, S.; Shao, X.; Li, J.; Ahammed, G.J.; Yao, Y.; Ding, J.; Hu, Z.; Yu, J.; Shi, K. Nitrogen forms and metabolism affect plant defence to foliar and root pathogens in tomato. Plant Cell Environ. 2021, 44, 1596–1610. [Google Scholar] [CrossRef]
  65. Fang, R.; Zhao, H.; Liao, Y.; Tang, C.; Wu, F.; Zhu, Y.; Pang, Y.; Lu, G.; Wang, X.; Yang, R.; et al. Dual regulating effects of ethylene on the formation of plant secondary metabolites. Chin. Bull. Bot. 2014, 49, 626–639. [Google Scholar] [CrossRef]
  66. Baharudin, N.F.; Osman, N.I. Plant development, stress responses, and secondary metabolism under ethylene regulation. Plant Stress 2023, 7, 100146. [Google Scholar] [CrossRef]
  67. Pérez-Llorca, M.; Pollmann, S.; Müller, M. Ethylene and jasmonates signaling network mediating secondary metabolites under abiotic stress. Int. J. Mol. Sci. 2023, 24, 5990. [Google Scholar] [CrossRef] [PubMed]
  68. Jian, S.; Liao, Q.; Song, H.; Liu, Q.; Lepo, J.E.; Guan, C.; Zhang, J.; Ismail, A.M.; Zhang, Z. NRT1.1-related NH4+ toxicity is associated with a disturbed balance between NH4+ uptake and assimilation. Plant Physiol. 2018, 178, 1473–1488. [Google Scholar] [CrossRef] [PubMed]
  69. Chen, H.; Zhang, Q.; Wang, X.; Zhang, J.; Ismail, A.M.; Zhang, Z. Nitrogen form-mediated ethylene signal regulates root-to-shoot K+ translocation via NRT1.5. Plant Cell Environ. 2021, 44, 3576–3588. [Google Scholar] [CrossRef] [PubMed]
  70. Ma, B.; Ma, T.; Xian, W.; Hu, B.; Chu, C. Interplay between ethylene and nitrogen nutrition: How ethylene orchestrates nitrogen responses in plants. J. Integr. Plant Biol. 2023, 65, 399–407. [Google Scholar] [CrossRef]
  71. Wang, Y.; Zhao, H.; Liu, C.; Cui, G.; Qu, L.; Bao, M.; Wang, J.; Chan, Z.; Wang, Y. Integrating physiological and metabolites analysis to identify ethylene involvement in petal senescence in Tulipa gesneriana. Plant Physiol. Biochem. 2020, 149, 121–131. [Google Scholar] [CrossRef] [PubMed]
  72. Liu, J.; Liu, Y.; Wang, Y.; Zhang, Z.H.; Zu, Y.G.; Efferth, T.; Tang, Z.H. The combined effects of ethylene and MeJA on metabolic profiling of phenolic compounds in Catharanthus roseus revealed by metabolomics analysis. Front. Physiol. 2016, 7, 217. [Google Scholar] [CrossRef] [PubMed]
  73. De Boer, K.; Tilleman, S.; Pauwels, L.; Vanden Bossche, R.; De Sutter, V.; Vanderhaeghen, R.; Hilson, P.; Hamill, J.D.; Goossens, A. APETALA2/ETHYLENE RESPONSE FACTOR and basic helix-loop-helix tobacco transcription factors cooperatively mediate jasmonate-elicited nicotine biosynthesis. Plant J. 2011, 66, 1053–1065. [Google Scholar] [CrossRef]
  74. Farquhar, G.D.; von Caemmerer, S.; Berry, J.A. A biochemical model of photosynthetic CO2 assimilation in leaves of C3 species. Planta 1980, 149, 78–90. [Google Scholar] [CrossRef]
  75. Long, S.P.; Bernacchi, C.J. Gas exchange measurements, what can they tell us about the underlying limitations to photosynthesis? Procedures and sources of error. J. Exp. Bot. 2003, 54, 2393–2401. [Google Scholar] [CrossRef] [PubMed]
  76. Santoni, S.; Bonifacio, E.; Zanini, E. Indophenol blue colorimetric method for measuring cation exchange capacity in sandy soils. Commun. Soil Sci. Plant Anal. 2001, 32, 2519–2530. [Google Scholar] [CrossRef]
  77. Porra, R.J.; Thompson, W.A.; Kriedemann, P.E. Determination of accurate extinction coefficients and simultaneous equations for assaying chlorophylls a and b extracted with four different solvents: Verification of the concentration of chlorophyll standards by atomic absorption spectroscopy. Biochim. Biophys. Acta (BBA)-Bioenerg. 1989, 975, 384–394. [Google Scholar] [CrossRef]
  78. Zhong, C.; Cao, X.; Hu, J.; Zhu, L.; Zhang, J.; Huang, J.; Jin, Q. Nitrogen metabolism in adaptation of photosynthesis to water stress in rice grown under different nitrogen levels. Front. Plant Sci. 2017, 8, 1079. [Google Scholar] [CrossRef]
  79. Kulichikhin, K.Y.; Chirkova, T.V.; Fagerstedt, K.V. Activity of biochemical pH-stat enzymes in cereal root tips under oxygen deficiency. Russ. J. Plant Physiol. 2009, 56, 377–388. [Google Scholar] [CrossRef]
  80. Deewatthanawong, R.; Nock, J.F.; Watkins, C.B. γ-Aminobutyric acid (GABA) accumulation in four strawberry cultivars in response to elevated CO2 storage. Postharvest Biol. Technol. 2010, 57, 92–96. [Google Scholar] [CrossRef]
  81. Zhong, C.; Bai, Z.G.; Zhu, L.F.; Zhang, J.H.; Zhu, C.Q.; Huang, J.L.; Jin, Q.Y.; Cao, X.C. Nitrogen-mediated alleviation of photosynthetic inhibition under moderate water deficit stress in rice (Oryza sativa L.). Environ. Exp. Bot. 2019, 157, 269–282. [Google Scholar] [CrossRef]
  82. Walker, R.P.; Chen, Z.H.; Acheson, R.M.; Leegood, R.C. Effects of phosphorylation on phosphoenolpyruvate carboxykinase from the C4 plant Guinea grass. Plant Physiol. 2002, 128, 165–172. [Google Scholar] [CrossRef]
  83. Livak, K.J.; Schmittgen, T.D. Analysis of relative gene expression data using real-time quantitative PCR and the 2−ΔΔCT method. Methods 2001, 25, 402–408. [Google Scholar] [CrossRef]
Figure 1. Analysis of the biosynthetic pathway of active diterpene lactones in A. paniculata. (A) The biosynthetic pathway of active diterpene lactones in A. paniculata. Confirmed genes in the synthetic pathways were labeled brown and italic. Green arrows indicate speculative synthetic pathways. Data in boxes indicate log2FC values of AN, UN, and GN in relation to NN, respectively (n = 3). (B) Heatmap of the expression of genes in the synthetic pathways of andrographolide components. The data were normalized. NN—nitrate nitrogen; AN—ammonium nitrogen; UN—urea nitrogen; GN—glycine nitrogen.
Ijms 25 03990 g001
Figure 2. Overview of C and N metabolisms affected by N sources. Heatmaps show the values of log2FC. NN was used as a control. Enzymes in the pathways were labeled blue. NN—nitrate nitrogen; AN—ammonium nitrogen; UN—urea nitrogen; GN—glycine nitrogen.
Ijms 25 03990 g002
Figure 3. Activities of enzymes in C metabolism. (A) Sucrose synthase activity; (B) Sucrose phosphate synthase activity; (C) Hexokinase activity; (D) Fructokinase activity; (E) Phosphofructokinase activity; (F) Glyceraldehyde-3-phosphate dehydrogenase activity; (G) Pyruvate kinase activity; (H) Pyruvate dehydrogenase activity; (I) PEP carboxylase activity; (J) PEP carboxykinase activity; (K) Malate dehydrogenase activity; (L) Malate enzyme activity; (M) Citrate synthase activity; (N) Aconitase activity; (O) Isocitrate dehydrogenase activity; (P) α-ketoglutarate dehydrogenase activity. Data were represented by means ± SD (n = 3 or 4). Different letters on bars indicate significant differences at p < 0.05 level according to one-way ANOVA combined with Duncan’s multiple range method. NN—nitrate nitrogen; AN—ammonium nitrogen; UN—urea nitrogen; GN—glycine nitrogen.
Ijms 25 03990 g003
Figure 4. Activities of enzymes in N metabolism. (A) Glutamine synthase activity; (B) Glutamine oxoglutarate aminotransferase activity; (C) NAD-dependent glutamate dehydrogenase activity; (D) NADH-dependent glutamate dehydrogenase activity; (E) Glutamate decarboxylase activity; (F) GABA aminotransferase activity. Data were represented by means ± SD (n = 3 or 4). Different letters on bars indicate significant differences at p < 0.05 level according to one-way ANOVA combined with Duncan’s multiple range method. NN—nitrate nitrogen; AN—ammonium nitrogen; UN—urea nitrogen; GN—glycine nitrogen.
Ijms 25 03990 g004
Figure 5. Arginine metabolism in response to N sources. (A) Arginine metabolic pathway. (B) Relative expression level of genes in arginine metabolism. (C) Relative levels of intermediate metabolites in arginine metabolism. The data were normalized to these in the NN treatment. Data were represented by means ± SD (n = 3). Different letters on bars indicate significant differences at p < 0.05 level according to one-way ANOVA combined with Duncan’s multiple range method. NN—nitrate nitrogen; AN—ammonium nitrogen; UN—urea nitrogen; GN—glycine nitrogen.
Ijms 25 03990 g005
Figure 6. Phytohormone levels under different N source conditions. (A) Relative level of jasmonic acid. (B) Relative level of methyl jasmonate. (C) Relative level of abscisic acid. (D) Relative level of salicylic acid. (E) Relative level of ethephon. (F) Relative level of ACC. The data were normalized to NN and represented as mean ± SD (n = 3). Different letters on bars indicate significant differences at p < 0.05 according to one-way ANOVA and Duncan’s multiple range method. NN—nitrate nitrogen; AN—ammonium nitrogen; UN—urea nitrogen; GN—glycine nitrogen.
Ijms 25 03990 g006
Disclaimer/Publisher’s Note: The statements, opinions and data contained in all publications are solely those of the individual author(s) and contributor(s) and not of MDPI and/or the editor(s). MDPI and/or the editor(s) disclaim responsibility for any injury to people or property resulting from any ideas, methods, instructions or products referred to in the content.

