


Unlocking the Transcriptional Control of NCAPG in Bovine Myoblasts: CREB1 and MYOD1 as Key Players

 , , and
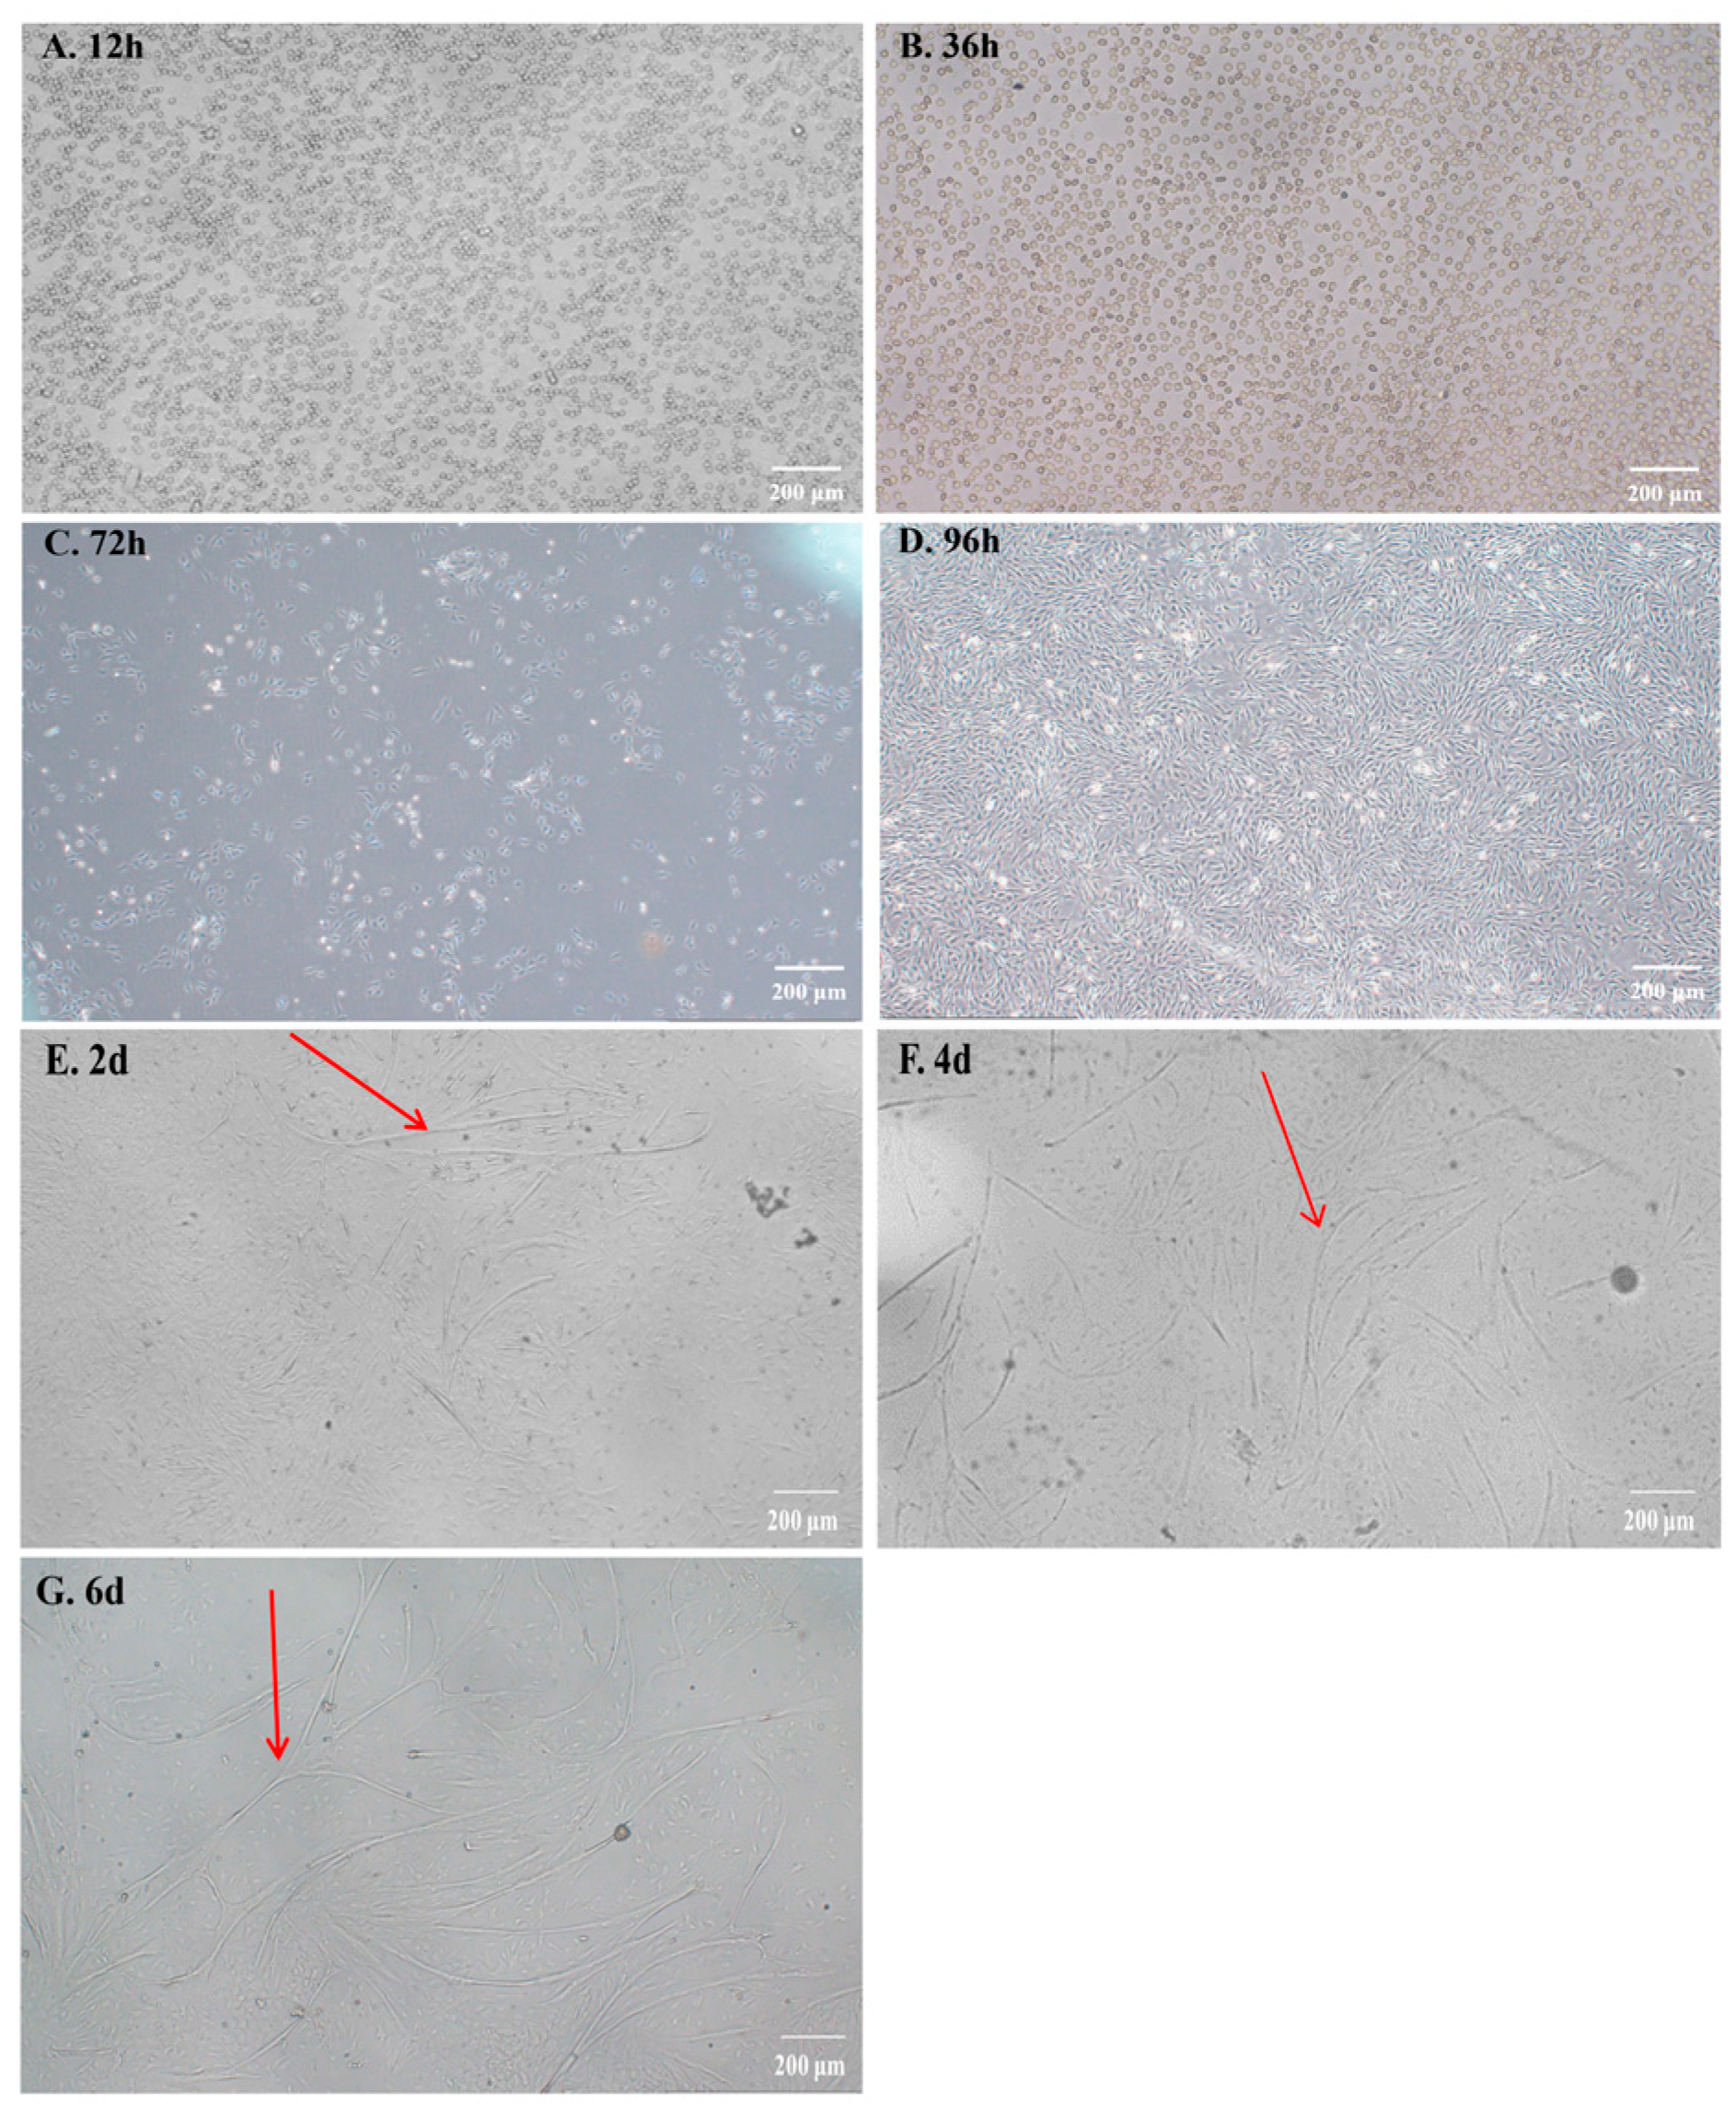
Abstract
1. Introduction
2. Results
2.1. The Isolation and Culture of Bovine Myoblasts
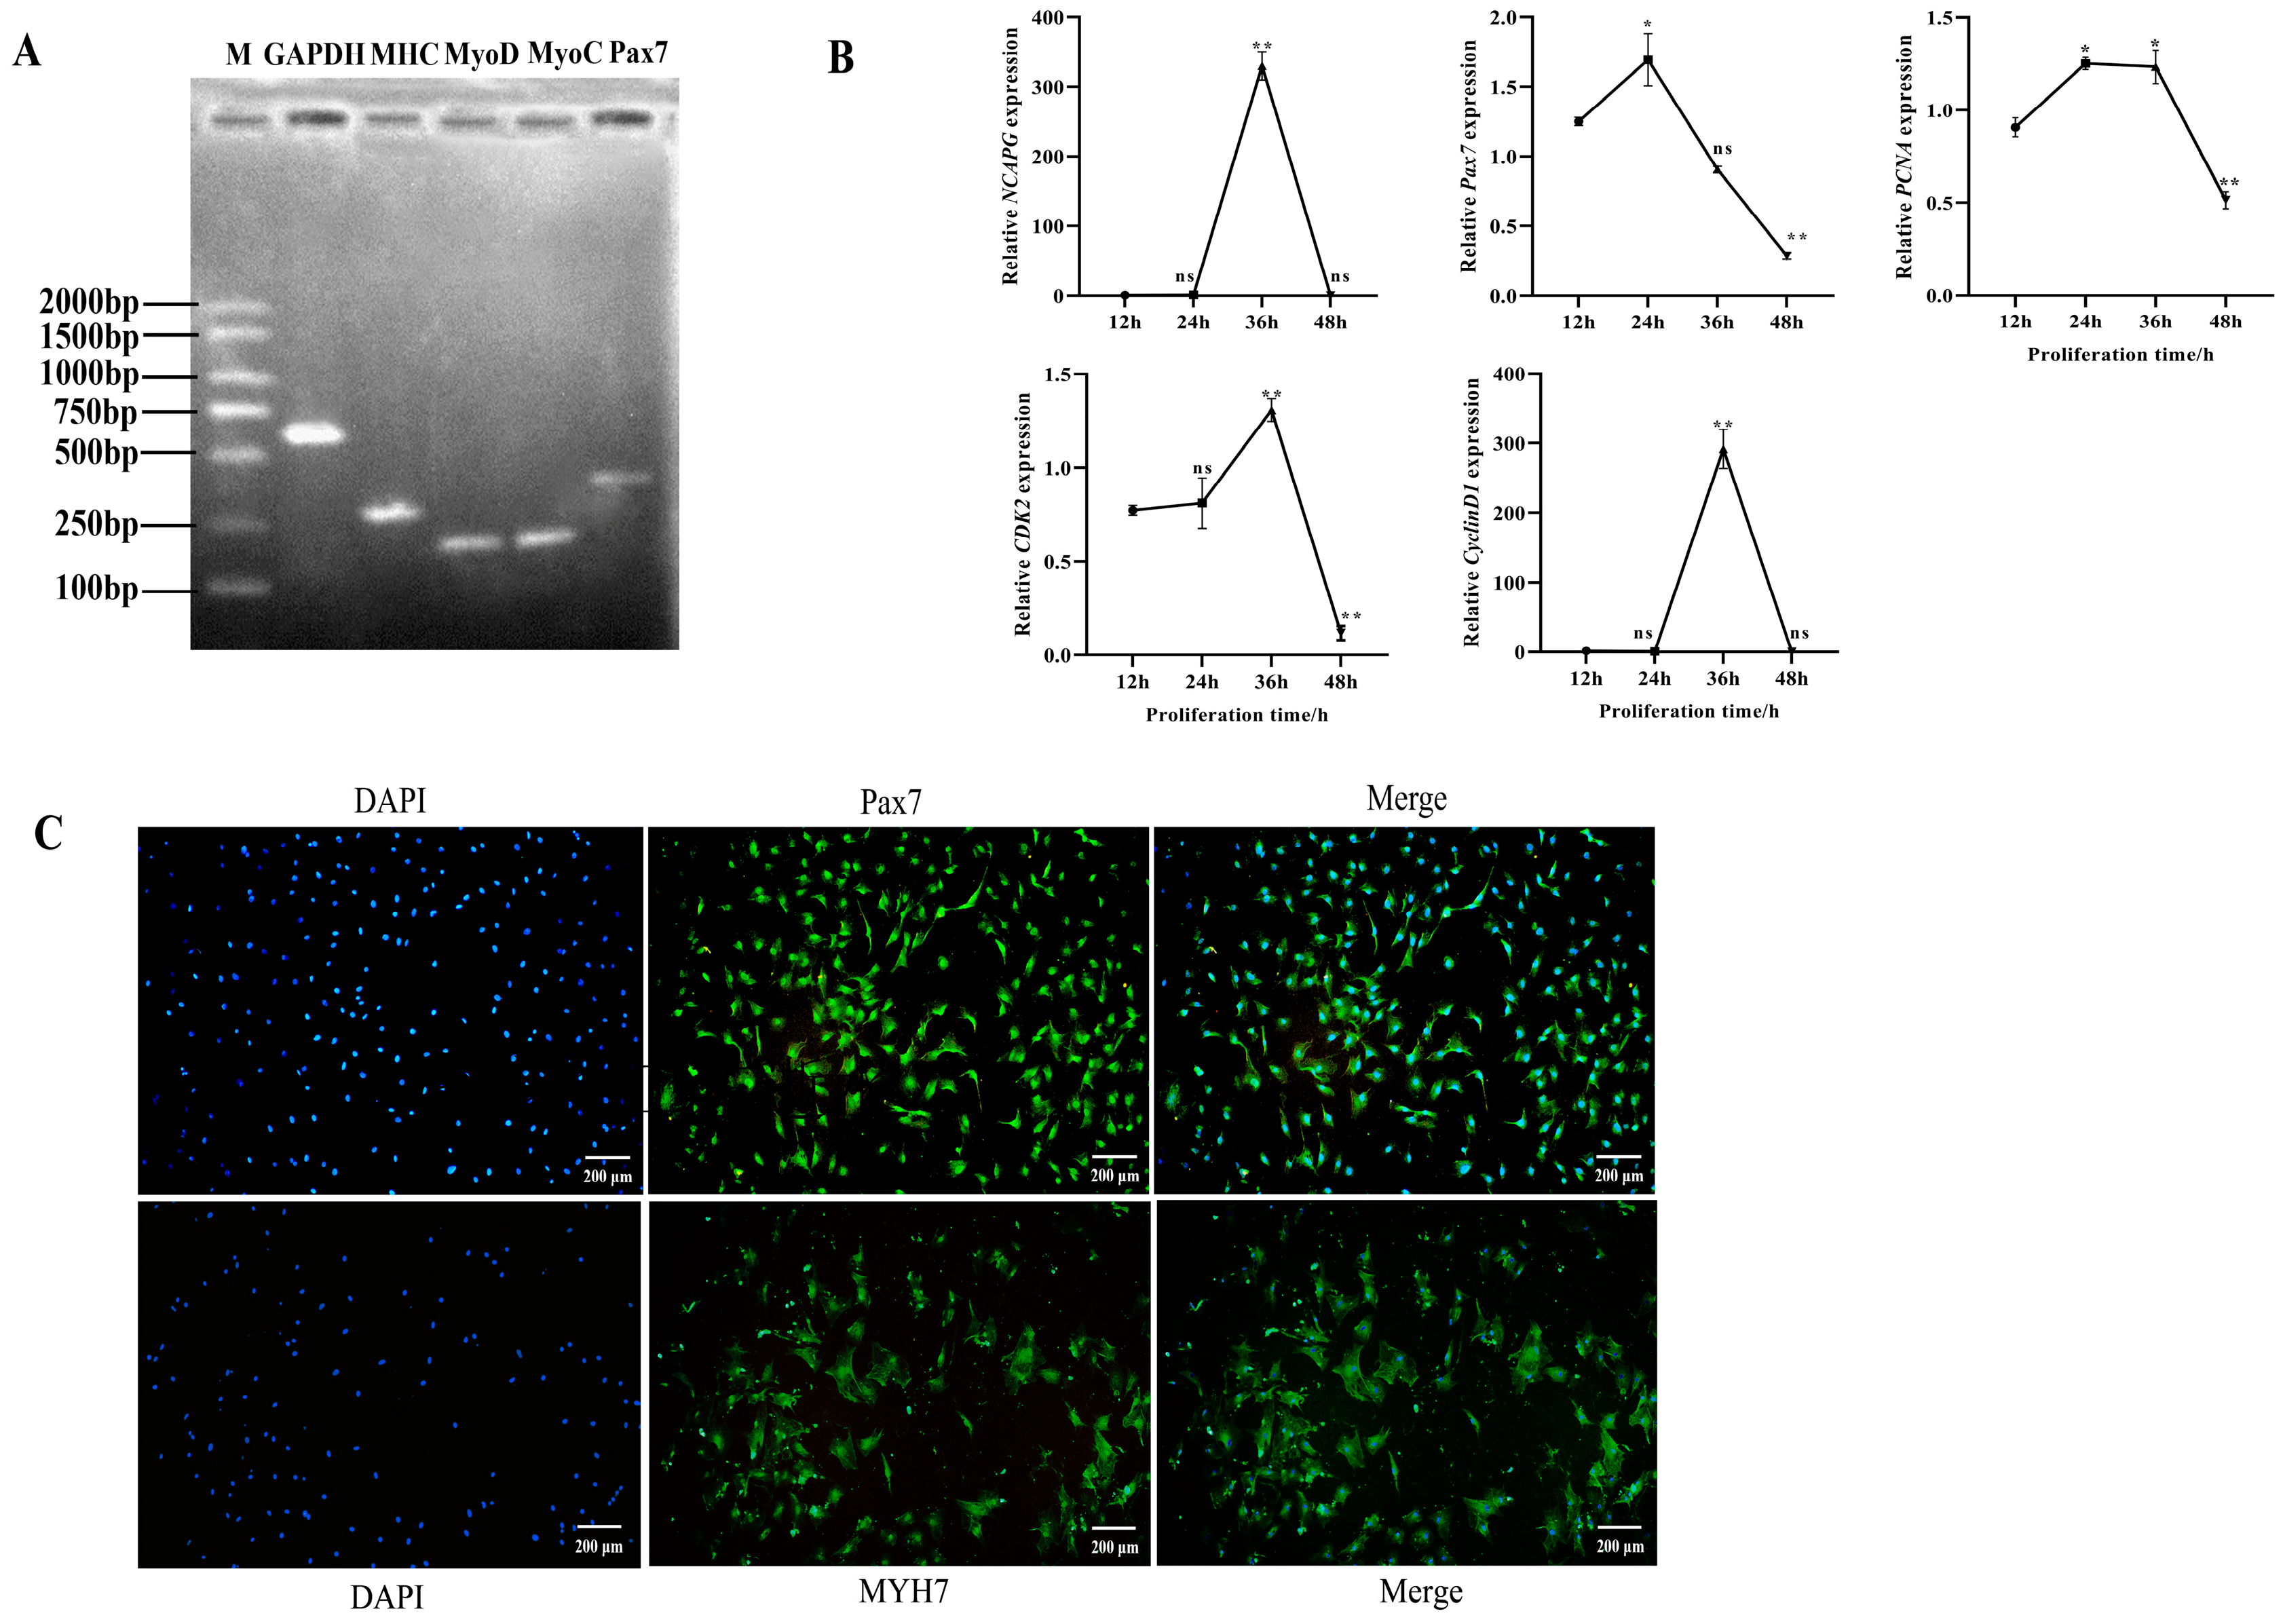
2.2. Identification of Bovine Myoblasts
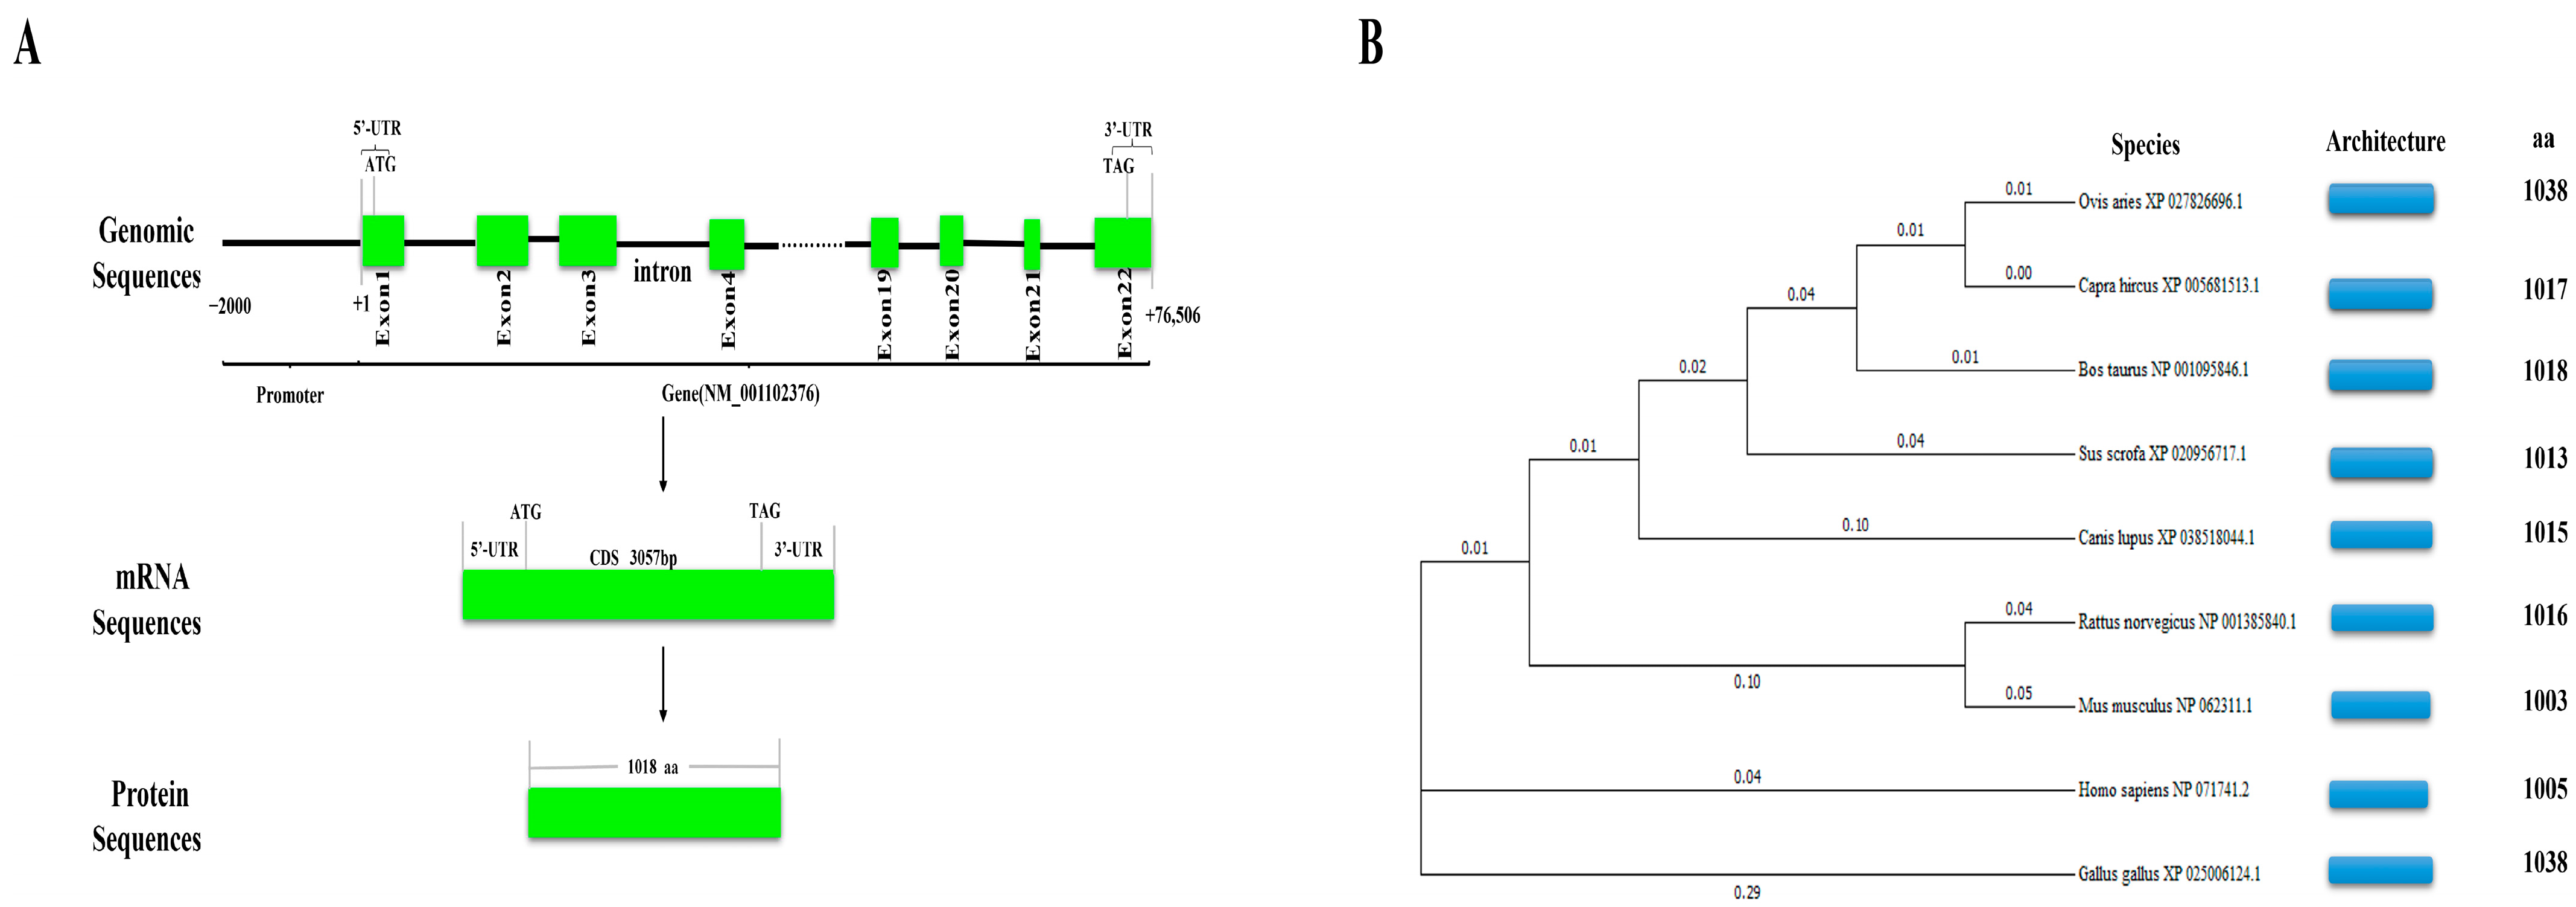
2.3. Structure Analysis of Bovine NCAPG and Phylogenetic Tree Construction
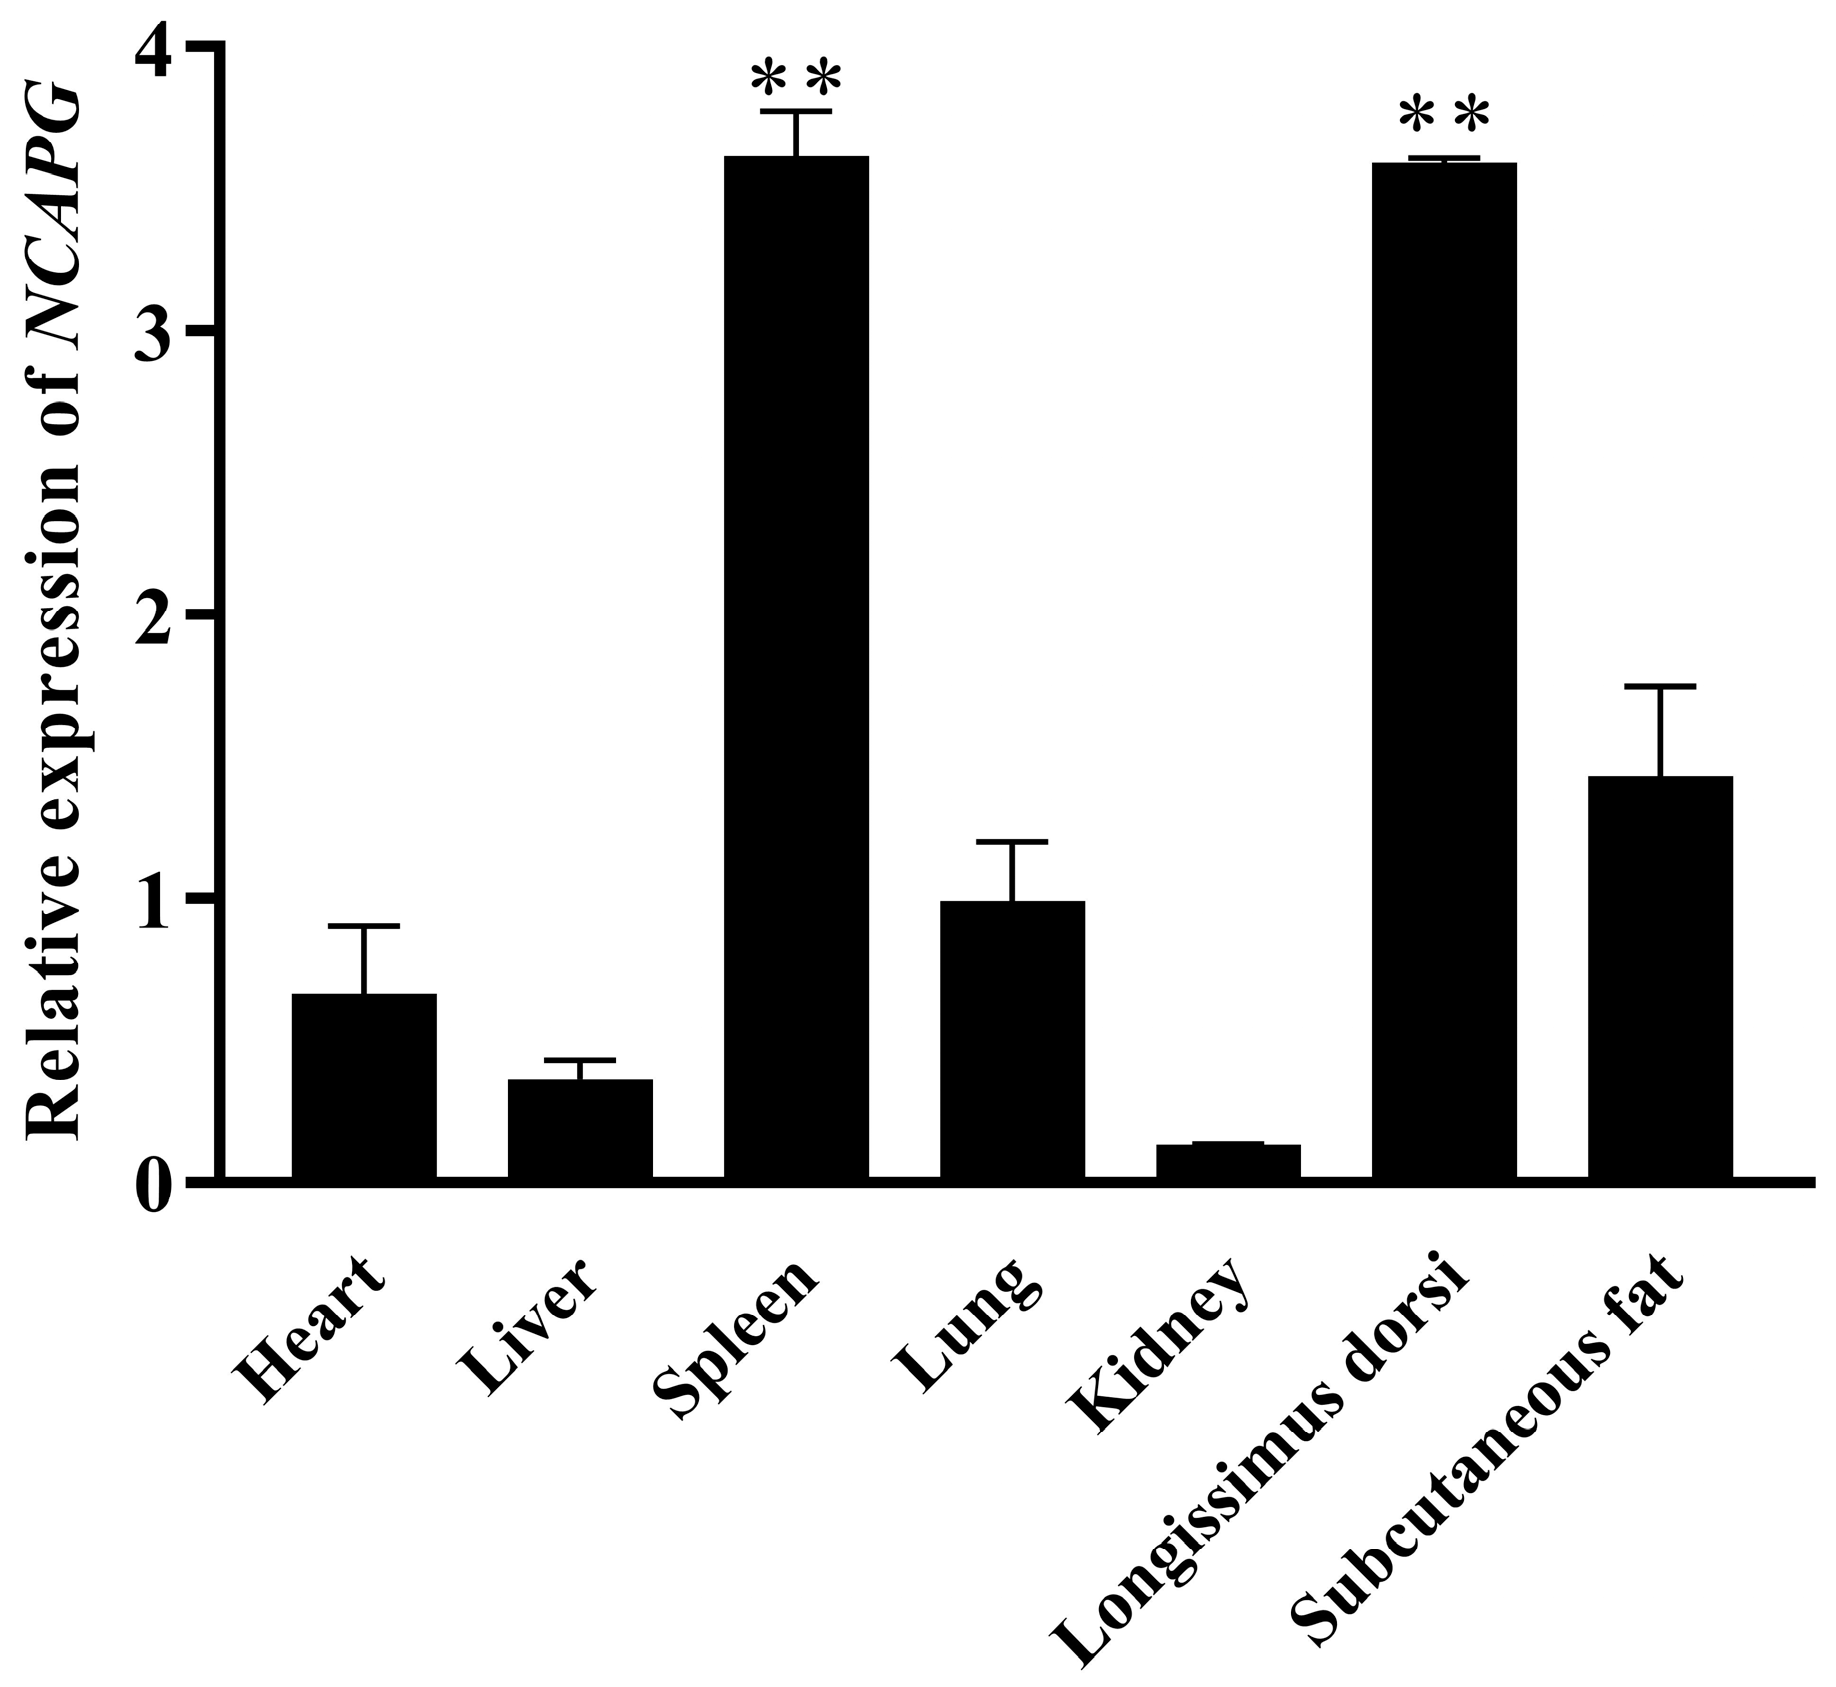
2.4. Schema of NCAPG Expression in Bovine Tissues and Organs
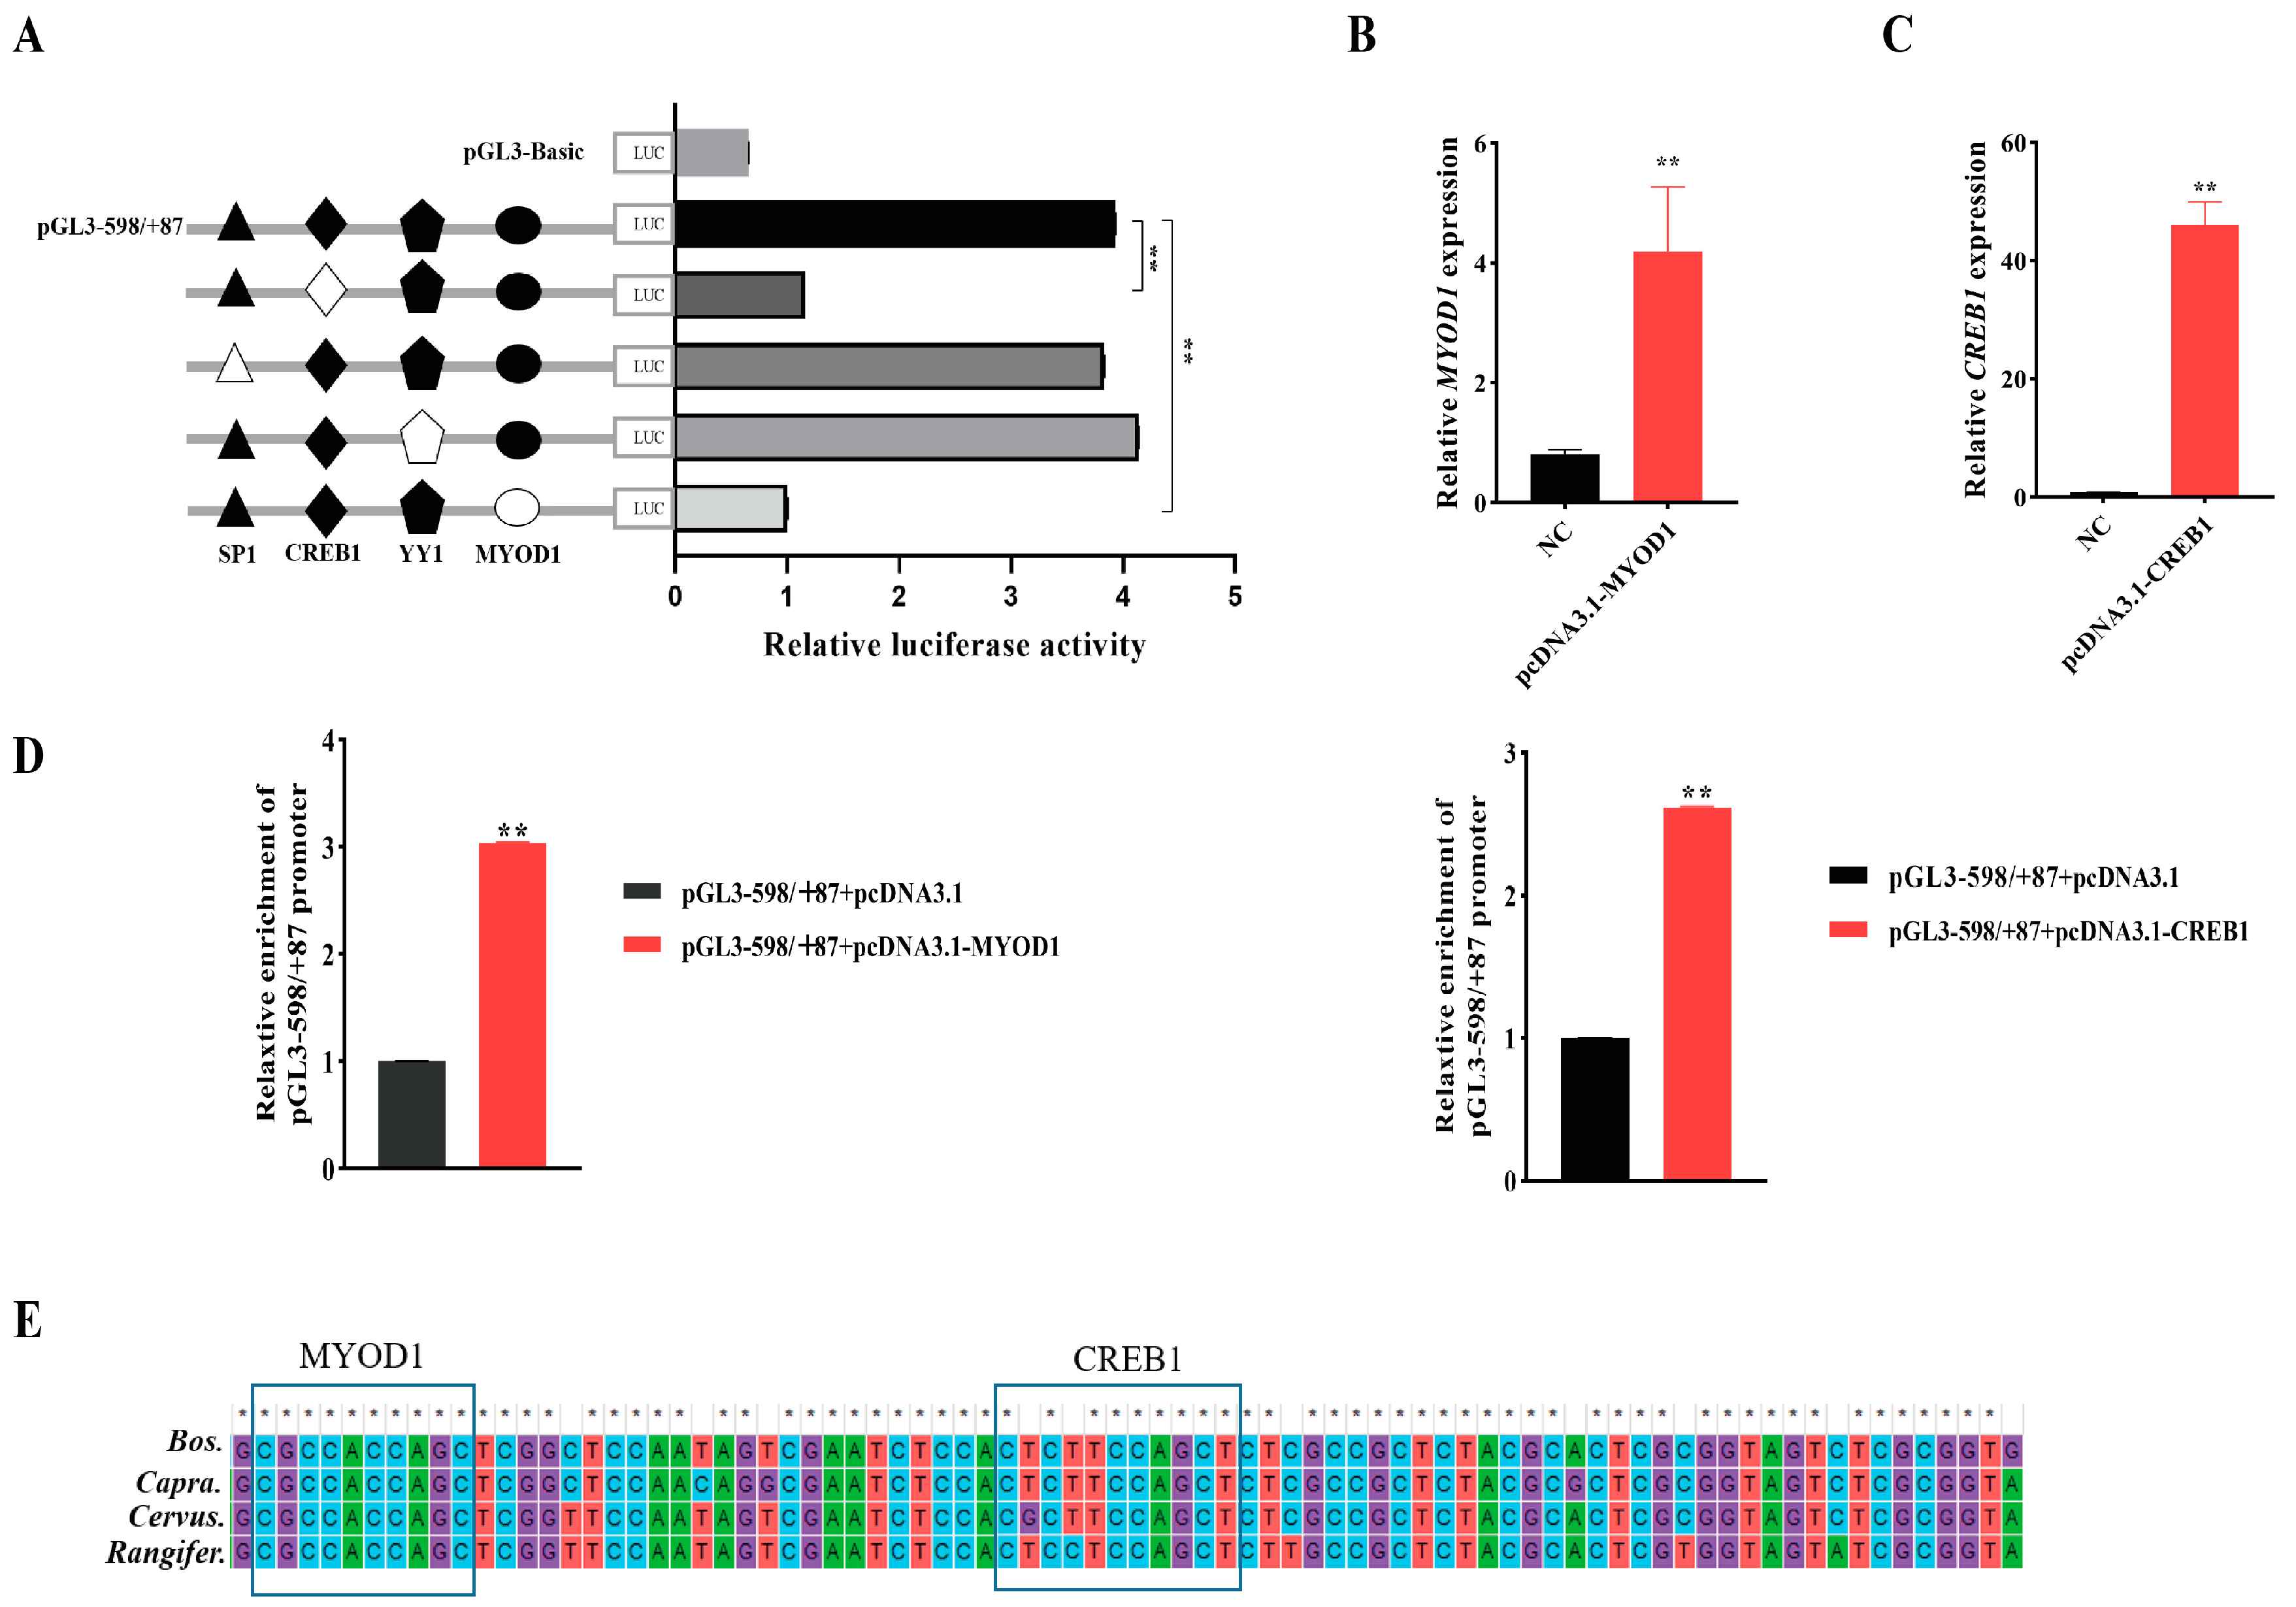
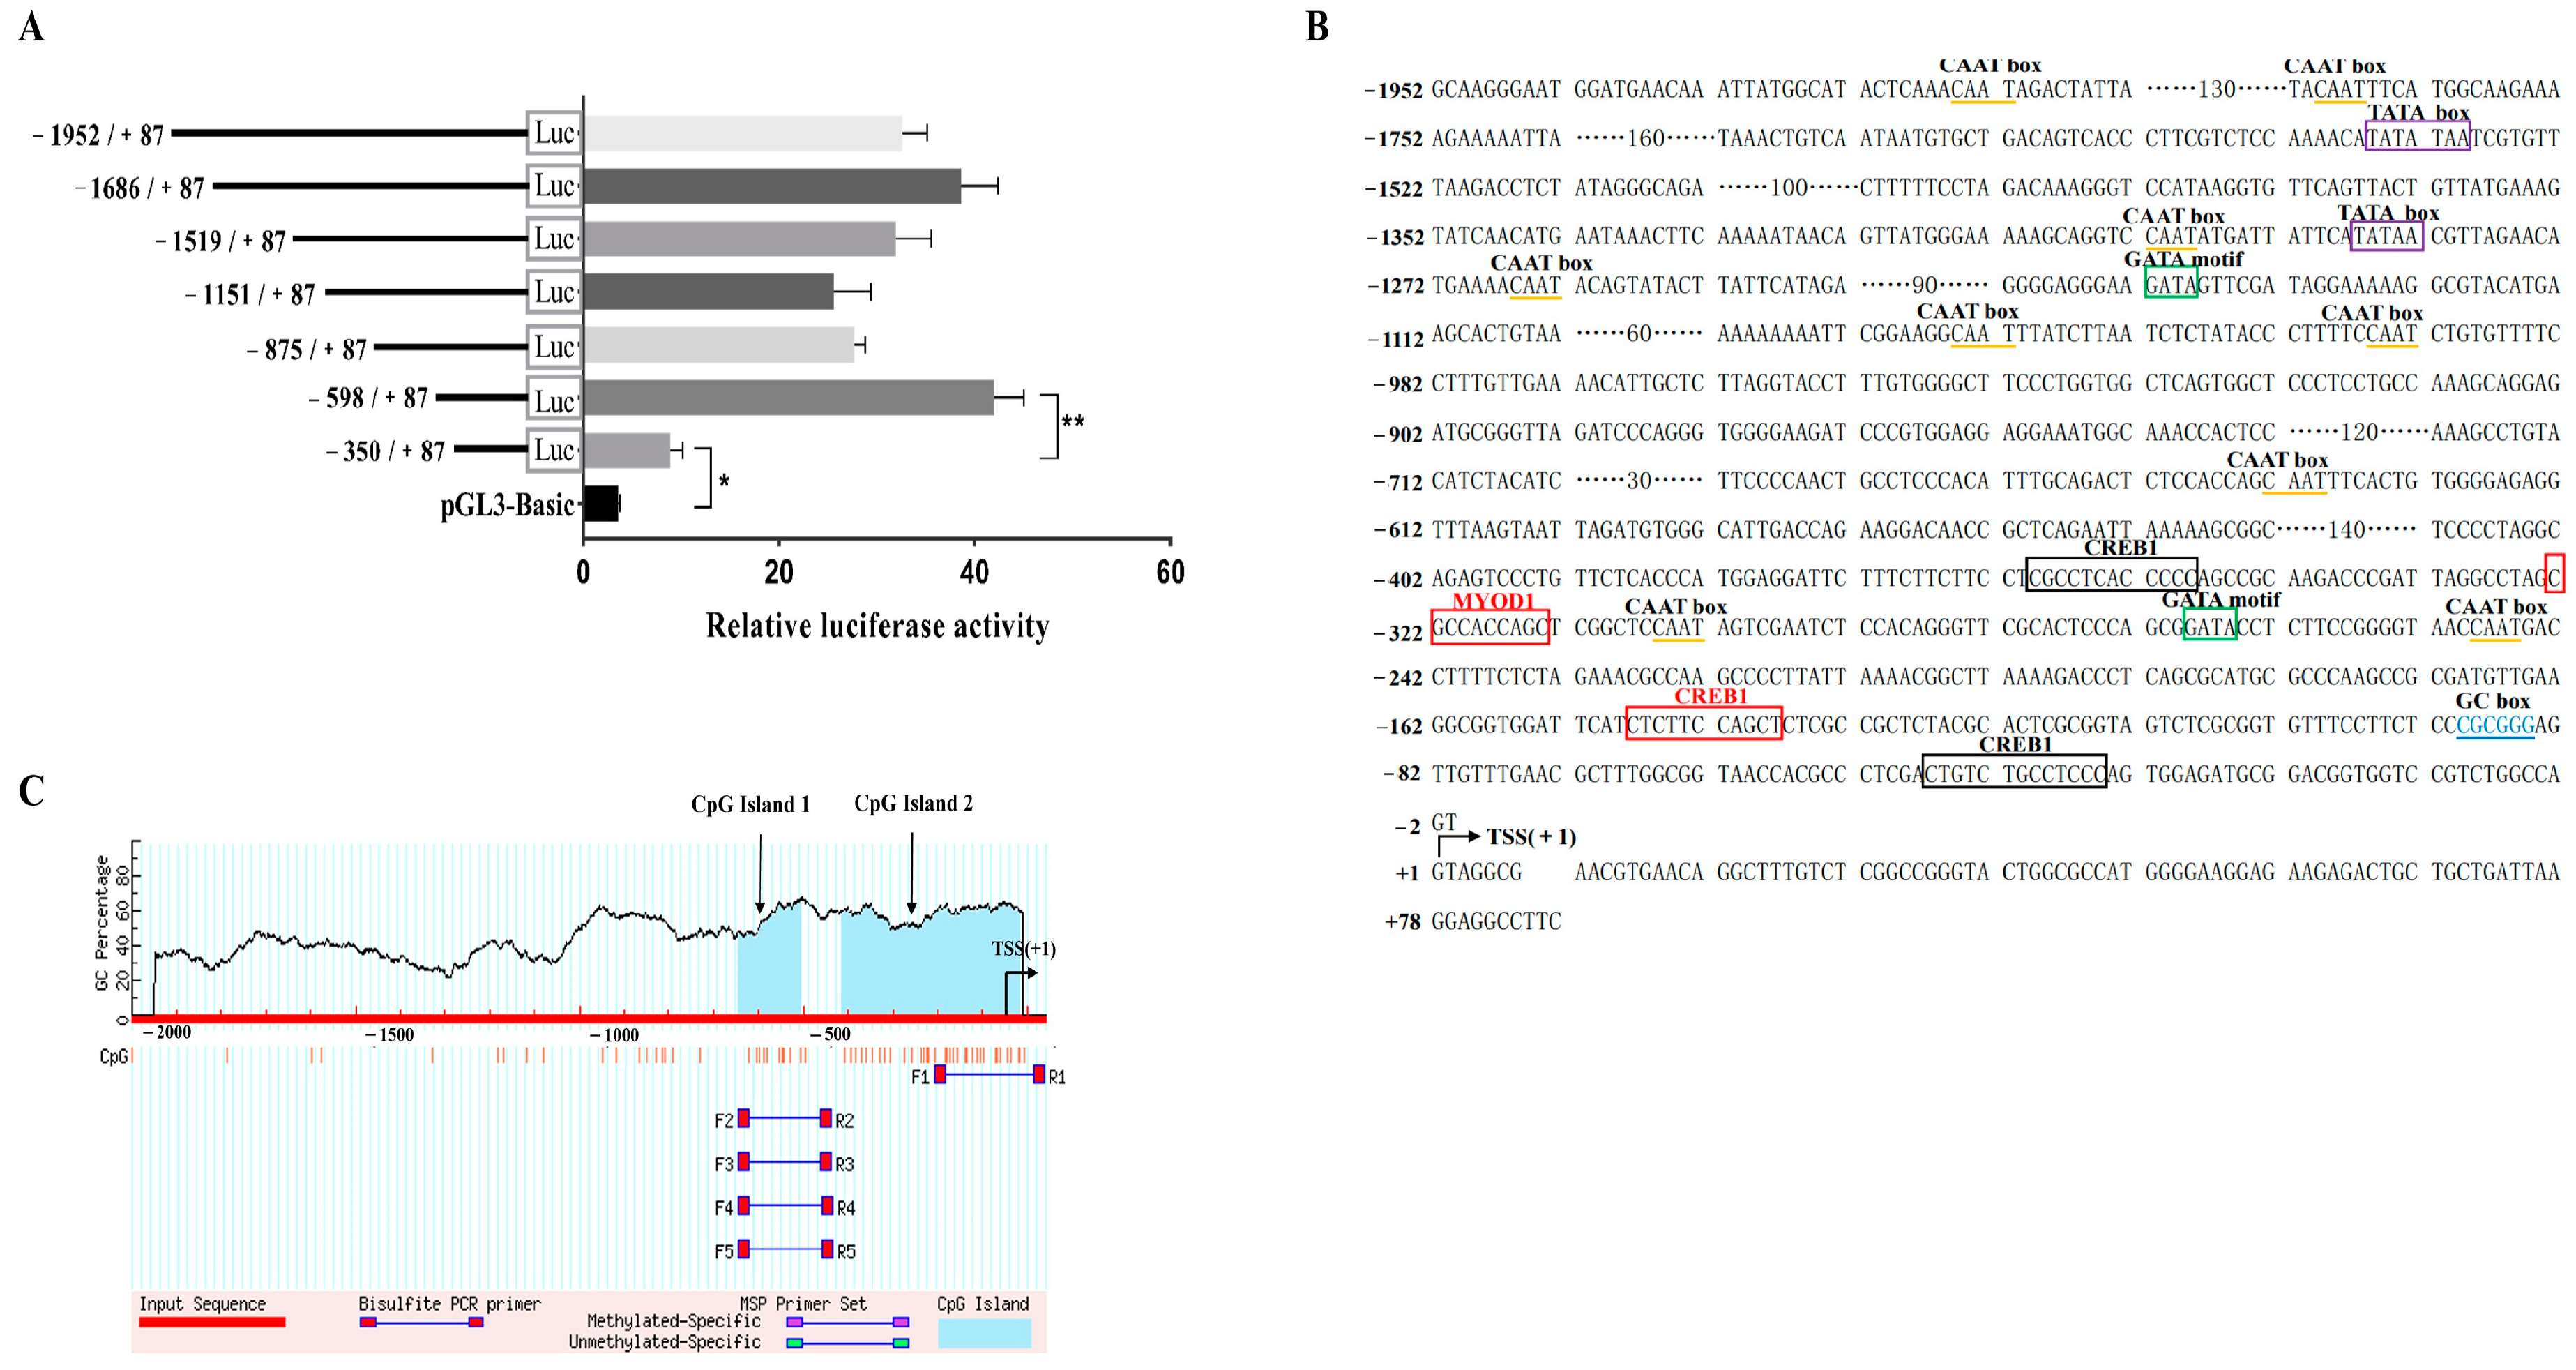
2.5. Confirm of Bovine NCAPG Core Promoter Region
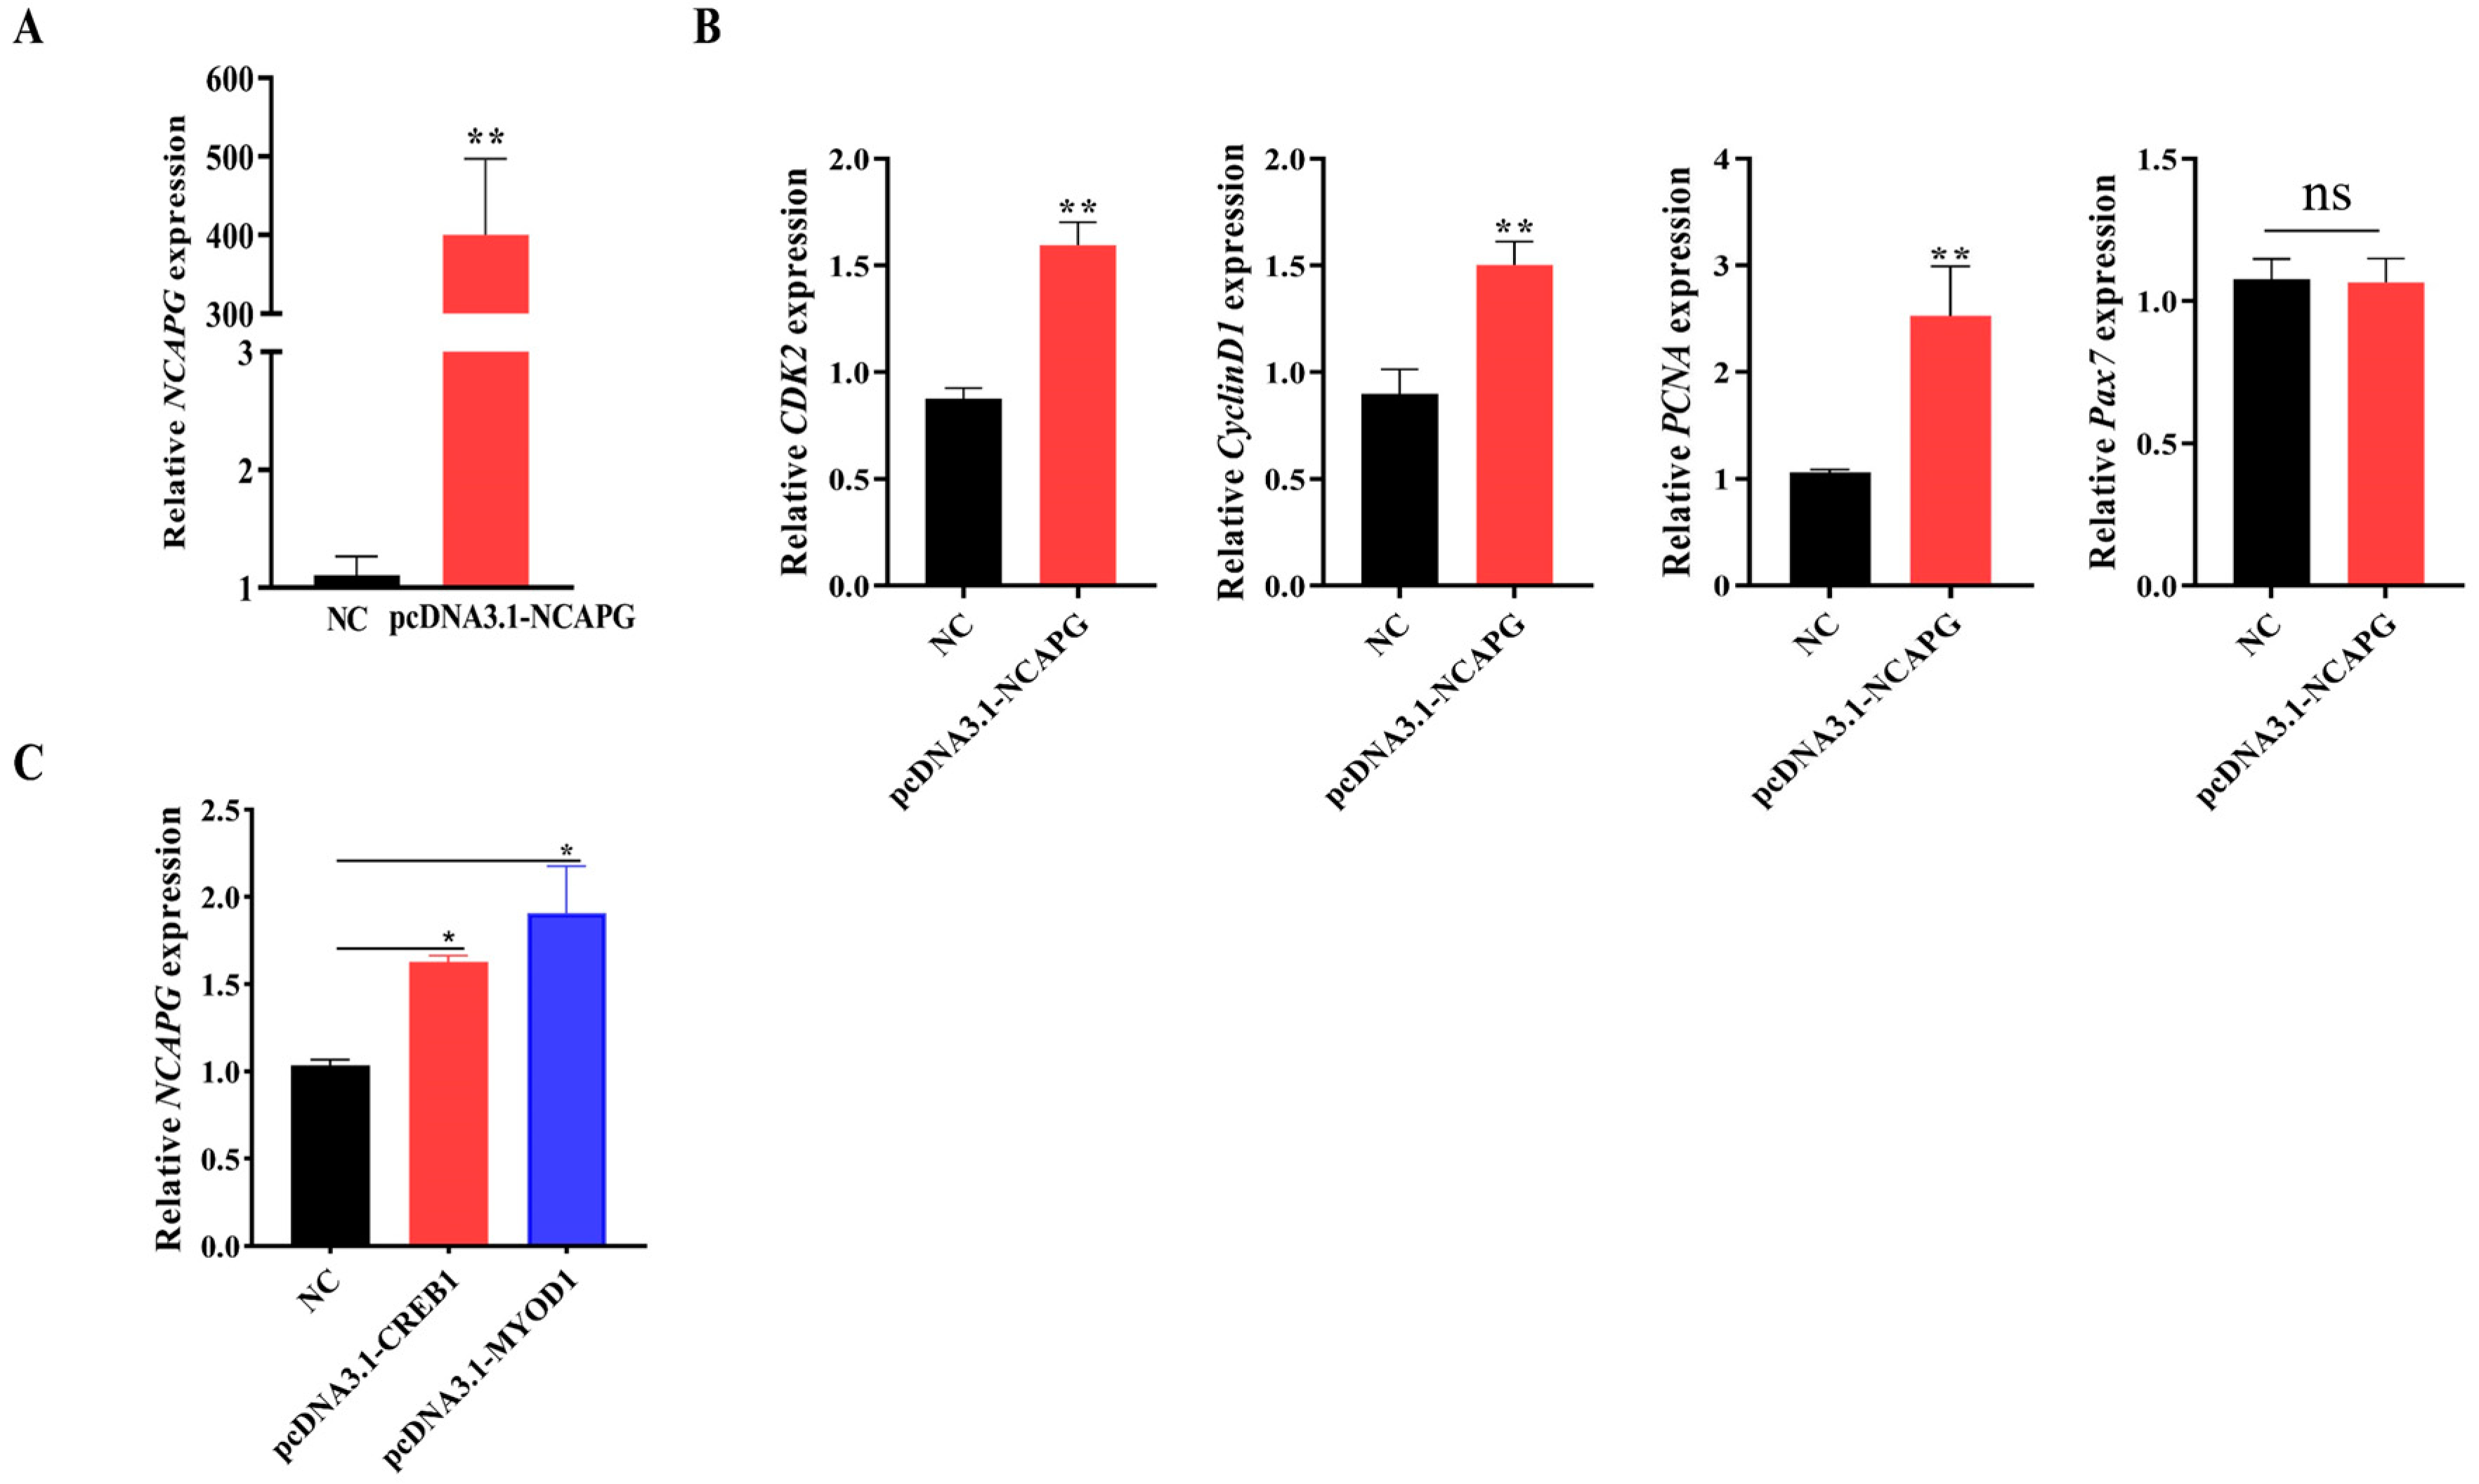
2.6. Validation of the TF Functions
2.7. DNA–Protein Interactions through Electrophoretic Mobility Shift Assays
2.8. Effect of NCAPG on Genes Involved in Myogenesis in Bovine Myoblasts
3. Discussion
4. Materials and Methods
4.1. Sample Collection and Preparation
4.2. Isolation, Identification, and Culture Bovine Myoblasts
4.3. DNA, RNA Isolation, and mRNA Expression Analysis
4.4. Promoter Cloning and Sequence Structure Analysis
4.5. Construction of Promoter Luciferase Reporter Vectors
4.6. Cell Culture, Transfection, and Relative Activity of Dual-Luciferase Assay
4.7. Site-Directed Mutagenesis
4.8. MYOD1, CREB1, and NCAPG Overexpression
4.9. Electrophoretic Mobility Shift Assays
4.10. Statistical Analysis
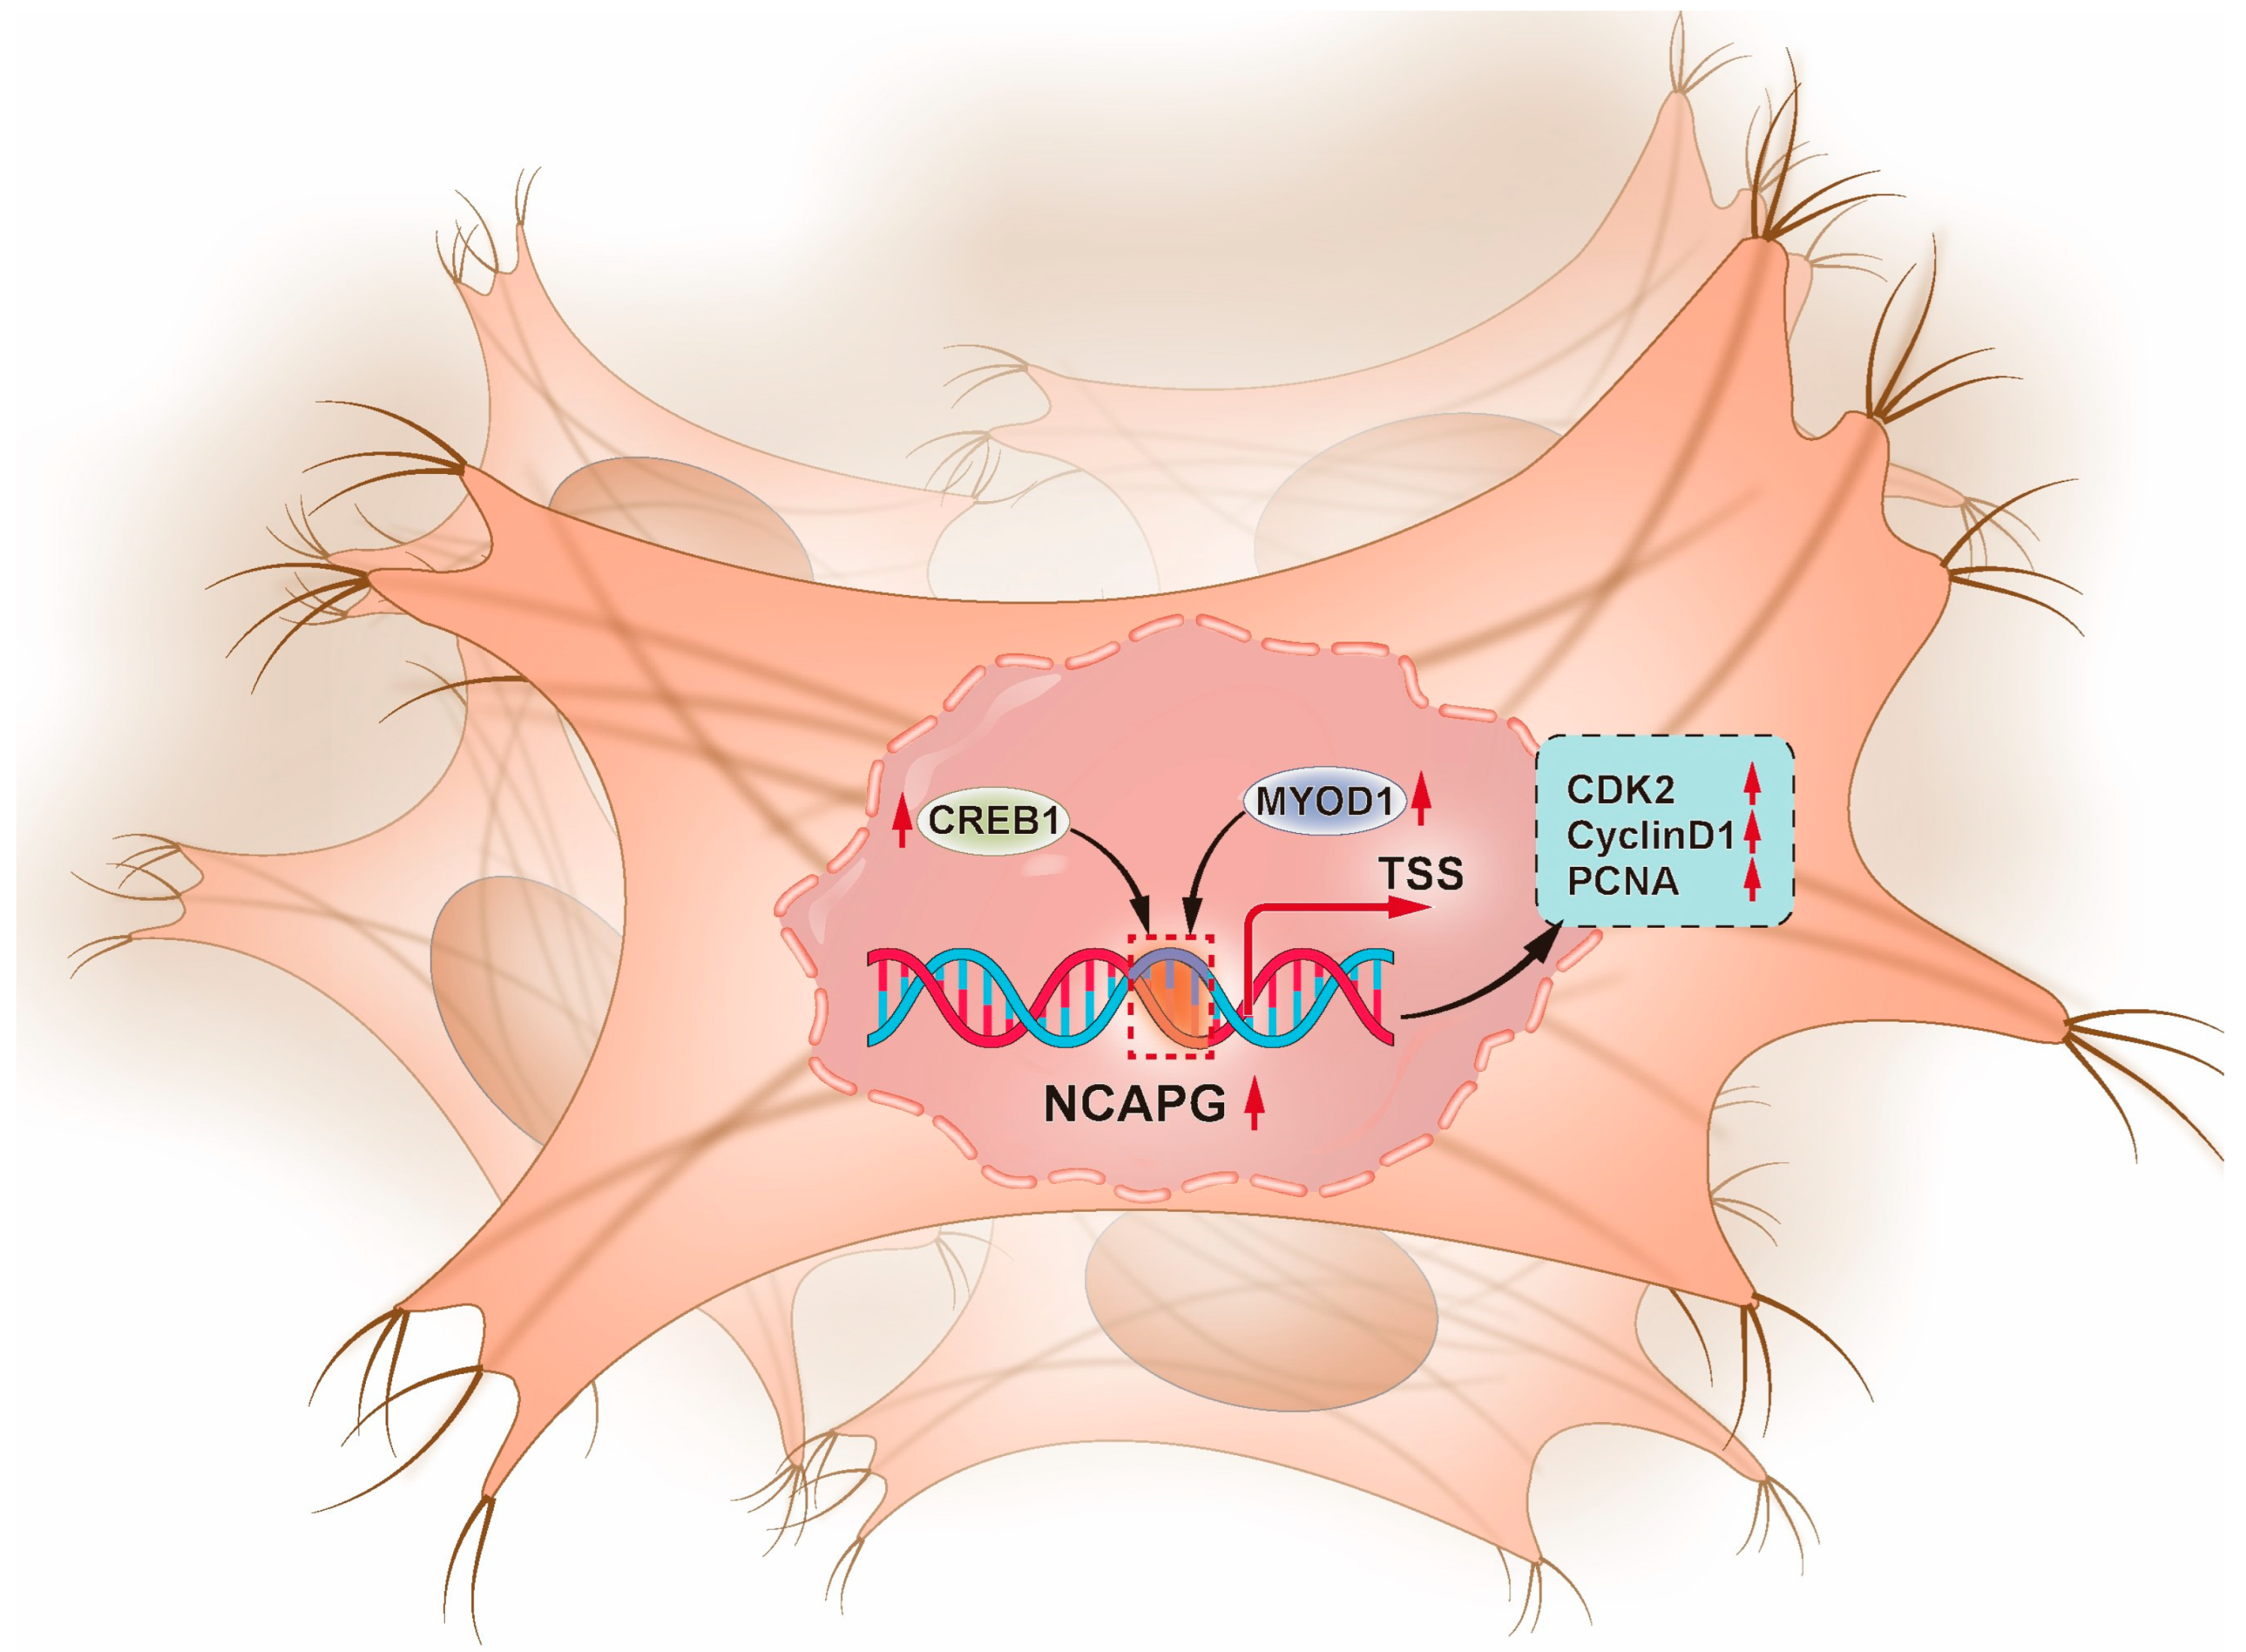
5. Conclusions
Supplementary Materials
Author Contributions
Funding
Institutional Review Board Statement
Informed Consent Statement
Data Availability Statement
Acknowledgments
Conflicts of Interest
References
- Picard, B.; Gagaoua, M. Muscle Fiber Properties in Cattle and Their Relationships with Meat Qualities: An Overview. J. Agric. Food Chem. 2020, 68, 6021–6039. [Google Scholar] [CrossRef] [PubMed]
- Dayton, W.R.; White, M.E. Cellular and molecular regulation of muscle growth and development in meat animals. J. Anim. Sci. 2008, 86, 217–225. [Google Scholar] [CrossRef] [PubMed]
- Asfour, H.A.; Allouh, M.Z.; Said, R.S. Myogenic regulatory factors: The orchestrators of myogenesis after 30 years of discovery. Exp. Biol. Med. 2018, 243, 118–128. [Google Scholar] [CrossRef]
- Fu, Y.; Shang, P.; Zhang, B.; Tian, X.; Nie, R.; Zhang, R.; Zhang, H. Function of the Porcine TRPC1 Gene in Myogenesis and Muscle Growth. Cells 2021, 10, 147. [Google Scholar] [CrossRef] [PubMed]
- Mohammadabadi, M.; Bordbar, F.; Jensen, J.; Du, M.; Guo, W. Key Genes Regulating Skeletal Muscle Development and Growth in Farm Animals. Animals 2021, 11, 835. [Google Scholar] [CrossRef]
- Kimura, K.; Cuvier, O.; Hirano, T. Chromosome condensation by a human condensin complex in Xenopus egg extracts. J. Biol. Chem. 2001, 276, 5417–5420. [Google Scholar] [CrossRef] [PubMed]
- Zhang, W.; Li, J.; Guo, Y.; Zhang, L.; Xu, L.; Gao, X.; Zhu, B.; Gao, H.; Ni, H.; Chen, Y. Multi-strategy genome-wide association studies identify the DCAF16-NCAPG region as a susceptibility locus for average daily gain in cattle. Sci. Rep. 2016, 6, 38073. [Google Scholar] [CrossRef]
- Mikawa, S.; Morozumi, T.; Shimanuki, S.; Hayashi, T.; Uenishi, H.; Domukai, M.; Okumura, N.; Awata, T. Fine mapping of a swine quantitative trait locus for number of vertebrae and analysis of an orphan nuclear receptor, germ cell nuclear factor (NR6A1). Genome Res. 2007, 17, 586–593. [Google Scholar] [CrossRef]
- Takasuga, A.; Sato, K.; Nakamura, R.; Saito, Y.; Sasaki, S.; Tsuji, T.; Suzuki, A.; Kobayashi, H.; Matsuhashi, T.; Setoguchi, K.; et al. Non-synonymous FGD3 Variant as Positional Candidate for Disproportional Tall Stature Accounting for a Carcass Weight QTL (CW-3) and Skeletal Dysplasia in Japanese Black Cattle. PLoS Genet. 2015, 11, e1005433. [Google Scholar] [CrossRef]
- Gudbjartsson, D.F.; Walters, G.B.; Thorleifsson, G.; Stefansson, H.; Halldorsson, B.V.; Zusmanovich, P.; Sulem, P.; Thorlacius, S.; Gylfason, A.; Steinberg, S.; et al. Many sequence variants affecting diversity of adult human height. Nat. Genet. 2008, 40, 609–615. [Google Scholar] [CrossRef]
- Lettre, G.; Jackson, A.U.; Gieger, C.; Schumacher, F.R.; Berndt, S.I.; Sanna, S.; Eyheramendy, S.; Voight, B.F.; Butler, J.L.; Guiducci, C.; et al. Identification of ten loci associated with height highlights new biological pathways in human growth. Nat. Genet. 2008, 40, 584–591. [Google Scholar] [CrossRef]
- Weedon, M.N.; Lango, H.; Lindgren, C.M.; Wallace, C.; Evans, D.M.; Mangino, M.; Freathy, R.M.; Perry, J.R.; Stevens, S.; Hall, A.S.; et al. Genome-wide association analysis identifies 20 loci that influence adult height. Nat. Genet. 2008, 40, 575–583. [Google Scholar] [CrossRef]
- Al-Mamun, H.A.; Kwan, P.; Clark, S.A.; Ferdosi, M.H.; Tellam, R.; Gondro, C. Genome-wide association study of body weight in Australian Merino sheep reveals an orthologous region on OAR6 to human and bovine genomic regions affecting height and weight. Genet. Sel. Evol. 2015, 47, 66. [Google Scholar] [CrossRef]
- Tetens, J.; Widmann, P.; Kuhn, C.; Thaller, G. A genome-wide association study indicates LCORL/NCAPG as a candidate locus for withers height in German Warmblood horses. Anim. Genet. 2013, 44, 467–471. [Google Scholar] [CrossRef] [PubMed]
- Signer-Hasler, H.; Flury, C.; Haase, B.; Burger, D.; Simianer, H.; Leeb, T.; Rieder, S. A genome-wide association study reveals loci influencing height and other conformation traits in horses. PLoS ONE 2012, 7, e37282. [Google Scholar] [CrossRef]
- Carty, C.L.; Johnson, N.A.; Hutter, C.M.; Reiner, A.P.; Peters, U.; Tang, H.; Kooperberg, C. Genome-wide association study of body height in African Americans: The Women’s Health Initiative SNP Health Association Resource (SHARe). Hum. Mol. Genet. 2012, 21, 711–720. [Google Scholar] [CrossRef] [PubMed]
- Eberlein, A.; Takasuga, A.; Setoguchi, K.; Pfuhl, R.; Flisikowski, K.; Fries, R.; Klopp, N.; Furbass, R.; Weikard, R.; Kuhn, C. Dissection of genetic factors modulating fetal growth in cattle indicates a substantial role of the non-SMC condensin I complex, subunit G (NCAPG) gene. Genetics 2009, 183, 951–964. [Google Scholar] [CrossRef]
- Liu, R.; Sun, Y.; Zhao, G.; Wang, F.; Wu, D.; Zheng, M.; Chen, J.; Zhang, L.; Hu, Y.; Wen, J. Genome-wide association study identifies Loci and candidate genes for body composition and meat quality traits in Beijing-You chickens. PLoS ONE 2013, 8, e61172. [Google Scholar] [CrossRef]
- Makvandi-Nejad, S.; Hoffman, G.E.; Allen, J.J.; Chu, E.; Gu, E.; Chandler, A.M.; Loredo, A.I.; Bellone, R.R.; Mezey, J.G.; Brooks, S.A.; et al. Four loci explain 83% of size variation in the horse. PLoS ONE 2012, 7, e39929. [Google Scholar] [CrossRef]
- Rubin, C.J.; Megens, H.J.; Martinez, B.A.; Maqbool, K.; Sayyab, S.; Schwochow, D.; Wang, C.; Carlborg, O.; Jern, P.; Jorgensen, C.B.; et al. Strong signatures of selection in the domestic pig genome. Proc. Natl. Acad. Sci. USA 2012, 109, 19529–19536. [Google Scholar] [CrossRef]
- Liu, Y.; Duan, X.; Chen, S.; He, H.; Liu, X. NCAPG is differentially expressed during longissimus muscle development and is associated with growth traits in Chinese Qinchuan beef cattle. Genet. Mol. Biol. 2015, 38, 450–456. [Google Scholar] [CrossRef] [PubMed]
- Sewda, A.; Agopian, A.J.; Goldmuntz, E.; Hakonarson, H.; Morrow, B.E.; Taylor, D.; Mitchell, L.E. Gene-based genome-wide association studies and meta-analyses of conotruncal heart defects. PLoS ONE 2019, 14, e219926. [Google Scholar] [CrossRef] [PubMed]
- Hu, X.; Xing, Y.; Fu, X.; Yang, Q.; Ren, L.; Wang, Y.; Li, Q.; Li, J.; Zhang, L. NCAPG Dynamically Coordinates the Myogenesis of Fetal Bovine Tissue by Adjusting Chromatin Accessibility. Int. J. Mol. Sci. 2020, 21, 1248. [Google Scholar] [CrossRef] [PubMed]
- Han, X.; Jiang, T.; Yu, L.; Zeng, C.; Fan, B.; Liu, B. Molecular characterization of the porcine MTPAP gene associated with meat quality traits: Chromosome localization, expression distribution, and transcriptional regulation. Mol. Cell. Biochem. 2012, 364, 173–180. [Google Scholar] [CrossRef]
- Yang, H.; Pu, L.; Li, R.; Zhu, R. NCAPG is transcriptionally regulated by CBX3 and activates the Wnt/beta-catenin signaling pathway to promote proliferation and the cell cycle and inhibit apoptosis in colorectal cancer. J. Gastrointest. Oncol. 2023, 14, 900–912. [Google Scholar] [CrossRef]
- Hou, J.; Huang, P.; Xu, M.; Wang, H.; Shao, Y.; Weng, X.; Liu, Y.; Chang, H.; Zhang, L.; Cui, H. Nonstructural maintenance of chromatin condensin I complex subunit G promotes the progression of glioblastoma by facilitating Poly (ADP-ribose) polymerase 1-mediated E2F1 transactivation. Neuro Oncol. 2023, 25, 2015–2027. [Google Scholar] [CrossRef]
- Zhu, Y.; Tong, H.L.; Li, S.F.; Yan, Y.Q. Effect of TCEA3 on the differentiation of bovine skeletal muscle satellite cells. Biochem. Biophys. Res. Commun. 2017, 484, 827–832. [Google Scholar] [CrossRef]
- Zhen, H.; Shen, J.; Wang, J.; Luo, Y.; Hu, J.; Liu, X.; Li, S.; Hao, Z.; Li, M.; Shi, B.; et al. Characteristics and Expression of circ_003628 and Its Promoted Effect on Proliferation and Differentiation of Skeletal Muscle Satellite Cells in Goats. Animals 2022, 12, 2524. [Google Scholar] [CrossRef]
- Fong, A.P.; Tapscott, S.J. Skeletal muscle programming and re-programming. Curr. Opin. Genet. Dev. 2013, 23, 568–573. [Google Scholar] [CrossRef]
- Dej, K.J.; Ahn, C.; Orr-Weaver, T.L. Mutations in the Drosophila condensin subunit dCAP-G: Defining the role of condensin for chromosome condensation in mitosis and gene expression in interphase. Genetics 2004, 168, 895–906. [Google Scholar] [CrossRef]
- Li, P.; Wen, J.; Ren, X.; Zhou, Y.; Xue, Y.; Yan, Z.; Li, S.; Tian, H.; Tang, X.G.; Zhang, G.J. MicroRNA-23b-3p targets non-SMC condensing I complex subunit G to promote proliferation and inhibit apoptosis of colorectal cancer cells via regulation of the PI3K/AKT signaling pathway. Oncol. Lett. 2021, 22, 812. [Google Scholar] [CrossRef] [PubMed]
- Listrat, A.; Lebret, B.; Louveau, I.; Astruc, T.; Bonnet, M.; Lefaucheur, L.; Picard, B.; Bugeon, J. How Muscle Structure and Composition Influence Meat and Flesh Quality. Sci. World J. 2016, 2016, 3182746. [Google Scholar] [CrossRef]
- Huang, C.; Ge, F.; Ma, X.; Dai, R.; Dingkao, R.; Zhaxi, Z.; Burenchao, G.; Bao, P.; Wu, X.; Guo, X.; et al. Comprehensive Analysis of mRNA, lncRNA, circRNA, and miRNA Expression Profiles and Their ceRNA Networks in the Longissimus Dorsi Muscle of Cattle-Yak and Yak. Front. Genet. 2021, 12, 772557. [Google Scholar] [CrossRef]
- Zeng, Q.; Du, Z.Q. Advances in the discovery of genetic elements underlying longissimus dorsi muscle growth and development in the pig. Anim. Genet. 2023, 54, 709–720. [Google Scholar] [CrossRef] [PubMed]
- Suzuki, S.; Yamanouchi, K.; Soeta, C.; Katakai, Y.; Harada, R.; Naito, K.; Tojo, H. Skeletal muscle injury induces hepatocyte growth factor expression in spleen. Biochem. Biophys. Res. Commun. 2002, 292, 709–714. [Google Scholar] [CrossRef] [PubMed]
- Alam, M.Z.; Haque, M.A.; Iqbal, A.; Lee, Y.M.; Ha, J.J.; Jin, S.; Park, B.; Kim, N.Y.; Won, J.I.; Kim, J.J. Genome-Wide Association Study to Identify QTL for Carcass Traits in Korean Hanwoo Cattle. Animals 2023, 13, 2737. [Google Scholar] [CrossRef] [PubMed]
- Zabidi, M.A.; Stark, A. Regulatory Enhancer-Core-Promoter Communication via Transcription Factors and Cofactors. Trends Genet. 2016, 32, 801–814. [Google Scholar] [CrossRef]
- Improda, T.; Morgera, V.; Vitale, M.; Chiariotti, L.; Passaro, F.; Feola, A.; Porcellini, A.; Cuomo, M.; Pezone, A. Specific Methyl-CpG Configurations Define Cell Identity through Gene Expression Regulation. Int. J. Mol. Sci. 2023, 24, 9951. [Google Scholar] [CrossRef]
- Huang, Y.Z.; Zhang, Z.J.; He, H.; Cao, X.K.; Song, C.C.; Liu, K.P.; Lan, X.Y.; Lei, C.Z.; Qi, X.L.; Bai, Y.Y.; et al. Correlation between ZBED6 Gene Upstream CpG Island methylation and mRNA expression in cattle. Anim. Biotechnol. 2017, 28, 104–111. [Google Scholar] [CrossRef]
- Wei, D.; Li, A.; Zhao, C.; Wang, H.; Mei, C.; Khan, R.; Zan, L. Transcriptional Regulation by CpG Sites Methylation in the Core Promoter Region of the Bovine SIX1 Gene: Roles of Histone H4 and E2F2. Int. J. Mol. Sci. 2018, 19, 213. [Google Scholar] [CrossRef]
- Wu, W.; Ren, Z.; Liu, H.; Wang, L.; Huang, R.; Chen, J.; Zhang, L.; Li, P.; Xiong, Y. Core promoter analysis of porcine Six1 gene and its regulation of the promoter activity by CpG methylation. Gene 2013, 529, 238–244. [Google Scholar] [CrossRef]
- Tisato, V.; Castiglione, A.; Ciorba, A.; Aimoni, C.; Silva, J.A.; Gallo, I.; D’Aversa, E.; Salvatori, F.; Bianchini, C.; Pelucchi, S.; et al. LINE-1 global DNA methylation, iron homeostasis genes, sex and age in sudden sensorineural hearing loss (SSNHL). Hum. Genomics 2023, 17, 112. [Google Scholar] [CrossRef]
- Wang, J.; Huang, Y.; Xu, J.; Yue, B.; Wen, Y.; Wang, X.; Lei, C.; Chen, H. Pleomorphic adenoma gene 1 (PLAG1) promotes proliferation and inhibits apoptosis of bovine primary myoblasts through the PI3K-Akt signaling pathway. J. Anim. Sci. 2022, 100, skac098. [Google Scholar] [CrossRef] [PubMed]
- Cui, J.X.; Gong, Z.A.; Zhang, W.T.; Liu, K.; Li, T.; Shao, S.L.; Zhang, W.W. Effects of transcription factor SIX2 gene on the proliferation of bovine skeletal muscle satellite cells. Zhongguo Ying Yong Sheng Li Xue Za Zhi 2022, 38, 622–627. [Google Scholar]
- Shi, P.; Ruan, Y.; Liu, W.; Sun, J.; Xu, J.; Xu, H. Analysis of Promoter Methylation of the Bovine FOXO1 Gene and Its Effect on Proliferation and Differentiation of Myoblasts. Animals 2023, 13, 319. [Google Scholar] [CrossRef] [PubMed]
- Zhou, D.; Xu, H.; Chen, W.; Wang, Y.; Zhang, M.; Yang, T. Study on the transcriptional regulatory mechanism of the MyoD1 gene in Guanling bovine. Rsc Adv. 2018, 8, 1249–12419. [Google Scholar] [CrossRef] [PubMed]
- Wei, D.; Raza, S.H.A.; Wang, X.; Khan, R.; Lei, Z.; Zhang, G.; Zhang, J.; Luoreng, Z.; Ma, Y.; Alamoudi, M.O.; et al. Tissue Expression Analysis, Cloning, and Characterization of the 5’-Regulatory Region of the Bovine LATS1 Gene. Front. Vet. Sci. 2022, 9, 853819. [Google Scholar] [CrossRef]
- Du, X.H.; Gan, Q.F.; Yuan, Z.R.; Gao, X.; Zhang, L.P.; Gao, H.J.; Li, J.Y.; Xu, S.Z. Polymorphism of MyoD1 and Myf6 genes and associations with carcass and meat quality traits in beef cattle. Genet. Mol. Res. 2013, 12, 6708. [Google Scholar] [CrossRef]
- Gellhaus, B.; Böker, K.O.; Gsaenger, M.; Rodenwaldt, E.; Hüser, M.A.; Schilling, A.F.; Saul, D. Foxo3 Knockdown Mediates Decline of Myod1 and Myog Reducing Myoblast Conversion to Myotubes. Cells 2023, 12, 2167. [Google Scholar] [CrossRef]
- Zhou, D.; Wang, Y.; Yang, R.; Wang, F.; Zhao, Z.; Wang, X.; Xie, L.; Tian, X.; Wang, G.; Li, B.; et al. The MyoD1 Promoted Muscle Differentiation and Generation by Activating CCND2 in Guanling Cattle. Animals 2022, 12, 2571. [Google Scholar] [CrossRef]
- Blum, R.; Dynlacht, B.D. The role of MyoD1 and histone modifications in the activation of muscle enhancers. Epigenetics 2013, 8, 778–784. [Google Scholar] [CrossRef]
- Lee, E.A.; Kim, J.M.; Lim, K.S.; Ryu, Y.C.; Jeon, W.M.; Hong, K.C. Effects of variation in porcine MYOD1 gene on muscle fiber characteristics, lean meat production, and meat quality traits. Meat Sci. 2012, 92, 36–43. [Google Scholar] [CrossRef] [PubMed]
- Sun, J.; Ruan, Y.; Xu, J.; Shi, P.; Xu, H. Effect of Bovine MEF2A Gene Expression on Proliferation and Apoptosis of Myoblast Cells. Genes 2023, 14, 1498. [Google Scholar] [CrossRef]
- Tizioto, P.C.; Coutinho, L.L.; Mourão, G.B.; Gasparin, G.; Malagó-Jr, W.; Bressani, F.A.; Tullio, R.R.; Nassu, R.T.; Taylor, J.F.; Regitano, L.C.A. Variation in myogenic differentiation 1 mRNA abundance is associated with beef tenderness in Nelore cattle. Anim. Genet. 2016, 47, 491–494. [Google Scholar] [CrossRef]
- Ortega-Martínez, S. A new perspective on the role of the CREB family of transcription factors in memory consolidation via adult hippocampal neurogenesis. Front. Mol. Neurosci. 2015, 8, 46. [Google Scholar] [CrossRef]
- Montminy, M.; Koo, S.H.; Zhang, X. The CREB Family: Key regulators of hepatic metabolism. Ann Endocrinol. 2004, 65, 73–75. [Google Scholar] [CrossRef] [PubMed]
- Li, G.; Jiang, Q.; Xu, K. CREB family: A significant role in liver fibrosis. Biochimie 2019, 163, 94–100. [Google Scholar] [CrossRef] [PubMed]
- Feng, Y.; Raza, S.H.A.; Liang, C.; Wang, X.; Wang, J.; Zhang, W.; Zan, L. CREB1 promotes proliferation and differentiation by mediating the transcription of CCNA2 and MYOG in bovine myoblasts. Int. J. Biol. Macromol. 2022, 216, 32–41. [Google Scholar] [CrossRef]
- Kim, N.H.; Sung, N.J.; Shin, S.; Ryu, D.; Youn, H.; Park, S. Sauchinone inhibits the proliferation, migration and invasion of breast cancer cells by suppressing Akt-CREB-MMP13 signaling pathway. Bioscience Rep. 2021, 41, BSR20211067. [Google Scholar] [CrossRef]
- Guo, L.; Yin, M.; Wang, Y. CREB1, a direct target of miR-122, promotes cell proliferation and invasion in bladder cancer. Oncol. Lett. 2018, 16, 3842–3848. [Google Scholar] [CrossRef]
- Tooley, J.G.; Catlin, J.P.; Schaner Tooley, C.E. CREB-mediated transcriptional activation of NRMT1 drives muscle differentiation. Transcription 2021, 12, 72–88. [Google Scholar] [CrossRef]
- Erdenee, S.; Akhatayeva, Z.; Pan, C.; Cai, Y.; Xu, H.; Chen, H.; Lan, X. An insertion/deletion within the CREB1 gene identified using the RNA-sequencing is associated with sheep body morphometric traits. Gene 2021, 775, 145444. [Google Scholar] [CrossRef] [PubMed]
- Xiong, Z.; Wang, M.; You, S.; Chen, X.; Lin, J.; Wu, J.; Shi, X. Transcription Regulation of Tceal7 by the Triple Complex of Mef2c, Creb1 and Myod. Biology 2022, 11, 446. [Google Scholar] [CrossRef]
- Sugasawa, T.; Tome, Y.; Takeuchi, Y.; Yoshida, Y.; Yahagi, N.; Sharma, R.; Aita, Y.; Ueda, H.; Maruyama, R.; Takeuchi, K.; et al. Influence of Intermittent Cold Stimulations on CREB and Its Targeting Genes in Muscle: Investigations into Molecular Mechanisms of Local Cryotherapy. Int. J. Mol. Sci. 2020, 21, 4588. [Google Scholar] [CrossRef]
- Bo, Y.Y.; Liang, L.D.; Hua, Y.J.; Zhao, Z.; Yao, M.S.; Shan, L.B.; Liang, C.Z. High-purity DNA extraction from animal tissue using picking in the TRIzol-based method. Biotechniques 2021, 70, 186–190. [Google Scholar] [CrossRef]
- Salvatori, F.; D’Aversa, E.; Serino, M.L.; Singh, A.V.; Secchiero, P.; Zauli, G.; Tisato, V.; Gemmati, D. miRNAs Epigenetic Tuning of Wall Remodeling in the Early Phase after Myocardial Infarction: A Novel Epidrug Approach. Int. J. Mol. Sci. 2023, 24, 13268. [Google Scholar] [CrossRef]
- Zhang, H.M.; Chen, H.; Liu, W.; Liu, H.; Gong, J.; Wang, H.; Guo, A.Y. AnimalTFDB: A comprehensive animal transcription factor database. Nucleic Acids Res. 2012, 40, D144–D149. [Google Scholar] [CrossRef]
- Hall, B.G. Building phylogenetic trees from molecular data with MEGA. Mol. Biol. Evol. 2013, 30, 1229–1235. [Google Scholar] [CrossRef]


Disclaimer/Publisher’s Note: The statements, opinions and data contained in all publications are solely those of the individual author(s) and contributor(s) and not of MDPI and/or the editor(s). MDPI and/or the editor(s) disclaim responsibility for any injury to people or property resulting from any ideas, methods, instructions or products referred to in the content. |
© 2024 by the authors. Licensee MDPI, Basel, Switzerland. This article is an open access article distributed under the terms and conditions of the Creative Commons Attribution (CC BY) license (https://creativecommons.org/licenses/by/4.0/).
Share and Cite
Chen, Z.; Li, J.; Bai, Y.; Liu, Z.; Wei, Y.; Guo, D.; Jia, X.; Shi, B.; Zhang, X.; Zhao, Z.; et al. Unlocking the Transcriptional Control of NCAPG in Bovine Myoblasts: CREB1 and MYOD1 as Key Players. Int. J. Mol. Sci. 2024, 25, 2506. https://doi.org/10.3390/ijms25052506
Chen Z, Li J, Bai Y, Liu Z, Wei Y, Guo D, Jia X, Shi B, Zhang X, Zhao Z, et al. Unlocking the Transcriptional Control of NCAPG in Bovine Myoblasts: CREB1 and MYOD1 as Key Players. International Journal of Molecular Sciences. 2024; 25(5):2506. https://doi.org/10.3390/ijms25052506
Chicago/Turabian StyleChen, Zongchang, Jingsheng Li, Yanbin Bai, Zhanxin Liu, Yali Wei, Dashan Guo, Xue Jia, Bingang Shi, Xiaolan Zhang, Zhidong Zhao, and et al. 2024. "Unlocking the Transcriptional Control of NCAPG in Bovine Myoblasts: CREB1 and MYOD1 as Key Players" International Journal of Molecular Sciences 25, no. 5: 2506. https://doi.org/10.3390/ijms25052506
APA StyleChen, Z., Li, J., Bai, Y., Liu, Z., Wei, Y., Guo, D., Jia, X., Shi, B., Zhang, X., Zhao, Z., Hu, J., Han, X., Wang, J., Liu, X., Li, S., & Zhao, F. (2024). Unlocking the Transcriptional Control of NCAPG in Bovine Myoblasts: CREB1 and MYOD1 as Key Players. International Journal of Molecular Sciences, 25(5), 2506. https://doi.org/10.3390/ijms25052506