Article

Knockdown of DNMT1 Induces SLCO3A1 to Promote Follicular Growth by Enhancing the Proliferation of Granulosa Cells in Mammals

Guangdong Laboratory of Lingnan Modern Agriculture, National Engineering Research Center for Breeding Swine Industry, State Key Laboratory of Swine and Poultry Breeding Industry, Guangdong Provincial Key Laboratory of Agro-Animal Genomics and Molecular Breeding, College of Animal Science, South China Agricultural University, Guangzhou 510642, China
*
Authors to whom correspondence should be addressed.
These authors contributed equally to this work.
Int. J. Mol. Sci. 2024, 25(5), 2468; https://doi.org/10.3390/ijms25052468
Submission received: 15 January 2024 / Revised: 7 February 2024 / Accepted: 18 February 2024 / Published: 20 February 2024
(This article belongs to the Section Molecular Endocrinology and Metabolism)

Abstract

:
In female mammals, the proliferation and apoptosis of granulosa cells (GCs) have been shown to determine the fate of follicles. DNA methyltransferases (DNMTs) and SLCO3A1 have been reported to be involved in the survival of GCs and follicular growth. However, the molecular mechanisms enabling DNMTs to regulate the expression of SLCO3A1 to participate in follicular growth are unclear. In this study, we found that the knockdown of DNMT1 enhanced the mRNA and protein levels of SLCO3A1 by regulating the chromatin accessibility probably. Moreover, SLCO3A1 upregulated the mRNA and protein levels of MCL1, PCNA, and STAR to promote the proliferation of GCs and facilitated cell cycle progression by increasing the mRNA and protein levels of CCNE1, CDK2, and CCND1, but it decreased apoptosis by downregulating the mRNA and protein levels of CASP3 and CASP8. Moreover, SLCO3A1 promoted the growth of porcine follicles and development of mice follicles. In conclusion, the knockdown of DNMT1 upregulated the mRNA and protein levels of SLCO3A1, thereby promoting the proliferation of GCs to facilitate the growth and development of ovarian follicles, and these results provide new insights into investigations of female reproductive diseases.

1. Introduction

As the basic functional unit of ovaries [1], the normal growth, development and ovulation of follicles are necessary for the generations of mammals [2]. In humans, a series of female reproductive diseases such as polycystic ovary syndrome (PCOS) [3,4], endometriosis [5], and dysfunction of ovarian reserve [6] present the clinical feature of abnormal follicular growth. However, no effective therapy treats and cures these devastating diseases. Follicular growth is a complex multicellular process, and the granulosa cells (GCs) have been shown to be the main supporting and regulating cells in follicles [7,8]. Previous studies have proved that the proliferation of GCs ensures the follicular development and ovulation [2,9,10], while the excessive apoptosis of GCs leads to follicular atresia [7,11,12]. Numerous studies have indicated that the DNA methylation catalyzed by DNA methyltransferases (DNMTs) regulates the transcription of genes via altering the chromatin structure to be involved in follicular growth [13]. DNA hypermethylation is often thought to be associated with gene silencing, whereas DNA demethylation is associated with gene activation [14,15]. Interestingly, previous studies have found that DNA methylation plays an important role in follicular growth [16,17]. The knockdown of DNMT1 increases the expression of RSPO2, thereby inducing follicular growth [18]. The knockdown of DNMTs inhibits the methylation status of H19/Igf2 to decrease the apoptosis of ovarian cells [19]. DNMT1 prevents follicular growth by mediating lncRNA IFFD inhibition proliferation and promoting the apoptosis of GCs [20]. These results suggest that DNMTs may regulate GCs function to modulate follicular growth by directly targeting genes, but the molecular mechanism behind this process is still not fully understood.
The solute carrier organic anion transporter family member 3A1 (SLCO3A1) is one of the uptake transporters that belongs to the solute carrier family [21]. Research revealed that a lower expression of SLCO3A1 inhibits the transmembrane transport of E1S to decrease the proliferation of breast cancer cells [22]. Notably, the SLCO3A1 has been demonstrated to regulate the proliferation and apoptosis of ovarian GCs in rats with PCOS [23], indicating the potential function of SLCO3A1 in follicular growth. Unfortunately, the specific mechanisms by which SLCO3A1 is medicated by DNMTs involve the follicular growth via regulating the proliferation and apoptosis of GCs, which remains to be further explored.
Hence, we aimed to investigate how DNMTs regulate the expression of SLCO3A1 to modulate the biological function of GCs and the growth of follicles. In this study, we found that the knockdown of DNMT1 could regulate chromatin accessibility, increase the level of SLCO3A1 to inhibit the apoptosis of GCs, and it could also induce proliferation by promoting the cycle progression of GCs. Moreover, SLCO3A1 facilitated E2 secretion to regulate follicular growth. These results might provide a therapeutic strategy for treating female reproductive disorders.

2. Results

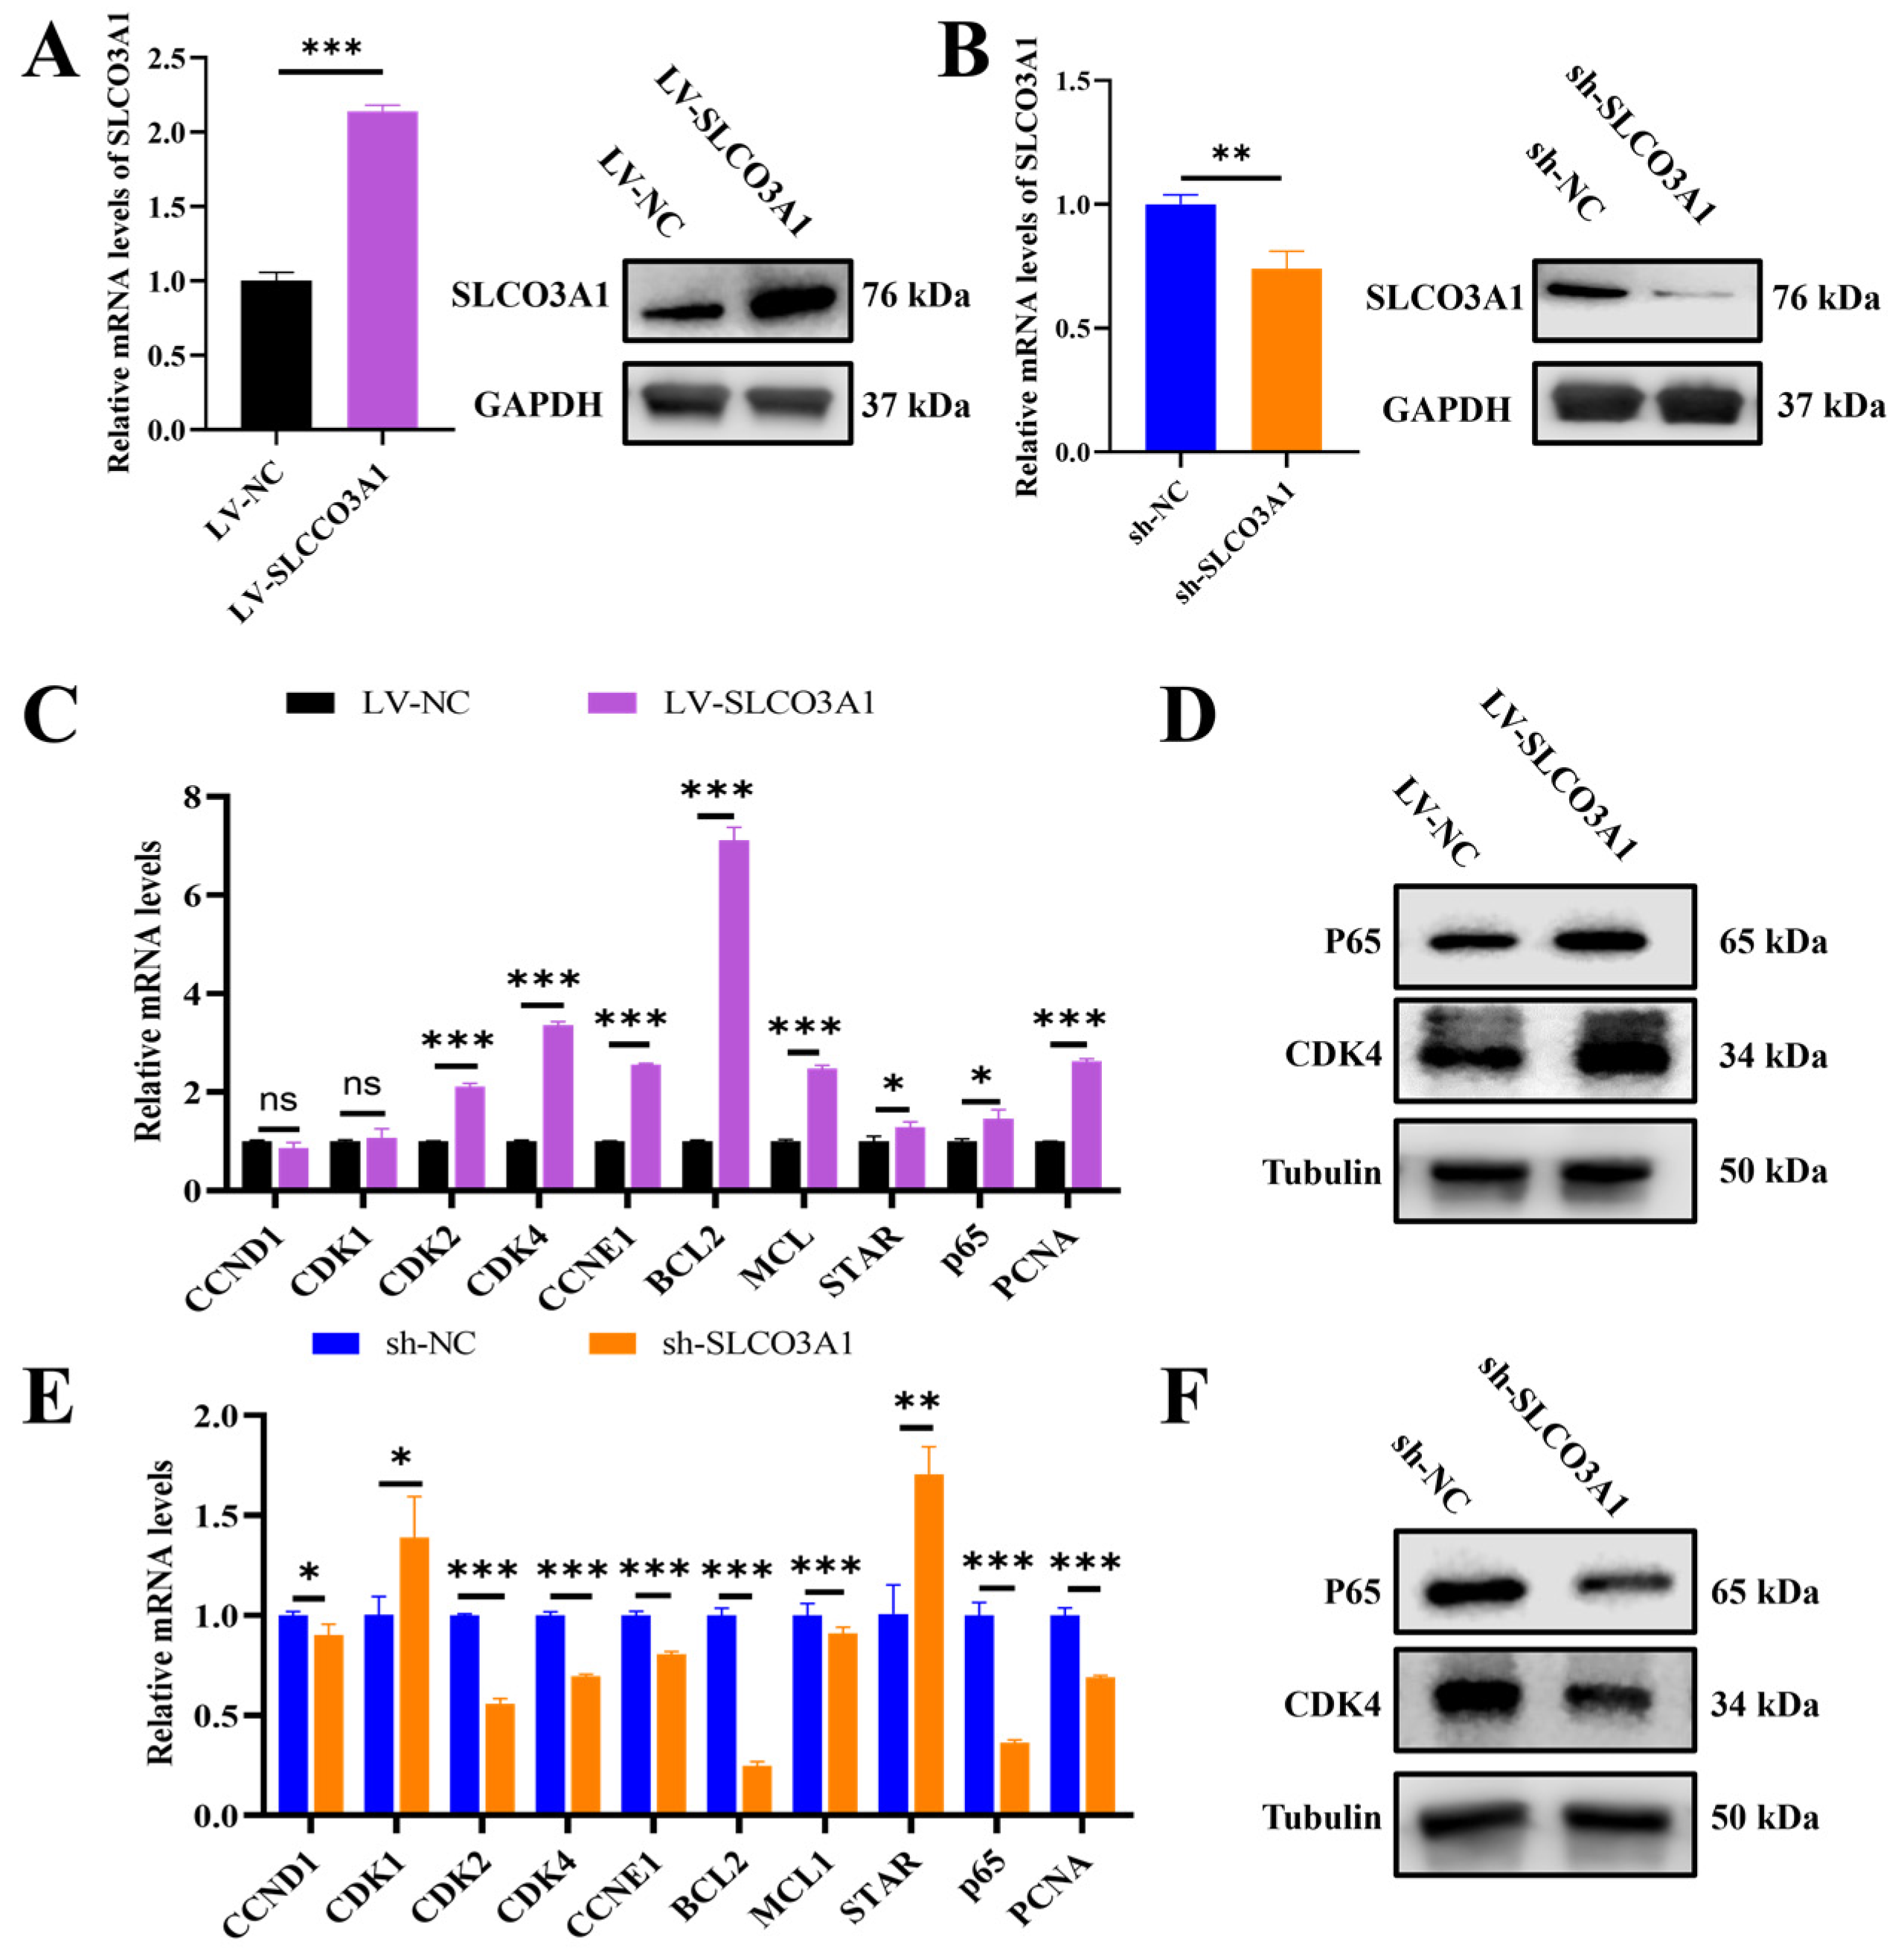
2.1. SLCO3A1 Promotes the Proliferation of GCs

To investigate the impact of SLCO3A1 on the proliferation of GCs, empty plasmids (named OE-NC), overexpression plasmids of SLCO3A1 (named OE-SLCO3A1), small interfering RNA (siRNA) of NC (named KD-NC) and siRNAs of SLCO3A1 (named KD-SLCO3A1) were transfected into COV434 cells. The mRNA and protein levels of SLCO3A1 were significantly upregulated by OE-SLCO3A1 treatment compared to OE-NC (Figure 1A,B), and 0.5 ng/μL of OE-SLCO3A1 was chosen for subsequent experiments. We found that the mRNA and protein levels of SLCO3A1 were significantly reduced by KD-SLCO3A1 (siRNA#1, siRNA#2, siRNA#3) treatment compared to KD-NC (Figure 1C,D) in the GCs. And we used 50 nM of siRNA#3 for subsequent experiments. The 5-Ethynyl-2′-deoxyuridine (EdU) results showed that the proliferation rate of GCs was significantly increased by OE-SLCO3A1 treatment compared to OE-NC (Figure 1E), but it was significantly decreased by KD-SLCO3A1 treatment compared to KD-NC (Figure 1F). The mRNA and protein levels of proliferation-related genes (e.g., MCL1, PCNA, and STAR) were increased by OE-SLCO3A1 treatment compared to OE-NC. (Figure 1G,H). Meanwhile, the mRNA and protein levels of MCL1, PCNA, and STAR were decreased by KD-SLCO3A1 treatment compared to KD-NC (Figure 1I,J). Moreover, the mRNA and protein levels of FSHR were significantly increased by OE-SLCO3A1 treatment compared to OE-NC (Figure 1K,L), while the opposite result was found by KD-SLCO3A1 treatment (Figure 1M,N). These results suggested that SLCO3A1 promoted the proliferation of GCs.

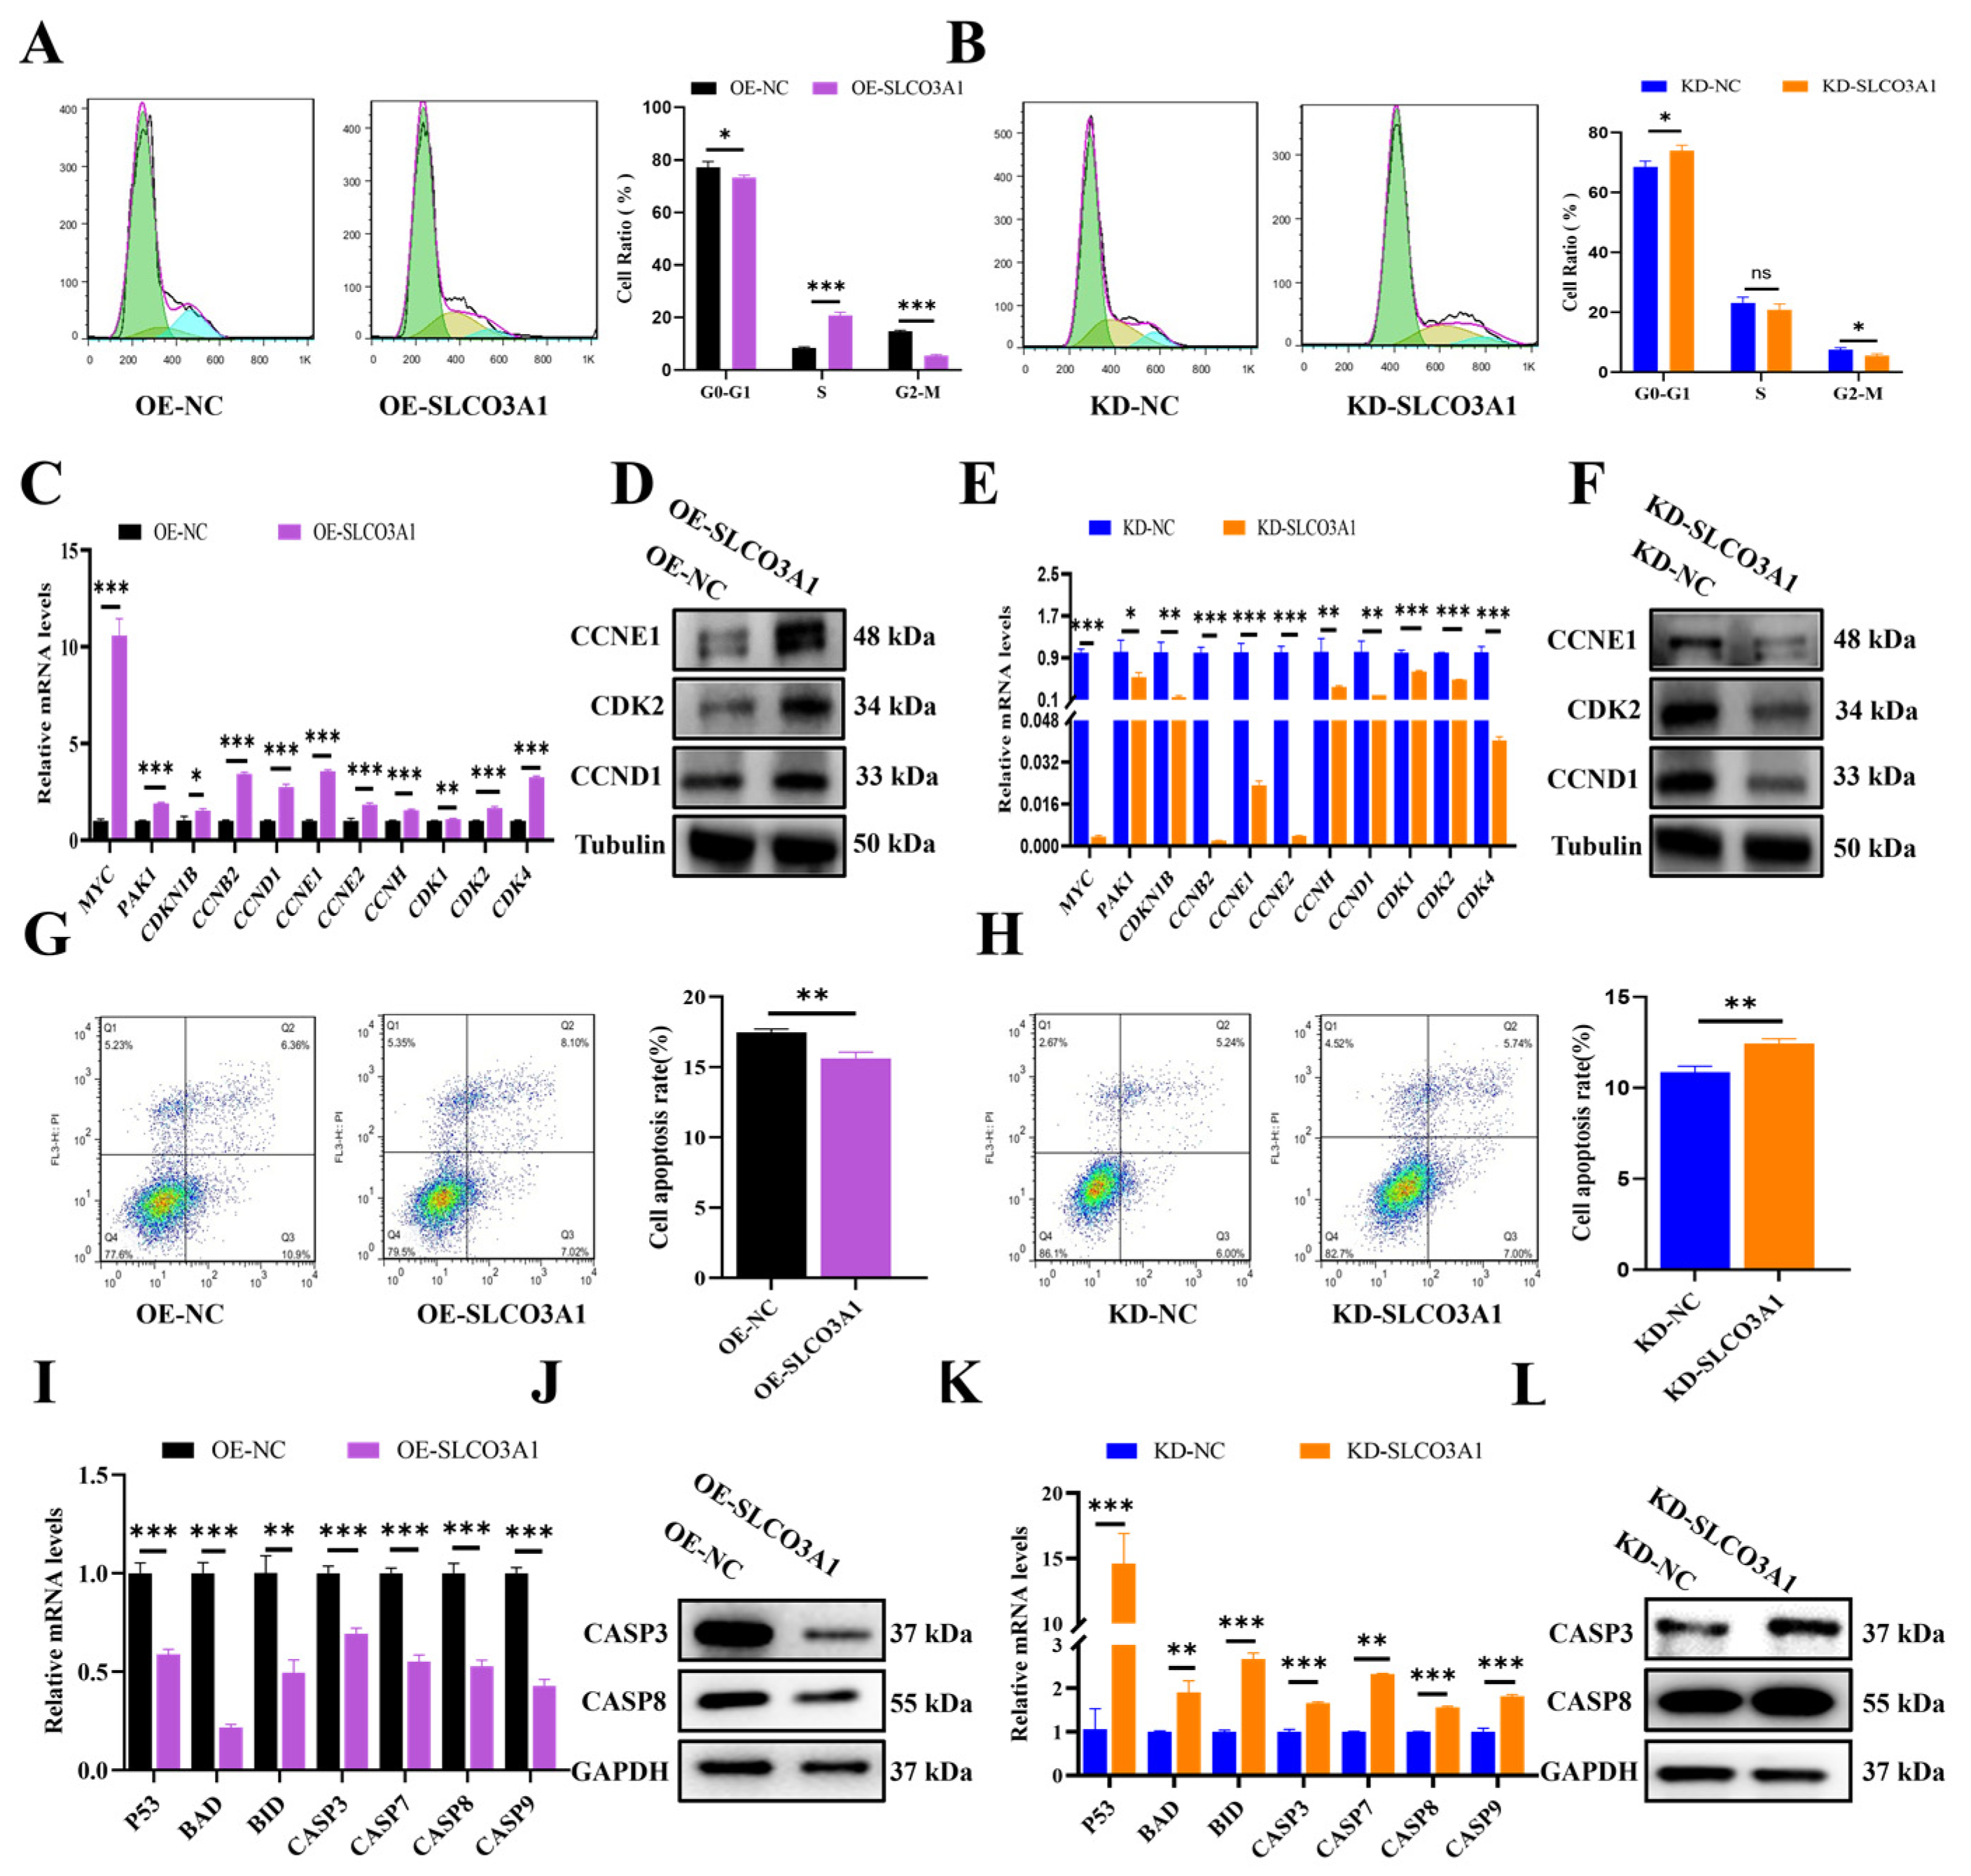
2.2. SLCO3A1 Promotes the Cell Cycle-Related Processes but Inhibits the Apoptosis of GCs

We next investigated the effects of SLCO3A1 on the cell cycle distribution and apoptosis of GCs. Flow cytometry results showed that the rate of G0-G1 phase cells was decreased by OE-SLCO3A1 treatment compared to OE-NC (Figure 2A), but it was increased by KD-SLCO3A1 treatment compared to KD-NC (Figure 2B) in the COV434 cells. The mRNA and protein levels of maker genes involved in the transition from G1 phase to S phase (e.g., CCNE1, CDK2, and CCND1) were increased by OE-SLCO3A1 treatment compared to OE-NC (Figure 3C,D), but the opposite results were found for KD-SLCO3A1 treatment (Figure 2E,F). The apoptosis rate of GCs was significantly decreased by OE-SLCO3A1 treatment compared to OE-NC (Figure 2G), while it was significantly increased by KD-SLCO3A1 treatment compared to KD-NC (Figure 2H). Furthermore, the mRNA and protein levels of pro-apoptotic genes (e.g., CASP3 and CASP8) were decreased by OE-SLCO3A1 treatment compared to OE-NC (Figure 2I,J). The mRNA and protein levels of CASP3 and CASP8 increased by KD-SLCO3A1 treatment compared to KD-NC (Figure 2K,L). Thus, it was concluded that SLCO3A1 facilitated the cell cycle-related processes and suppressed the apoptosis of GCs.

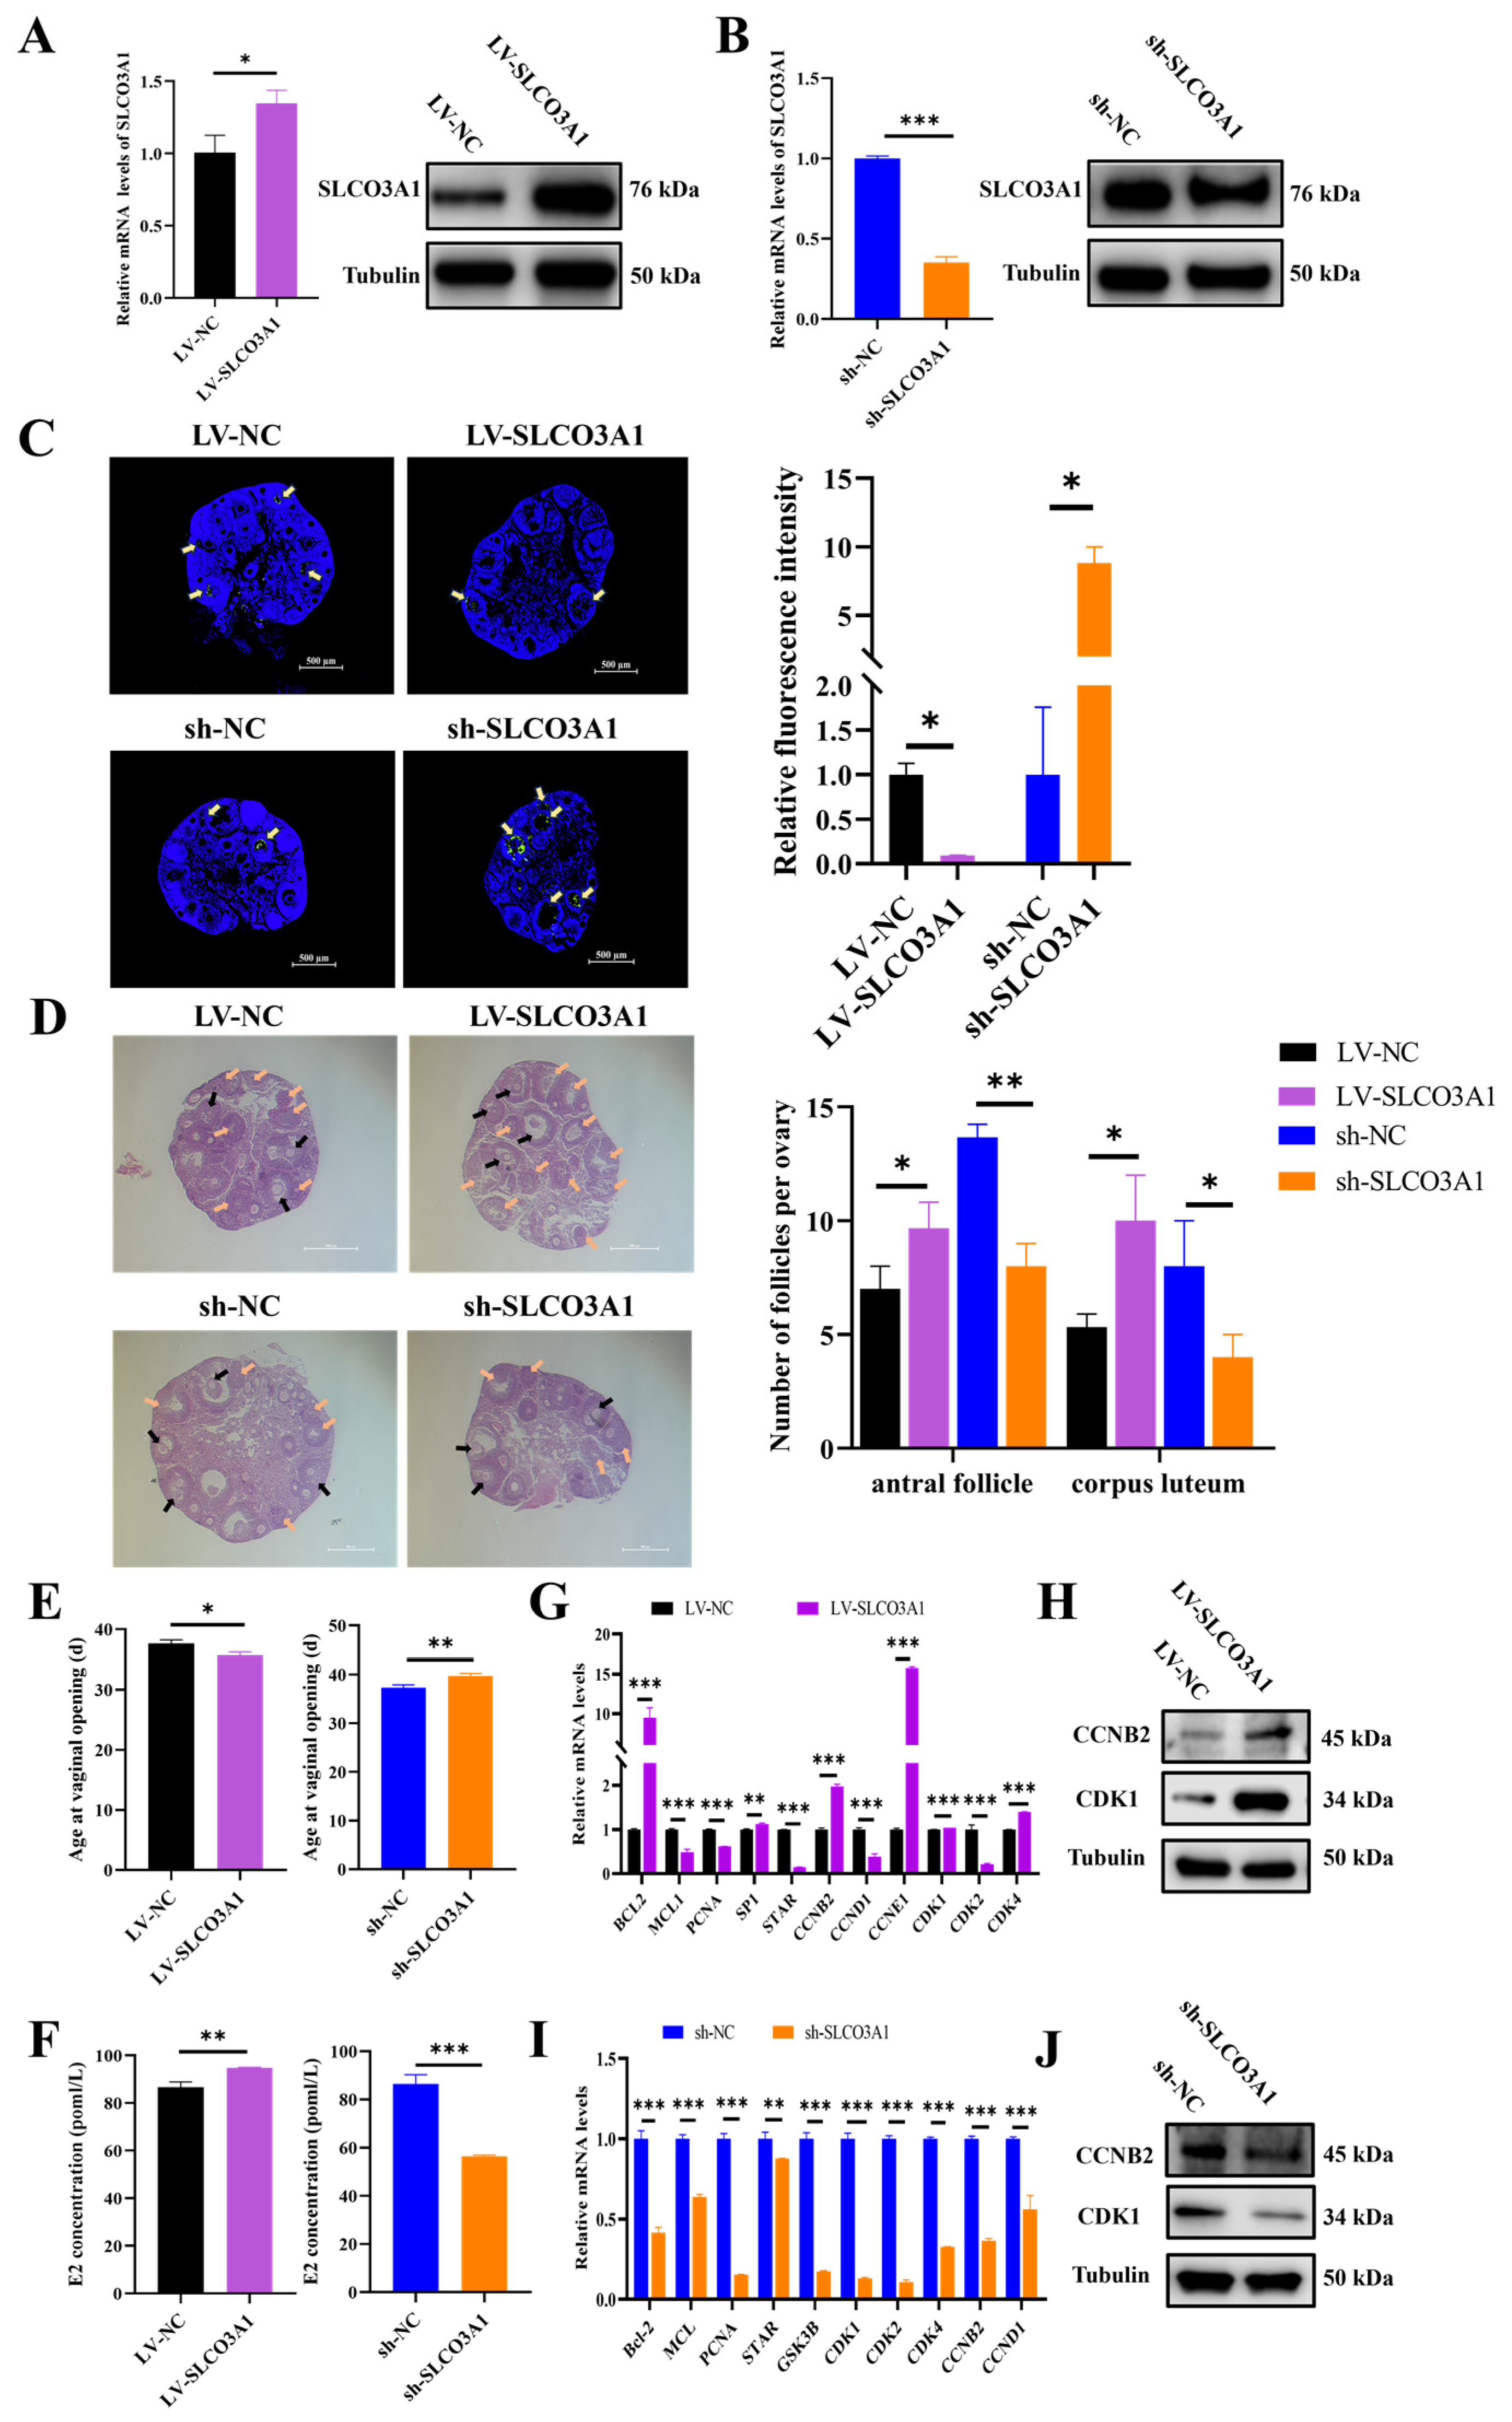
2.3. SLCO3A1 Promotes the Growth of Porcine Follicles

To further investigate the function of SLCO3A1 in follicular growth, the ovarian follicles of pigs were subjected to lentiviral-mediated treatments including control for overexpression (LV-NC), overexpression of SLCO3A1 (LV-SLCO3A1), control for knockdown (sh-NC), and knockdown of SLCO3A1 (sh-SLCO3A1). It was found that the mRNA and protein levels of SLCO3A1 were increased by LV-SLCO3A1 treatment compared to LV-NC (Figure 3A), but they were decreased by sh-SLCO3A1 treatment compared to sh-NC (Figure 3B). The mRNA and protein levels of CDK4 and P65 were significantly upregulated by LV-SLCO3A1 treatment compared to LV-NC (Figure 3C,D), while the opposite results were observed by sh-SLCO3A1 treatment (Figure 3E,F). Together, these data indicated that SLCO3A1 promoted follicular growth by promoting the proliferation of GCs.

2.4. SLCO3A1 Promotes the Follicular Growth in Mice

To further validate the role of SLCO3A1 in ovarian follicular growth, LV-NC, LV-SLCO3A1, sh-NC, or sh-SLCO3A1 were injected into the mice. Compared to LV-NC, the mRNA and protein levels of SLCO3A1 were elevated by LV-SLCO3A1 treatment (Figure 4A), while they decreased by sh-SLCO3A1 (Figure 4B). The terminal deoxynucleotidyl transferase mediated dUTP nick-end labeling (TUNEL) showed lower green fluorescence intensity with LV-SLCO3A1 treatment compared to LV-NC, but the fluorescence was higher with sh-SLCO3A1 treatment (Figure 4C). The hematoxylin and eosin (HE) staining showed that the number of antral follicles and corpus luteum were increased by LV-SLCO3A1 treatment compared to LV-NC, while this number was decreased by sh-SLCO3A1 treatment compared to sh-NC (Figure 4D). A previous study shows that the vaginal opening indicates that mice are in the estrus stage [24], and the age of mice at vaginal opening was earlier by LV-SLCO3A1 treatment compared to LV-NC, but it was significantly delayed by sh-SLCO3A1 treatment compared to sh-NC (Figure 4E). The E2 level was significantly elevated by LV-SLCO3A1 treatment compared to LV-NC, while it was significant inhibited by sh-SLCO3A1 treatment compared to sh-NC in serum (Figure 4F). The mRNA and protein levels of CCNB2 and CDK1 were increased by LV-SLCO3A1 treatment compared to LV-NC (Figure 4G,H), while they declined by sh-SLCO3A1 treatment (Figure 4I,J). These results suggested that SLCO3A1 promoted the follicular maturation and eventually facilitated the ovulation and luteinization by inhibiting the apoptosis of GCs and promoting the secretion of E2 in mice.

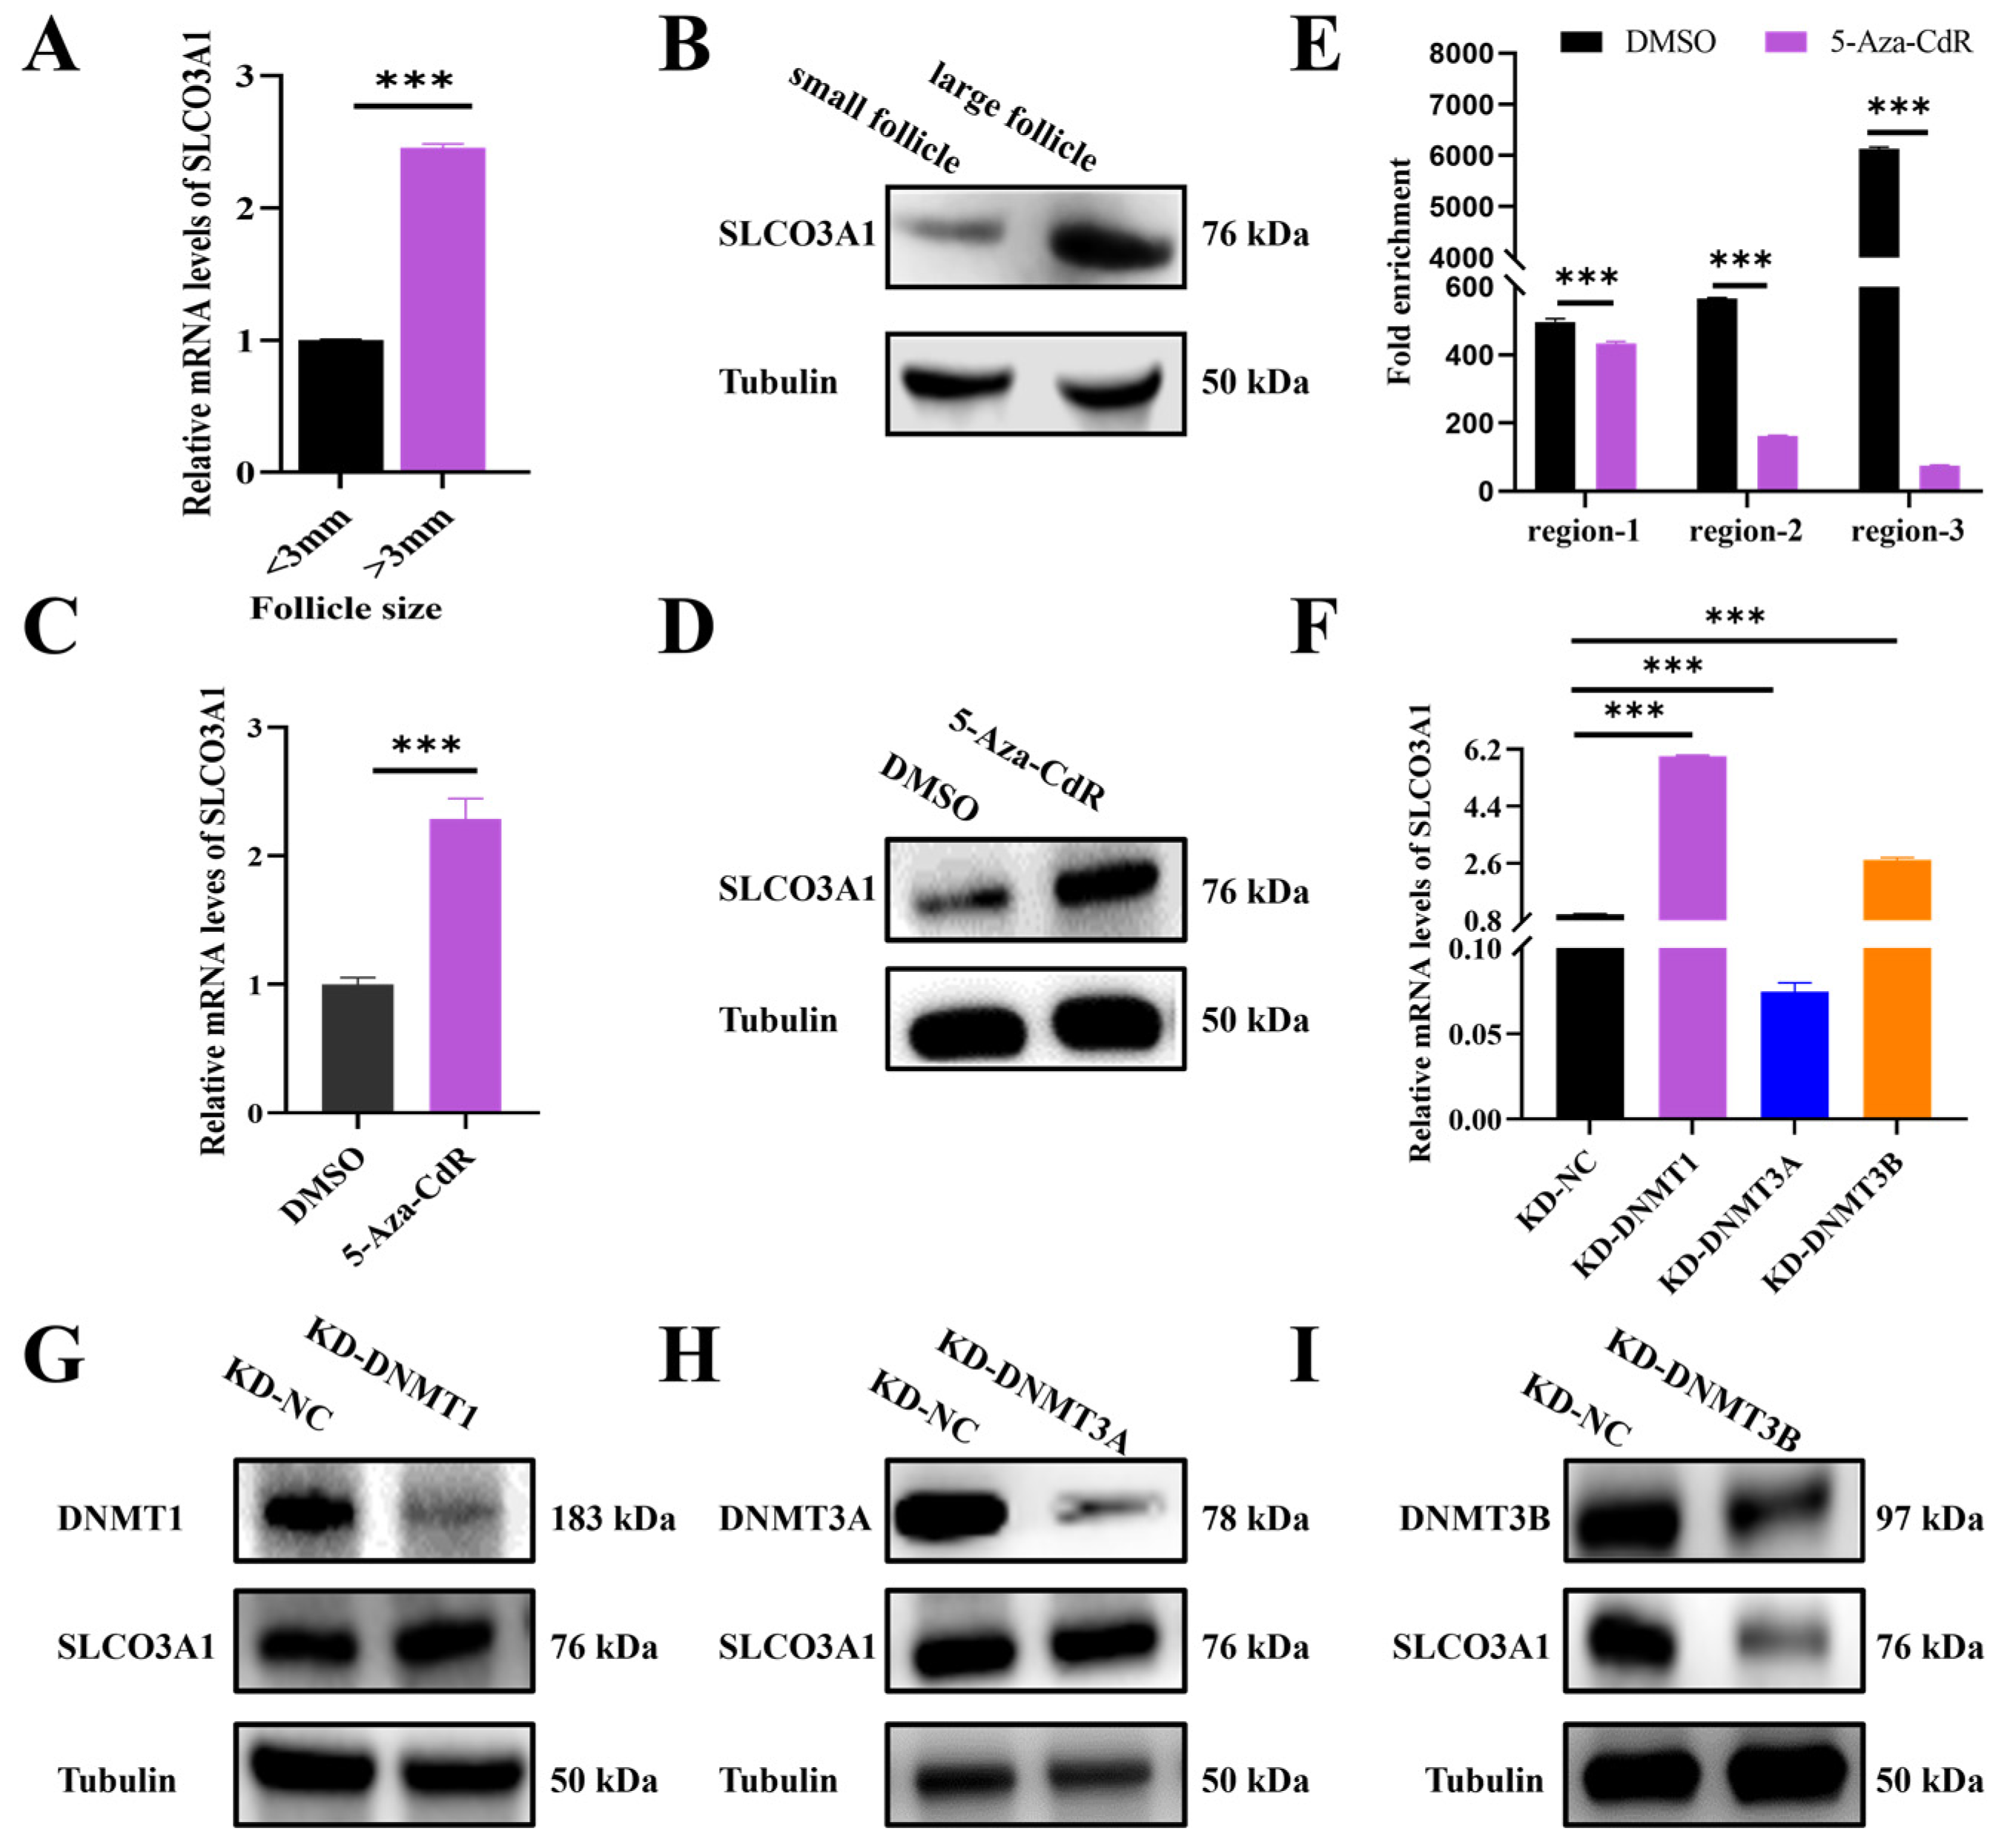
2.5. Knockdown of DNMT1 Upregulates the mRNA and Protein Levels of SLCO3A1

To investigate the regulation of SLCO3A1 by DNMTs in follicular growth, the expression of SLCO3A1 in the small (<3 mm in diameter) and large (>3 mm in diameter) follicles of pigs was detected. We found that the mRNA and protein levels of SLCO3A1 in the large follicles were significantly higher than that in the small follicles (Figure 5A,B). Moreover, the mRNA and protein levels of SLCO3A1 were increased by 5-Aza-CdR treatment compared to DMSO (Figure 5C,D). We found that the chromatin accessibilities of region-1, region-2, and region-3 were significantly reduced in the 5-Aza-CdR treated-cells (Figure 5E). The siRNAs of DNMT1, DNMT3A, or DNMT3B (named KD-DNMT1, KD-DNMT3A, and KD-DNMT3B, respectively) were transfected into GCs. Both mRNA and protein levels of SLCO3A1 displayed insignificant changes by KD-DNMT3A or KD-DNMT3B treatment (Figure 5F,H,I). But the mRNA and protein levels of SLCO3A1 increased by KD-DNMT1 treatment (Figure 5F,G). These results demonstrated that the knockdown of DNMT1 likely enhanced the mRNA and protein levels of SLCO3A1 by regulating the chromatin accessibility.

3. Discussion

In recent years, the incidence of female reproductive disorders, such as PCOS, endometriosis, and diminished ovarian reserve, have been increasing, which is a serious threat to women’s health and fertility [25]. Follicular growth can be delayed due to a decreased proliferation of GCs and increased apoptosis of GCs, which are thought to play essential roles in the pathogenesis of female reproductive diseases [5,26,27]. However, there is no effective therapy for these disorders, and the specific mechanisms regulating follicular growth remain to be further explored. In the present study, we confirmed that the knockdown of DNMT1 upregulated the level of SLCO3A1, resulted in an enhanced proliferation of GCs, increased E2 secretion, and inhibited the apoptosis of GCs, ultimately promoting follicular growth. Targeting SLCO3A1 may be a new strategy for the clinical management of female reproductive disorders.
To explore the biological functions of SLCO3A1 on the survival of GCs, the overexpression (Figure 1A,B) or knockdown (Figure 1C,D) of SLCO3A1 was achieved in GCs. Accumulating studies have shown that the proliferation of GCs is an essential condition that must be present to ensure proper follicular growth [28,29,30]. The findings in the present study suggested that SLCO3A1 promoted GCs proliferation by upregulating PCNA, MCL1, and STAR at the mRNA and protein levels (Figure 1E–J). PCNA promotes the proliferation of GCs and improves follicular growth in PCOS rats [31]. In general, cell proliferation and the cell cycle are closely connected [32]. SLCO3A1 upregulated the expression of CCND1, CCNE1, and CDK2, which indicated that SLCO3A1 could promote proliferation by facilitating cell cycle progression (Figure 2A–F). CCND1 and CCNE1 are crucial regulators of the cell cycle, controlling the G1/S transition [33], which could promote the proliferation of GCs [18]. Excessive apoptosis of GCs contributes to follicular atresia [34]. Our results indicated that SLCO3A1 inhibited apoptosis by downregulating the mRNA and protein levels of CASP3 and CASP8 (Figure 2G–L). CASP3 and CASP8 are known pro-apoptotic genes that have been reported to promote the apoptosis of GCs in patients with PCOS [35,36]. We found that the expression of SLCO3A1 in the large follicles was significantly higher than that in the small follicles (Figure 5A,B). These suggested that SLCO3A1 might play a pivotal role as a promoting gene during follicular growth.
To further investigate the function of SLCO3A1, we successfully achieved the overexpression (Figure 3A) or knockdown (Figure 3B) of SLCO3A1 by lentiviral infection using porcine follicles as a model. Our results indicated that SLCO3A1 promoted proliferation by upregulating the mRNA and protein levels of P65 and CDK4 (Figure 3C–F). P65 and CDK4 were reported to promote the cell proliferation of GCs [37].
Referring to previous research methods [20,38], we altered the expression of SLCO3A1 by an intraperitoneal injection of lentivirus in the ovaries of mice (Figure 4A,B). Our findings indicated that SLCO3A1 upregulated the expression of ESR1, ESR2 and FSHR (Figure 1K–N) as well as promoted E2 secretion (Figure 4F). Moreover, we found that SLCO3A1 inhibited the apoptosis of GCs (Figure 4C), promoted the formation of antral follicles and corpora lutea (Figure 4D), and accelerated vaginal opening in mice (Figure 4E). Previous studies have demonstrated that SLCO3A1 mediates the transport of steroid hormones [39]. Based on these results, we speculated that SLCO3A1 regulated follicular growth through the transport of estrogen. Additionally, SLCO3A1 could promote the proliferation of GCs by upregulating CCNB2 and CDK1 at the mRNA and protein levels (Figure 4G–J). Our study has several limitations that should be considered. Firstly, the use of five mice per treatment group in the current study may limit the generalizability of our findings. Increasing the number of mice in future studies could enhance the robustness of conclusions. Secondly, the intraperitoneal injection of LV-SLCO3A1 and sh-SLCO3A1 might impact the function of other organs, which could influence the observed changes in the mouse ovaries. Future research could use the tissue-specific gene editing mouse models to more precisely investigate the role of SLCO3A1 in reproductive disorders. Thirdly, due to limitations in our experimental materials and methods, the number of atretic follicles was not quantified. It is better to count the number of atretic follicles to describe follicular growth.
DNMTs have been reported as a key regulator of follicular growth [40,41,42]. We found that the expression of SLCO3A1 was significantly increased in the GCs treated with 5-Aza-CdR (Figure 5C,D) [43,44,45]. But after 5-Aza-CdR treatment, a significant reduction in chromatin accessibility was observed in the promoter region of SLCO3A1 (Figure 5E), suggesting that changes of DNA methylation might be not in line with the changes of chromatin accessibility, and this appearance was consistent with previous findings [46]. This indicated that the process of modifying chromatin status through DNA demethylation for epigenetic regulation is intricate and merits further investigation. Moreover, our findings suggested that the mRNA and protein levels of SLCO3A1 were upregulated by KD-DNMT1 treatment (Figure 5G). This was in line with previous studies indicating that DNMT1 may alter the expression of genes in the GCs to affect follicular growth [18].
Our results showed that the knockdown of DNMT1 upregulated the level of SLCO3A1, promoted the proliferation of GCs, and inhibited the apoptosis of GCs, ultimately fostering follicular growth. These results suggested that DNMT1-mediated SLCO3A1 might serve as a potential therapeutic strategy for the diseases of follicular disorders.

4. Materials and Methods

4.1. Cells Experiments

The human ovarian granulosa cell line (COV434 cells) utilized in this study was obtained from the cell bank of the Guangdong Provincial Key Laboratory of Agricultural Animal Genome and Molecular Breeding (Guangzhou, China). GCs were cultured with Dulbecco’s modified Eagle’s medium (DMEM, Hyclone, Logan, UT, USA) basal medium containing 10% fetal bovine serum (FBS, Hyclone, Logan, UT, USA) and 1% penicillin–streptomycin (Hyclone, Logan, UT, USA), and they were incubated at 37 °C and 5% CO2. When the confluence of GCs reached 70–80%, the transient transfections of plasmids and oligonucleotides were performed using Lipofectamine ™ 3000 reagent (Invitrogen, Waltham, MA, USA). The plasmids included pcDNA3.1 (named OE-NC) and an overexpression plasmid of SLCO3A1 with pcDNA3.1 as the vector backbone (named OE-SLCO3A1). Oligonucleotides were sourced from Guangzhou Ruibo (Guangzhou, China), and the sequences are shown in Table 1. The RT-qPCR, WB, EdU and flow cytometry assays were performed at 48 h after cell transfection.

4.2. Animal Experiments

The vivo experiments were performed on C57BL/6J mice. The 3-week-old female C57BL/6J mice were bought from the Southern Medical University Laboratory Animal Center (Guangzhou, China). We randomly divided the mice into four groups (LV-NC, LV-SLCO3A1, sh-NC, sh-SLCO3A1) with 5 individuals in each group. The lentiviral vectors for the overexpression or knockdown of SLCO3A1 (LV-SLCO3A1 or sh-SLCO3A1) were synthesized by Guangzhou Dongze (Guangzhou, China). Mice were injected with lentiviral vectors at a dosage of 1 × 10⁷ TU through intraperitoneal injection after 3 days of adaptive feeding. Injections of lentiviral vectors were given once weekly for three weeks. Mice were sacrificed at 42 days of age.

4.3. Follicles Culture

Ovaries collected from commercial sows at local slaughterhouses were washed twice with phosphate-buffered saline (PBS) containing 1% penicillin–streptomycin, immersed in PBS, and transported back to the laboratory while maintaining a cold environment. After washing the ovaries with PBS in a sterile laboratory, follicles measuring 3–5 mm in diameter were removed from the ovaries using forceps and scalpels. The follicles were washed twice with medium (DMEM/F12 containing 1% penicillin-streptomycin), then individually placed into twenty-four-well plates with an appropriate volume of medium, and cultured in an incubator at 38.5 °C with 5% CO2.

4.4. RNA Isolation and Reverse Transcription-Quantitative PCR (RT-qPCR)

Total RNA from tissues and cells was extracted following the instructions provided in the RNAfast200 Total RNA Extraction Kit manual (Feijie, Shanghai, China). The purity and integrity of total RNA were detected using UV spectrophotometer (Thermo Fisher Scientific, Waltham, MA, USA). Afterwards, high-quality RNA was used for cDNA reverse transcription. The reaction system comprised 2 μL of 5× PrimeScript RT premix (TaKaRa, Tokyo, Japan) and ≤500 ng of total RNA, which was adjusted to a final volume of 10 μL with RNase-free H2O. Hieff ® qPCR SYBR Green Master Mix (2×) (YEASEN, Shanghai, China) and a CFX96 Touch Real-Time PCR system (Bio-Rad, Berkeley, CA, USA) were used to quantify the relative levels of mRNAs. GAPDH was selected as endogenous control, and the 2−ΔΔct method was applied for the analysis of expression level. All primers for RT-qPCR are listed in Table 2, Table 3 and Table 4. The reactions were performed in a total volume of 20 μL per sample, which included 10 μL of SYBR Green Master Mix, 0.6 μL of forward/reverse primer, 1 μL of diluted cDNA template and 7.8 μL of RNA-free water. The cycling conditions were as follows: a holding step at 95 °C for 10 min followed by 40 cycles of 15 s at 95 °C and 1 min at 60 °C.

4.5. Western Blot Analysis

Cells and tissues were lysed using RIPA (Bestbio, Shanghai, China) containing 1% Protease Inhibitor (Biosharp, Beijing, China) to obtain protein samples. The total protein concentration was determined using the BCA Protein Assay Kit (Biosharp, Beijing, China). Protein separation was performed by electrophoresis using Future PAGETM protein precast gels. The separated proteins were transferred to a polyvinylidene fluoride (PVDF) membrane using the eBlot™ L1 membrane converter (GenScript, Nanjing, China). The PVDF membranes were blocked with 5% skim milk powder for 2 h, which was followed by incubation in primary antibody diluent for 12 h. The primary antibodies used were anti-SLCO3A1 (A14276, ABclonal, 1:1000), anti-DNMT1 (DF7376, Affinity, 1:1000), anti-DNMT3A (DF7226, Affinity, 1:1000), anti-DNMT3B (AF5493, Affinity, 1:1000), anti-MCL1 (38113, Signalway, 1:1000), anti-PCNA (60097-1-Ig, Proteintech, 1:10,000), anti-STAR (bs-20387R, Bioss, 1:1000), anti-FSHR (22665-1-AP, Proteintech, 1:1000), anti-CCNE1 (AF4713, Affinity, 1:1000), anti-CDK2 (AF6237, Affinity, 1:1000), anti-CCND1 (AF0931, Affinity, 1:1000), anti-CASP3 (AF6311, Affinity, 1:1000), anti-CASP8 (AF6442, Affinity, 1:1000), anti-CASP9 (AF6348, Affinity, 1:1000), anti-β-Tubulin (10068-1-Ap, Proteintech, 1:1000), anti-GAPDH (YN5585, Immunowau, 1:5000), anti-P65 (10745-1-AP, Proteintech, 1:1000), anti-CDK4 (DF6102, Affinity, 1:1000), anti-CCNB2 (bs-6656R, Bioss, 1:1000), and anti-CDK1 (A0220, Abclonal, 1:1000). The horseradish peroxidase-conjugated goat anti-rabbit immunoglobulin G (IgG) (ab205718, abcam, 1:5000) and goat anti-mouse IgG (L3032-1, Signalway, 1:20,000) were used as the secondary antibodies. The PVDF membranes were incubated in the secondary antibody dilution for 1.5–2 h at room temperature. ECL development solution was added dropwise to the PVDF membrane, and on-line development was performed using a fully automated chemiluminescence image analysis system.

4.6. Proliferation Assay

The cell proliferation analysis was conducted using the Cell-Light™ EdU Apollo 567 In Vitro Kit (RiboBio, Guangzhou China). Cells were incubated with 50 μM EdU medium for 2 h, after which the medium was discarded. The cells were then washed twice with PBS for 5 min each time. Following this, cell fixative was added to each well, and the cells were incubated at room temperature for 15–30 min before being washed with PBS for 5 min. Osmolyte was added to each well, and permeabilization was performed for 8 min. Subsequently, the cells were washed with PBS for 5 min. Next, 1 × Apollo staining reaction solution was added to each well, and the cells were incubated for 30 min at room temperature with external foil covering. The cells were then washed with PBS for 5 min, and another round of permeabilization was conducted. DAPI reaction solution was added to each well, which was followed by a 30-min incubation at room temperature with foil covering. Finally, three randomly selected fields of view in each well were observed under a Nikon ECLIPSE Ti2 fluorescence microscope (Nikon, Tokyo, Japan), and images were captured.

4.7. Flow Cytometry Assay

The apoptosis rate was detected using an Annexin V-FITC/PI Apoptosis Detection Kit (BD, USA). The cells were collected and washed twice with PBS (Biosharp, Beijing, China), which was followed by gentle suspension in 500 μL of 1× Annexin V Buffer. Subsequently, 5 μL of Annexin V-FITC and 5 μL of propidium iodide staining solution was added to the cells, which were then incubated at 24 °C for 15 min while protected from light. The cell cycle distribution of granulosa cells (GCs) was determined using a cell cycle assay kit (KeyGEN, Nanjing, China). After collection and two washes with PBS, 500 μL of PI/RNase staining buffer was added to each tube of cell samples. The cells were gently resuspended and incubated for 15 min at 37 °C in the absence of light. Finally, the apoptosis rate and cell cycle distribution were analyzed by flow cytometry (BD, Franklin Lakes, NJ, USA) and Flowjo software (version 7.6).

4.8. HE Staining

The number of follicles and corpus luteum were detected by HE staining. The largest cross-section cut along the suspensory ligament of the ovary was stained with hematoxylin–eosin, and images were observed and acquired under a Nikon ECLIPSE Ti2 microscope (Nikon, Tokyo, Japan).

4.9. TUNEL Assay

The TUNEL method was used to detect apoptosis in mouse ovarian GCs. The sections were deparaffinized using xylene and dehydrated with anhydrous ethanol, which was followed by repair using DNase-free proteinase K. Subsequently, the sections were incubated with 50 μL of the TUNEL assay solution for 60 min at 37 °C while protected from light. After incubation, the sections were washed three times with PBS and then sealed using an anti-fluorescence quenching sealer before observation under a Nikon ECLIPSE Ti2 fluorescence microscope (Nikon, Tokyo, Japan).

4.10. Enzyme-Linked Immunosorbent Assay

The Mouse E2 ELISA kit (JM-02849 M2) from Jingmai Biotechnology Co., Ltd. (Jiangsu, China) was employed to determine the concentration of E2 in mouse serum. Specific operational instructions were followed as per the kit manual. The relevant reagents were equilibrated at room temperature for 20 min. Fifty microliters of different standard concentrations was added to the standard wells in the ELISA plate, while 50 μL of 5-fold diluted samples to be tested was added to the sample wells. Subsequently, 100 μL of horseradish peroxidase (HRP)-labeled detection antibody was added to each well, and the reaction wells were sealed with a membrane and incubated at 37 °C for 1 h. After discarding the liquid, each well was filled with washing solution and left to stand for 1 min with the washing step repeated 5 times. Chromogen solution A (50 μL) and chromogen solution B (50 μL) were added to each well, which was followed by incubation at 37 °C away from light for 15 min. Finally, 50 μL of stop solution was added to each well, and the optical density (OD) was read at 450 nm using a microtiter plate reader within 15 min.

4.11. Chromatin Accessibility Assay

The chromatin accessibility assay in this study was conducted using the EpiQuik™ Chromatin Accessibility Assay Kit (EPIGENTEK, Farmingdale, NY, USA) following the manufacturer’s instructions. Granulosa cells (GCs) were collected and suspended in 1 × lysis buffer. The cell suspension was divided into sample and No-Nse control groups. Both groups were incubated on ice, which was followed by vortexing and centrifugation to remove the supernatant. The chromatin was washed with 1 mL 1 × wash buffer at 4 °C and centrifuged to discard the supernatant. Subsequently, NDB and Nse were added to the sample group, while the No-Nse control group was treated with NDB only. The Nse reaction mixture was added, which was followed by incubation of the chromatin pellet under specified conditions. DNA was eluted from the binding columns using elution solution (ES) and centrifugation. We designed three primer pairs in the promoter region of SLOC3A1 (region-1, 282 bp, +971/+1252 bp, region-2, 125 bp, +1433/+1557 bp, and region-3, 209 bp, +1623/+1831 bp, transcription start site = +2000, Table 5). Hieff ® qPCR SYBR Green Master Mix and a CFX96 Touch Real-Time PCR system were used to measure the amplification efficiency. The reaction volume was consistent with that of the RT-qPCR reaction. Amplification programs were performed using a two-step method: pre-denaturation at 95 °C for 10 min, which was followed by 40 cycles including denaturation at 95 °C for 15 s and annealing/extension at 60 °C for 1 min. The fold enrichment (FE) in the SLCO3A1 promoter region was calculated using the formula FE = 2(Nse CT − no-Nse CT) × 100%.

4.12. Statistical Analysis

All statistical analyses were performed with GraphPad Prism software (version 9.0, Boston, MA, USA). The data were expressed as the mean ± SD from at least three independent experiments, and an independent samples t-test was used for numerical data. In all cases, * p < 0.05, ** p < 0.01, *** p < 0.001, ns p > 0.05.

5. Conclusions

Taken together, we found that the knockdown of DNMT1 upregulated the level of SLCO3A1, leading to a promoted proliferation of GCs, increased E2 secretion, and inhibited apoptosis of GCs, ultimately fostering follicular growth. This suggested that targeting SLCO3A1 could be a potential strategy for treating female reproductive diseases.

Author Contributions

S.L.: Formal analysis; investigation; validation; visualization; writing—original draft; writing—review and editing. L.Z.: Formal analysis; investigation; validation. F.M.: Investigation; validation. N.L.: Writing—review and editing. W.L.: Writing—review and editing. X.Z.: Writing—review and editing. Y.C.: Investigation. H.Q.: Writing—review and editing. Y.H.: Writing—review and editing. H.Z.: Funding acquisition; resources. J.L.: Funding acquisition; resources; supervision. X.Y.: Conceptualization; funding acquisition; project administration; resources; supervision; writing—review and editing. All authors have read and agreed to the published version of the manuscript.

Funding

This study was supported by grants from the Guangdong Basic and Applied Basic Research Foundation (2023A1515030054 and 2023A1515010364), the National Natural Science Foundation of China (31902131 and 32072694), the Earmarked fund for China Agriculture Research System (CARS-35), the Key R&D Program of Guangdong Province Project (2022B0202090002), and Breed Industry Innovation Park of Guangdong Xiaoerhua Pig (2022-4408X1-43010402-0019).

Institutional Review Board Statement

The Laboratory Animal Center of South China Agricultural University, 2022c059.

Informed Consent Statement

Not applicable.

Data Availability Statement

Data contained within the article.

Conflicts of Interest

The authors declare no conflicts of interest.

References

  1. Murase, T.; Iwase, A.; Komatsu, K.; Bayasula; Nakamura, T.; Osuka, S.; Takikawa, S.; Goto, M.; Kotani, T.; Kikkawa, F. Follicle Dynamics: Visualization and Analysis of Follicle Growth and Maturation Using Murine Ovarian Tissue Culture. J. Assist. Reprod. Genet. 2018, 35, 339–343. [Google Scholar] [CrossRef]
  2. Li, C.; Liu, Z.; Wu, G.; Zang, Z.; Zhang, J.-Q.; Li, X.; Tao, J.; Shen, M.; Liu, H. FOXO1 Mediates Hypoxia-Induced G0/G1 Arrest in Ovarian Somatic Granulosa Cells by Activating the TP53INP1-P53-CDKN1A Pathway. Development 2021, 148, dev199453. [Google Scholar] [CrossRef] [PubMed]
  3. Zeng, X.; Xie, Y.; Liu, Y.; Long, S.; Mo, Z. Polycystic Ovarian Syndrome: Correlation between Hyperandrogenism, Insulin Resistance and Obesity. Clin. Chim. Acta 2020, 502, 214–221. [Google Scholar] [CrossRef] [PubMed]
  4. Park, E.; Cockrem, J.F.; Han, K.-H.; Kim, D.-H.; Jung, M.-H.; Chu, J.-P. Stress-Induced Activation of Ovarian Heat Shock Protein 90 in a Rat Model of Polycystic Ovary Syndrome. J. Obstet. Gynaecol. Res. 2012, 38, 396–407. [Google Scholar] [CrossRef] [PubMed]
  5. Fan, W.; Yuan, Z.; Li, M.; Zhang, Y.; Nan, F. Decreased Oocyte Quality in Patients with Endometriosis Is Closely Related to Abnormal Granulosa Cells. Front. Endocrinol. 2023, 14, 1226687. [Google Scholar] [CrossRef]
  6. Hipp, H.S.; Kawwass, J.F. Discordant Ovarian Reserve Testing: What Matters Most? Fertil. Steril. 2019, 112, 34. [Google Scholar] [CrossRef] [PubMed]
  7. Matsuda, F.; Inoue, N.; Manabe, N.; Ohkura, S. Follicular Growth and Atresia in Mammalian Ovaries: Regulation by Survival and Death of Granulosa Cells. J. Reprod. Dev. 2012, 58, 44–50. [Google Scholar] [CrossRef] [PubMed]
  8. Skinner, M.K. Regulation of Primordial Follicle Assembly and Development. Human Reprod. Update 2005, 11, 461–471. [Google Scholar] [CrossRef]
  9. Vendola, K.; Zhou, J.; Wang, J.; Famuyiwa, O.A.; Bievre, M.; Bondy, C.A. Androgens Promote Oocyte Insulin-Like Growth Factor I Expression and Initiation of Follicle Development in the Primate Ovary1. Biol. Reprod. 1999, 61, 353–357. [Google Scholar] [CrossRef]
  10. Gougeon, A. Regulation of Ovarian Follicular Development in Primates: Facts and Hypotheses. Endocr. Rev. 1996, 17, 121–155. [Google Scholar] [CrossRef]
  11. Grant, S.A.; Hunter, M.G.; Foxcroft, G.R. Morphological and Biochemical Characteristics during Ovarian Follicular Development in the Pig. J. Reprod. Fertil. 1989, 86, 171–183. [Google Scholar] [CrossRef] [PubMed]
  12. Guthrie, H.D.; Cooper, B.S.; Welch, G.R.; Zakaria, A.D.; Johnson, L.A. Atresia in Follicles Grown after Ovulation in the Pig: Measurement of Increased Apoptosis in Granulosa Cells and Reduced Follicular Fluid Estradiol-17 Beta. Biol. Reprod. 1995, 52, 920–927. [Google Scholar] [CrossRef] [PubMed]
  13. Veazey, K.J.; Wang, H.; Bedi, Y.S.; Skiles, W.M.; Chang, R.C.-A.; Golding, M.C. Disconnect between Alcohol-Induced Alterations in Chromatin Structure and Gene Transcription in a Mouse Embryonic Stem Cell Model of Exposure. Alcohol 2017, 60, 121–133. [Google Scholar] [CrossRef] [PubMed]
  14. Bernstein, B.E.; Meissner, A.; Lander, E.S. The Mammalian Epigenome. Cell 2007, 128, 669–681. [Google Scholar] [CrossRef] [PubMed]
  15. Goldberg, A.D.; Allis, C.D.; Bernstein, E. Epigenetics: A Landscape Takes Shape. Cell 2007, 128, 635–638. [Google Scholar] [CrossRef]
  16. LaVoie, H.A. Epigenetic Control of Ovarian Function: The Emerging Role of Histone Modifications. Mol. Cell. Endocrinol. 2005, 243, 12–18. [Google Scholar] [CrossRef]
  17. Pan, Z.; Zhang, J.; Li, Q.; Li, Y.; Shi, F.; Xie, Z.; Liu, H. Current Advances in Epigenetic Modification and Alteration during Mammalian Ovarian Folliculogenesis. J. Genet. Genom. 2012, 39, 111–123. [Google Scholar] [CrossRef]
  18. Zhou, X.; He, Y.; Li, N.; Bai, G.; Pan, X.; Zhang, Z.; Zhang, H.; Li, J.; Yuan, X. DNA Methylation Mediated RSPO2 to Promote Follicular Development in Mammals. Cell Death Dis. 2021, 12, 653. [Google Scholar] [CrossRef]
  19. Han, C.; Wei, Y.; Geng, Y.; Cui, Y.; Li, S.; Bao, Y.; Shi, W. Bisphenol A in Utero Exposure Induces Ovary Dysfunction in Mice Offspring and the Ameliorating Effects of Cuscuta Chinensis Flavonoids. Environ. Sci. Pollut. Res. Int. 2020, 27, 31357–31368. [Google Scholar] [CrossRef]
  20. Zhou, X.; He, Y.; Pan, X.; Quan, H.; He, B.; Li, Y.; Bai, G.; Li, N.; Zhang, Z.; Zhang, H.; et al. DNMT1-Mediated lncRNA IFFD Controls the Follicular Development via Targeting GLI1 by Sponging miR-370. Cell Death Differ. 2023, 30, 576–588. [Google Scholar] [CrossRef]
  21. Adachi, H.; Suzuki, T.; Abe, M.; Asano, N.; Mizutamari, H.; Tanemoto, M.; Nishio, T.; Onogawa, T.; Toyohara, T.; Kasai, S.; et al. Molecular Characterization of Human and Rat Organic Anion Transporter OATP-D. Am. J. Physiol. Ren. Physiol. 2003, 285, F1188–F1197. [Google Scholar] [CrossRef]
  22. Nozawa, T.; Suzuki, M.; Yabuuchi, H.; Irokawa, M.; Tsuji, A.; Tamai, I. Suppression of Cell Proliferation by Inhibition of Estrone-3-Sulfate Transporter in Estrogen-Dependent Breast Cancer Cells. Pharm. Res. 2005, 22, 1634–1641. [Google Scholar] [CrossRef]
  23. Yi, W.; Li, X.; Chen, K.; Li, J.; Chen, K.; Pan, A. Effect of rNA Interference on Oatp3a1 Gene Expression on Biological Characteristics and Immune Factors of Ovarian Granulosa Cells in Rats with PCOS. Am. J. Transl. Res. 2020, 12, 4659–4668. [Google Scholar]
  24. Byers, S.L.; Wiles, M.V.; Dunn, S.L.; Taft, R.A. Mouse Estrous Cycle Identification Tool and Images. PLoS ONE 2012, 7, e35538. [Google Scholar] [CrossRef]
  25. Zhang, Q.; Lei, Y.; Deng, Y.; Ma, R.; Ding, X.; Xue, W.; Sun, A. Treatment Progress in Diminished Ovarian Reserve: Western and Chinese Medicine. Chin. J. Integr. Med. 2023, 29, 361–367. [Google Scholar] [CrossRef]
  26. Zhao, J.; Xu, J.; Wang, W.; Zhao, H.; Liu, H.; Liu, X.; Liu, J.; Sun, Y.; Dunaif, A.; Du, Y.; et al. Long Non-Coding RNA LINC-01572:28 Inhibits Granulosa Cell Growth via a Decrease in P27 (Kip1) Degradation in Patients with Polycystic Ovary Syndrome. EBioMedicine 2018, 36, 526–538. [Google Scholar] [CrossRef]
  27. Geng, X.; Zhao, J.; Huang, J.; Li, S.; Chu, W.; Wang, W.-S.; Chen, Z.-J.; Du, Y. Lnc-MAP3K13-7:1 Inhibits Ovarian GC Proliferation in PCOS via DNMT1 Downregulation-Mediated CDKN1A Promoter Hypomethylation. Mol. Ther. 2021, 29, 1279–1293. [Google Scholar] [CrossRef]
  28. Maalouf, S.W.; Liu, W.S.; Pate, J.L. MicroRNA in Ovarian Function. Cell Tissue Res. 2016, 363, 7–18. [Google Scholar] [CrossRef]
  29. Emmen, J.M.A.; Couse, J.F.; Elmore, S.A.; Yates, M.M.; Kissling, G.E.; Korach, K.S. In Vitro Growth and Ovulation of Follicles from Ovaries of Estrogen Receptor (ER)α and ERβ Null Mice Indicate a Role for ERβ in Follicular Maturation. Endocrinology 2005, 146, 2817–2826. [Google Scholar] [CrossRef]
  30. Khristi, V.; Chakravarthi, V.P.; Singh, P.; Ghosh, S.; Pramanik, A.; Ratri, A.; Borosha, S.; Roby, K.F.; Wolfe, M.W.; Rumi, M.A.K. ESR2 Regulates Granulosa Cell Genes Essential for Follicle Maturation and Ovulation. Mol. Cell Endocrinol. 2018, 474, 214–226. [Google Scholar] [CrossRef]
  31. Zhang, S.; Tu, H.; Zhu, J.; Liang, A.; Huo, P.; Shan, K.; He, J.; Zhao, M.; Chen, X.; Lei, X. Dendrobium Nobile Lindl. Polysaccharides Improve Follicular Development in PCOS Rats. Int. J. Biol. Macromol. 2020, 149, 826–834. [Google Scholar] [CrossRef] [PubMed]
  32. Alenzi, F.Q.B. Links between Apoptosis, Proliferation and the Cell Cycle. Br. J. Biomed. Sci. 2004, 61, 99–102. [Google Scholar] [CrossRef] [PubMed]
  33. Farshadi, E.; van der Horst, G.T.J.; Chaves, I. Molecular Links between the Circadian Clock and the Cell Cycle. J. Mol. Biol. 2020, 432, 3515–3524. [Google Scholar] [CrossRef] [PubMed]
  34. Peng, S.-L.; Wu, Q.-F.; Xie, Q.; Tan, J.; Shu, K.-Y. PATL2 Regulated the Apoptosis of Ovarian Granulosa Cells in Patients with PCOS. Gynecol. Endocrinol. 2021, 37, 629–634. [Google Scholar] [CrossRef]
  35. Gong, Y.; Luo, S.; Fan, P.; Zhu, H.; Li, Y.; Huang, W. Growth Hormone Activates PI3K/Akt Signaling and Inhibits ROS Accumulation and Apoptosis in Granulosa Cells of Patients with Polycystic Ovary Syndrome. Reprod. Biol. Endocrinol. 2020, 18, 121. [Google Scholar] [CrossRef]
  36. Honnma, H.; Endo, T.; Henmi, H.; Nagasawa, K.; Baba, T.; Yamazaki, K.; Kitajima, Y.; Hayashi, T.; Manase, K.; Saito, T. Altered Expression of Fas/Fas Ligand/Caspase 8 and Membrane Type 1-Matrix Metalloproteinase in Atretic Follicles within Dehydroepiandrosterone-Induced Polycystic Ovaries in Rats. Apoptosis 2006, 11, 1525–1533. [Google Scholar] [CrossRef]
  37. Yuan, X.; Li, Z.; Kong, Y.; Zhong, Y.; He, Y.; Zhang, A.; Zhou, X.; Jiang, Y.; Zhang, Z.; Zhang, H.; et al. P65 Targets FGFR1 to Regulate the Survival of Ovarian Granulosa Cells. Cells 2019, 8, 1334. [Google Scholar] [CrossRef]
  38. Li, N.; Zhou, Y.; Cai, J.; Wang, Y.; Zhou, X.; Hu, M.; Li, Y.; Zhang, H.; Li, J.; Cai, B.; et al. A Novel Trans-Acting lncRNA of ACTG1 That Induces the Remodeling of Ovarian Follicles. Int. J. Biol. Macromol. 2023, 242, 125170. [Google Scholar] [CrossRef]
  39. Plaza-Parrochia, F.; Poblete, C.; Gabler, F.; Carvajal, R.; Romero, C.; Valladares, L.; Vega, M. Expression of Steroid Sulfated Transporters and 3β-HSD Activity in Endometrium of Women Having Polycystic Ovary Syndrome. Steroids 2015, 104, 189–195. [Google Scholar] [CrossRef]
  40. Guo, X.; Puttabyatappa, M.; Thompson, R.C.; Padmanabhan, V. Developmental Programming: Contribution of Epigenetic Enzymes to Antral Follicular Defects in the Sheep Model of PCOS. Endocrinology 2019, 160, 2471–2484. [Google Scholar] [CrossRef]
  41. Fang, Y.; Deng, S.; Zhang, J.; Liu, H.; Li, Y.; Zhang, X.; Liu, Y. Melatonin-Mediated Development of Ovine Cumulus Cells, Perhaps by Regulation of DNA Methylation. Molecules 2018, 23, 494. [Google Scholar] [CrossRef] [PubMed]
  42. He, Z.-Y.; Wang, H.-Y.; Zhou, X.; Liang, X.-Y.; Yan, B.; Wang, R.; Ma, L.-H.; Wang, Y.-L. Evaluation of Vitrification Protocol of Mouse Ovarian Tissue by Effect of DNA Methyltransferase-1 and Paternal Imprinted Growth Factor Receptor-Binding Protein 10 on Signaling Pathways. Cryobiology 2018, 80, 89–95. [Google Scholar] [CrossRef] [PubMed]
  43. do Amaral, G.C.L.S.; Planello, A.C.; Borgato, G.; de Lima, D.G.; Guimarães, G.N.; Marques, M.R.; de Souza, A.P. 5-Aza-CdR Promotes Partial MGMT Demethylation and Modifies Expression of Different Genes in Oral Squamous Cell Carcinoma. Oral Surg. Oral Med. Oral Pathol. Oral Radiol. 2019, 127, 425–432. [Google Scholar] [CrossRef]
  44. Nikbakht Dastjerdi, M.; Azarnezhad, A.; Hashemibeni, B.; Salehi, M.; Kazemi, M.; Babazadeh, Z. An Effective Concentration of 5-Aza-CdR to Induce Cell Death and Apoptosis in Human Pancreatic Cancer Cell Line through Reactivating RASSF1A and Up-Regulation of Bax Genes. Iran. J. Med. Sci. 2018, 43, 533–540. [Google Scholar]
  45. Baylin, S.B.; Herman, J.G. DNA Hypermethylation in Tumorigenesis: Epigenetics Joins Genetics. Trends Genet. 2000, 16, 168–174. [Google Scholar] [CrossRef]
  46. Liu, H.; Zhou, J.; Tian, W.; Luo, C.; Bartlett, A.; Aldridge, A.; Lucero, J.; Osteen, J.K.; Nery, J.R.; Chen, H.; et al. DNA Methylation Atlas of the Mouse Brain at Single-Cell Resolution. Nature 2021, 598, 120–128. [Google Scholar] [CrossRef] [PubMed]
Figure 1. SLCO3A1 promotes the proliferation of GCs. (A) RT-qPCR analysis of SLCO3A1 expression in GCs transfected with different concentrations of pcDNA3.1 (OE-NC) or pcDNA3.1-SLCO3A1 (OE-SLCO3A1). (B) Western blot analysis of SLCO3A1 transfected with 0.5 ng/µL of OE-NC or OE-SLCO3A1. (C) RT-qPCR analysis of SLCO3A1 expression in GCs transfected with 50 nM or 100 nM of siRNAs (siRNA#NC, siRNA#1, siRNA#2, siRNA#3). (D) Western blot analysis of SLCO3A1 transfected with 50 nM of siRNA#3. EdU detection of proliferation rate transfected with OE-SLCO3A1 (E) or KD-SLCO3A1 (F). Scale bar = 200 μm. RT-qPCR analysis of proliferation-related genes transfected with OE-SLCO3A1 (G) or KD-SLCO3A1 (I). Western blot analysis of MCL-1, PCNA and STAR transfected with OE-SLCO3A1 (H) or KD-SLCO3A1 (J). RT-qPCR analysis of estrogen pathway-related genes transfected with OE-SLCO3A1 (K) and KD-SLCO3A1 (M). Western blot analysis of FSHR transfected with OE-SLCO3A1 (L) and KD-SLCO3A1 (N). All of the above experimental results were obtained in the COV434 cells. * p < 0.05, ** p < 0.01, and *** p < 0.001.
Ijms 25 02468 g001
Figure 2. SLCO3A1 promotes the cell cycle-related processes but inhibits the apoptosis of GCs. The cell cycle distribution was analyzed by flow cytometric transfected with OE-SLCO3A1 (A) or KD-SLCO3A1 (B). Green: cells in the G0-G1 phase, Yellow: cells in S phase, Blue: cells in G2-M phase. (C) RT-qPCR analysis of cycle-related genes expression transfected with OE-NC or OE-SLCO3A1. (D) Western blot analysis of CCNE1, CDK2 and CCND1 transfected with OE-NC or OE-SLCO3A1. (E) RT-qPCR analysis of cycle-related genes expression transfected with KD-NC or KD-SLCO3A1. (F) Western blot analysis of CCNE1, CDK2 and CCND1 transfected with KD-NC or KD-SLCO3A1. Flow cytometry assay of the apoptosis rate transfected with OE-SLCO3A1 (G) or KD-SLCO3A1 (H). Q1: dead cells and cell debris, Q2: late apoptotic cells, Q3: early apoptotic cells, Q4: negative cells. RT-qPCR analysis of pro-apoptosis related genes expression transfected with OE-SLCO3A1 (I) or KD-SLCO3A1 (K). Western blot analysis of CASP3 and CASP8 transfected with OE-SLCO3A1 (J) or KD-SLCO3A1 (L). All of the above experimental results were obtained in the COV434 cells. * p < 0.05, ** p < 0.01, *** p < 0.001, ns p > 0.05.
Ijms 25 02468 g002
Figure 3. SLCO3A1 promotes the growth of porcine follicles. The mRNA and protein levels of SLCO3A1 of porcine follicles treated with LV-SLCO3A1 (A) or KD-SLOC3A1 (B). RT-qPCR analysis of proliferation- and cycle-related genes expression treated with LV-SLCO3A1 (C) or sh-SLCO3A1 (E). Western blot analysis of P65 and CDK4 treated with LV-SLCO3A1 (D) or sh-SLCO3A1 (F). * p < 0.05, ** p < 0.01, *** p < 0.001, ns p > 0.05.
Ijms 25 02468 g003
Figure 4. SLCO3A1 promotes follicular growth in mice. The mRNA and protein levels of SLCO3A1 in the ovaries of mice treated with LV-SLCO3A1 (A) and sh-SLCO3A1 (B). (C) The TUNEL staining was performed in mice ovaries treated with LV-SLCO3A1 or sh-SLCO3A1, and the relative fluorescence intensity was corrected by that of the control groups. Yellow arrows indicated apoptotic GCs. Scale bar = 500 μm. (D) The HE staining and follicular statistics of mice after their ovaries were treated with LV-SLCO3A1 or sh-SLCO3A1. Black arrows indicated antral follicles, and orange arrows indicated corpus luteum. Scale bar = 500 μm. (E) The age of mice at vaginal opening treated with LV-SLCO3A1 or sh-SLCO3A1. (F) The concentration of E2 treated with LV-SLCO3A1 or sh-SLCO3A1 was assessed by ELISA. RT-qPCR analysis of proliferation- and cycle-related genes expression treated with LV-SLCO3A1 (G) or sh-SLCO3A1 (I). Western blot analysis of CCNB2 and CDK1 treated with LV-SLCO3A1 (H) or sh-SLCO3A1 (J). * p < 0.05, ** p < 0.01, *** p < 0.001.
Ijms 25 02468 g004
Figure 5. Knockdown of DNMT1 upregulates the mRNA and protein levels of SLCO3A1. (A) RT-qPCR analysis of SLCO3A1 expression in the small (<3 mm in diameter) and large (>3 mm in diameter) follicles. (B) Western blot analysis of SLCO3A1 in the small and large follicles. (C) RT-qPCR analysis of SLCO3A1 expression in the DMSO or 5-Aza-CdR treated-cells. (D) Western blot analysis of SLCO3A1 in the DMSO or 5-Aza-CdR treated-cells. (E) Chromatin accessibility assay of region-1, region-2, and region-3 in the SLCO3A1 promoter treated with DMSO or 5-Aza-CdR (region-1, +971/+1252 bp, region-2, +1433/+1557 bp, and region-3, +1623/+1831 bp, transcription start site = +2000 bp). (F) RT-qPCR analysis of SLCO3A1 expression in GCs transfected with siRNAs of DNMT1, DNMT3A, or DNMT3B. Western blot analysis of SLCO3A1, DNMT1 (G), DNMT3A (H), and DNMT3B (I) in the siRNAs of DNMT1, DNMT3A, or DNMT3B treated-cells. *** p < 0.001.
Ijms 25 02468 g005
Table 1. List of oligonucleotides used in this study.
Sequence NumberTarget Sequence (5′→3′)
SLCO3A1-siRNA # 1GCCCTGAACTCAAGTCTTA
SLCO3A1-siRNA # 2CCCACCAGTACAAGTACGA
SLCO3A1-siRNA # 3ACCTGCTCTCAAACCCTGT
siRNA-DNMT1GGAAGAAGAGUUACUAUAA
siRNA-DNMT3AGCCUCAGAGCUAUUACCCA
siRNA-DNMT3BGAAGAUCAAGCUCGCGACU
Table 2. Primers used for RT-qPCR in GCs.
Gene NamePrimer Sequences (5′ to 3′)Size (bp)Accession Number
SLCO3A1F: GTGGGGTGGCTTTCTGCTCT145NM_013272.4
R: GGGTCTCTCGTATTCTCTTTCGG
PCNAF: CAAGTAATGTCGATAAAGAGGAGG126NM_182649.2
R: GTGTCACCGTTGAAGAGAGTGG
BCL-2F: ATCGCCCTGTGGATGACTGAGT127NM_000633.3
R: GCCAGGAGAAATCAAACAGAGGC
IKBAF: TCCACTCCATCCTGAAGGCTAC101NM_020529.3
R: CAAGGACACCAAAAGCTCCACG
STARF: TACGTGGCTACTCAGCATCGAC142NM_000349.3
R: TCAACACCTGGCTTCAGAGGCA
MCL1F: CCAAGAAAGCTGCATCGAACCAT151NM_001197320.2
R: CAGCACATTCCTGATGCCACCT
ESR1F: GCTTACTGACCAACCTGGCAGA129XM_054354493.1
R: GGATCTCTAGCCAGGCACATTC
ESR2F: ATGGAGTCTGGTCGTGTGAAGG148NM_001437.3
R: TAACACTTCCGAAGTCGGCAGG
FSHRF: GGTTTGTCCTCACCAAGCTTCG126NM_000145.4
R: GGTTGGAGAACACATCTGCCTC
CYP1A1F: GATTGAGCACTGTCAGGAGAAGC138NM_000499.5
R: ATGAGGCTCCAGGAGATAGCAG
CYP17A1F: GCACACCAACTATCAGTGACCG147NM_000102.4
R: CCTTGTCCACAGCAAACTCACC
CYP19A1F: GACGCAGGATTTCCACAGAAGAG145NM_001347252.2
R: ATGGTGTCAGGAGCTGCGATCA
HSD17B1F: TTCCTGCCAGACATGAAGAGGC143NM_001330219.3
R: AGAACCGCCAGACTCTCGCATA
MYCF: CCTGGTGCTCCATGAGGAGAC128NM_002467.6
R: CAGACTCTGACCTTTTGCCAGG
PAK1F: GTGAAGGCTGTGTCTGAGACTC149NM_001376274.1
R: GGAAGTGGTTCAATCACAGACCG
CDKN1BF: ATAAGGAAGCGACCTGCAACCG119NM_004064.5
R: TTCTTGGGCGTCTGCTCCACAG
CCNB2F: CAACCAGAGCAGCACAAGTAGC136NM_004701.4
R: GGAGCCAACTTTTCCATCTGTAC
CCND1F: TCTACACCGACAACTCCATCCG133NM_053056.3
R: TCTGGCATTTTGGAGAGGAAGTG
CCNE1F: TGTGTCCTGGATGTTGACTGCC123NM_001322262.2
R: CTCTATGTCGCACCACTGATACC
CCNE2F: CTTACGTCACTGATGGTGCTTGC126NM_057749.3
R: CTTGGAGAAAGAGATTTAGCCAGG
CCNHF: CGATGTCATTCTGCTGAGCTTGC128NM_001199189.2
R: TCTACCAGGTCGTCATCAGTCC
CDK1F: GGAAACCAGGAAGCCTAGCATC124NM_001320918.1
R: GGATGATTCAGTGCCATTTTGCC
CDK2F: ATGGATGCCTCTGCTCTCACTG97NM_052827.4
R: CCCGATGAGAATGGCAGAAAGC
CDK4F: CCATCAGCACAGTTCGTGAGGT103NM_000075.4
R: TCAGTTCGGGATGTGGCACAGA
P53F: CCTCAGCATCTTATCCGAGTGG128NM_001407269.1
R: TGGATGGTGGTACAGTCAGAGC
BADF: CCAACCTCTGGGCAGCACAGC126NM_032989.3
R: TTTGCCGCATCTGCGTTGCTGT
BIDF: TGGGACACTGTGAACCAGGAGT125NM_197966.3
R: GAGGAAGCCAAACACCAGTAGG
CASP3F: GGAAGCGAATCAATGGACTCTGG146NM_001354783.2
R: GCATCGACATCTGTACCAGACC
CASP7F: CGGAACAGACAAAGATGCCGAG143NM_033338.6
R: AGGCGGCATTTGTATGGTCCTC
CASP8F: GCTGACTTTCTGCTGGGGAT112NM_033355.4
R: GACATCGCTCTCTCAGGCTC
CASP9F: GTTTGAGGACCTTCGACCAGCT129NM_001278054.2
R: CAACGTACCAGGAGCCACTCTT
GAPDHF: GTCTCCTCTGACTTCAACAGCG131NM_002046.7
R: ACCACCCTGTTGCTGTAGCCAA
Table 3. Primers used for RT-qPCR in pigs.
Gene NamePrimer Sequences (5′ to 3′)Size (bp)Accession Number
SLCO3A1F: GTGGGGTGGCTTTCTGCTCT145XM_021099372.1
R: GGGTCTCTCTATTCTCTTTCGG
CCND1F: TTCATTTCCAACCCGCCCTC185XM_021082686.1
R: TCCAGAAGGGCTTCGATCTG
CDK1F: AAGTGTGGCCAGAAGTGGAG157XM_005671016.3
R: CCAGAAATTCGCTTGGCAGG
CDK2F: TTTGCTGAGATGGTGACCCG254NM_001285465.1
R: GCTGAAATCCGCTTGTTGGG
CDK4F: TTGTCCGGCTGATGGATGTC255NM_001123097.1
R: GCTTGACTGTCCCACCACTT
CCNE1F: ACTGATGTCTCTGTTCGCTCC175XM_005653265.2
R: TGTCAGGTGTGGGAATGAAGG
BCL-2F: GAGTTCGGTGGGGTCATGTG152XM_021099593.1
R: TACAGCTCCACAAAGGCATCC
MCL1F: GGAAGGCGTTAGAGACCCTG178NM_001348806.1
R: GTCACAATCCTGCCCCAGTT
STARF: AGACTTTGTGAGTGTGCGCT254NM_213755.2
R: AGTCCACCTGGGTCTGTGAT
P65F: CATGCGCTTCCGCTACAAG284NM_001114281.1
R: GGTCCCGCTTCTTTACACAC
PCNAF: AAGAGGAGGAAGCAGTTACCA205NM_001291925.1
R: TCATCTTCGATCTTGGGAGCC
GAPDHF: GGACTCATGACCACGGTCCAT220XM_021091114.1
R: TCAGATCCACAACCGACACGT
Table 4. Primers used for RT-qPCR in mice.
Gene NamePrimer Sequences (5′ to 3′)Size (bp)Accession Number
SLCO3A1F: CTGCTCCTTCGTTTGTTGGG279XM_021167570.2
R: AGAGGCAAAGAACTCACTGGT
BCL-2F: CCTGTGGATGACTGAGTACCTG123XM_029538378.1
R: AGCCAGGAGAAATCAAACAGAGG
MCL1F: AGCTTCATCGAACCATTAGCAGAA125NM_008562.3
R: CCTTCTAGGTCCTGTACGTGGA
PCNAF: CAAGTGGAGAGCTTGGCAATGG112NM_011045.2
R: GCAAACGTTAGGTGAACAGGCTC
SP1F: CTCCAGACCATTAACCTCAGTGC133XM_029548031.1
R: CACCACCAGATCCATGAAGACC
STARF: GTGCTTCATCCACTGGCTGGAA113NM_011485.5
R: GTCTGCGATAGGACCTGGTTGA
CCNB2F: GCACTACCATCCTTCTCAGGTG137NM_007630.2
R: TGTGCTGCATGACTTCCAGGAC
CCND1F: GCAGAAGGAGATTGTGCCATCC123NM_001379248.1
R: AGGAAGCGGTCCAGGTAGTTCA
CCNE1F: AAGCCCTCTGACCATTGTGTCC155XM_021201435.2
R: CTAAGCAGCCAACATCCAGGAC
CDK1F: CATGGACCTCAAGAAGTACCTGG136NM_007659.4
R: CAAGTCTCTGTGAAGAACTCGCC
CDK2F: TCATGGATGCCTCTGCTCTCAC106NM_016756.4
R: TGAAGGACACGGTGAGAATGGC
CDK4F: CATACCTGGACAAAGCACCTCC135XM_029482281.1
R: GAATGTTCTCTGGCTTCAGGTCC
GAPDHF: GGACTCATGACCACGGTCCAT220NM_008084.4
R: TCAGATCCACAACCGACACGT
Table 5. Primers used for the chromatin accessibility of the SLCO3A1 promoter region.
NamePrimer Sequences (5′ to 3′)Size (bp)
region-1F: GGGGAGTAATTAGGAGCGGC282
R: ACCGAAAGGACAGAAAGGGG
region-2F: TCTCCCTTCCTGGGAACAGC125
R: GAGACTGGCGGCTCTGC
region-3F: CACCCCCCTTACTCCGCAA209
R: GCTCTCACCCCCTCAGCCC
Disclaimer/Publisher’s Note: The statements, opinions and data contained in all publications are solely those of the individual author(s) and contributor(s) and not of MDPI and/or the editor(s). MDPI and/or the editor(s) disclaim responsibility for any injury to people or property resulting from any ideas, methods, instructions or products referred to in the content.

