
Deregulated Transcriptome as a Platform for Adrenal Huntington’s Disease-Related Pathology
 , , , and
Abstract
1. Introduction
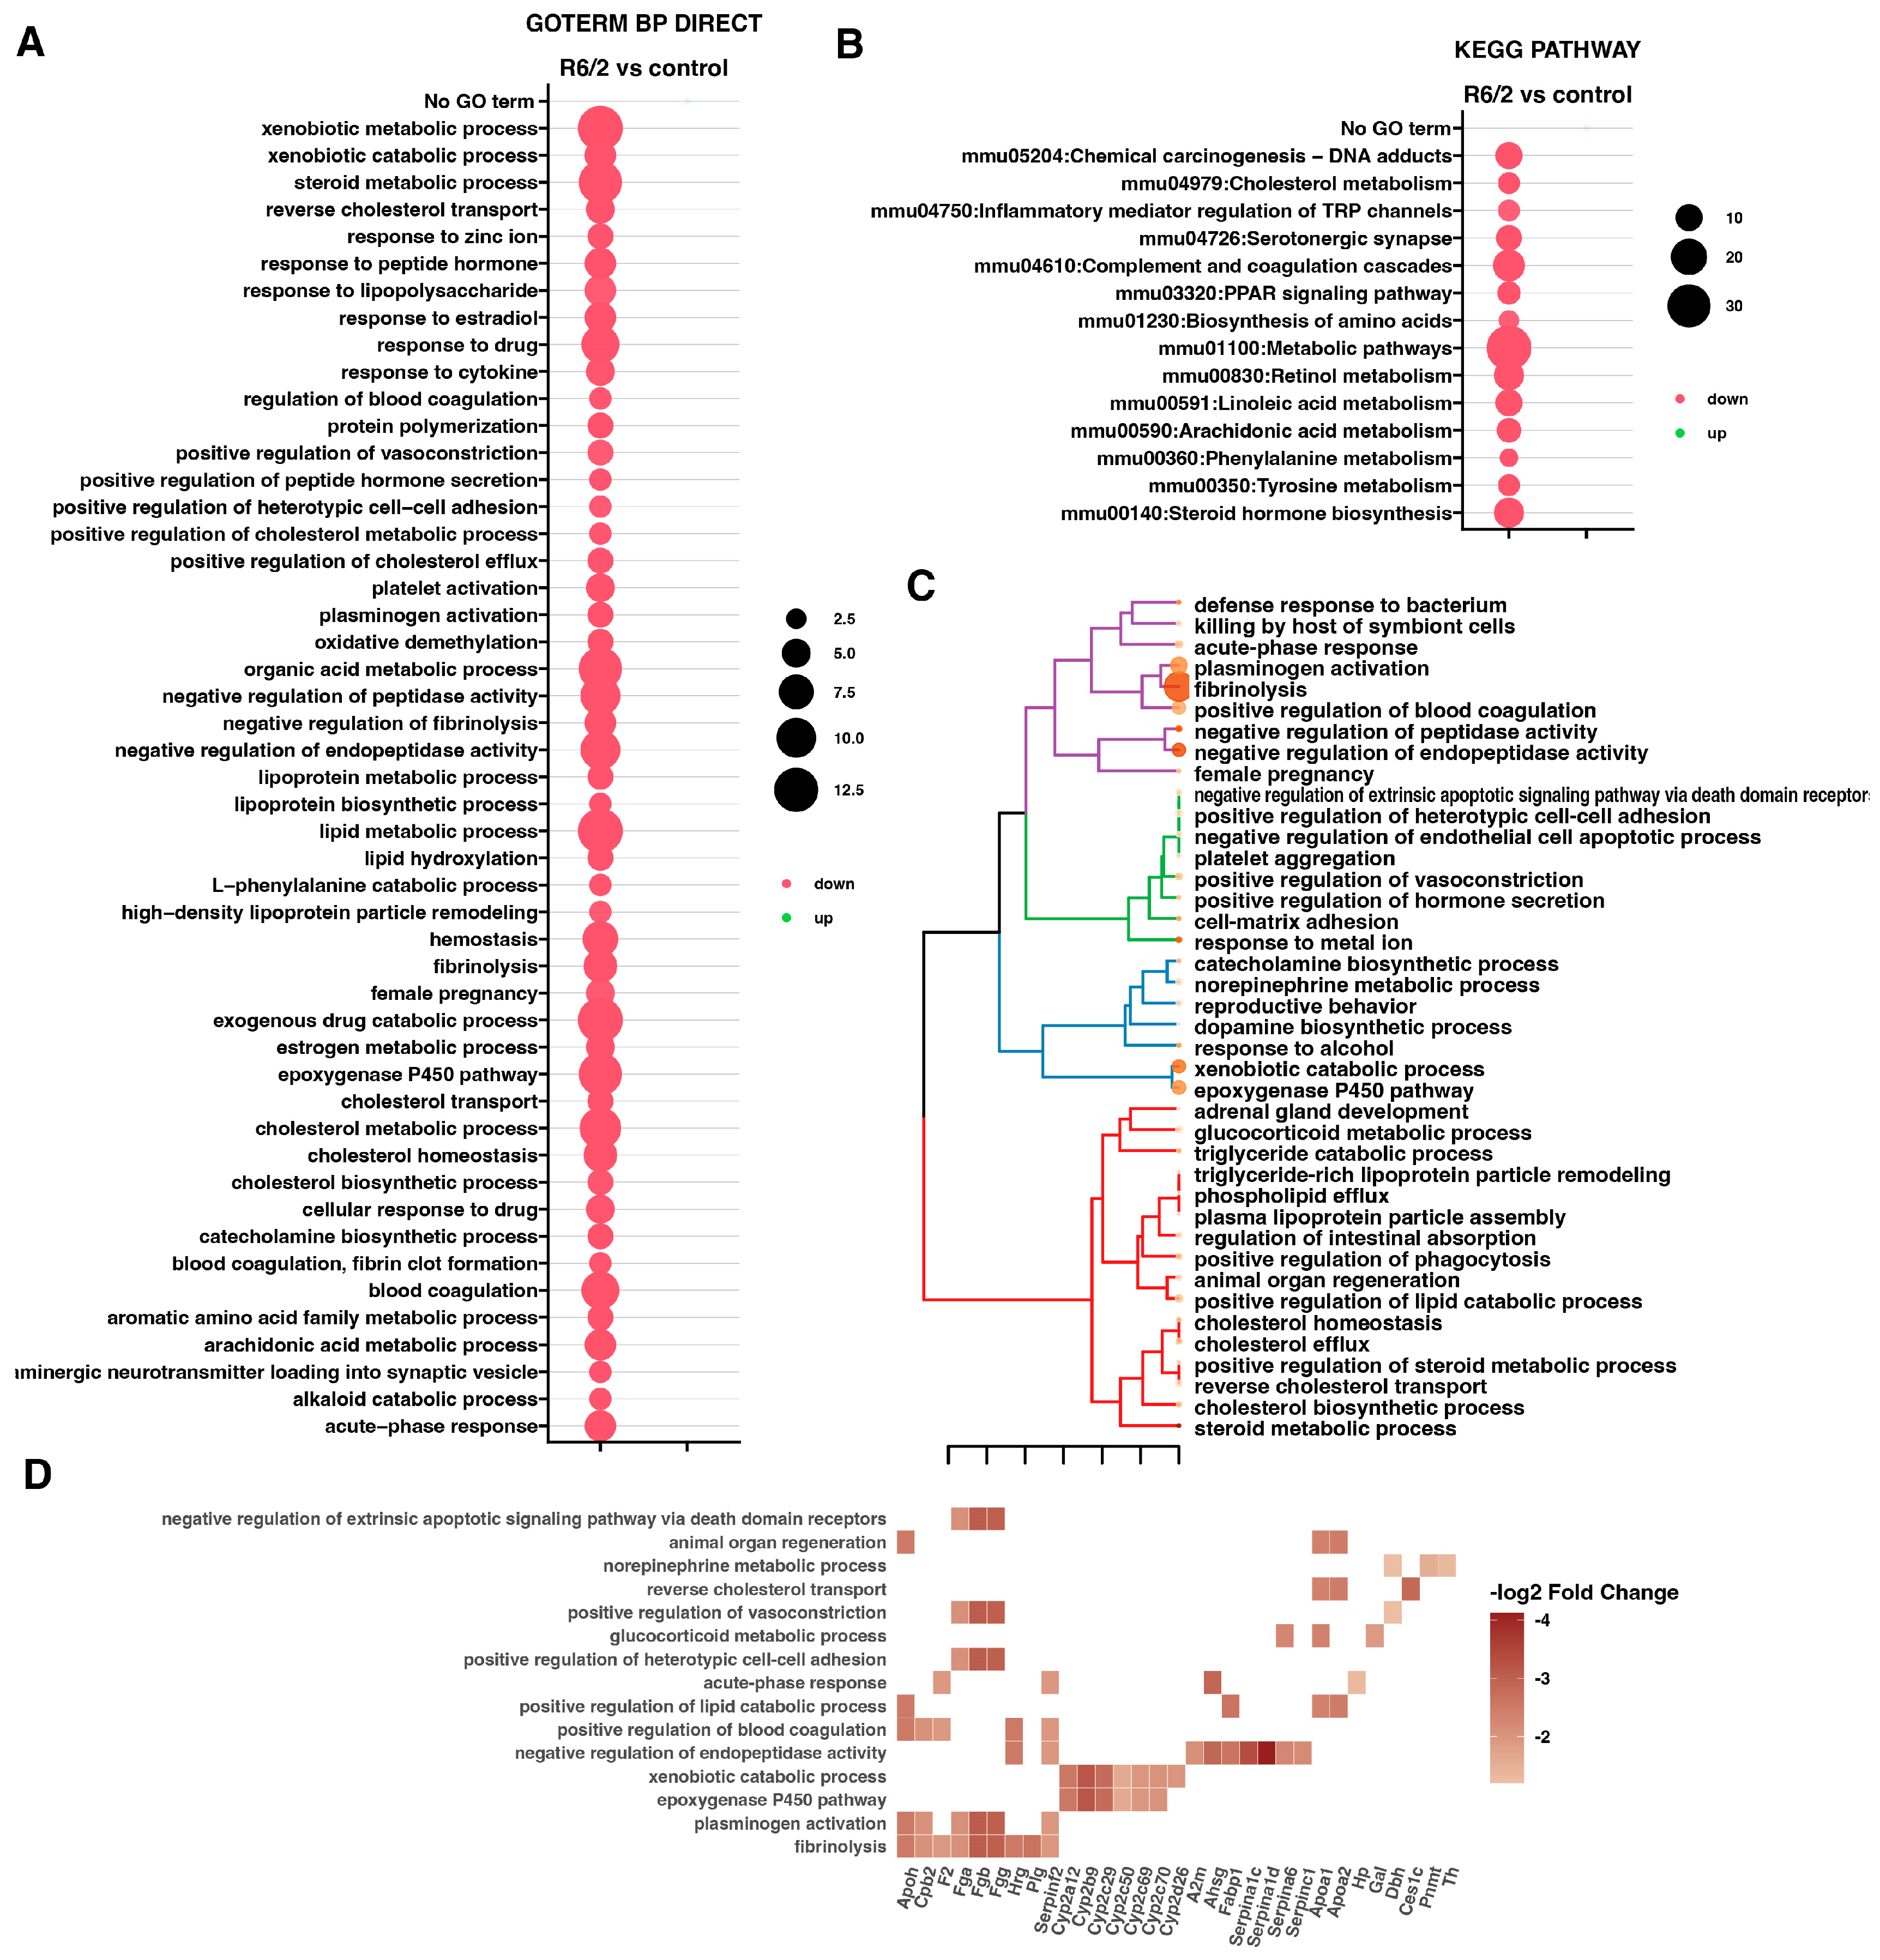
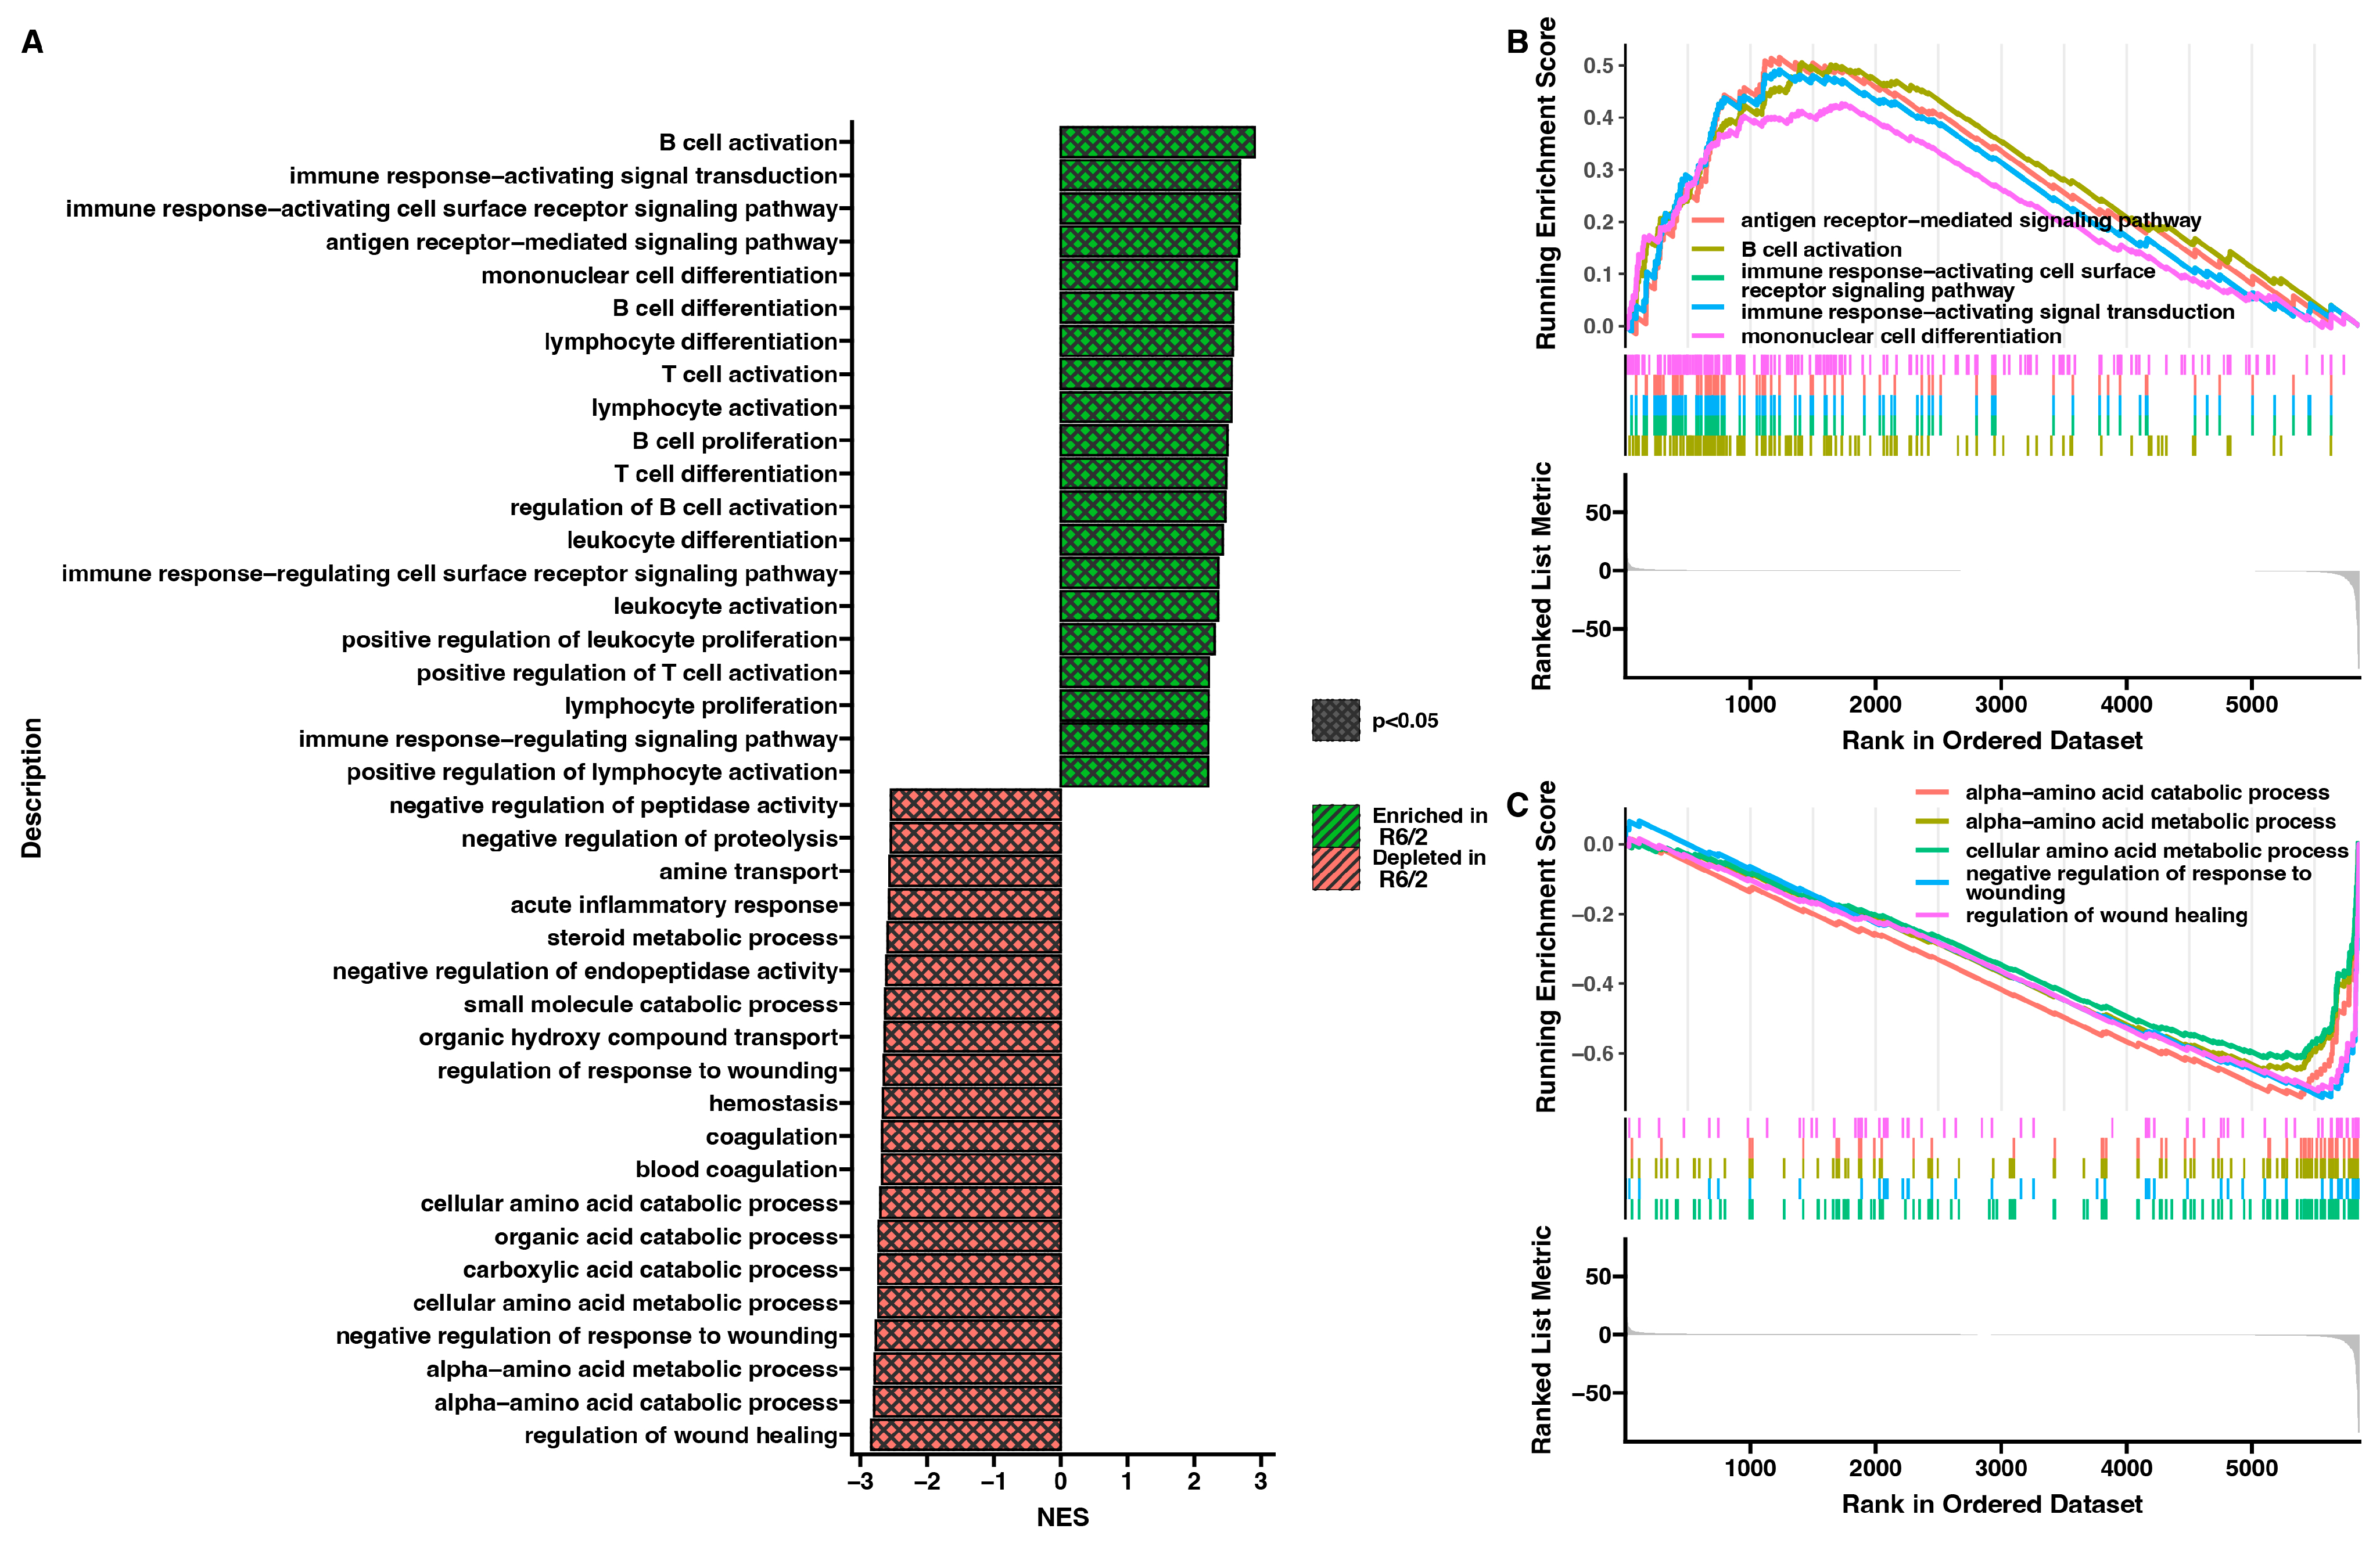
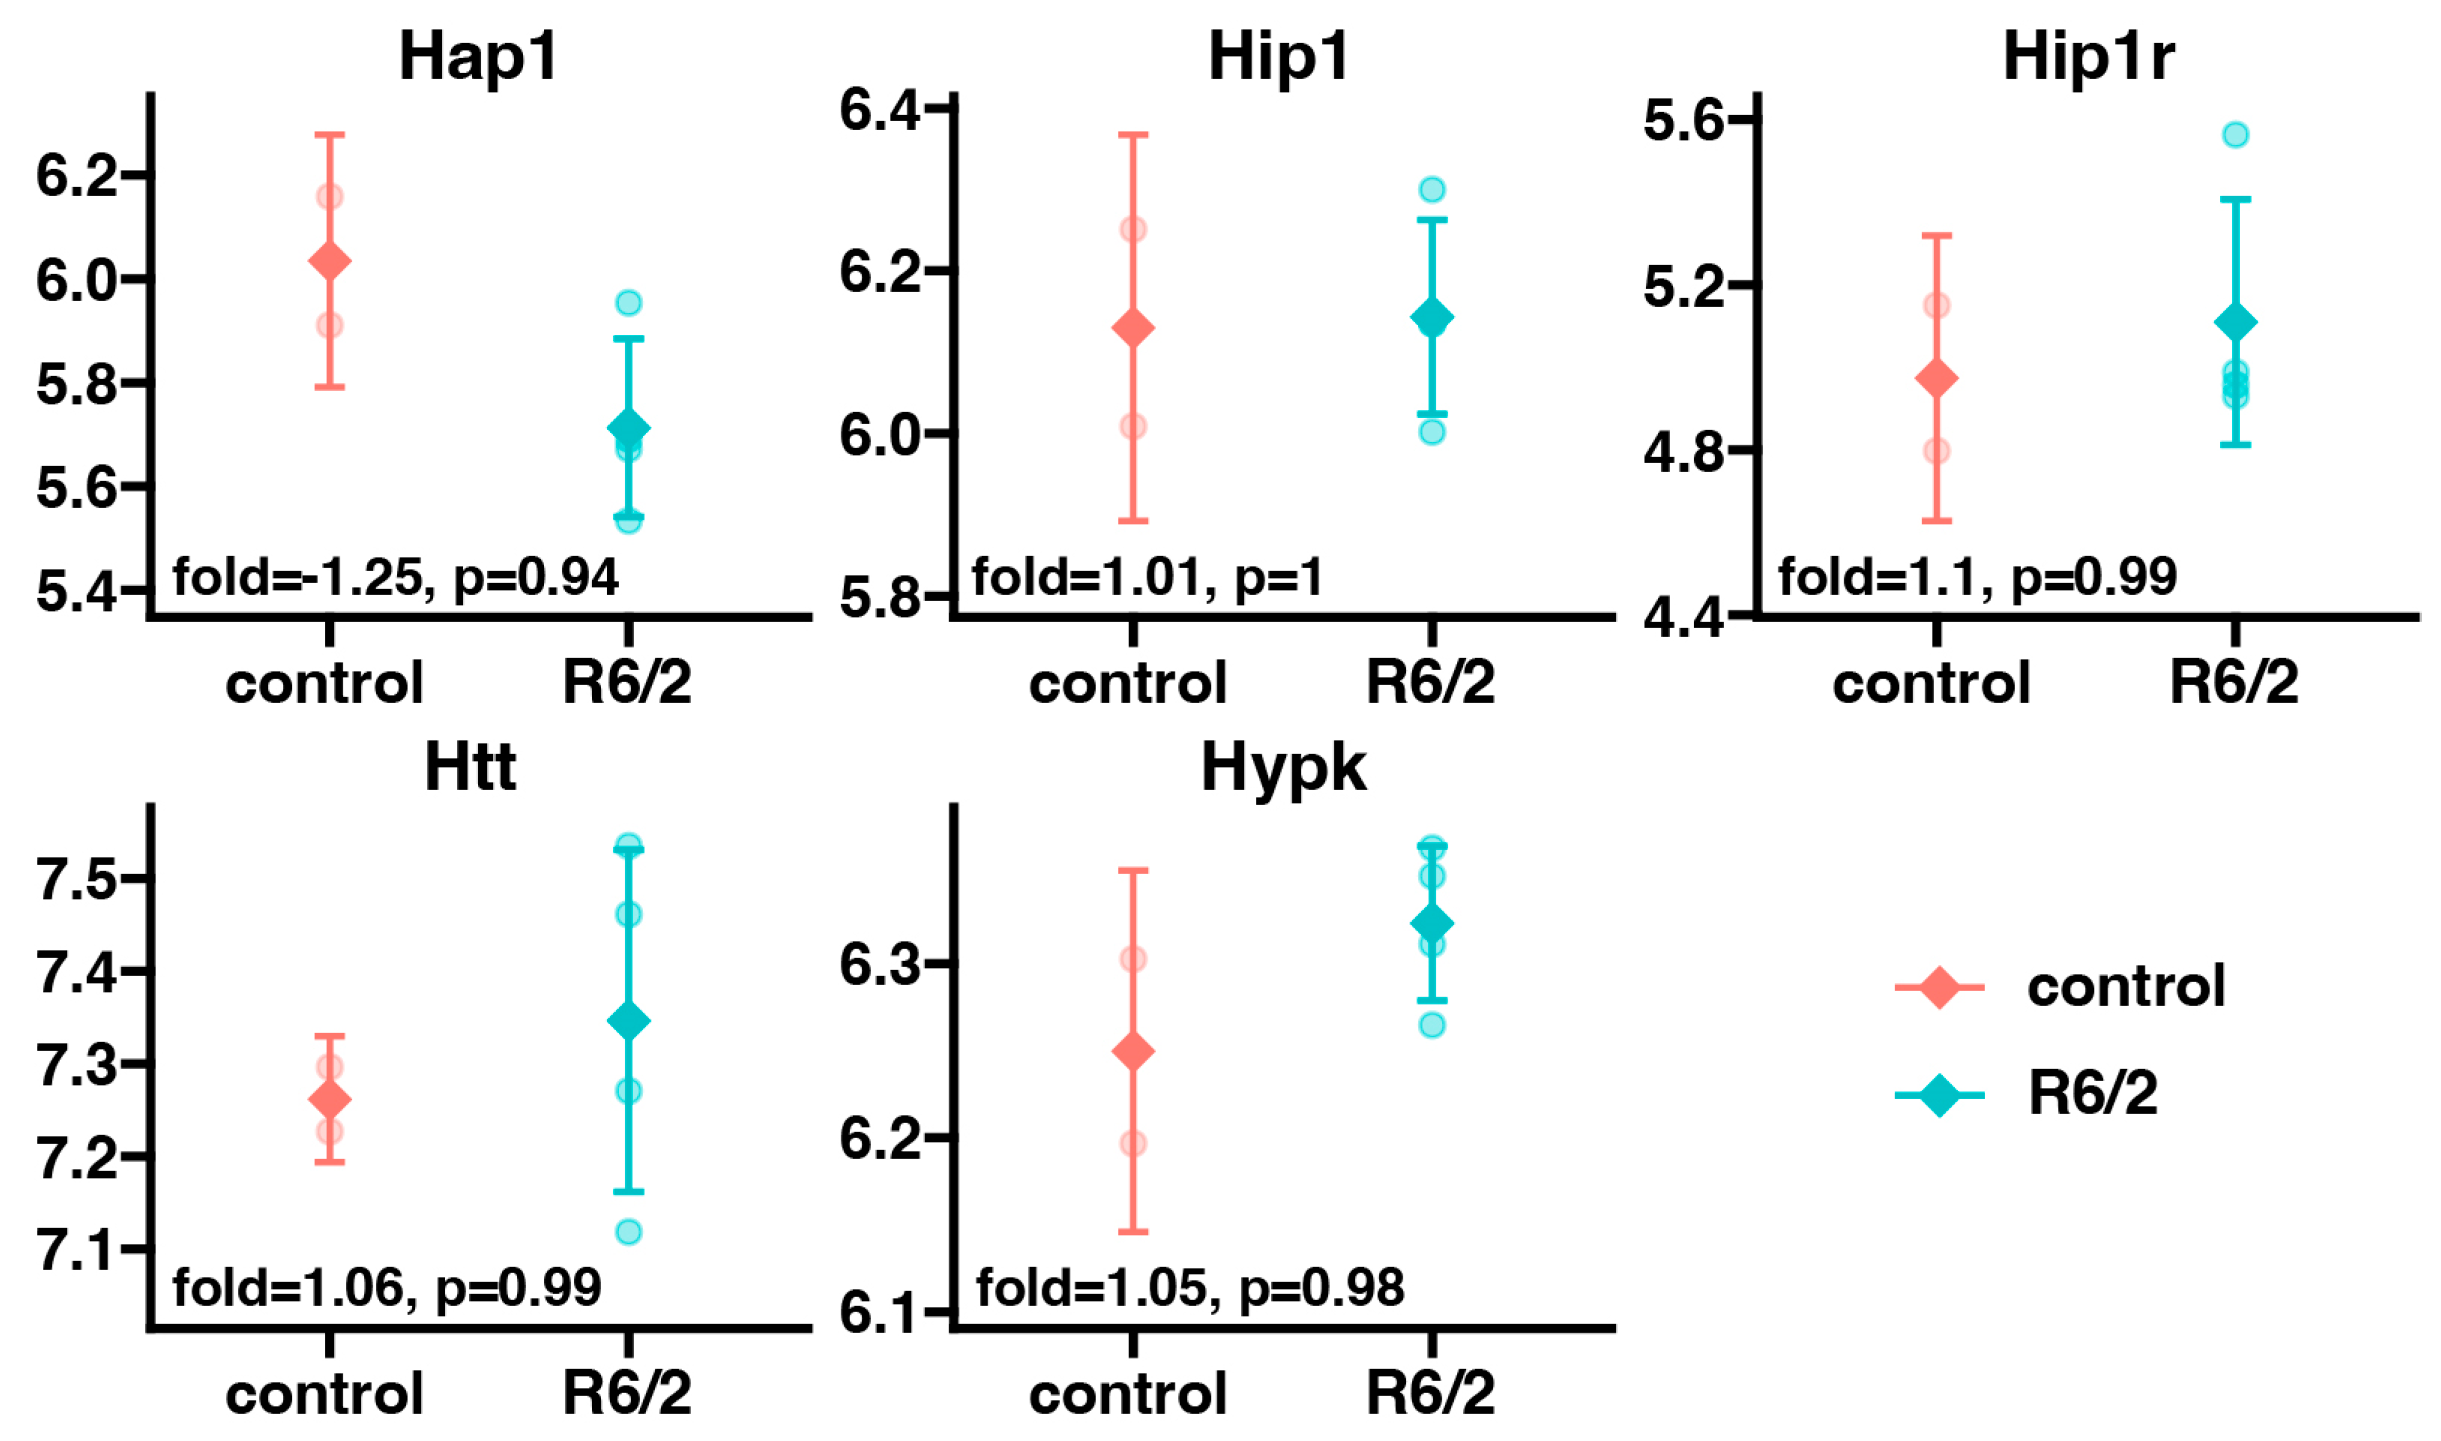
2. Results
3. Discussion
4. Materials and Methods
4.1. Animals
4.2. RNA Isolation
4.3. Microarray Study
4.4. Data Analysis of Microarray Study
4.5. Assessment of Tissue-Specific Expression Profile Changes in Analyzed Genes
5. Conclusions
Supplementary Materials
Author Contributions
Funding
Institutional Review Board Statement
Informed Consent Statement
Data Availability Statement
Conflicts of Interest
References
- Huntington, G. On chorea. J. Neuropsychiatry Clin. Neurosci. 2003, 15, 109–112. [Google Scholar] [CrossRef]
- Dayalu, P.; Albin, R.L. Huntington disease: Pathogenesis and treatment. Neurol. Clin. 2015, 33, 101–114. [Google Scholar] [CrossRef] [PubMed]
- Pringsheim, T.; Wiltshire, K.; Day, L.; Dykeman, J.; Steeves, T.; Jette, N. The incidence and prevalence of Huntington’s disease: A systematic review and meta-analysis. Mov. Disord. 2012, 27, 1083–1091. [Google Scholar] [CrossRef] [PubMed]
- Paulsen, J.S.; Nehl, C.; Hoth, K.F.; Kanz, J.E.; Benjamin, M.; Conybeare, R.; McDowell, B.; Turner, B. Depression and stages of Huntington’s disease. J. Neuropsychiatry Clin. Neurosci. 2005, 17, 496–502. [Google Scholar] [CrossRef] [PubMed]
- Gusella, J.F.; Wexler, N.S.; Conneally, P.M.; Naylor, S.L.; Anderson, M.A.; Tanzi, R.E.; Watkins, P.C.; Ottina, K.; Wallace, M.R.; Sakaguchi, A.Y.; et al. A polymorphic DNA marker genetically linked to Huntington’s disease. Nature 1983, 306, 234–238. [Google Scholar] [CrossRef]
- The Huntington’s Disease Collaborative Research Group. A novel gene containing a trinucleotide repeat that is expanded and unstable on Huntington’s disease chromosomes. Cell 1993, 72, 971–983. [Google Scholar] [CrossRef] [PubMed]
- Gusella, J.F.; Lee, J.M.; MacDonald, M.E. Huntington’s disease: Nearly four decades of human molecular genetics. Hum. Mol. Genet. 2021, 30, R254–R263. [Google Scholar] [CrossRef] [PubMed]
- Ghosh, R.; Tabrizi, S.J. Clinical Features of Huntington’s Disease. In Polyglutamine Disorders; Advances in Experimental Medicine and Biology; Springer: Cham, Switzerland, 2018; Volume 1049, pp. 1–28. [Google Scholar] [CrossRef]
- Rubinsztein, D.C.; Leggo, J.; Coles, R.; Almqvist, E.; Biancalana, V.; Cassiman, J.J.; Chotai, K.; Connarty, M.; Crauford, D.; Curtis, A.; et al. Phenotypic characterization of individuals with 30–40 CAG repeats in the Huntington disease (HD) gene reveals HD cases with 36 repeats and apparently normal elderly individuals with 36–39 repeats. Am. J. Hum. Genet. 1996, 59, 16–22. [Google Scholar]
- Zuhlke, C.; Riess, O.; Schroder, K.; Siedlaczck, I.; Epplen, J.T.; Engel, W.; Thies, U. Expansion of the (CAG)n repeat causing Huntington’s disease in 352 patients of German origin. Hum. Mol. Genet. 1993, 2, 1467–1469. [Google Scholar] [CrossRef]
- Li, S.H.; Schilling, G.; Young, W.S., 3rd; Li, X.J.; Margolis, R.L.; Stine, O.C.; Wagster, M.V.; Abbott, M.H.; Franz, M.L.; Ranen, N.G.; et al. Huntington’s disease gene (IT15) is widely expressed in human and rat tissues. Neuron 1993, 11, 985–993. [Google Scholar] [CrossRef]
- Strong, T.V.; Tagle, D.A.; Valdes, J.M.; Elmer, L.W.; Boehm, K.; Swaroop, M.; Kaatz, K.W.; Collins, F.S.; Albin, R.L. Widespread expression of the human and rat Huntington’s disease gene in brain and nonneural tissues. Nat. Genet. 1993, 5, 259–265. [Google Scholar] [CrossRef]
- Zielonka, D.; Witkowski, G.; Puch, E.A.; Lesniczak, M.; Mazur-Michalek, I.; Isalan, M.; Mielcarek, M. Prevalence of Non-psychiatric Comorbidities in Pre-symptomatic and Symptomatic Huntington’s Disease Gene Carriers in Poland. Front. Med. 2020, 7, 79. [Google Scholar] [CrossRef]
- Mielcarek, M. Huntington’s disease is a multi-system disorder. Rare Dis. 2015, 3, e1058464. [Google Scholar] [CrossRef]
- Bruyn, G.W.; de Yong, F.H.; van der Molen, J.H. Huntington’s chorea and the adrenal. Br. Med. J. 1972, 1, 506. [Google Scholar] [CrossRef][Green Version]
- Leblhuber, F.; Peichl, M.; Neubauer, C.; Reisecker, F.; Steinparz, F.X.; Windhager, E.; Maschek, W. Serum dehydroepiandrosterone and cortisol measurements in Huntington’s chorea. J. Neurol. Sci. 1995, 132, 76–79. [Google Scholar] [CrossRef]
- Heuser, I.J.; Chase, T.N.; Mouradian, M.M. The limbic-hypothalamic-pituitary-adrenal axis in Huntington’s disease. Biol. Psychiatry 1991, 30, 943–952. [Google Scholar] [CrossRef]
- Bjorkqvist, M.; Petersen, A.; Bacos, K.; Isaacs, J.; Norlen, P.; Gil, J.; Popovic, N.; Sundler, F.; Bates, G.P.; Tabrizi, S.J.; et al. Progressive alterations in the hypothalamic-pituitary-adrenal axis in the R6/2 transgenic mouse model of Huntington’s disease. Hum. Mol. Genet. 2006, 15, 1713–1721. [Google Scholar] [CrossRef] [PubMed]
- Mangiarini, L.; Sathasivam, K.; Seller, M.; Cozens, B.; Harper, A.; Hetherington, C.; Lawton, M.; Trottier, Y.; Lehrach, H.; Davies, S.W.; et al. Exon 1 of the HD gene with an expanded CAG repeat is sufficient to cause a progressive neurological phenotype in transgenic mice. Cell 1996, 87, 493–506. [Google Scholar] [CrossRef] [PubMed]
- Martinez-Ramirez, C.; Baraibar, A.M.; Nanclares, C.; Mendez-Lopez, I.; Gomez, A.; Munoz, M.P.; de Diego, A.M.G.; Gandia, L.; Casarejos, M.J.; Garcia, A.G. Altered excitability and exocytosis in chromaffin cells from the R6/1 mouse model of Huntington’s disease is linked to over-expression of mutated huntingtin. J. Neurochem. 2018, 147, 454–476. [Google Scholar] [CrossRef] [PubMed]
- Ludt, A.; Ustjanzew, A.; Binder, H.; Strauch, K.; Marini, F. Interactive and Reproducible Workflows for Exploring and Modeling RNA-seq Data with pcaExplorer, Ideal, and GeneTonic. Curr. Protoc. 2022, 2, e411. [Google Scholar] [CrossRef] [PubMed]
- Marini, F.; Ludt, A.; Linke, J.; Strauch, K. GeneTonic: An R/Bioconductor package for streamlining the interpretation of RNA-seq data. BMC Bioinform. 2021, 22, 610. [Google Scholar] [CrossRef] [PubMed]
- Boyd, G.S.; McNamara, B.; Suckling, K.E.; Tocher, D.R. Cholesterol metabolism in the adrenal cortex. J. Steroid Biochem. 1983, 19, 1017–1027. [Google Scholar] [CrossRef] [PubMed]
- Aherrahrou, R.; Kulle, A.E.; Alenina, N.; Werner, R.; Vens-Cappell, S.; Bader, M.; Schunkert, H.; Erdmann, J.; Aherrahrou, Z. CYP17A1 deficient XY mice display susceptibility to atherosclerosis, altered lipidomic profile and atypical sex development. Sci. Rep. 2020, 10, 8792. [Google Scholar] [CrossRef] [PubMed]
- Kacher, R.; Lamaziere, A.; Heck, N.; Kappes, V.; Mounier, C.; Despres, G.; Dembitskaya, Y.; Perrin, E.; Christaller, W.; Sasidharan Nair, S.; et al. CYP46A1 gene therapy deciphers the role of brain cholesterol metabolism in Huntington’s disease. Brain 2019, 142, 2432–2450. [Google Scholar] [CrossRef]
- Chang, K.H.; Cheng, M.L.; Lo, C.J.; Fan, C.M.; Wu, Y.R.; Chen, C.M. Alternations of Lipoprotein Profiles in the Plasma as Biomarkers of Huntington’s Disease. Cells 2023, 12, 385. [Google Scholar] [CrossRef]
- Molinoff, P.B.; Axelrod, J. Biochemistry of catecholamines. Annu. Rev. Biochem. 1971, 40, 465–500. [Google Scholar] [CrossRef]
- Dickson, E.; Dwijesha, A.S.; Andersson, N.; Lundh, S.; Bjorkqvist, M.; Petersen, A.; Soylu-Kucharz, R. Microarray profiling of hypothalamic gene expression changes in Huntington’s disease mouse models. Front. Neurosci. 2022, 16, 1027269. [Google Scholar] [CrossRef]
- Etxeberria-Rekalde, E.; Alzola-Aldamizetxebarria, S.; Flunkert, S.; Hable, I.; Daurer, M.; Neddens, J.; Hutter-Paier, B. Quantification of Huntington’s Disease Related Markers in the R6/2 Mouse Model. Front. Mol. Neurosci. 2020, 13, 617229. [Google Scholar] [CrossRef] [PubMed]
- Zadel, M.; Maver, A.; Kovanda, A.; Peterlin, B. DNA Methylation Profiles in Whole Blood of Huntington’s Disease Patients. Front. Neurol. 2018, 9, 655. [Google Scholar] [CrossRef]
- Butterfield, D.A.; Oeswein, J.Q.; Prunty, M.E.; Hisle, K.C.; Markesbery, W.R. Increased sodium plus potassium adenosine triphosphatase activity in erythrocyte membranes in Huntington’s disease. Ann. Neurol. 1978, 4, 60–62. [Google Scholar] [CrossRef] [PubMed]
- Goetz, C.G.; Weiner, W.J. Huntington’s disease: Current concepts of therapy. J. Am. Geriatr. Soc. 1979, 27, 23–26. [Google Scholar] [CrossRef]
- Durso, R.; Tamminga, C.A.; Ruggeri, S.; Denaro, A.; Kuo, S.; Chase, T.N. Twenty-four hour plasma levels of growth hormone and prolactin in Huntington’s disease. J. Neurol. Neurosurg. Psychiatry 1983, 46, 1134–1137. [Google Scholar] [CrossRef] [PubMed]
- Christodoulou, C.C.; Zachariou, M.; Tomazou, M.; Karatzas, E.; Demetriou, C.A.; Zamba-Papanicolaou, E.; Spyrou, G.M. Investigating the Transition of Pre-Symptomatic to Symptomatic Huntington’s Disease Status Based on Omics Data. Int. J. Mol. Sci. 2020, 21, 7414. [Google Scholar] [CrossRef] [PubMed]
- Lain, E.; Carnejac, S.; Escher, P.; Wilson, M.C.; Lomo, T.; Gajendran, N.; Brenner, H.R. A novel role for embigin to promote sprouting of motor nerve terminals at the neuromuscular junction. J. Biol. Chem. 2009, 284, 8930–8939. [Google Scholar] [CrossRef] [PubMed]
- Alderson, N.L.; Maldonado, E.N.; Kern, M.J.; Bhat, N.R.; Hama, H. FA2H-dependent fatty acid 2-hydroxylation in postnatal mouse brain. J. Lipid Res. 2006, 47, 2772–2780. [Google Scholar] [CrossRef]
- Robertson, D.; Haile, V.; Perry, S.E.; Robertson, R.M.; Phillips, J.A., 3rd; Biaggioni, I. Dopamine beta-hydroxylase deficiency. A genetic disorder of cardiovascular regulation. Hypertension 1991, 18, 1–8. [Google Scholar] [CrossRef]
- Wetterberg, L.; Aberg, H.; Ross, S.B.; Froden, O. Plasma dopamine-β-hydroxylase activity in hypertension and various neuropsychiatric disorders. Scand. J. Clin. Lab. Investig. 1972, 30, 283–289. [Google Scholar] [CrossRef]
- Caraceni, T.; Calderini, G.; Consolazione, A.; Riva, E.; Algeri, S.; Girotti, F.; Spreafico, R.; Branciforti, A.; Dall’olio, A.; Morselli, P.L. Biochemical aspects of Huntington’s chorea. J. Neurol. Neurosurg. Psychiatry 1977, 40, 581–587. [Google Scholar] [CrossRef]
- Shokeir, M.H. Investigation on Huntington’s disease. III. Biochemical observations, a possibly predictive test? Clin. Genet. 1975, 7, 354–360. [Google Scholar] [CrossRef]
- Garrett, M.C.; Soares-da-Silva, P. Increased cerebrospinal fluid dopamine and 3,4-dihydroxyphenylacetic acid levels in Huntington’s disease: Evidence for an overactive dopaminergic brain transmission. J. Neurochem. 1992, 58, 101–106. [Google Scholar] [CrossRef]
- Kaplan, S.V.; Limbocker, R.A.; Levant, B.; Johnson, M.A. Regional differences in dopamine release in the R6/2 mouse caudate putamen. Electroanalysis 2018, 30, 1066–1072. [Google Scholar] [CrossRef]
- Huang, Y.C.; Wu, Y.R.; Tseng, M.Y.; Chen, Y.C.; Hsieh, S.Y.; Chen, C.M. Increased prothrombin, apolipoprotein A-IV, and haptoglobin in the cerebrospinal fluid of patients with Huntington’s disease. PLoS ONE 2011, 6, e15809. [Google Scholar] [CrossRef]
- Mazur-Michalek, I.; Rucinski, M.; Sowinski, M.; Pietras, P.; Lesniczak-Staszak, M.; Szaflarski, W.; Isalan, M.; Mielcarek, M. Identification of the Transcriptional Biomarkers Panel Linked to Pathological Remodelling of the Eye Tissues in Various HD Mouse Models. Cells 2022, 11, 1675. [Google Scholar] [CrossRef] [PubMed]
- Mielcarek, M.; Isalan, M. A minimal region of the HSP90AB1 promoter is suitable for ubiquitous expression in different somatic tissues with applicability for gene therapy. Front. Mol. Biosci. 2023, 10, 1175407. [Google Scholar] [CrossRef] [PubMed]
- Jopek, K.; Tyczewska, M.; Ramanjaneya, M.; Szyszka, M.; Celichowski, P.; Milecka, P.; Malendowicz, L.K.; Rucinski, M. Effect of ACTH and hCG on the Expression of Gonadotropin-Inducible Ovarian Transcription Factor 1 (Giot1) Gene in the Rat Adrenal Gland. Int. J. Mol. Sci. 2018, 19, 2285. [Google Scholar] [CrossRef] [PubMed]
- Szyszka, M.; Paschke, L.; Tyczewska, M.; Jopek, K.; Celichowski, P.; Milecka, P.; Sultanova, G.; Stelcer, E.; Malinska, A.; Malendowicz, L.K.; et al. Analysis of Transcriptome, Selected Intracellular Signaling Pathways, Proliferation and Apoptosis of LNCaP Cells Exposed to High Leptin Concentrations. Int. J. Mol. Sci. 2019, 20, 5412. [Google Scholar] [CrossRef] [PubMed]
- Stelcer, E.; Milecka, P.; Komarowska, H.; Jopek, K.; Tyczewska, M.; Szyszka, M.; Lesniczak, M.; Suchorska, W.; Bekova, K.; Szczepaniak, B.; et al. Adropin Stimulates Proliferation and Inhibits Adrenocortical Steroidogenesis in the Human Adrenal Carcinoma (HAC15) Cell Line. Front. Endocrinol. 2020, 11, 561370. [Google Scholar] [CrossRef] [PubMed]
- Gautier, L.; Cope, L.; Bolstad, B.M.; Irizarry, R.A. affy—Analysis of Affymetrix GeneChip data at the probe level. Bioinformatics 2004, 20, 307–315. [Google Scholar] [CrossRef] [PubMed]
- Kassambara, A.; Mundt, F. Extract and Visualize the Results of Multivariate Data Analyses [R Package Factoextra], version 1.0.7; The Comprehensive R Archive Network: Auckland, New Zealand, 2020. [Google Scholar]
- Dennis, G., Jr.; Sherman, B.T.; Hosack, D.A.; Yang, J.; Gao, W.; Lane, H.C.; Lempicki, R.A. DAVID: Database for Annotation, Visualization, and Integrated Discovery. Genome Biol. 2003, 4, P3. [Google Scholar] [CrossRef]
- Benjamini, Y.; Cohen, R. Weighted false discovery rate controlling procedures for clinical trials. Biostatistics 2017, 18, 91–104. [Google Scholar] [CrossRef]
- Gu, Z.; Eils, R.; Schlesner, M. Complex heatmaps reveal patterns and correlations in multidimensional genomic data. Bioinformatics 2016, 32, 2847–2849. [Google Scholar] [CrossRef] [PubMed]
- Yu, G.; Wang, L.G.; Han, Y.; He, Q.Y. clusterProfiler: An R package for comparing biological themes among gene clusters. OMICS 2012, 16, 284–287. [Google Scholar] [CrossRef] [PubMed]
- GEO2R Software. Available online: https://www.ncbi.nlm.nih.gov/geo/geo2r/ (accessed on 20 January 2024).
- McCourt, A.C.; Jakobsson, L.; Larsson, S.; Holm, C.; Piel, S.; Elmer, E.; Bjorkqvist, M. White Adipose Tissue Browning in the R6/2 Mouse Model of Huntington’s Disease. PLoS ONE 2016, 11, e0159870. [Google Scholar] [CrossRef] [PubMed]
- Mielcarek, M.; Landles, C.; Weiss, A.; Bradaia, A.; Seredenina, T.; Inuabasi, L.; Osborne, G.F.; Wadel, K.; Touller, C.; Butler, R.; et al. HDAC4 reduction: A novel therapeutic strategy to target cytoplasmic huntingtin and ameliorate neurodegeneration. PLoS Biol. 2013, 11, e1001717. [Google Scholar] [CrossRef]
- Labbadia, J.; Cunliffe, H.; Weiss, A.; Katsyuba, E.; Sathasivam, K.; Seredenina, T.; Woodman, B.; Moussaoui, S.; Frentzel, S.; Luthi-Carter, R.; et al. Altered chromatin architecture underlies progressive impairment of the heat shock response in mouse models of Huntington disease. J. Clin. Investig. 2011, 121, 3306–3319. [Google Scholar] [CrossRef]
- Miyazaki, H.; Yamanaka, T.; Oyama, F.; Kino, Y.; Kurosawa, M.; Yamada-Kurosawa, M.; Yamano, R.; Shimogori, T.; Hattori, N.; Nukina, N. FACS-array-based cell purification yields a specific transcriptome of striatal medium spiny neurons in a murine Huntington disease model. J. Biol. Chem. 2020, 295, 9768–9785. [Google Scholar] [CrossRef]


| Authors | GEO Accession Number | Analyzed Tissue | Compared Groups | Lifespan |
|---|---|---|---|---|
| Mazur-Michalek I. et al. [44] | GSE199335 | eyeball | R6/2 vs. WT | 9 weeks old |
| McCourt AC. et.al. [56] | GSE79711 | subcutaneous white adipose | R6/2 vs. WT | 12 weeks old |
| Mielcarek M. et al. [57] | GSE38219 | brain cortex | R6/2 vs. WT | 15 weeks old |
| Mielcarek M. et al. [57] | GSE38218 | brain cortex | R6/2 vs. WT | 9 weeks old |
| Labbadia J. et al. [58] | GSE29681 | brain striatum | R6/2 vs. WT | 12 weeks old |
| Miyazaki H. et al. [59] | GSE113929 | brain striatum | R6/2 vs. WT | 4 weeks old |
Disclaimer/Publisher’s Note: The statements, opinions and data contained in all publications are solely those of the individual author(s) and contributor(s) and not of MDPI and/or the editor(s). MDPI and/or the editor(s) disclaim responsibility for any injury to people or property resulting from any ideas, methods, instructions or products referred to in the content. |
© 2024 by the authors. Licensee MDPI, Basel, Switzerland. This article is an open access article distributed under the terms and conditions of the Creative Commons Attribution (CC BY) license (https://creativecommons.org/licenses/by/4.0/).
Share and Cite
Olechnowicz, A.; Blatkiewicz, M.; Jopek, K.; Isalan, M.; Mielcarek, M.; Rucinski, M. Deregulated Transcriptome as a Platform for Adrenal Huntington’s Disease-Related Pathology. Int. J. Mol. Sci. 2024, 25, 2176. https://doi.org/10.3390/ijms25042176
Olechnowicz A, Blatkiewicz M, Jopek K, Isalan M, Mielcarek M, Rucinski M. Deregulated Transcriptome as a Platform for Adrenal Huntington’s Disease-Related Pathology. International Journal of Molecular Sciences. 2024; 25(4):2176. https://doi.org/10.3390/ijms25042176
Chicago/Turabian StyleOlechnowicz, Anna, Małgorzata Blatkiewicz, Karol Jopek, Mark Isalan, Michal Mielcarek, and Marcin Rucinski. 2024. "Deregulated Transcriptome as a Platform for Adrenal Huntington’s Disease-Related Pathology" International Journal of Molecular Sciences 25, no. 4: 2176. https://doi.org/10.3390/ijms25042176
APA StyleOlechnowicz, A., Blatkiewicz, M., Jopek, K., Isalan, M., Mielcarek, M., & Rucinski, M. (2024). Deregulated Transcriptome as a Platform for Adrenal Huntington’s Disease-Related Pathology. International Journal of Molecular Sciences, 25(4), 2176. https://doi.org/10.3390/ijms25042176