
FEN1 Inhibition as a Potential Novel Targeted Therapy against Breast Cancer and the Prognostic Relevance of FEN1
 ,
,  , , and
Abstract

1. Introduction
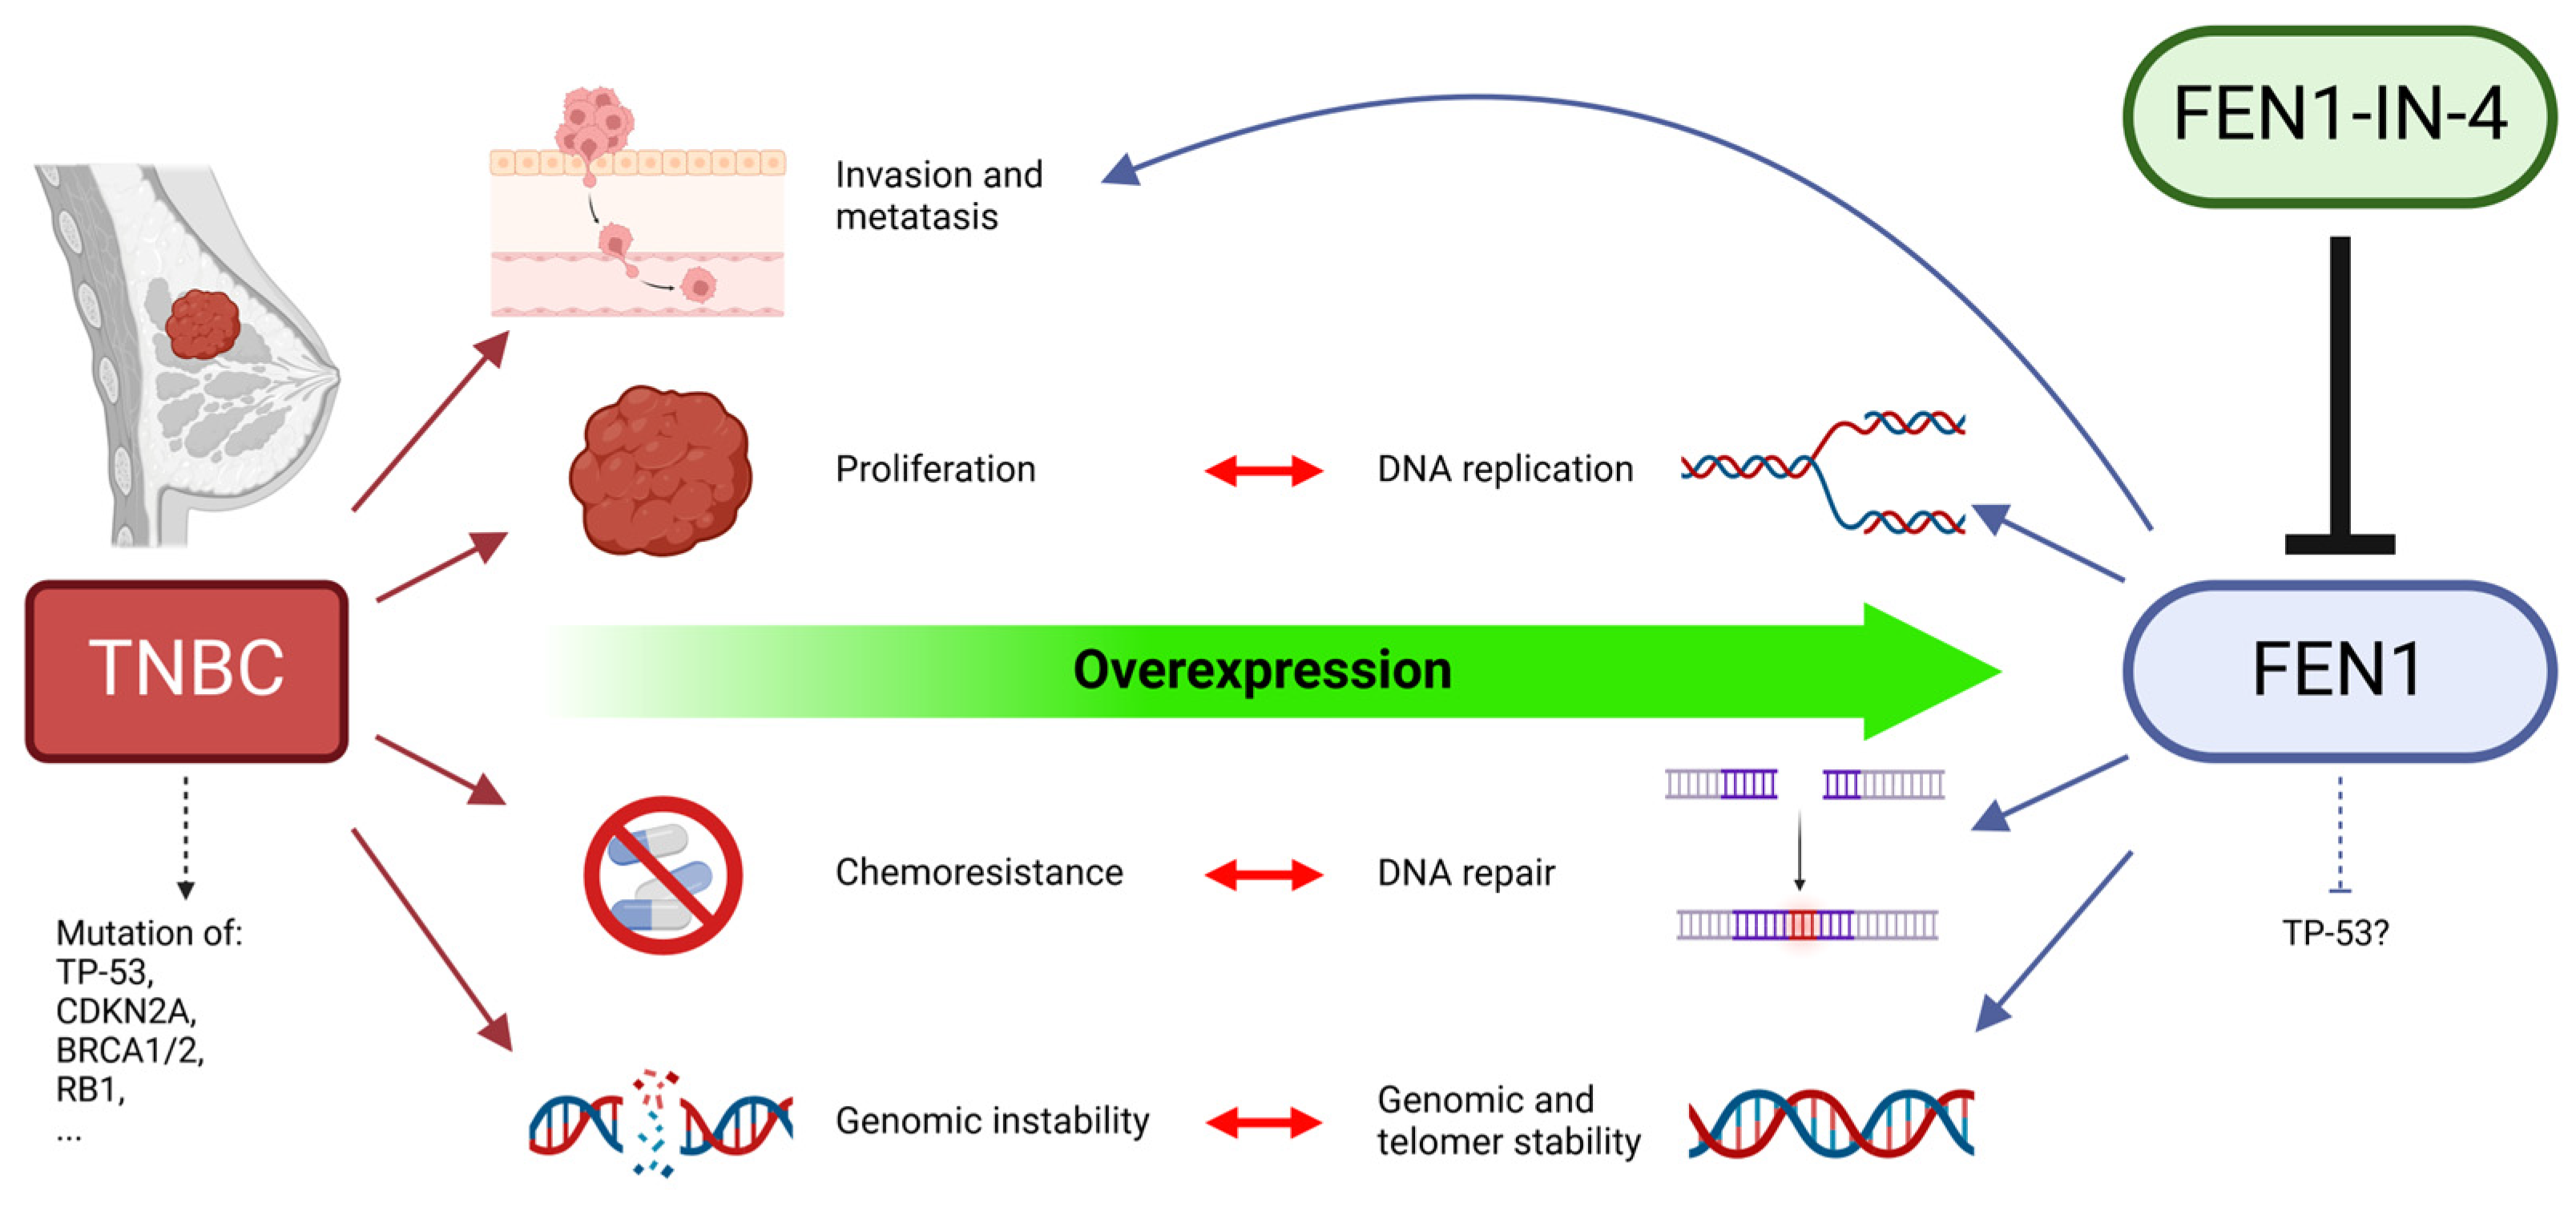
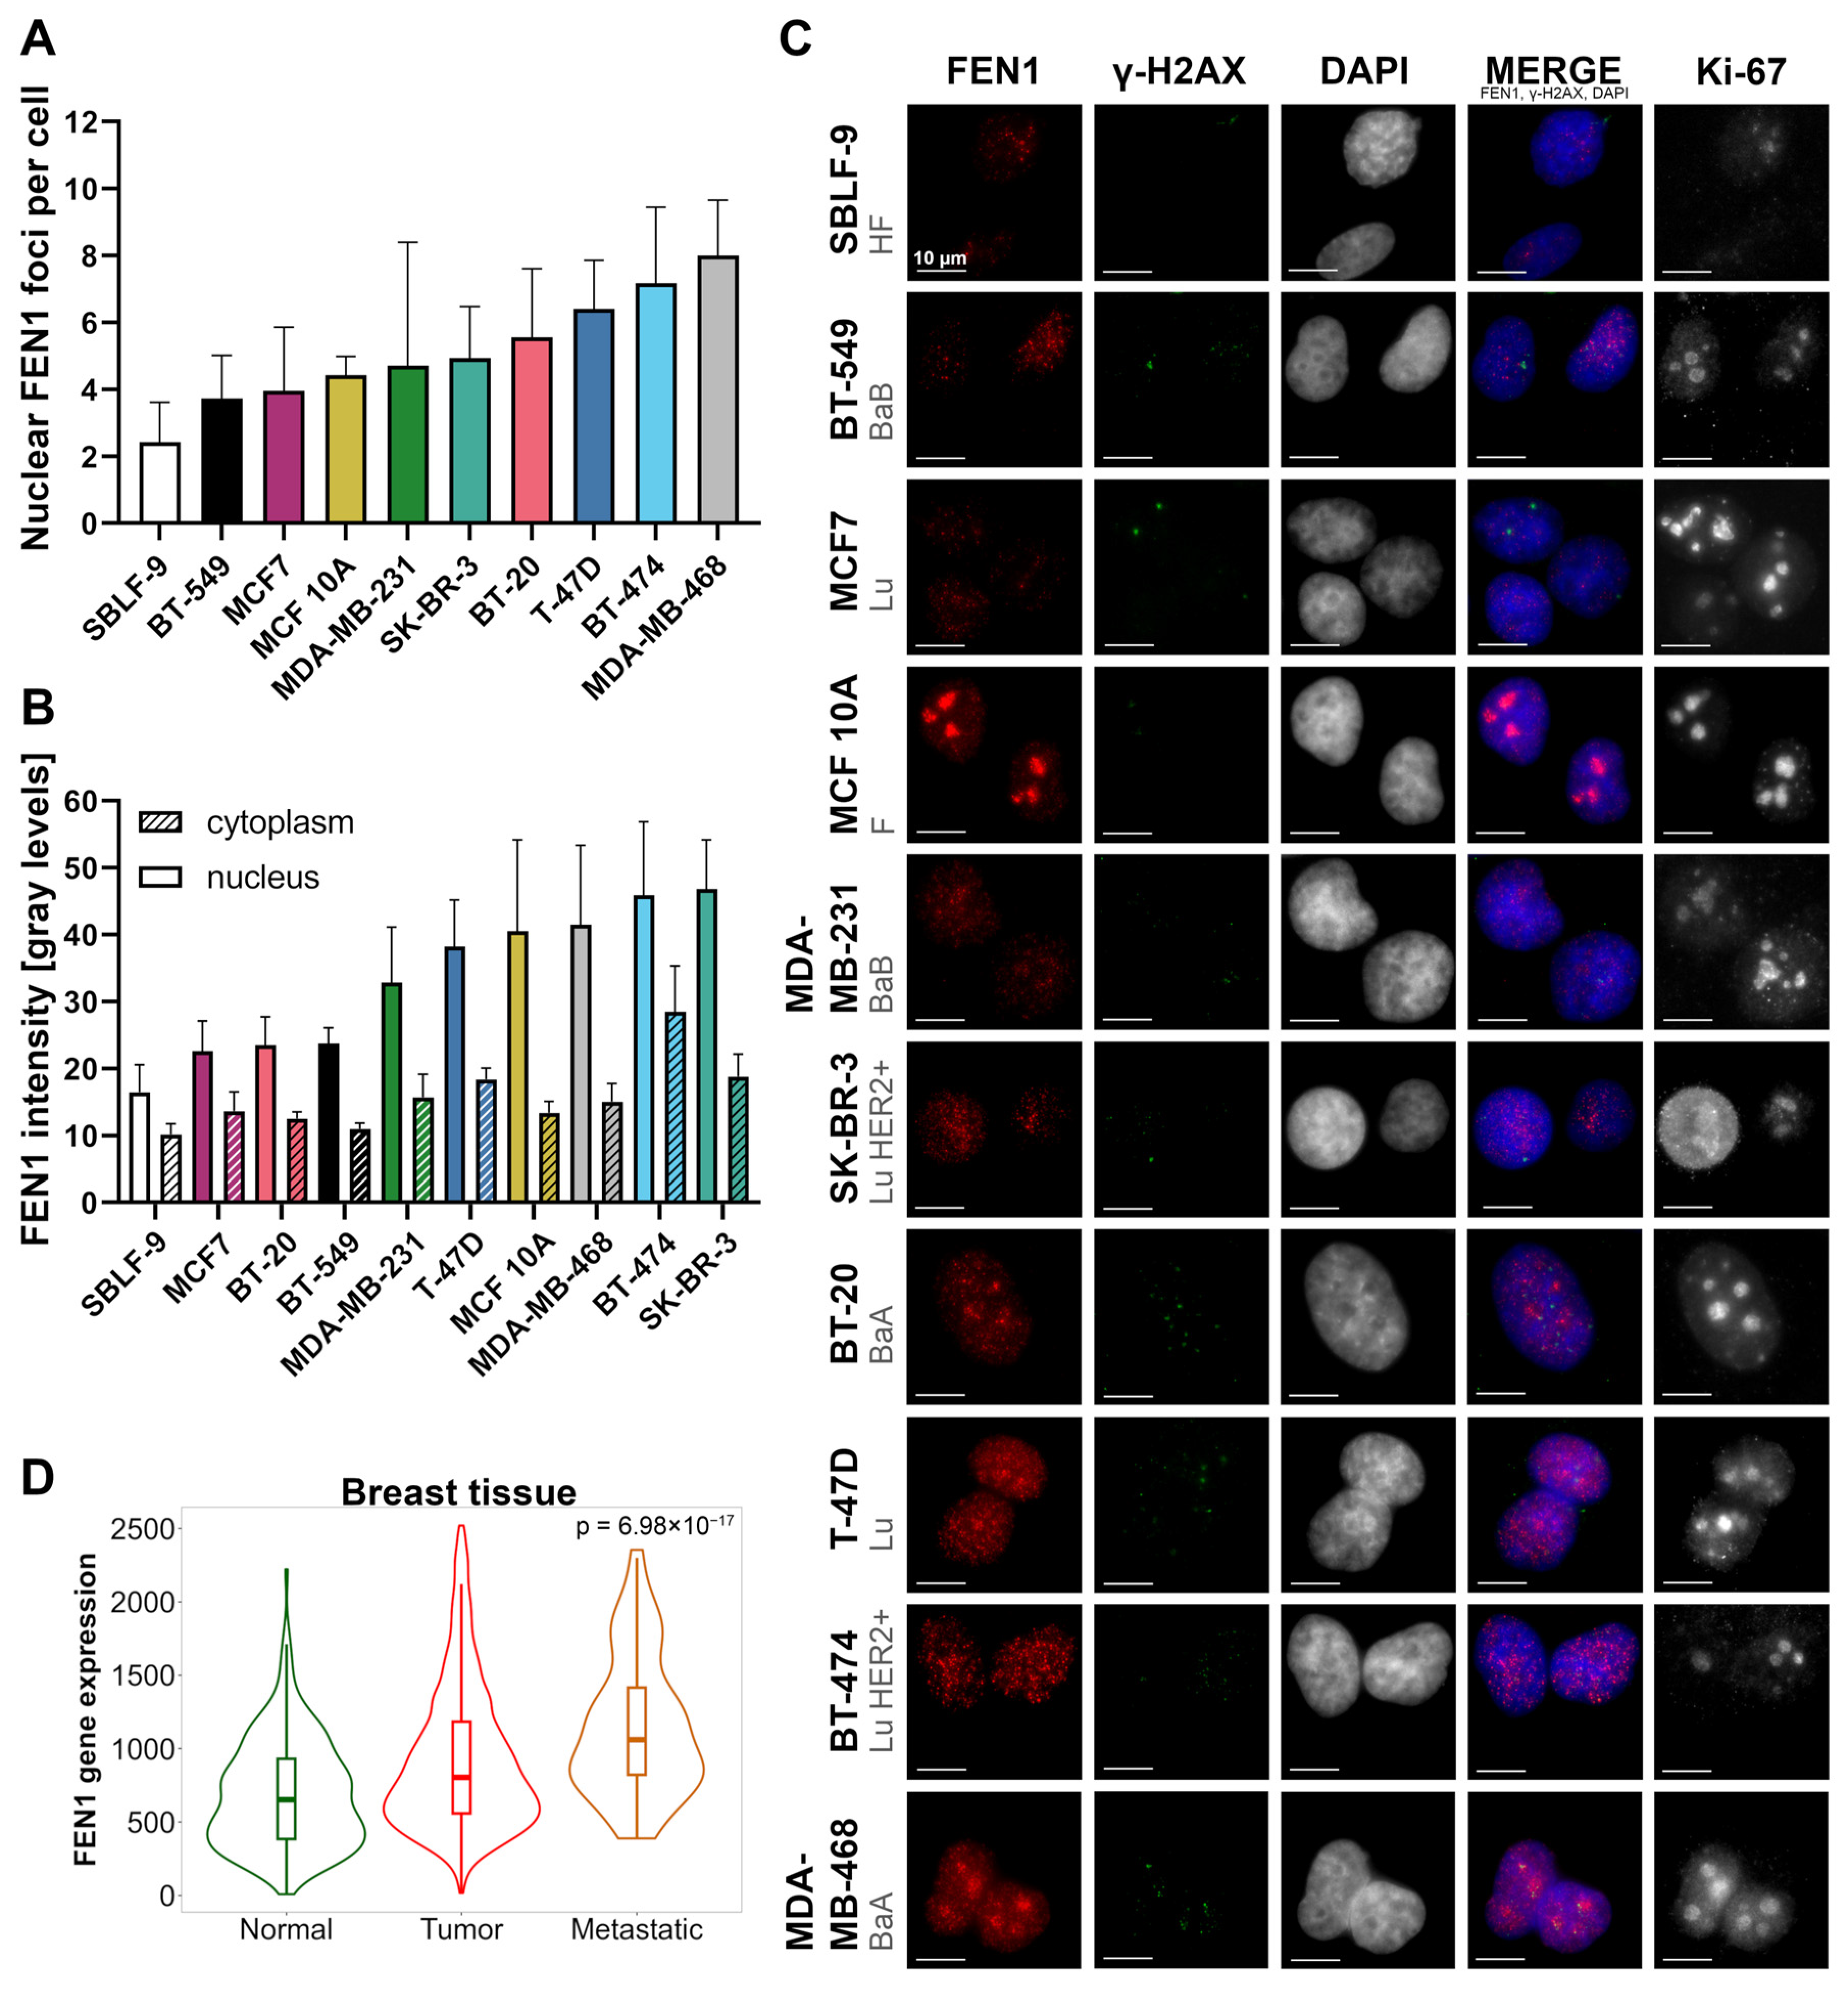
2. Results
2.1. The FEN1 Gene Is Overexpressed While Protein Levels Vary in Breast Cancer Cells
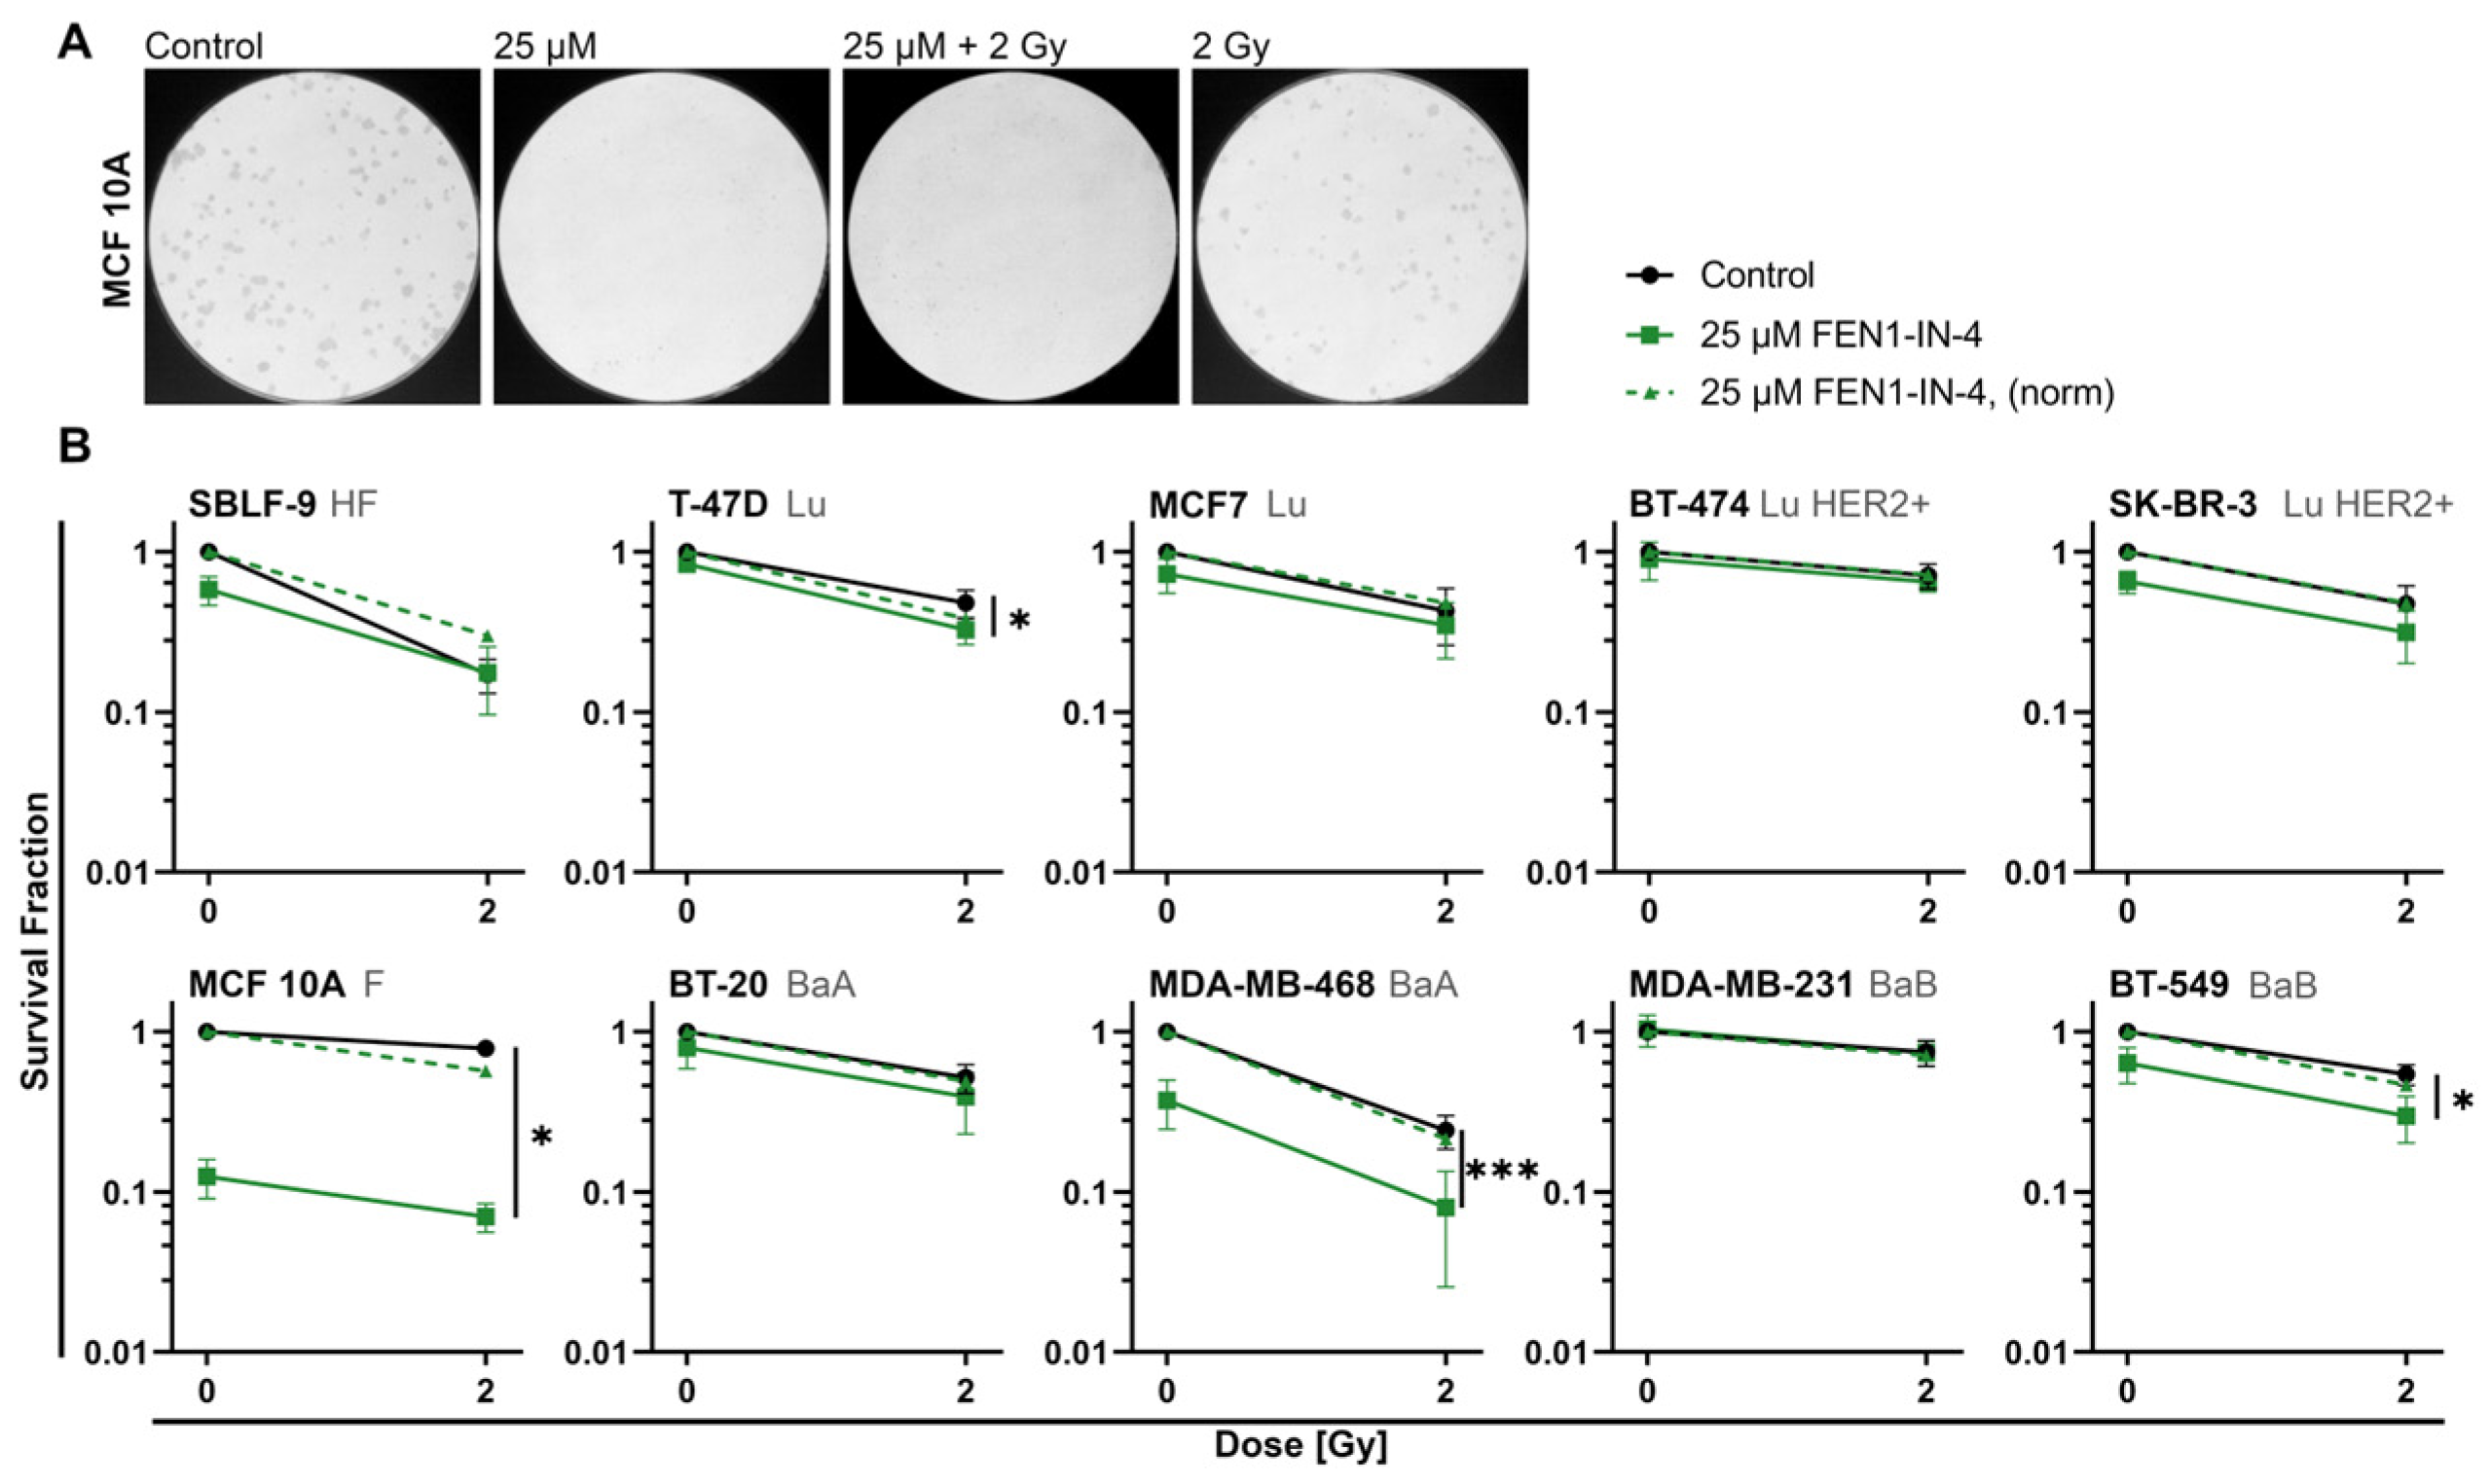
2.2. FEN1-IN-4 Reduces the Survival Fraction
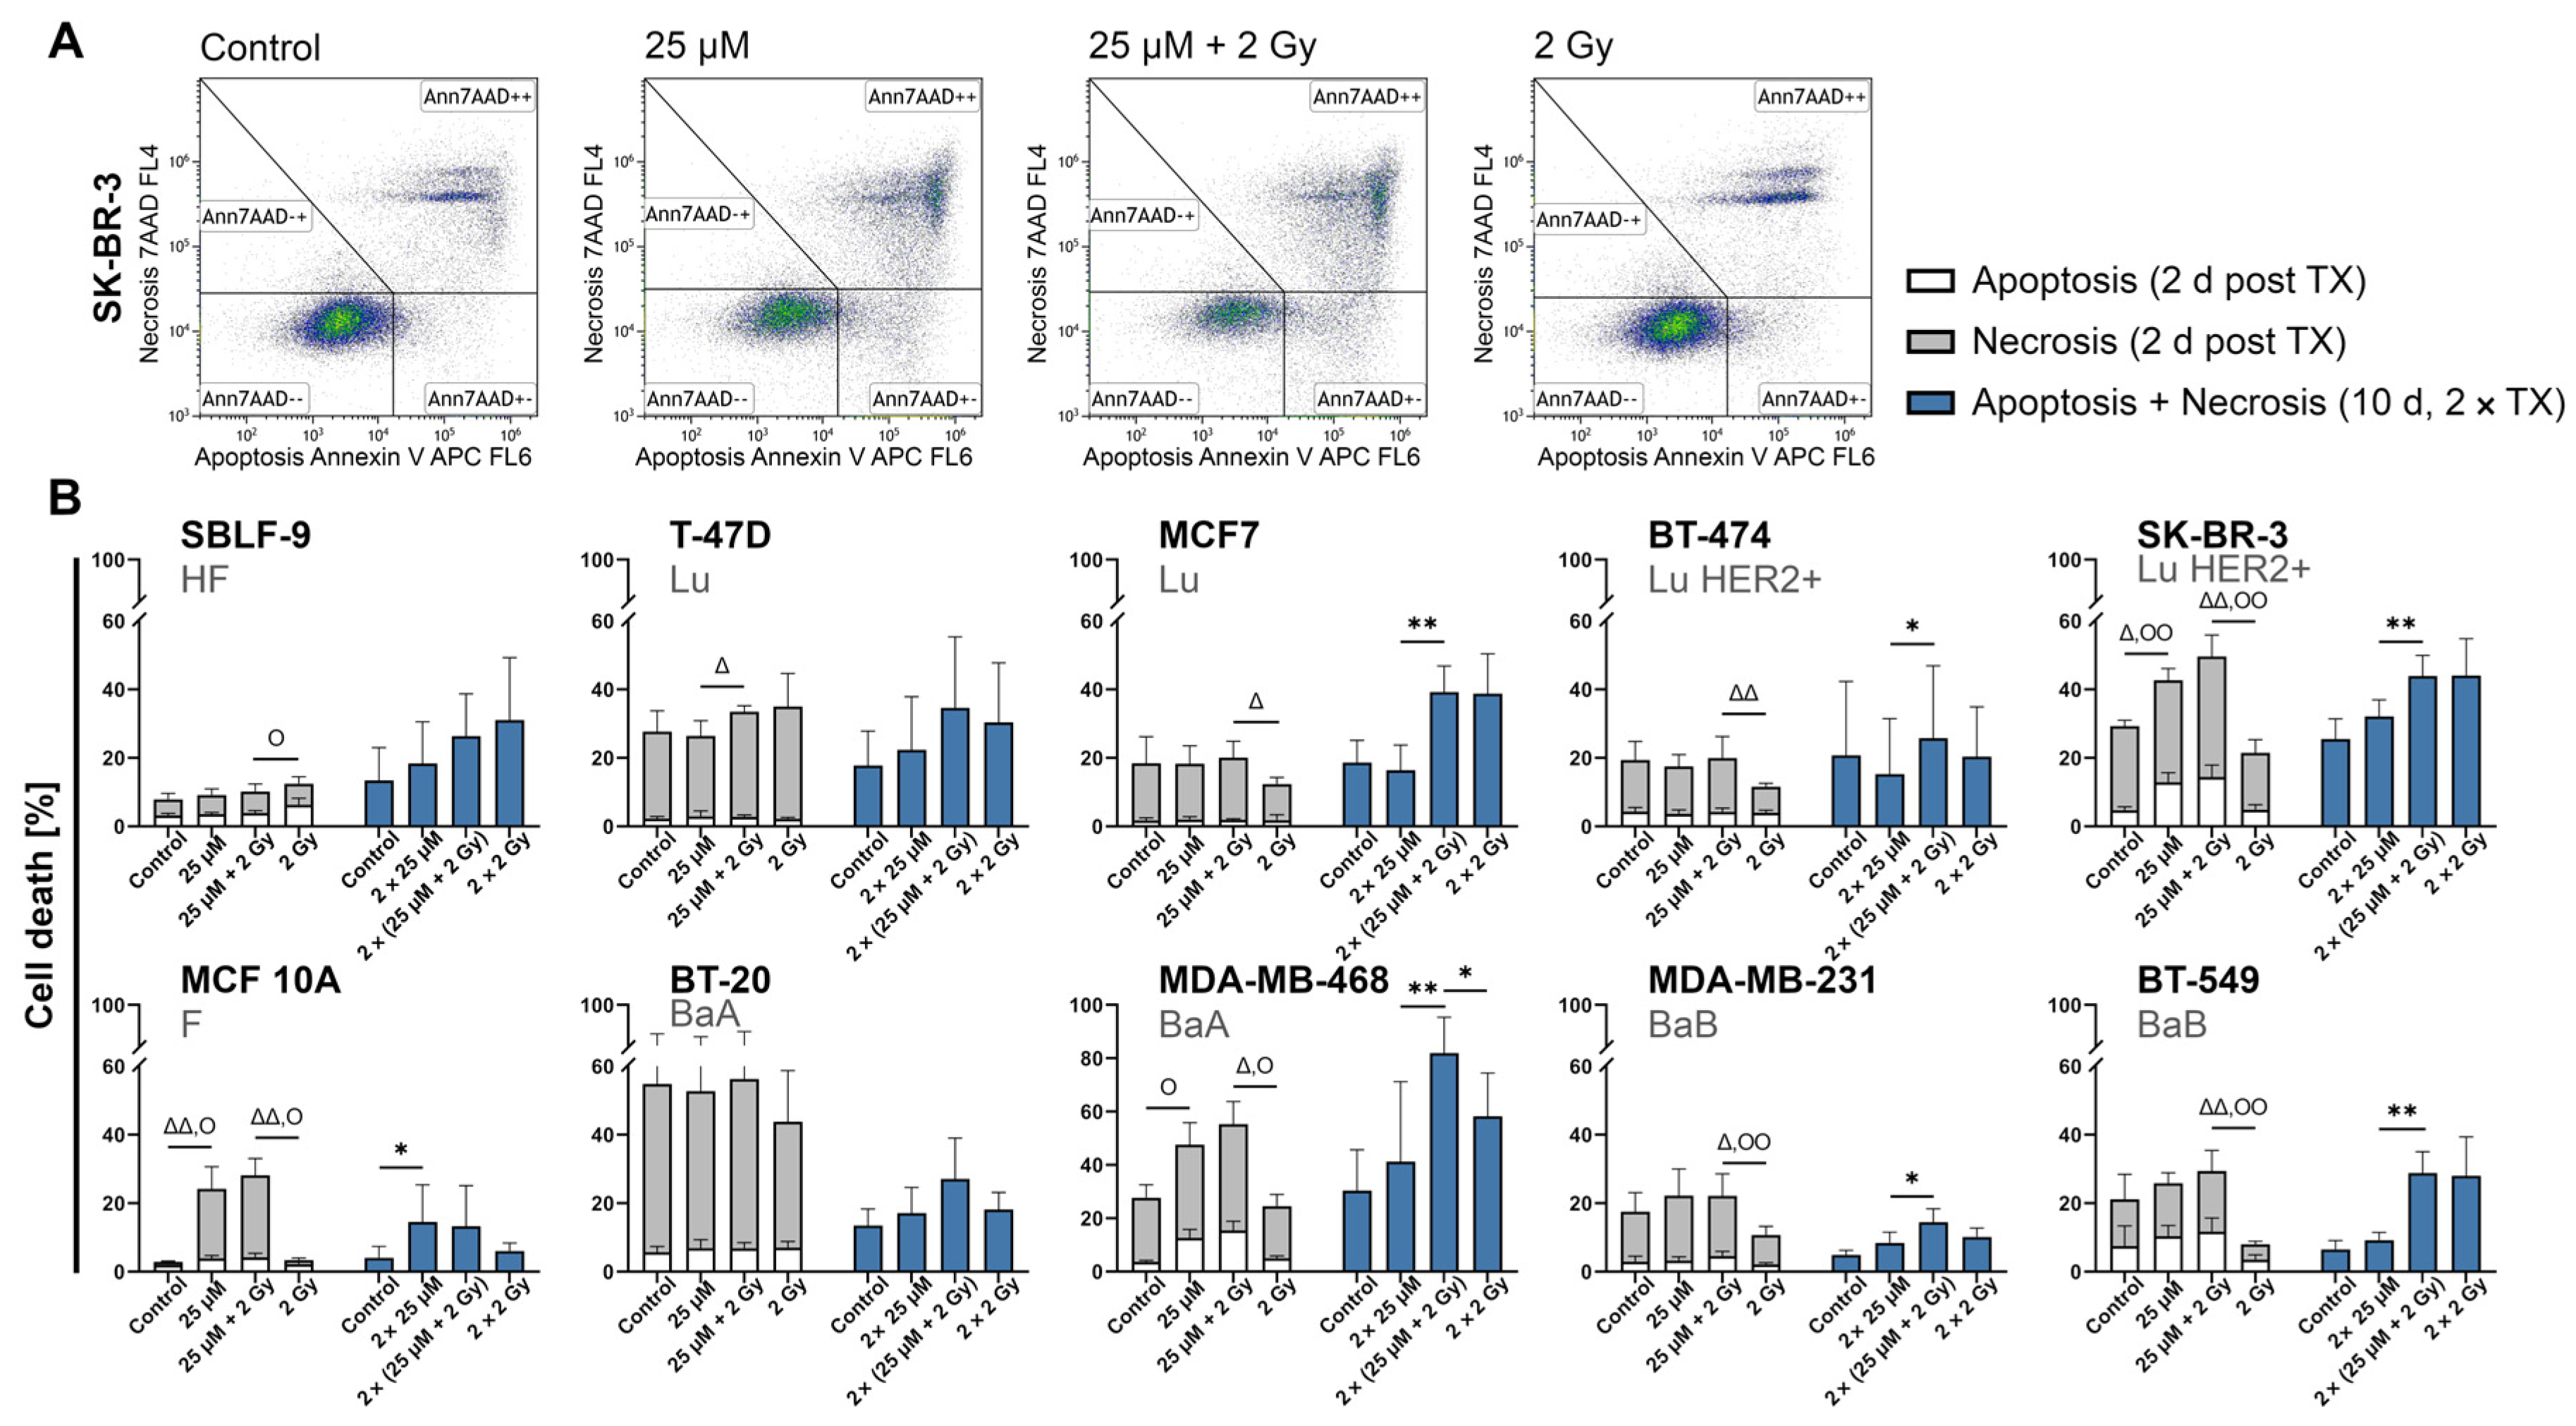
2.3. FEN1-IN-4 Induces Cell Death by Apoptosis and Necrosis
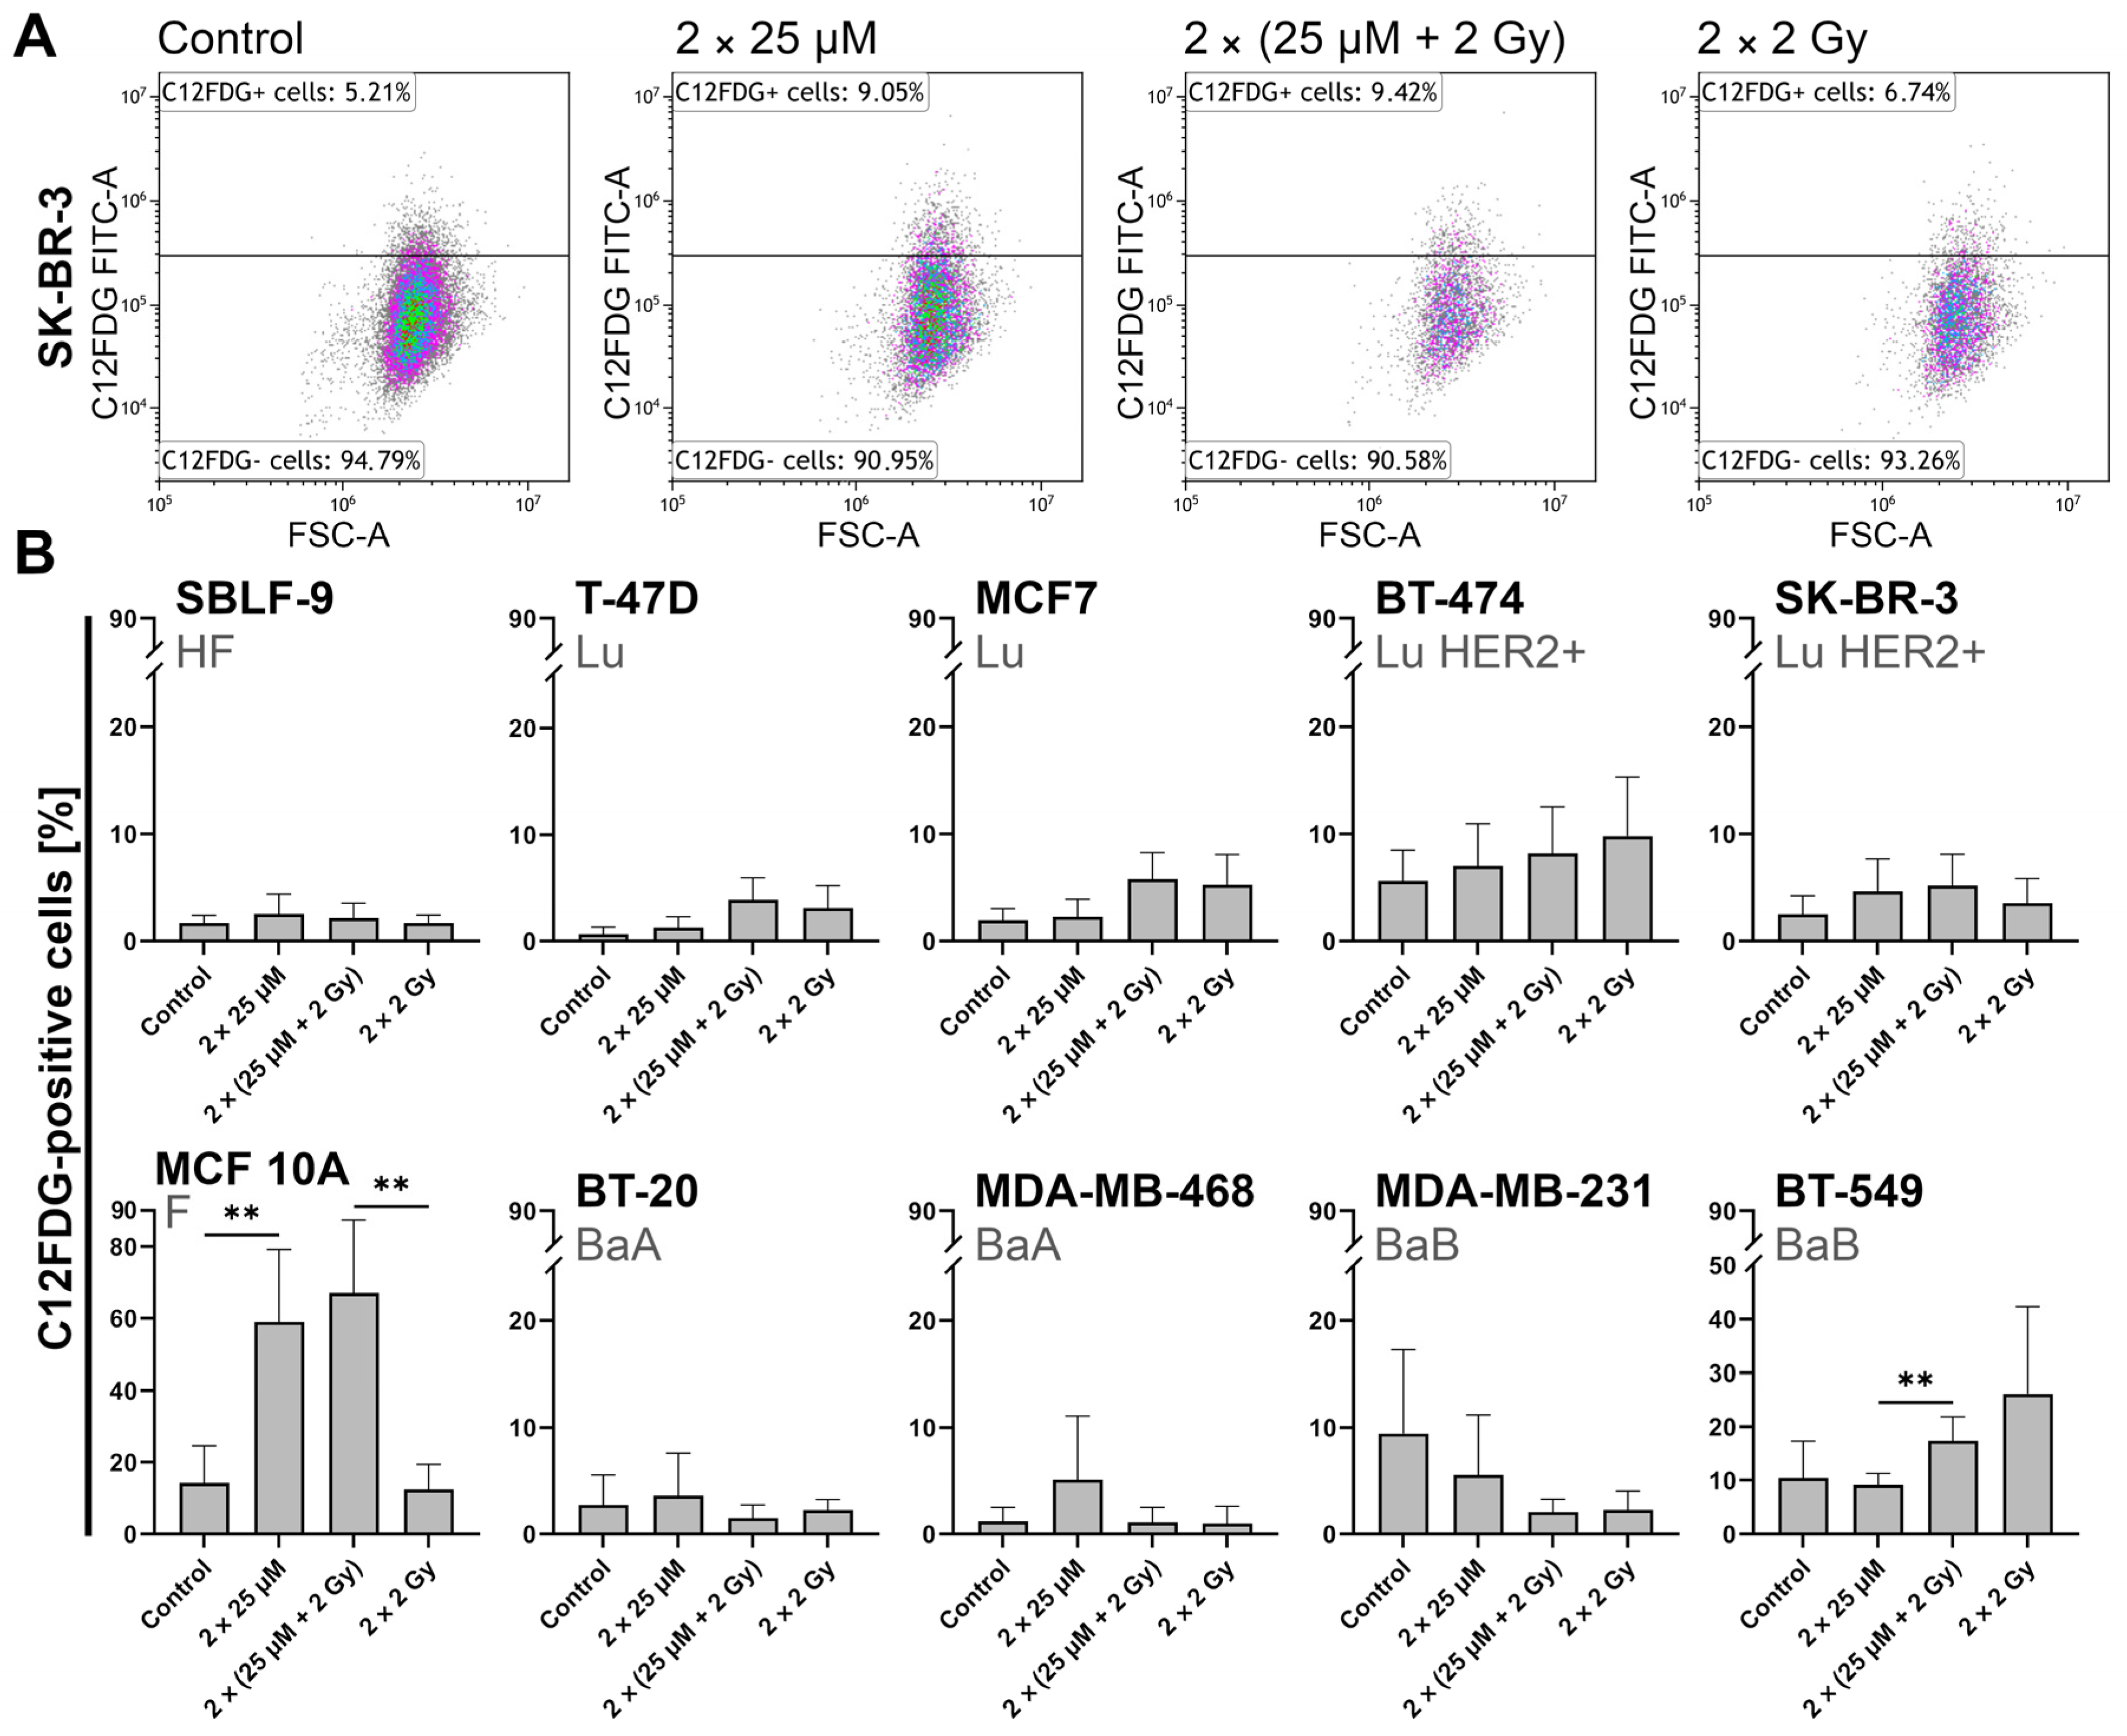
2.4. FEN1-IN-4 Induces Senescence
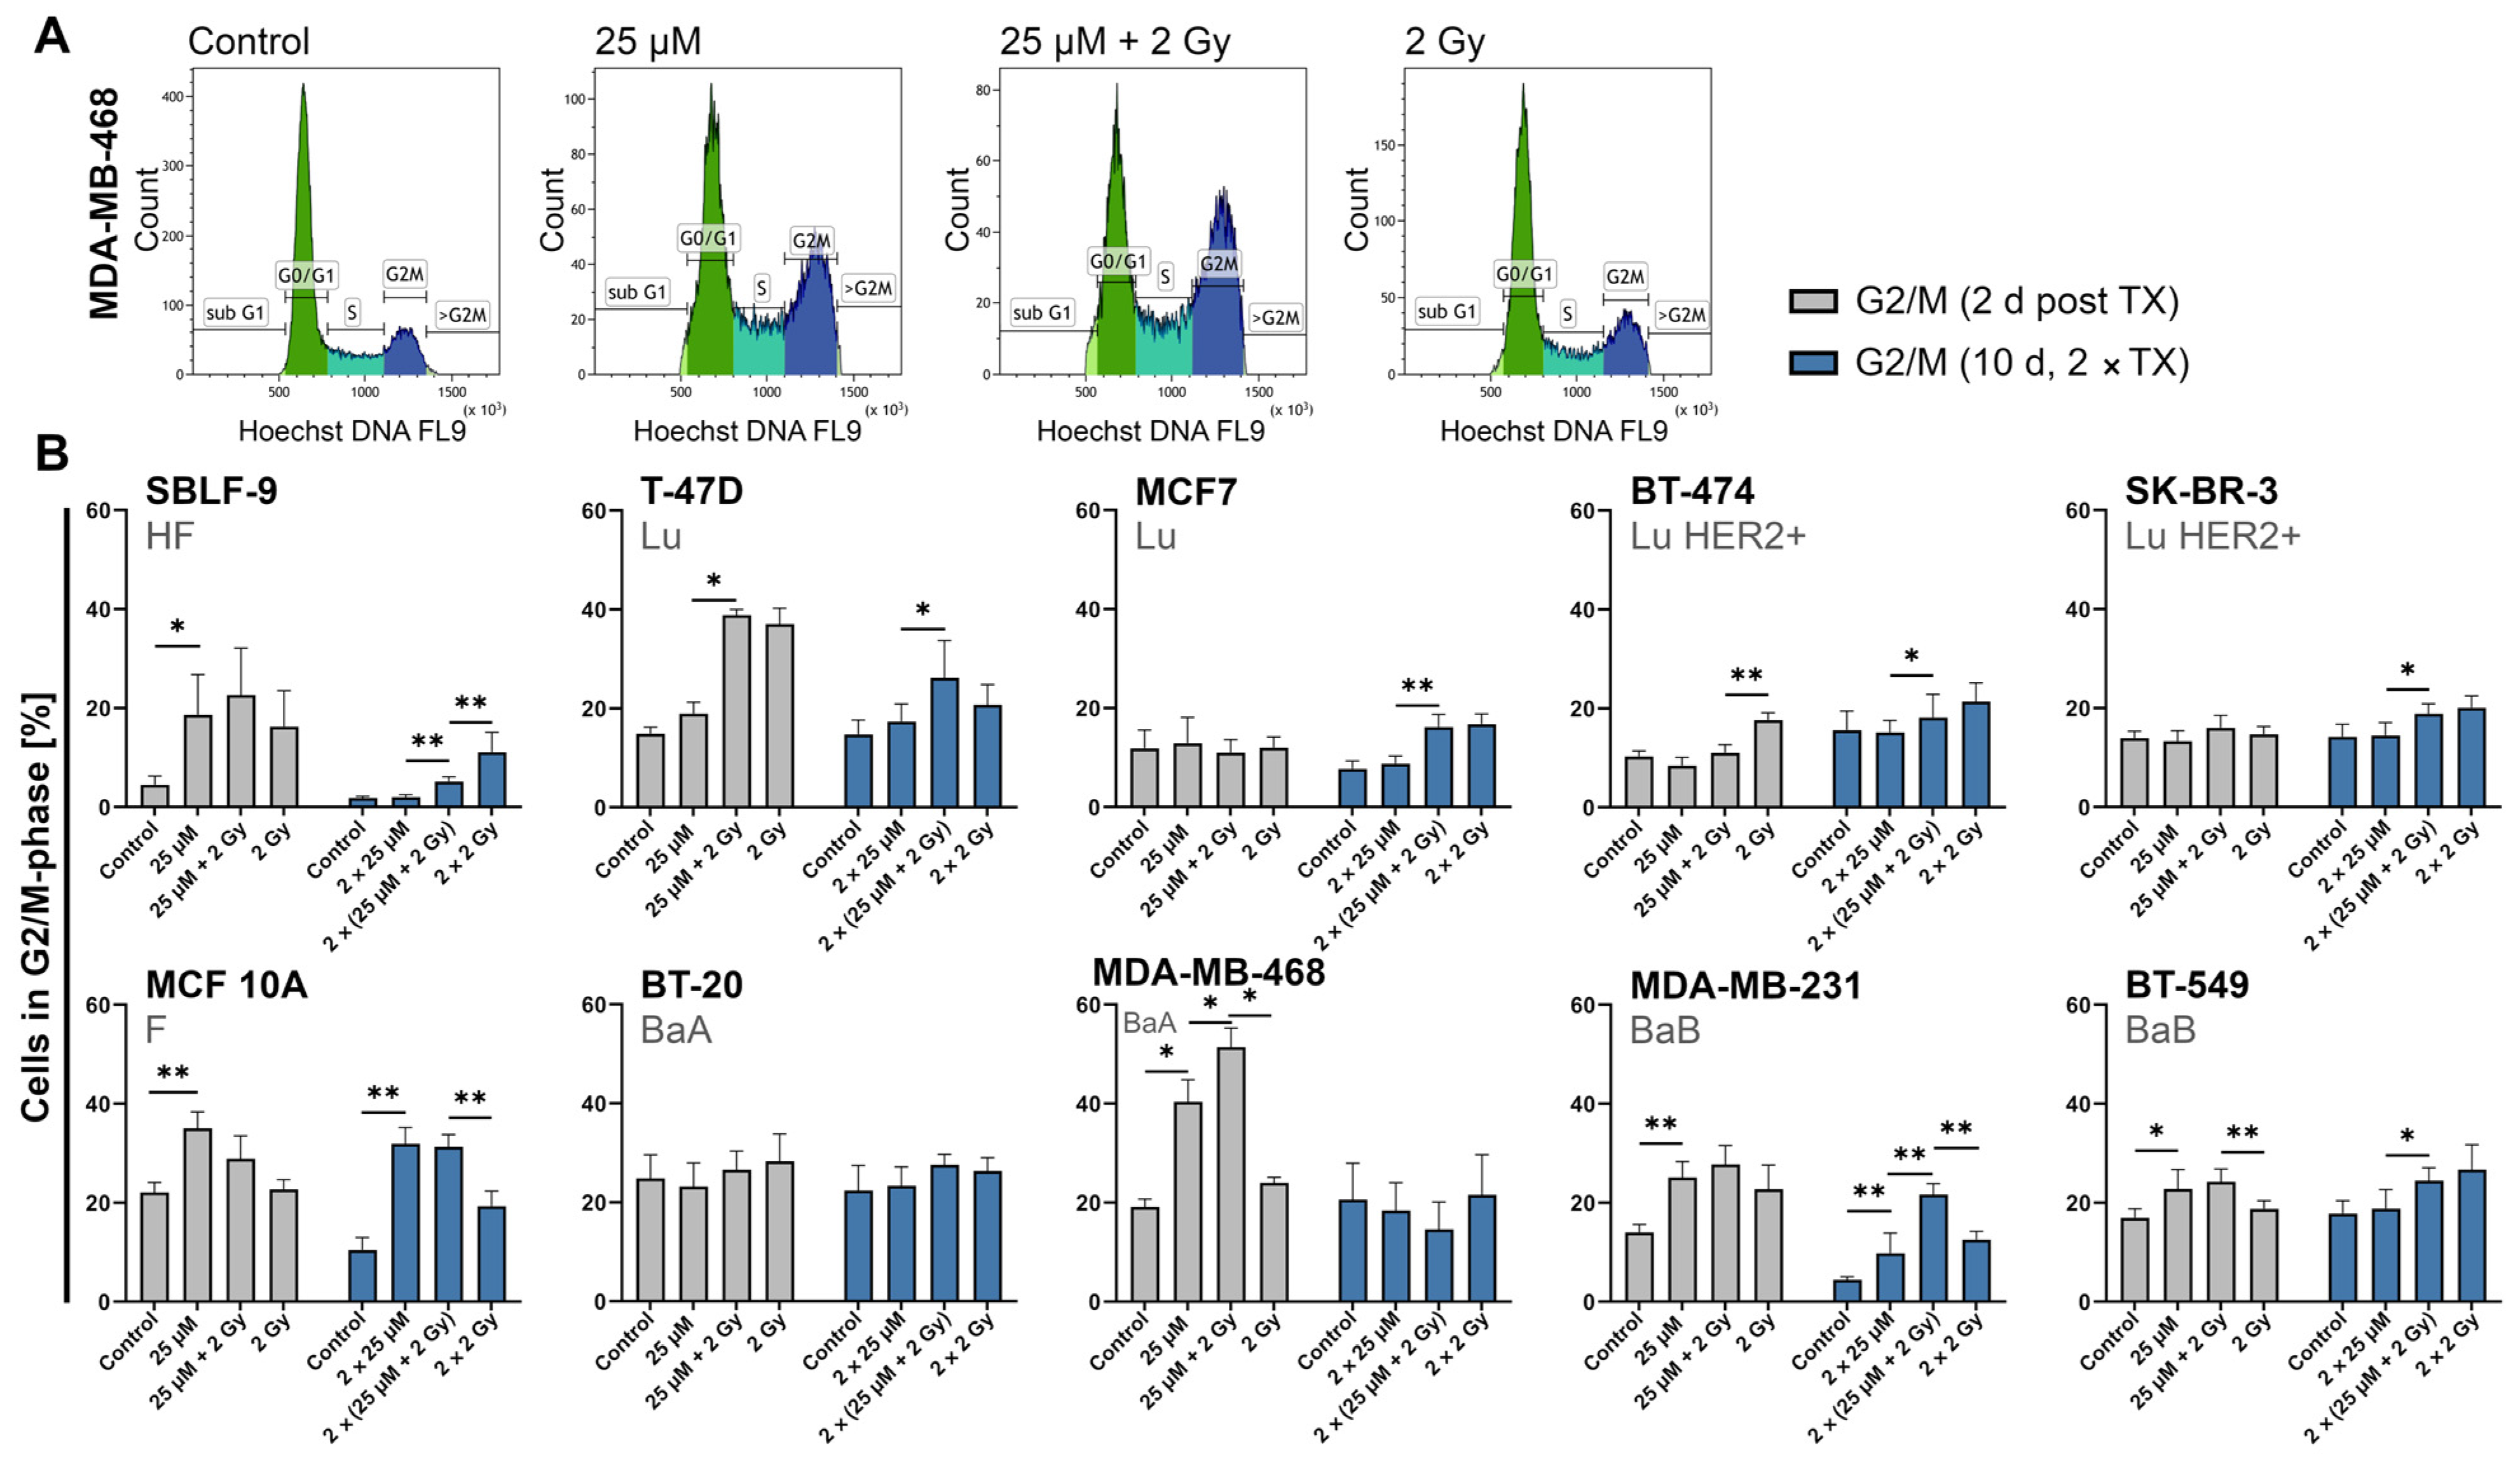
2.5. FEN1-IN-4 Influences the Cell Cycle and Increases the G2/M Share
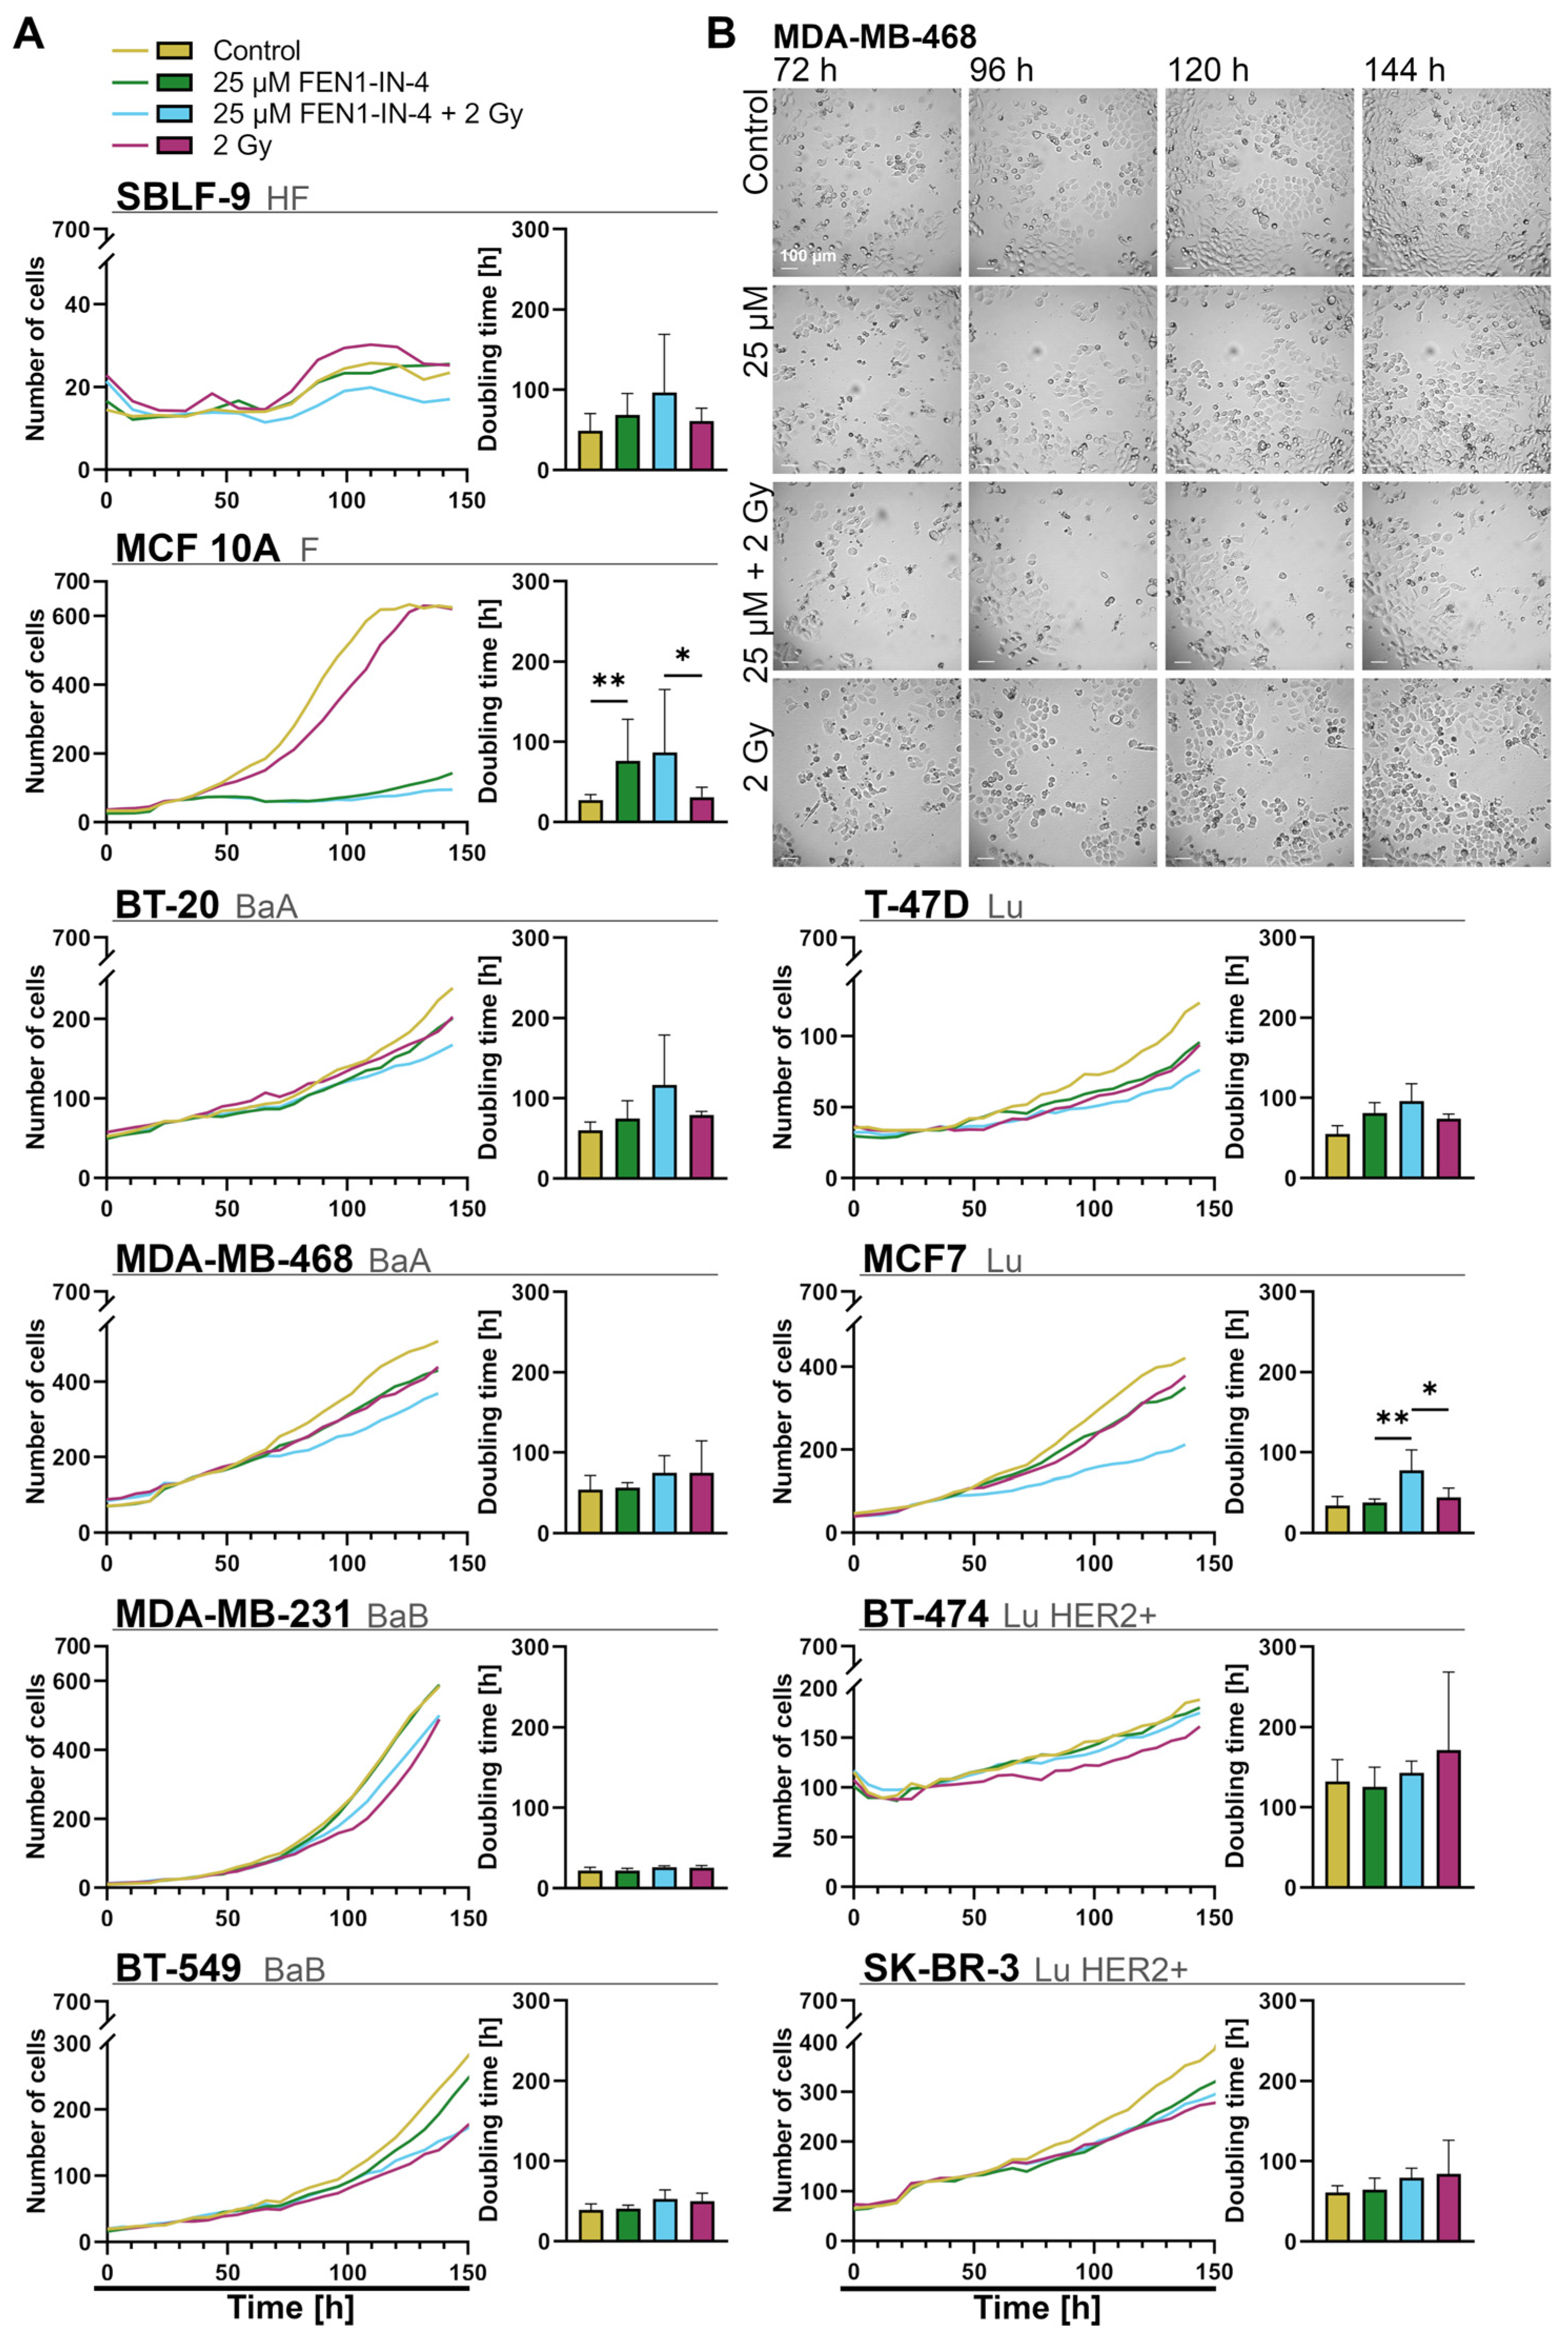
2.6. FEN1-IN-4 Impedes Population Growth by Extending the Doubling Time
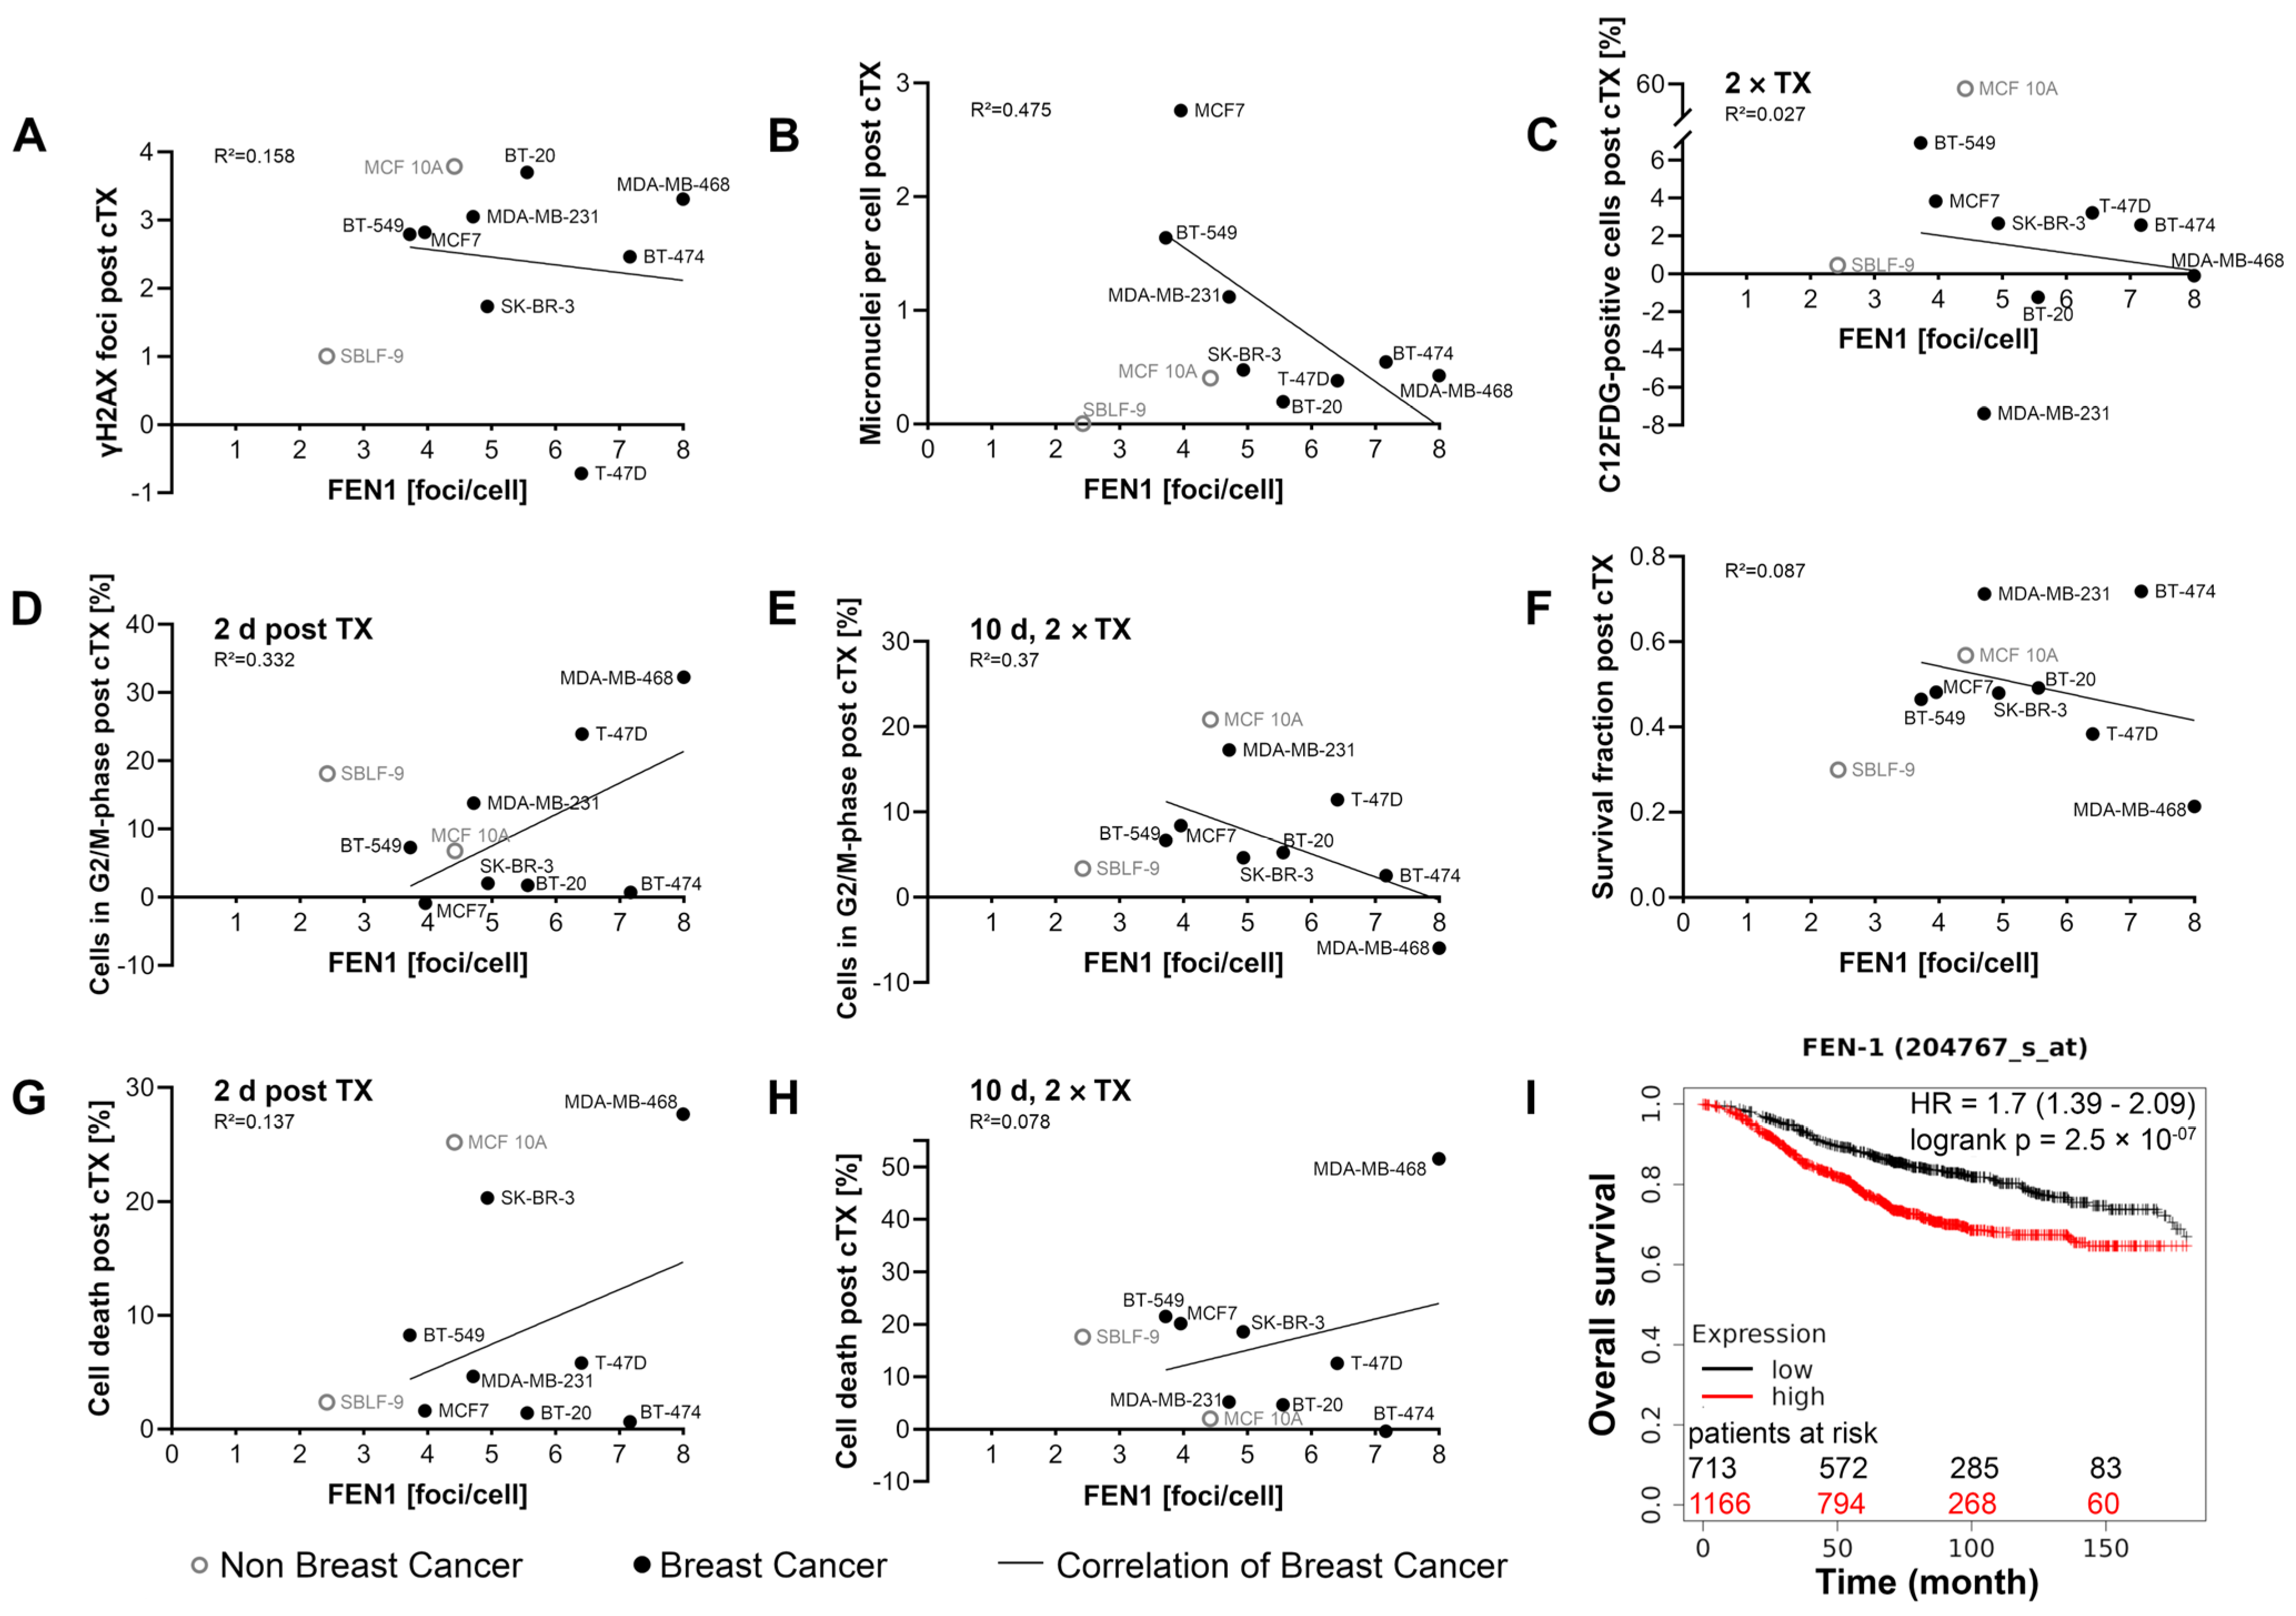
2.7. FEN1-IN-4 Leads to DNA Damage
2.8. Association between FEN1 Level and Prognosis
3. Discussion
3.1. FEN1 Distribution and Variance in Cells
3.2. FEN1-IN-4 Has Cytotoxic Effects
3.3. FEN1-IN-4 Affects the Cell Cycle
3.4. FEN1-IN-4 Has a Cytostatic Influence on Cells
3.5. The Impact of FEN1-IN-4 on Non-Malignant Cells
3.6. Is FEN1 a New Potential Biomarker for the Treatment of Breast Cancer?
3.7. Is FEN1 Relevant for Prognosis?
3.8. Is FEN1-IN-4 a New Potential Targeted Therapeutic Agent for Breast Cancer?
4. Materials and Methods
4.1. Cell Lines and Cell Culture
4.2. Treatment with Inhibitor FEN1-IN-4 and Ionizing Radiation
4.3. Imaging DNA Damage, Micronuclei, Cell Proliferation, and FEN1 by Immunofluorescence Microscopy
4.4. Clonogenic Cell Survival by Colony Formation Assay
4.5. Combined Assay for Apoptosis, Necrosis, and the Cell Cycle by Flow Cytometry (2-Day Protocol)
4.6. Combined Assay for Senescence, Apoptosis, Necrosis, and the Cell Cycle by Flow Cytometry (10-Day Protocol)
4.7. Monitoring of Living Cells with 24-Channel Microscopy
4.8. Statistical Analysis
4.9. Investigation of Prognosis Depending on FEN1 Gene Expression Using the Kaplan–Meier Plotter Database
4.10. Expression of the FEN1 Gene in Breast Tissue, Tumor, and Metastasis Using TNMplot Database
5. Conclusions
Supplementary Materials
Author Contributions
Funding
Institutional Review Board Statement
Informed Consent Statement
Data Availability Statement
Acknowledgments
Conflicts of Interest
References
- Harbeck, N.; Gnant, M. Breast cancer. Lancet 2017, 389, 1134–1150. [Google Scholar] [CrossRef]
- Arnold, M.; Morgan, E.; Rumgay, H.; Mafra, A.; Singh, D.; Laversanne, M.; Vignat, J.; Gralow, J.R.; Cardoso, F.; Siesling, S.; et al. Current and future burden of breast cancer: Global statistics for 2020 and 2040. Breast 2022, 66, 15–23. [Google Scholar] [CrossRef]
- Zhang, L.; Feizi, N.; Chi, C.; Hu, P. Association Analysis of Somatic Copy Number Alteration Burden with Breast Cancer Survival. Front. Genet. 2018, 9, 421. [Google Scholar] [CrossRef]
- Jiang, G.; Zhang, S.; Yazdanparast, A.; Li, M.; Pawar, A.V.; Liu, Y.; Inavolu, S.M.; Cheng, L. Comprehensive comparison of molecular portraits between cell lines and tumors in breast cancer. BMC Genom. 2016, 17 (Suppl. S7), 525. [Google Scholar] [CrossRef] [PubMed]
- Neve, R.M.; Chin, K.; Fridlyand, J.; Yeh, J.; Baehner, F.L.; Fevr, T.; Clark, L.; Bayani, N.; Coppe, J.P.; Tong, F.; et al. A collection of breast cancer cell lines for the study of functionally distinct cancer subtypes. Cancer Cell 2006, 10, 515–527. [Google Scholar] [CrossRef] [PubMed]
- Sinn, P.; Aulmann, S.; Wirtz, R.; Schott, S.; Marme, F.; Varga, Z.; Lebeau, A.; Kreipe, H.; Schneeweiss, A. Multigene Assays for Classification, Prognosis, and Prediction in Breast Cancer: A Critical Review on the Background and Clinical Utility. Geburtshilfe Frauenheilkd. 2013, 73, 932–940. [Google Scholar] [CrossRef]
- Perou, C.M.; Sorlie, T.; Eisen, M.B.; van de Rijn, M.; Jeffrey, S.S.; Rees, C.A.; Pollack, J.R.; Ross, D.T.; Johnsen, H.; Akslen, L.A.; et al. Molecular portraits of human breast tumours. Nature 2000, 406, 747–752. [Google Scholar] [CrossRef] [PubMed]
- Yersal, O.; Barutca, S. Biological subtypes of breast cancer: Prognostic and therapeutic implications. World J. Clin. Oncol. 2014, 5, 412–424. [Google Scholar] [CrossRef] [PubMed]
- Prat, A.; Perou, C.M. Deconstructing the molecular portraits of breast cancer. Mol. Oncol. 2011, 5, 5–23. [Google Scholar] [CrossRef] [PubMed]
- Weigelt, B.; Baehner, F.L.; Reis-Filho, J.S. The contribution of gene expression profiling to breast cancer classification, prognostication and prediction: A retrospective of the last decade. J. Pathol. 2010, 220, 263–280. [Google Scholar] [CrossRef] [PubMed]
- Prat, A.; Parker, J.S.; Karginova, O.; Fan, C.; Livasy, C.; Herschkowitz, J.I.; He, X.; Perou, C.M. Phenotypic and molecular characterization of the claudin-low intrinsic subtype of breast cancer. Breast Cancer Res. 2010, 12, R68. [Google Scholar] [CrossRef] [PubMed]
- Luís, C.; Guerra-Carvalho, B.; Braga, P.C.; Guedes, C.; Patrício, E.; Alves, M.G.; Fernandes, R.; Soares, R. The Influence of Adipocyte Secretome on Selected Metabolic Fingerprints of Breast Cancer Cell Lines Representing the Four Major Breast Cancer Subtypes. Cells 2023, 12, 2123. [Google Scholar] [CrossRef] [PubMed]
- Dai, X.; Cheng, H.; Bai, Z.; Li, J. Breast Cancer Cell Line Classification and Its Relevance with Breast Tumor Subtyping. J. Cancer 2017, 8, 3131–3141. [Google Scholar] [CrossRef] [PubMed]
- Masci, D.; Naro, C.; Puxeddu, M.; Urbani, A.; Sette, C.; La Regina, G.; Silvestri, R. Recent Advances in Drug Discovery for Triple-Negative Breast Cancer Treatment. Molecules 2023, 28, 7513. [Google Scholar] [CrossRef] [PubMed]
- Limsakul, P.; Choochuen, P.; Jungrungrueang, T.; Charupanit, K. Prognostic Markers in Tyrosine Kinases Specific to Basal-like 2 Subtype of Triple-Negative Breast Cancer. Int. J. Mol. Sci. 2024, 25, 1405. [Google Scholar] [CrossRef]
- Chapdelaine, A.G.; Sun, G. Challenges and Opportunities in Developing Targeted Therapies for Triple Negative Breast Cancer. Biomolecules 2023, 13, 1207. [Google Scholar] [CrossRef] [PubMed]
- O’Neill, A.C.; Alessandrino, F.; Tirumani, S.H.; Ramaiya, N.H. Hallmarks of Cancer in the Reading Room: A Guide for Radiologists. Am. J. Roentgenol. 2018, 211, 470–484. [Google Scholar] [CrossRef]
- Hanahan, D. Hallmarks of Cancer: New Dimensions. Cancer Discov. 2022, 12, 31–46. [Google Scholar] [CrossRef]
- Harrington, J.J.; Lieber, M.R. The characterization of a mammalian DNA structure-specific endonuclease. EMBO J. 1994, 13, 1235–1246. [Google Scholar] [CrossRef]
- Zheng, L.; Dai, H.; Zhou, M.; Li, M.; Singh, P.; Qiu, J.; Tsark, W.; Huang, Q.; Kernstine, K.; Zhang, X.; et al. Fen1 mutations result in autoimmunity, chronic inflammation and cancers. Nat. Med. 2007, 13, 812–819. [Google Scholar] [CrossRef]
- Zheng, L.; Jia, J.; Finger, L.D.; Guo, Z.; Zer, C.; Shen, B. Functional regulation of FEN1 nuclease and its link to cancer. Nucleic Acids Res. 2011, 39, 781–794. [Google Scholar] [CrossRef] [PubMed]
- Balakrishnan, L.; Bambara, R.A. Flap endonuclease 1. Annu. Rev. Biochem. 2013, 82, 119–138. [Google Scholar] [CrossRef] [PubMed]
- Harrington, J.J.; Lieber, M.R. Functional domains within FEN-1 and RAD2 define a family of structure-specific endonucleases: Implications for nucleotide excision repair. Genes Dev. 1994, 8, 1344–1355. [Google Scholar] [CrossRef] [PubMed]
- Zheng, L.; Zhou, M.; Chai, Q.; Parrish, J.; Xue, D.; Patrick, S.M.; Turchi, J.J.; Yannone, S.M.; Chen, D.; Shen, B. Novel function of the flap endonuclease 1 complex in processing stalled DNA replication forks. EMBO Rep. 2005, 6, 83–89. [Google Scholar] [CrossRef] [PubMed]
- Singh, P.; Yang, M.; Dai, H.; Yu, D.; Huang, Q.; Tan, W.; Kernstine, K.H.; Lin, D.; Shen, B. Overexpression and Hypomethylation of Flap Endonuclease 1 Gene in Breast and Other Cancers. Mol. Cancer Res. 2008, 6, 1710–1717. [Google Scholar] [CrossRef] [PubMed]
- Nolan, J.P.; Shen, B.; Park, M.S.; Sklar, L.A. Kinetic analysis of human flap endonuclease-1 by flow cytometry. Biochemistry 1996, 35, 11668–11676. [Google Scholar] [CrossRef]
- Guo, Z.; Qian, L.; Liu, R.; Dai, H.; Zhou, M.; Zheng, L.; Shen, B. Nucleolar localization and dynamic roles of flap endonuclease 1 in ribosomal DNA replication and damage repair. Mol. Cell. Biol. 2008, 28, 4310–4319. [Google Scholar] [CrossRef]
- Alhmoud, J.F.; Woolley, J.F.; Al Moustafa, A.E.; Malki, M.I. DNA Damage/Repair Management in Cancers. Cancers 2020, 12, 1050. [Google Scholar] [CrossRef]
- Kinner, A.; Wu, W.; Staudt, C.; Iliakis, G. Gamma-H2AX in recognition and signaling of DNA double-strand breaks in the context of chromatin. Nucleic Acids Res. 2008, 36, 5678–5694. [Google Scholar] [CrossRef]
- Wu, X.; Wilson, T.E.; Lieber, M.R. A role for FEN-1 in nonhomologous DNA end joining: The order of strand annealing and nucleolytic processing events. Proc. Natl. Acad. Sci. USA 1999, 96, 1303–1308. [Google Scholar] [CrossRef]
- Qiu, J.; Li, X.; Frank, G.; Shen, B. Cell cycle-dependent and DNA damage-inducible nuclear localization of FEN-1 nuclease is consistent with its dual functions in DNA replication and repair. J. Biol. Chem. 2001, 276, 4901–4908. [Google Scholar] [CrossRef]
- Ranalli, T.A.; Tom, S.; Bambara, R.A. AP endonuclease 1 coordinates flap endonuclease 1 and DNA ligase I activity in long patch base excision repair. J. Biol. Chem. 2002, 277, 41715–41724. [Google Scholar] [CrossRef]
- Krokan, H.E.; Standal, R.; Slupphaug, G. DNA glycosylases in the base excision repair of DNA. Biochem. J. 1997, 325 Pt 1, 1–16. [Google Scholar] [CrossRef]
- Robertson, A.B.; Klungland, A.; Rognes, T.; Leiros, I. DNA repair in mammalian cells: Base excision repair: The long and short of it. Cell Mol. Life Sci. 2009, 66, 981–993. [Google Scholar] [CrossRef]
- Prasad, R.; Singhal, R.K.; Srivastava, D.K.; Molina, J.T.; Tomkinson, A.E.; Wilson, S.H. Specific interaction of DNA polymerase beta and DNA ligase I in a multiprotein base excision repair complex from bovine testis. J. Biol. Chem. 1996, 271, 16000–16007. [Google Scholar] [CrossRef]
- Kikuchi, K.; Taniguchi, Y.; Hatanaka, A.; Sonoda, E.; Hochegger, H.; Adachi, N.; Matsuzaki, Y.; Koyama, H.; van Gent, D.C.; Jasin, M.; et al. Fen-1 facilitates homologous recombination by removing divergent sequences at DNA break ends. Mol. Cell. Biol. 2005, 25, 6948–6955. [Google Scholar] [CrossRef]
- Mengwasser, K.E.; Adeyemi, R.O.; Leng, Y.; Choi, M.Y.; Clairmont, C.; D’Andrea, A.D.; Elledge, S.J. Genetic Screens Reveal FEN1 and APEX2 as BRCA2 Synthetic Lethal Targets. Mol. Cell 2019, 73, 885–899.e6. [Google Scholar] [CrossRef]
- Becker, J.R.; Gallo, D.; Leung, W.; Croissant, T.; Thu, Y.M.; Nguyen, H.D.; Starr, T.K.; Brown, G.W.; Bielinsky, A.-K. Flap endonuclease overexpression drives genome instability and DNA damage hypersensitivity in a PCNA-dependent manner. Nucleic Acids Res. 2018, 46, 5634–5650. [Google Scholar] [CrossRef]
- Abdel-Fatah, T.M.; Russell, R.; Albarakati, N.; Maloney, D.J.; Dorjsuren, D.; Rueda, O.M.; Moseley, P.; Mohan, V.; Sun, H.; Abbotts, R.; et al. Genomic and protein expression analysis reveals flap endonuclease 1 (FEN1) as a key biomarker in breast and ovarian cancer. Mol. Oncol. 2014, 8, 1326–1338. [Google Scholar] [CrossRef] [PubMed]
- Xie, Y.; Dong, B.; Sun, Z.; Feng, Y.; Zhao, W.; Li, K.; Liu, K.; Cao, J.; Zhu, C. FEN1 promotes cancer progression of cholangiocarcinoma by regulating the Wnt/β-catenin signaling pathway. Dig. Liver Dis. 2023. [Google Scholar] [CrossRef]
- Wang, K.; Xie, C.; Chen, D. Flap endonuclease 1 is a promising candidate biomarker in gastric cancer and is involved in cell proliferation and apoptosis. Int. J. Mol. Med. 2014, 33, 1268–1274. [Google Scholar] [CrossRef] [PubMed]
- He, L.; Luo, L.; Zhu, H.; Yang, H.; Zhang, Y.; Wu, H.; Sun, H.; Jiang, F.; Kathera, C.S.; Liu, L.; et al. FEN1 promotes tumor progression and confers cisplatin resistance in non-small-cell lung cancer. Mol. Oncol. 2017, 11, 640–654. [Google Scholar] [CrossRef]
- Li, J.L.; Wang, J.P.; Chang, H.; Deng, S.M.; Du, J.H.; Wang, X.X.; Hu, H.J.; Li, D.Y.; Xu, X.B.; Guo, W.Q.; et al. FEN1 inhibitor increases sensitivity of radiotherapy in cervical cancer cells. Cancer Med. 2019, 8, 7774–7780. [Google Scholar] [CrossRef]
- Guo, M.; Wang, S.M. Genome Instability-Derived Genes Are Novel Prognostic Biomarkers for Triple-Negative Breast Cancer. Front. Cell Dev. Biol. 2021, 9, 701073. [Google Scholar] [CrossRef]
- Wang, J.; Zhou, L.; Li, Z.; Zhang, T.; Liu, W.; Liu, Z.; Yuan, Y.-C.; Su, F.; Xu, L.; Wang, Y.; et al. YY1 suppresses FEN1 over-expression and drug resistance in breast cancer. BMC Cancer 2015, 15, 50. [Google Scholar] [CrossRef] [PubMed]
- Xu, L.; Qu, J.L.; Song, N.; Zhang, L.Y.; Zeng, X.; Che, X.F.; Hou, K.Z.; Shi, S.; Feng, Z.Y.; Qu, X.J.; et al. Biological and clinical significance of flap endonuclease-1 in triple-negative breast cancer: Support of metastasis and a poor prognosis. Oncol. Rep. 2020, 44, 2443–2454. [Google Scholar] [CrossRef]
- Xu, L.; Shen, J.M.; Qu, J.L.; Song, N.; Che, X.F.; Hou, K.Z.; Shi, J.; Zhao, L.; Shi, S.; Liu, Y.P.; et al. FEN1 is a prognostic biomarker for ER+ breast cancer and associated with tamoxifen resistance through the ERalpha/cyclin D1/Rb axis. Ann. Transl. Med. 2021, 9, 258. [Google Scholar] [CrossRef] [PubMed]
- Bian, S.; Ni, W.; Zhu, M.; Zhang, X.; Qiang, Y.; Zhang, J.; Ni, Z.; Shen, Y.; Qiu, S.; Song, Q.; et al. Flap endonuclease 1 Facilitated Hepatocellular Carcinoma Progression by Enhancing USP7/MDM2-mediated P53 Inactivation. Int. J. Biol. Sci. 2022, 18, 1022–1038. [Google Scholar] [CrossRef]
- Sporikova, Z.; Koudelakova, V.; Trojanec, R.; Hajduch, M. Genetic Markers in Triple-Negative Breast Cancer. Clin. Breast Cancer 2018, 18, e841–e850. [Google Scholar] [CrossRef]
- Bartha, Á.; Győrffy, B. TNMplot.com: A Web Tool for the Comparison of Gene Expression in Normal, Tumor and Metastatic Tissues. Int. J. Mol. Sci. 2021, 22, 2622. [Google Scholar] [CrossRef]
- Daukste, L.; Basse, B.; Baguley, B.C.; Wall, D.J.N. Mathematical Determination of Cell Population Doubling Times for Multiple Cell Lines. Bull. Math. Biol. 2012, 74, 2510–2534. [Google Scholar] [CrossRef] [PubMed]
- Győrffy, B. Discovery and ranking of the most robust prognostic biomarkers in serous ovarian cancer. Geroscience 2023, 45, 1889–1898. [Google Scholar] [CrossRef] [PubMed]
- Győrffy, B. Survival analysis across the entire transcriptome identifies biomarkers with the highest prognostic power in breast cancer. Comput. Struct. Biotechnol. J. 2021, 19, 4101–4109. [Google Scholar] [CrossRef] [PubMed]
- Kazak, L.; Reyes, A.; He, J.; Wood, S.R.; Brea-Calvo, G.; Holen, T.T.; Holt, I.J. A cryptic targeting signal creates a mitochondrial FEN1 isoform with tailed R-Loop binding properties. PLoS ONE 2013, 8, e62340. [Google Scholar] [CrossRef] [PubMed]
- Guo, E.; Ishii, Y.; Mueller, J.; Srivatsan, A.; Gahman, T.; Putnam, C.D.; Wang, J.Y.J.; Kolodner, R.D. FEN1 endonuclease as a therapeutic target for human cancers with defects in homologous recombination. Proc. Natl. Acad. Sci. USA 2020, 117, 19415–19424. [Google Scholar] [CrossRef] [PubMed]
- Lewanski, C.R.; Gullick, W.J. Radiotherapy and cellular signalling. Lancet Oncol. 2001, 2, 366–370. [Google Scholar] [CrossRef] [PubMed]
- Frey, B.; Borgmann, K.; Jost, T.; Greve, B.; Oertel, M.; Micke, O.; Eckert, F. DNA as the main target in radiotherapy—A historical overview from first isolation to anti-tumour immune response. Strahlenther. Onkol. 2023, 199, 1080–1090. [Google Scholar] [CrossRef] [PubMed]
- Redon, C.E.; Dickey, J.S.; Bonner, W.M.; Sedelnikova, O.A. γ-H2AX as a biomarker of DNA damage induced by ionizing radiation in human peripheral blood lymphocytes and artificial skin. Adv. Space Res. 2009, 43, 1171–1178. [Google Scholar] [CrossRef]
- Rothkamm, K.; Löbrich, M. Evidence for a lack of DNA double-strand break repair in human cells exposed to very low x-ray doses. Proc. Natl. Acad. Sci. USA 2003, 100, 5057–5062. [Google Scholar] [CrossRef]
- Okamoto, A.; Utani, K.-i.; Shimizu, N. DNA replication occurs in all lamina positive micronuclei, but never in lamina negative micronuclei. Mutagenesis 2011, 27, 323–327. [Google Scholar] [CrossRef]
- Bonassi, S.; El-Zein, R.; Bolognesi, C.; Fenech, M. Micronuclei frequency in peripheral blood lymphocytes and cancer risk: Evidence from human studies. Mutagenesis 2011, 26, 93–100. [Google Scholar] [CrossRef] [PubMed]
- Gisselsson, D.; Björk, J.; Höglund, M.; Mertens, F.; Dal Cin, P.; Akerman, M.; Mandahl, N. Abnormal nuclear shape in solid tumors reflects mitotic instability. Am. J. Pathol. 2001, 158, 199–206. [Google Scholar] [CrossRef] [PubMed]
- Terradas, M.; Martín, M.; Genescà, A. Impaired nuclear functions in micronuclei results in genome instability and chromothripsis. Arch. Toxicol. 2016, 90, 2657–2667. [Google Scholar] [CrossRef] [PubMed]
- Cardinale, F.; Bruzzi, P.; Bolognesi, C. Role of micronucleus test in predicting breast cancer susceptibility: A systematic review and meta-analysis. Br. J. Cancer 2012, 106, 780–790. [Google Scholar] [CrossRef] [PubMed]
- Luzhna, L.; Kathiria, P.; Kovalchuk, O. Micronuclei in genotoxicity assessment: From genetics to epigenetics and beyond. Front. Genet. 2013, 4, 131. [Google Scholar] [CrossRef] [PubMed]
- Badmus, J.A.; Ekpo, O.E.; Hussein, A.A.; Meyer, M.; Hiss, D.C. Cytotoxic and cell cycle arrest properties of two steroidal alkaloids isolated from Holarrhena floribunda (G. Don) T. Durand & Schinz leaves. BMC Complement. Altern. Med. 2019, 19, 112. [Google Scholar] [CrossRef]
- Lu, W.-J.; Peng, W.; Sun, Q.-Q.; Li, Y.-H.; Chen, B.; Yu, L.-T.; Xu, Y.-Z.; Wang, S.-Y.; Zhao, Y.-L. #2714, a novel active inhibitor with potent G2/M phase arrest and antitumor efficacy in preclinical models. Cell Death Discov. 2018, 4, 24. [Google Scholar] [CrossRef] [PubMed]
- Zhang, M.; Qu, J.; Gao, Z.; Qi, Q.; Yin, H.; Zhu, L.; Wu, Y.; Liu, W.; Yang, J.; Huang, X. Timosaponin AIII Induces G2/M Arrest and Apoptosis in Breast Cancer by Activating the ATM/Chk2 and p38 MAPK Signaling Pathways. Front. Pharmacol. 2021, 11, 601468. [Google Scholar] [CrossRef]
- Krempler, A.; Deckbar, D.; Jeggo, P.A.; Löbrich, M. An imperfect G2M checkpoint contributes to chromosome instability following irradiation of S and G2 phase cells. Cell Cycle 2007, 6, 1682–1686. [Google Scholar] [CrossRef]
- Anastasov, N.; Höfig, I.; Vasconcellos, I.G.; Rappl, K.; Braselmann, H.; Ludyga, N.; Auer, G.; Aubele, M.; Atkinson, M.J. Radiation resistance due to high expression of miR-21 and G2/M checkpoint arrest in breast cancer cells. Radiat. Oncol. 2012, 7, 206. [Google Scholar] [CrossRef]
- Sinclair, W.K. Cyclic X-Ray Responses in Mammalian Cells in Vitro. Radiat. Res. 1968, 33, 620–643. [Google Scholar] [CrossRef] [PubMed]
- White, T.L.; Deshpande, N.; Kumar, V.; Gauthier, A.G.; Jurkunas, U.V. Cell cycle re-entry and arrest in G2/M phase induces senescence and fibrosis in Fuchs Endothelial Corneal Dystrophy. Free Radic. Biol. Med. 2021, 164, 34–43. [Google Scholar] [CrossRef] [PubMed]
- Kim, D.; Lee, J.; Han, J.; Lim, J.; Lim, E.K.; Kim, E. A highly specific and flexible detection assay using collaborated actions of DNA-processing enzymes for identifying multiple gene expression signatures in breast cancer. Analyst 2023, 148, 316–327. [Google Scholar] [CrossRef] [PubMed]
- Viktorsson, K.; Rieckmann, T.; Fleischmann, M.; Diefenhardt, M.; Hehlgans, S.; Rödel, F. Advances in molecular targeted therapies to increase efficacy of (chemo)radiation therapy. Strahlenther. Onkol. 2023, 199, 1091–1109. [Google Scholar] [CrossRef] [PubMed]
- Qi, L.; Zhou, B.; Chen, J.; Hu, W.; Bai, R.; Ye, C.; Weng, X.; Zheng, S. Significant prognostic values of differentially expressed-aberrantly methylated hub genes in breast cancer. J. Cancer 2019, 10, 6618–6634. [Google Scholar] [CrossRef] [PubMed]
- Lewis, C.W.; Golsteyn, R.M. Cancer cells that survive checkpoint adaptation contain micronuclei that harbor damaged DNA. Cell Cycle 2016, 15, 3131–3145. [Google Scholar] [CrossRef] [PubMed]
- Tumey, L.N.; Bom, D.; Huck, B.; Gleason, E.; Wang, J.; Silver, D.; Brunden, K.; Boozer, S.; Rundlett, S.; Sherf, B.; et al. The identification and optimization of a N-hydroxy urea series of flap endonuclease 1 inhibitors. Bioorg. Med. Chem. Lett. 2005, 15, 277–281. [Google Scholar] [CrossRef]
- Elstrodt, F.; Hollestelle, A.; Nagel, J.H.A.; Gorin, M.; Wasielewski, M.; van den Ouweland, A.; Merajver, S.D.; Ethier, S.P.; Schutte, M. BRCA1 Mutation Analysis of 41 Human Breast Cancer Cell Lines Reveals Three New Deleterious Mutants. Cancer Res. 2006, 66, 41–45. [Google Scholar] [CrossRef]
- Fenech, M. The in vitro micronucleus technique. Mutat. Res. 2000, 455, 81–95. [Google Scholar] [CrossRef]
- Fenech, M.; Kirsch-Volders, M.; Natarajan, A.T.; Surralles, J.; Crott, J.W.; Parry, J.; Norppa, H.; Eastmond, D.A.; Tucker, J.D.; Thomas, P. Molecular mechanisms of micronucleus, nucleoplasmic bridge and nuclear bud formation in mammalian and human cells. Mutagenesis 2011, 26, 125–132. [Google Scholar] [CrossRef]
- Mackenzie, K.J.; Carroll, P.; Martin, C.-A.; Murina, O.; Fluteau, A.; Simpson, D.J.; Olova, N.; Sutcliffe, H.; Rainger, J.K.; Leitch, A.; et al. cGAS surveillance of micronuclei links genome instability to innate immunity. Nature 2017, 548, 461–465. [Google Scholar] [CrossRef] [PubMed]
- Braselmann, H.; Michna, A.; Heß, J.; Unger, K. CFAssay: Statistical analysis of the colony formation assay. Radiat. Oncol. 2015, 10, 223. [Google Scholar] [CrossRef] [PubMed]
- Franken, N.A.P.; Rodermond, H.M.; Stap, J.; Haveman, J.; van Bree, C. Clonogenic assay of cells in vitro. Nat. Protoc. 2006, 1, 2315–2319. [Google Scholar] [CrossRef] [PubMed]
- Cahu, J.; Sola, B. A sensitive method to quantify senescent cancer cells. J. Vis. Exp. 2013. [Google Scholar] [CrossRef]
- Debacq-Chainiaux, F.; Erusalimsky, J.D.; Campisi, J.; Toussaint, O. Protocols to detect senescence-associated beta-galactosidase (SA-βgal) activity, a biomarker of senescent cells in culture and in vivo. Nat. Protoc. 2009, 4, 1798–1806. [Google Scholar] [CrossRef]
- Bertolo, A.; Baur, M.; Guerrero, J.; Pötzel, T.; Stoyanov, J. Autofluorescence is a Reliable in vitro Marker of Cellular Senescence in Human Mesenchymal Stromal Cells. Sci. Rep. 2019, 9, 2074. [Google Scholar] [CrossRef]
- Jost, T.; Heinzerling, L.; Fietkau, R.; Hecht, M.; Distel, L.V. Palbociclib Induces Senescence in Melanoma and Breast Cancer Cells and Leads to Additive Growth Arrest in Combination with Irradiation. Front. Oncol. 2021, 11, 740002. [Google Scholar] [CrossRef]


| Cell Line | Origin | ER | PR | HER2 | Gene Cluster |
|---|---|---|---|---|---|
| T-47D | IDC | + | + | Lu | |
| MCF7 | IDC | + | + | Lu | |
| BT-474 | IDC | + | + | + | Lu HER2+ |
| SK-BR-3 | AC | - | - | + | Lu HER2+ |
| BT-20 | IDC | - | - | BaA | |
| MDA-MB-468 | AC | - | - | BaA | |
| MDA-MB-231 | AC | - | - | BaB | |
| BT-549 | IDC, pap | - | - | BaB | |
| MCF 10A | Fib | - | - | BaB |
Disclaimer/Publisher’s Note: The statements, opinions and data contained in all publications are solely those of the individual author(s) and contributor(s) and not of MDPI and/or the editor(s). MDPI and/or the editor(s) disclaim responsibility for any injury to people or property resulting from any ideas, methods, instructions or products referred to in the content. |
© 2024 by the authors. Licensee MDPI, Basel, Switzerland. This article is an open access article distributed under the terms and conditions of the Creative Commons Attribution (CC BY) license (https://creativecommons.org/licenses/by/4.0/).
Share and Cite
Berfelde, J.; Hildebrand, L.S.; Kuhlmann, L.; Fietkau, R.; Distel, L.V. FEN1 Inhibition as a Potential Novel Targeted Therapy against Breast Cancer and the Prognostic Relevance of FEN1. Int. J. Mol. Sci. 2024, 25, 2110. https://doi.org/10.3390/ijms25042110
Berfelde J, Hildebrand LS, Kuhlmann L, Fietkau R, Distel LV. FEN1 Inhibition as a Potential Novel Targeted Therapy against Breast Cancer and the Prognostic Relevance of FEN1. International Journal of Molecular Sciences. 2024; 25(4):2110. https://doi.org/10.3390/ijms25042110
Chicago/Turabian StyleBerfelde, Johanna, Laura S. Hildebrand, Lukas Kuhlmann, Rainer Fietkau, and Luitpold V. Distel. 2024. "FEN1 Inhibition as a Potential Novel Targeted Therapy against Breast Cancer and the Prognostic Relevance of FEN1" International Journal of Molecular Sciences 25, no. 4: 2110. https://doi.org/10.3390/ijms25042110
APA StyleBerfelde, J., Hildebrand, L. S., Kuhlmann, L., Fietkau, R., & Distel, L. V. (2024). FEN1 Inhibition as a Potential Novel Targeted Therapy against Breast Cancer and the Prognostic Relevance of FEN1. International Journal of Molecular Sciences, 25(4), 2110. https://doi.org/10.3390/ijms25042110