Article

Identification and Analysis of PEPC Gene Family Reveals Functional Diversification in Orchidaceae and the Regulation of Bacterial-Type PEPC

1
Key Laboratory of National Forestry and Grassland Administration for Orchid Conservation and Utilization at Landscape Architecture and Arts, Fujian Agriculture and Forestry University, Fuzhou 350002, China
2
Fujian Colleges and Universities Engineering Research Institute of Conservation and Utilization of Natural Bioresources, Fujian Agriculture and Forestry University, Fuzhou 350002, China
*
Authors to whom correspondence should be addressed.
These authors contributed equally to this work.
Int. J. Mol. Sci. 2024, 25(4), 2055; https://doi.org/10.3390/ijms25042055
Submission received: 5 December 2023 / Revised: 29 January 2024 / Accepted: 5 February 2024 / Published: 8 February 2024

Abstract

:
Phosphoenolpyruvate carboxylase (PEPC) gene family plays a crucial role in both plant growth and response to abiotic stress. Approximately half of the Orchidaceae species are estimated to perform CAM pathway, and the availability of sequenced orchid genomes makes them ideal subjects for investigating the PEPC gene family in CAM plants. In this study, a total of 33 PEPC genes were identified across 15 orchids. Specifically, one PEPC gene was found in Cymbidium goeringii and Platanthera guangdongensis; two in Apostasia shenzhenica, Dendrobium chrysotoxum, D. huoshanense, Gastrodia elata, G. menghaiensis, Phalaenopsis aphrodite, Ph. equestris, and Pl. zijinensis; three in C. ensifolium, C. sinense, D. catenatum, D. nobile, and Vanilla planifolia. These PEPC genes were categorized into four subgroups, namely PEPC-i, PEPC-ii, and PEPC-iii (PTPC), and PEPC-iv (BTPC), supported by the comprehensive analyses of their physicochemical properties, motif, and gene structures. Remarkably, PEPC-iv contained a heretofore unreported orchid PEPC gene, identified as VpPEPC4. Differences in the number of PEPC homolog genes among these species were attributed to segmental duplication, whole-genome duplication (WGD), or gene loss events. Cis-elements identified in promoter regions were predominantly associated with light responsiveness, and circadian-related elements were observed in each PEPC-i and PEPC-ii gene. The expression levels of recruited BTPC, VpPEPC4, exhibited a lower expression level than other VpPEPCs in the tested tissues. The expression analyses and RT-qPCR results revealed diverse expression patterns in orchid PEPC genes. Duplicated genes exhibited distinct expression patterns, suggesting functional divergence. This study offered a comprehensive analysis to unveil the evolution and function of PEPC genes in Orchidaceae.

1. Introduction

Phosphoenolpyruvate carboxylase (PEPC) is a plant enzyme encoded by a small gene family, with each member exhibiting specialized functions [1,2,3]. It is widely distributed in various organisms, including plants, archaea, bacteria, cyanobacteria, green algae, and protozoa [4]. The PEPC gene can be further classified into plant-type PEPC (PTPC) and bacterial-type PEPC (BTPC) [5,6,7]. PTPC genes encoded 100–110 kDa polypeptides with 9–10 introns that contained a conserved phosphorylation site in the N-terminal, whereas BTPC genes encoded 116–118 kDa polypeptides with 19–21 introns [2,8]. PEPC genes are mainly involved in catalyzing HCO3− and phosphoenolpyruvate (PEP) to produce oxaloacetate (OAA) and subsequent malate in the CAM pathway and C4 pathway [9,10]. In addition, PEPC also serves as a housekeeping gene, playing crucial physiological or metabolic roles in non-photosynthetic organisms, such as stomatal movements regulation [11], seed germination [12], fruit maturation [7], and the biosynthesis of oil and protein [13].
The PEPC gene family plays a vital role in both monocot and dicot species, and its characterization has been extensively studied in various plants, including Arabidopsis thaliana [8], Saccharum spp. [14], Oncidiinae spp. [3], Kalanchoë spp. [15], and other plants. Four PEPCs have been identified in A. thaliana with three plant-type phosphoenolpyruvate carboxylase (PTPC) and one bacterial-type phosphoenolpyruvate carboxylase (BTPC) [8], and ten in Glycine max with seven PTPC and three BTPC [16]. Five PEPCs were identified in sedges, with the recruitment of the ppc-1 gene into the C4 pathway [17]. Comprehensive genomic and transcriptomic analyses indicated that a PEPC gene (Dca1b) might be associated with CAM in Dendrobium catenatum, as evidenced by its higher expression in major photosynthetic tissues [18]. Numerous functional studies of PEPC genes have also been reported. Setaria viridis, characterized by the low expression levels of PEPC, grows slowly even under high concentrations of CO2 [19]. The potential functions of PEPC were studied in response to abiotic stresses, such as salt, cold, and drought. The cis-regulatory elements related to various abiotic stresses were identified in the promoter regions of PEPC in soybean, and their transcript abundance and enzyme activities were altered by aluminum, cold, salt, and other stress [16]. Under the treatment of 25 μmol AlCl3 (pH 4.3) for a duration of 24 h, the PEPC activity of soybean leaves increased slightly, while that of roots increased first and then decreased [16]. The overexpression of PEPC significantly enhanced photosynthetic efficiency and tolerance to environmental abiotic stresses [20,21,22].
Crassulacean acid metabolism (CAM) is one of the important carbon fixation pathways due to its higher water-use efficiency and drought tolerance [9,23]. PEPC, the key enzyme for the CAM pathway at night, fascinated the researchers. Based on the transcriptomic dataset, the PEPC gene family has been identified in Oncidiinae, including C3, weak-CAM, and strong-CAM plants, and the number of PEPCs increased gradually along with the type of photosynthesis [3]. The PEPCs have also been investigated based on genomic analyses, such as three PEPCs in pineapple [24] and two in Cymbidium mannii [25]. The diel expression patterns of PEPC genes have been reported in many CAM plants [24,25,26,27]. In C. mannii, a copy of the PEPC gene (PPC1;3) exhibited a markedly higher expression level than other copies and displayed rhythmic expression and day-night differences in protein abundance, implying that this copy played a dominant role in the fixation of CO2 [25]. Moreover, the transgenic Kalanchoë laxiflora with a loss of the PEPC gene significantly reduced the nocturnal CO2 fixation and malate accumulation, and perturbations in stomatal closure during the light period were observed [15].
CAM plants are widely distributed in over 400 genera from 37 families of higher plants, such as Bromeliaceae, Crassulaceae, and Orchidaceae [28,29]. Among these families, Orchidaceae showed the highest diversity of CAM plants, with an estimated half of the species performing CAM pathways [30,31]. In recent years, several orchid genomes and transcriptomes have been sequenced [25,32,33,34,35,36,37,38,39,40,41,42,43,44,45], providing an excellent opportunity to elucidate the evolution and molecular regulation mechanism of CAM. However, our understanding of the PEPC gene family in orchids remains limited. The majority of research on the orchid PEPC gene family has been primarily based on the transcriptome, and comprehensive analyses of the PEPC gene family were scarce, such as cis-acting prediction, motif analysis, and so on. In this study, we performed genome-wide identification and comparative and expression analyses of the PEPC gene family in 15 orchids, namely Apostasia shenzhenica [32], C. ensifolium [33], C. goeringii [34], C. sinense [35], D. catenatum [36], D. chrysotoxum [37], D. huoshanense [38], D. nobile [39], Gastrodia elata [40], G. menghaiensis [41], Phalaenopsis aphrodite [42], Ph. equestris [43], Platanthera guangdongensis [44], Pl. zijinensis [44], and Vanilla planifolia [45], to investigate the characteristics and function of orchid PEPC genes. Our results can help in understanding the evolution and function of the orchid PEPC gene family.

2. Results

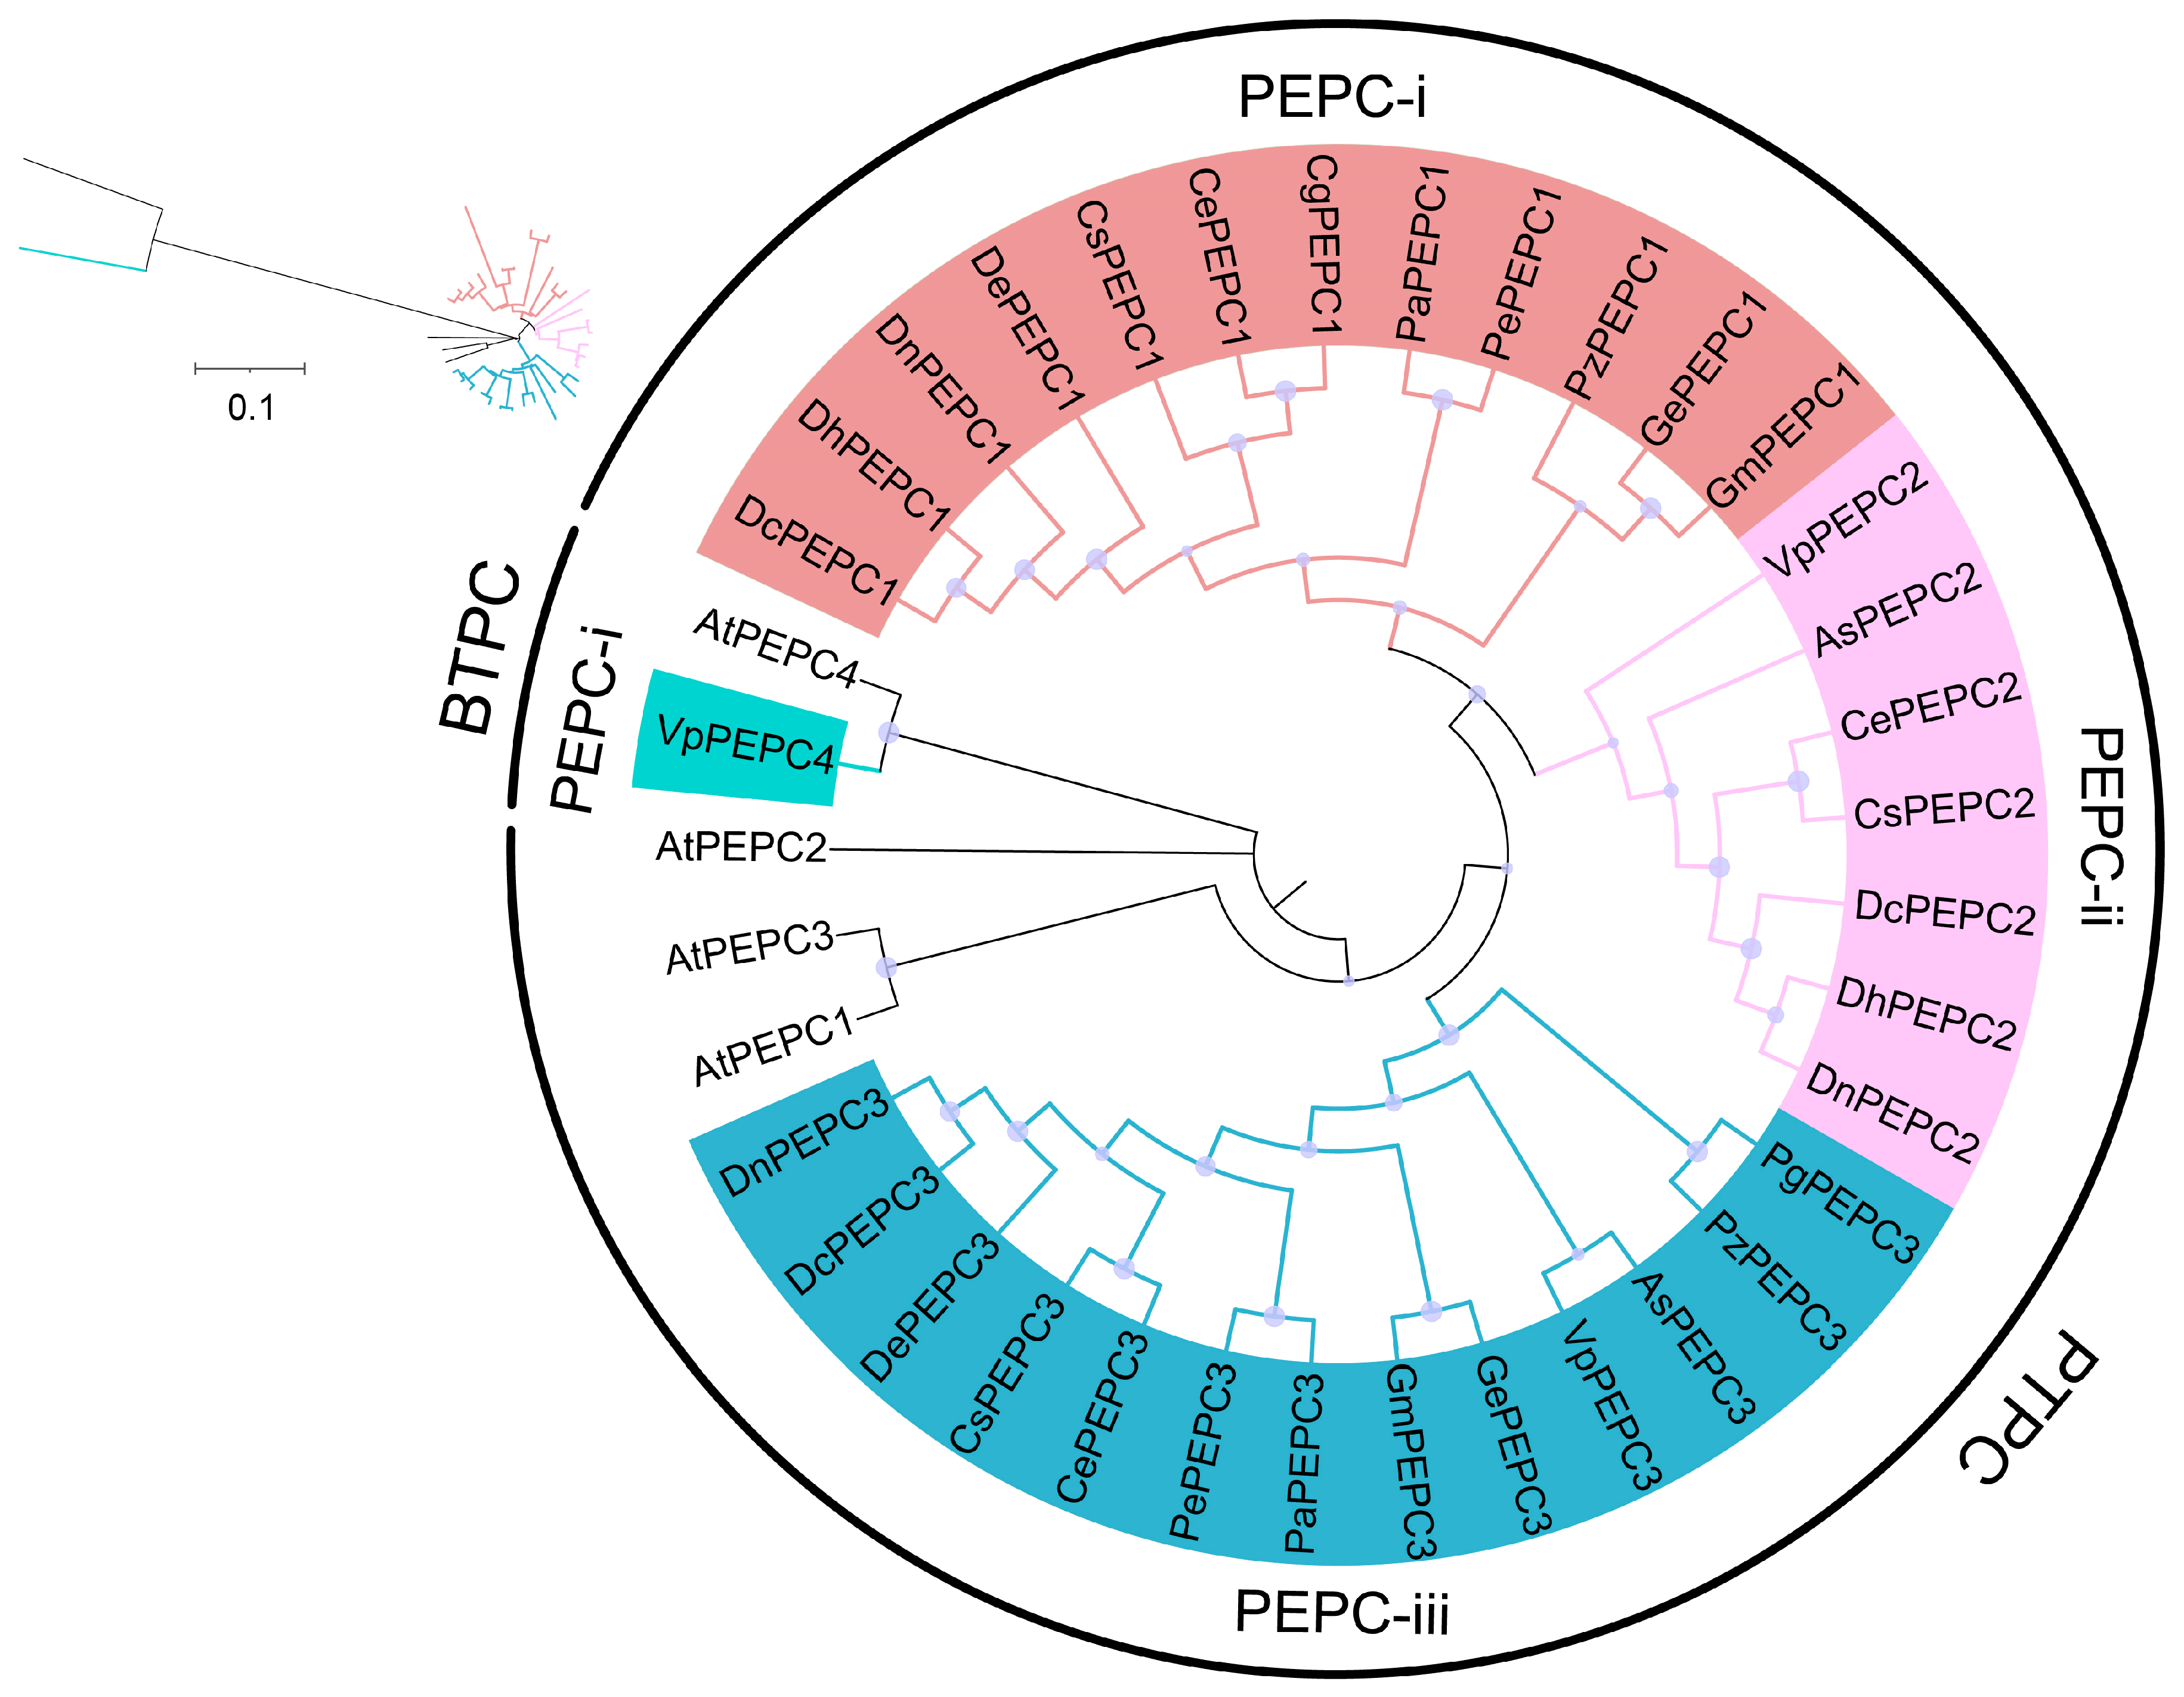
2.1. Identification and Phylogenetic Analysis of PEPC Genes

In total, 33 PEPC genes were identified across 15 orchid genomes, and the number of PEPC genes ranged from one to three in different species (one in C. goeringii and Pl. guangdongensis; two in A. shenzhenica, D. chrysotoxum, D. huoshanense, G. elata, G. menghaiensis, Ph. aphrodite, Ph. equestris, and Pl. zijinensis; three in C. ensifolium, C. sinense, D. catenatum, D. nobile, and V. planifolia). The new names of the predicted PEPC genes are listed in Table 1. For a more detailed analysis of the 33 PEPCs, their physicochemical properties were predicted using ExPASy (https://web.expasy.org/protparam/, accessed on 8 August 2023). The results showed that all PEPCs shared similar physicochemical properties (Table 1). These PEPC sequences exhibited slight variation in the amino acid lengths, ranging from 834 aa (CsPEPC1) to 1,076 aa (CePEPC2), with an average length of 960 aa. The molecular weights (MW) varied from 95.42 kDa (CsPEPC1) to 122.43 kDa (CePEPC2), with an average MW of 109.48 kDa. The theoretical isoelectric point ranged from 5.71 (AsPEPC3 and PgPEPC3) to 6.64 (DePEPC1), with an average of 6.03. All PEPCs were regarded as acidic (theoretical isoelectric point < 7) and hydrophilic (grand average of hydropathicity < 0) proteins (Table 1). Subcellular localization prediction suggested that all PEPCs are likely only located in the cytoplasm.
To explore the evolution of PEPC genes among the 15 orchid genomes, phylogenetic trees were constructed using the neighbor-joining (NJ) method. The multiple protein sequence alignment of the 1297 aa PEPC fragments from 33 PEPC proteins showed 346 conserved sites, 698 variable sites, 281 parsimony-informative sites, and 364 singleton sites. The analysis demonstrated that the 33 orchid PEPC proteins are single origin and can be divided into PTPC and BTPC, with 32 and 1 members in the orchids, respectively (Figure 1). BTPC showed a distant branch with PTPC. Further classification of 33 PEPCs was divided into four subgroups: PEPC-i, PEPC-ii and PEPC-iii (PTPC), and PEPC-iv (BTPC). PEPC-iii (13 members) contained the most complete PEPC members of 15 orchids, followed by PEPC-i (12 members). Notably, this study revealed that PEPC-iv contained an orchid PEPC from V. planifolia (VpPEPC4), which has not been reported before.

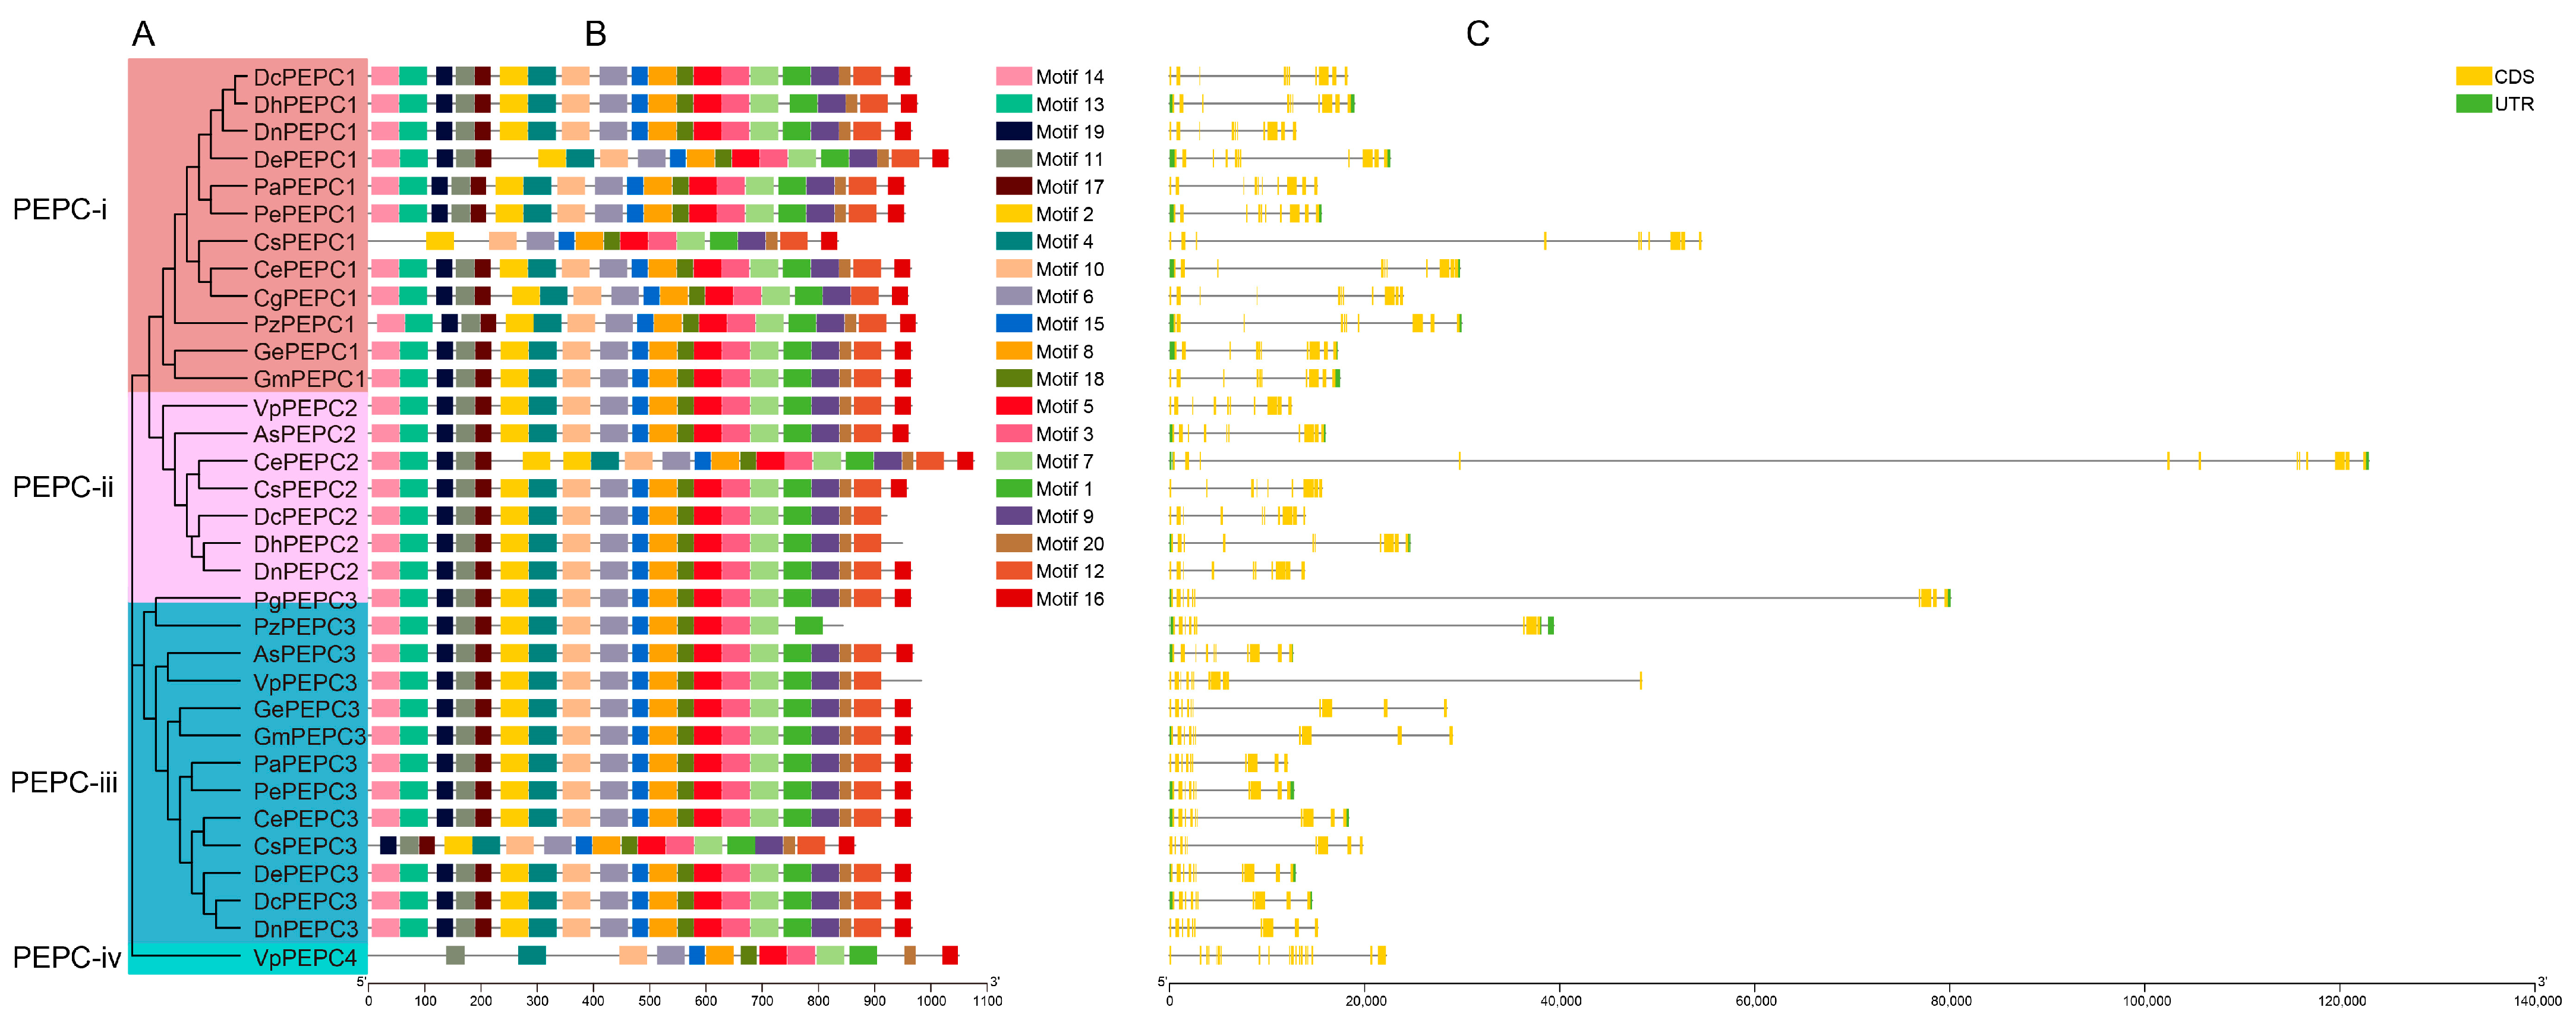
2.2. Motif and Gene Structure Analysis of PEPC Genes

In this study, a detailed analysis of PEPC proteins was conducted using the MEME program to identify motif patterns, with a predefined upper limit of 20 motifs (Figure 2B). The proteins encoded by the PTPC were conserved and similar in motif patterns, with the number of PEPC motifs ranging from 14 to 21. The protein encoded by BTPC had 13 motifs. Both PTPC and BTPC shared an identical motif pattern partly, specifically the order of motifs 10, 6, 15, 8, 18, 5, 3, 7, and 1. However, some differences between the two types were observed. Motifs 13, 19, and 2 were only presented in PTPC. The number of BTPC motifs was lower than that in PTPC, indicating a discernible divergence between the two types.
To obtain deeper insights into the potential structural evolution of PEPCs, we conducted a comparative analysis of their exon–intron composition (Figure 2C). Different exon–intron structures were observed between the two types, but no discernible differences were observed within clades. PTPC consisted of 9–12 exons and 8–11 introns, whereas BTPC exhibited a more complex structure with 20 exons and 19 introns. While a similarity in the gene structure was found within each clade, orchid PEPCs demonstrated a substantial degree of variability in intron length and numbers in comparison with A. thaliana. Most orchid PEPCs exhibited longer intron than A. thaliana. Some orchid PEPCs exhibited variations in the number of introns; for instance, CePEPC2 has 11 introns, whereas CsPEPC1, CsPEPC3, and PzPEPC3 have only eight introns.

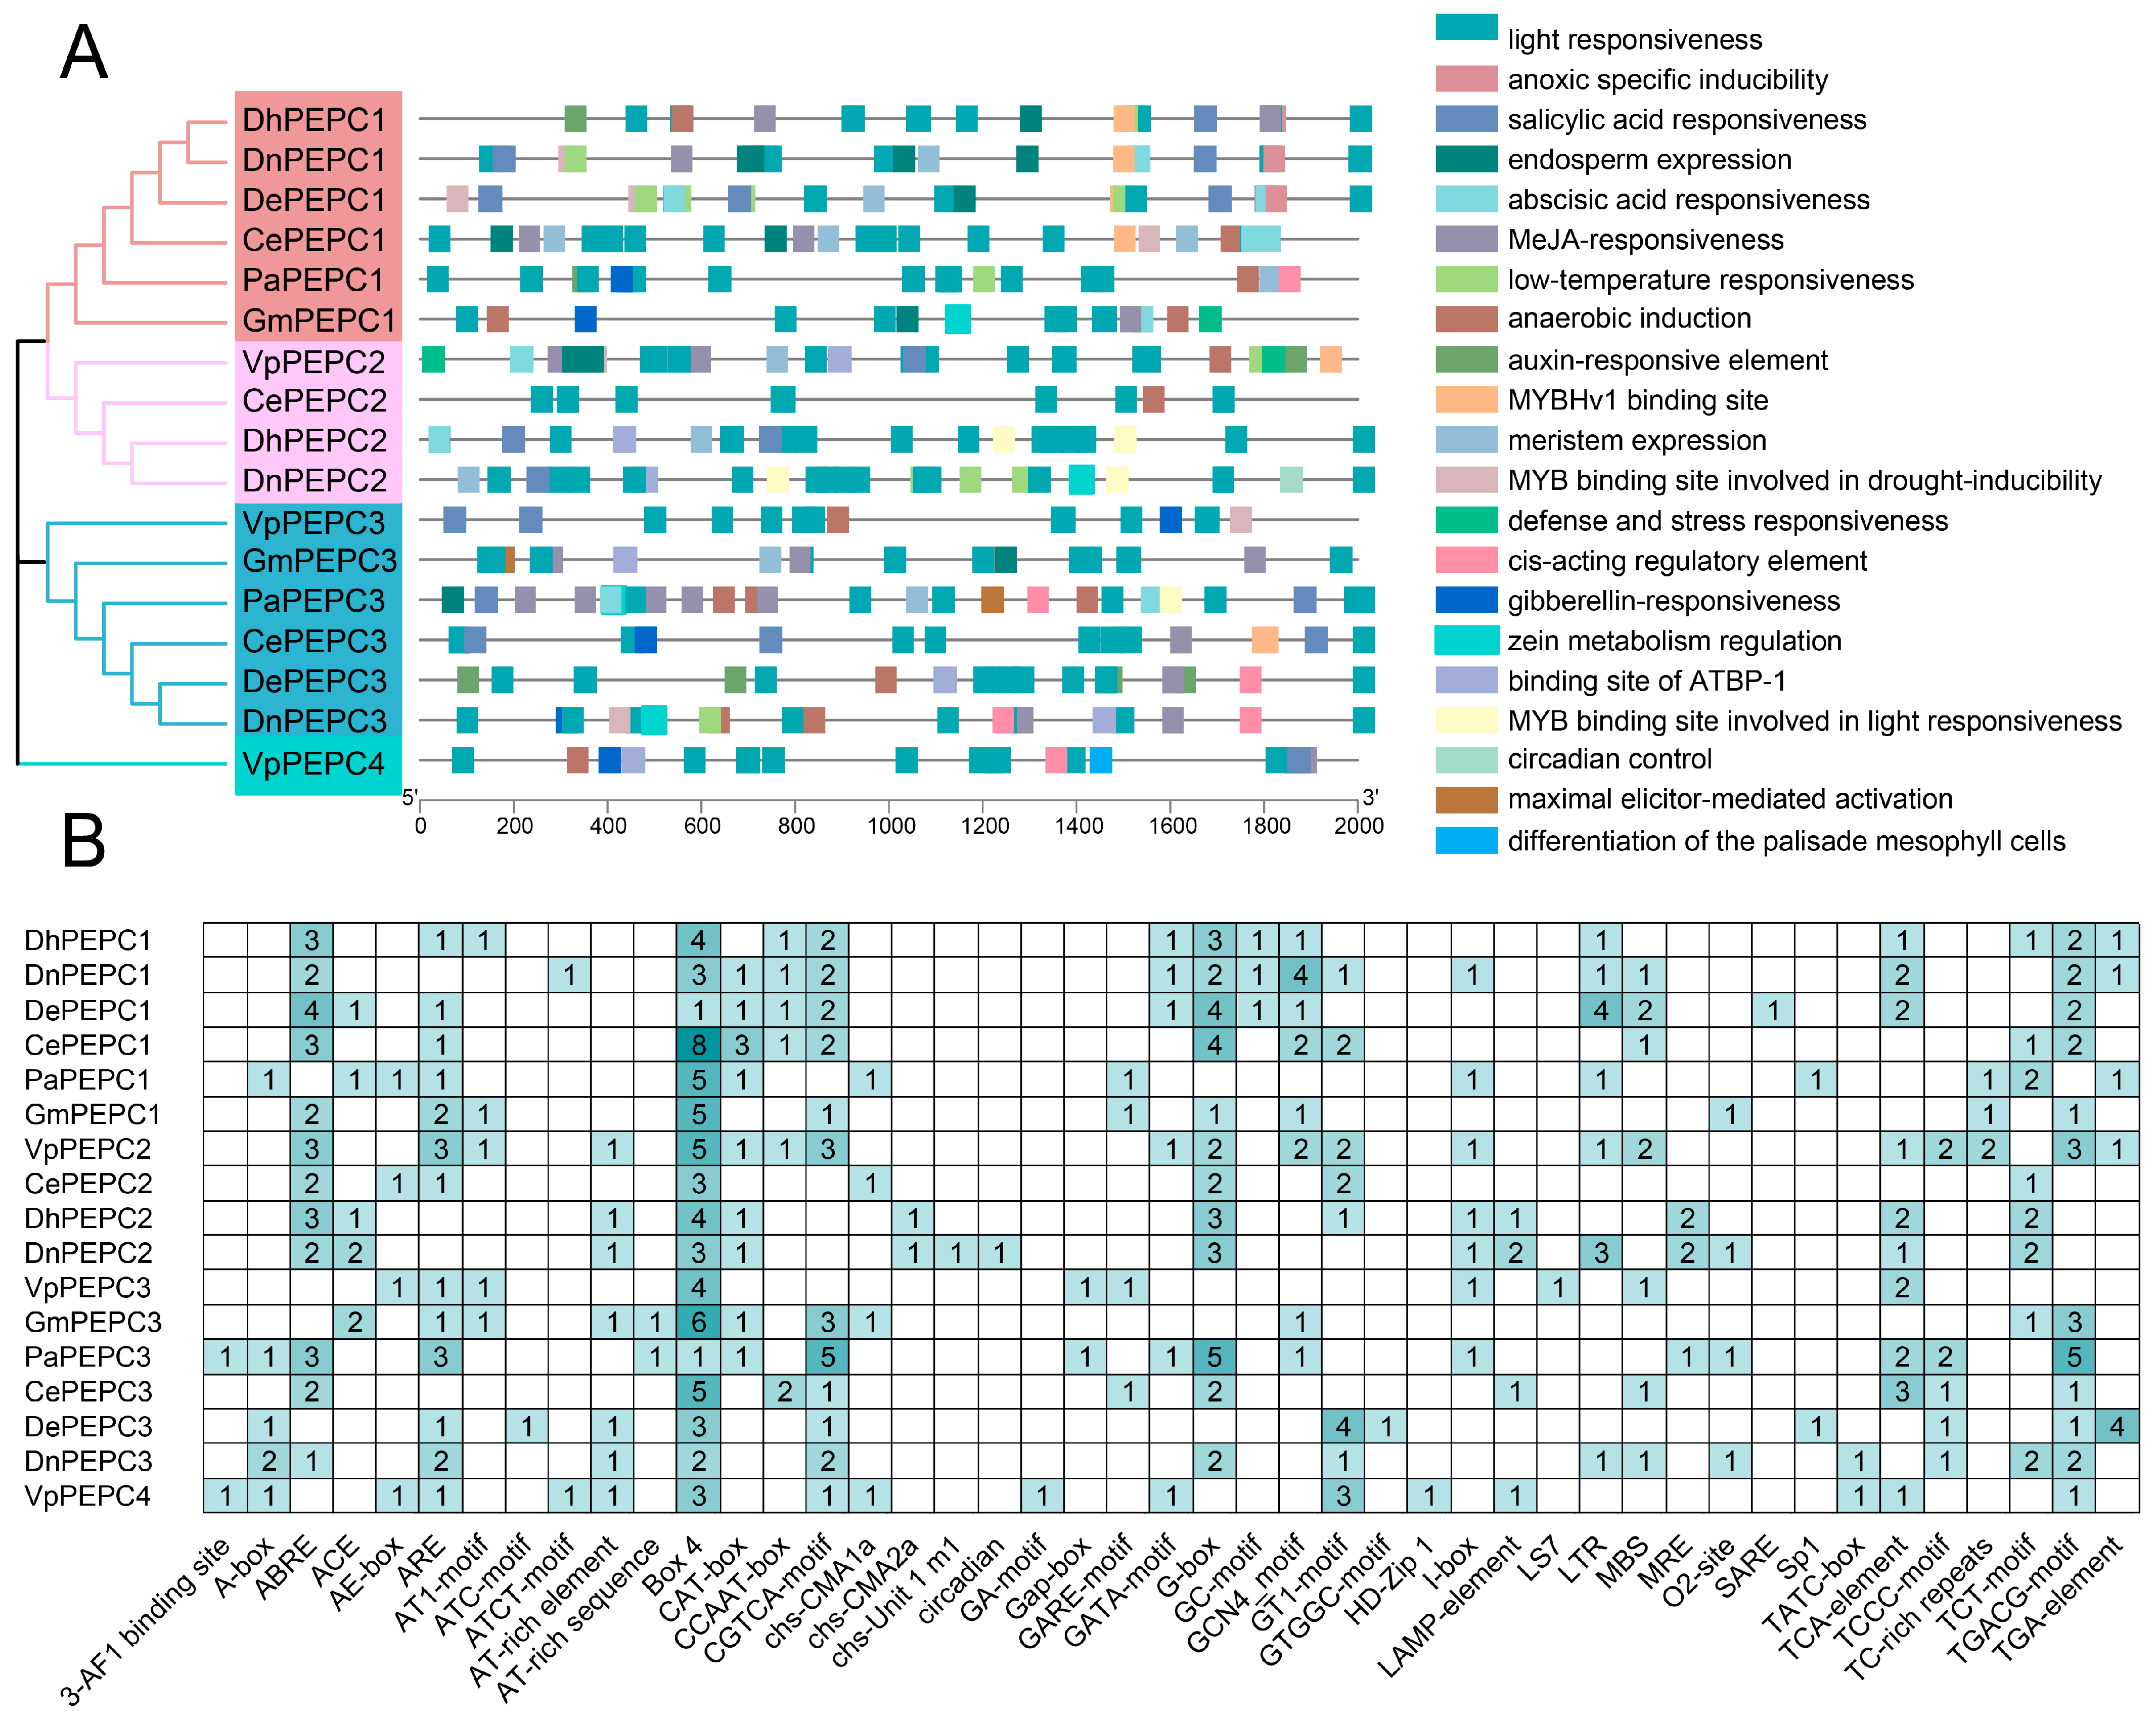
2.3. Cis-Elements in the Promoter Regions of PEPC Genes

To investigate the regulatory functions of the orchid PEPCs, we retrieved the 2000 bp promoter regions of six orchids to identify putative cis-acting regulatory elements (CREs). A comprehensive analysis unveiled a total of 402 CREs, including 45 types and 21 responsive functions (Figure 3 and Supplementary Table S1). Cis-element functions included developmental elements such as light responsiveness, endosperm expression, meristem expression, and circadian control; phytohormone responsiveness for abscisic acid (ABA), auxin, gibberellin, methyl jasmonate (MeJA), and salicylic acid; stress responsiveness such as anoxic and low-temperature (Figure 3A). Each PEPC gene harbored multiple types of elements, with light responsiveness (186, 46.3%) emerging as the most prevalent functional category. MeJA-responsiveness element (50, 12.4%) ranked as the second most abundant, followed by abscisic acid responsiveness (30, 7.5%). Among these elements, Box4 comprised the most common elements (64, 15.9%) present in each PEPC, followed by G-Box (33, 8.2%) (Figure 3B). Elements such as ABRE, G-box, and circadian elements were closely associated with the regulation of genes involved in the circadian rhythm. In this study, ABRE and G-box elements were present in each PEPC gene at PEPC-i and PEPC-ii, except for PaPEPC1. In contrast, the circadian element was only present in DnPEPC2.

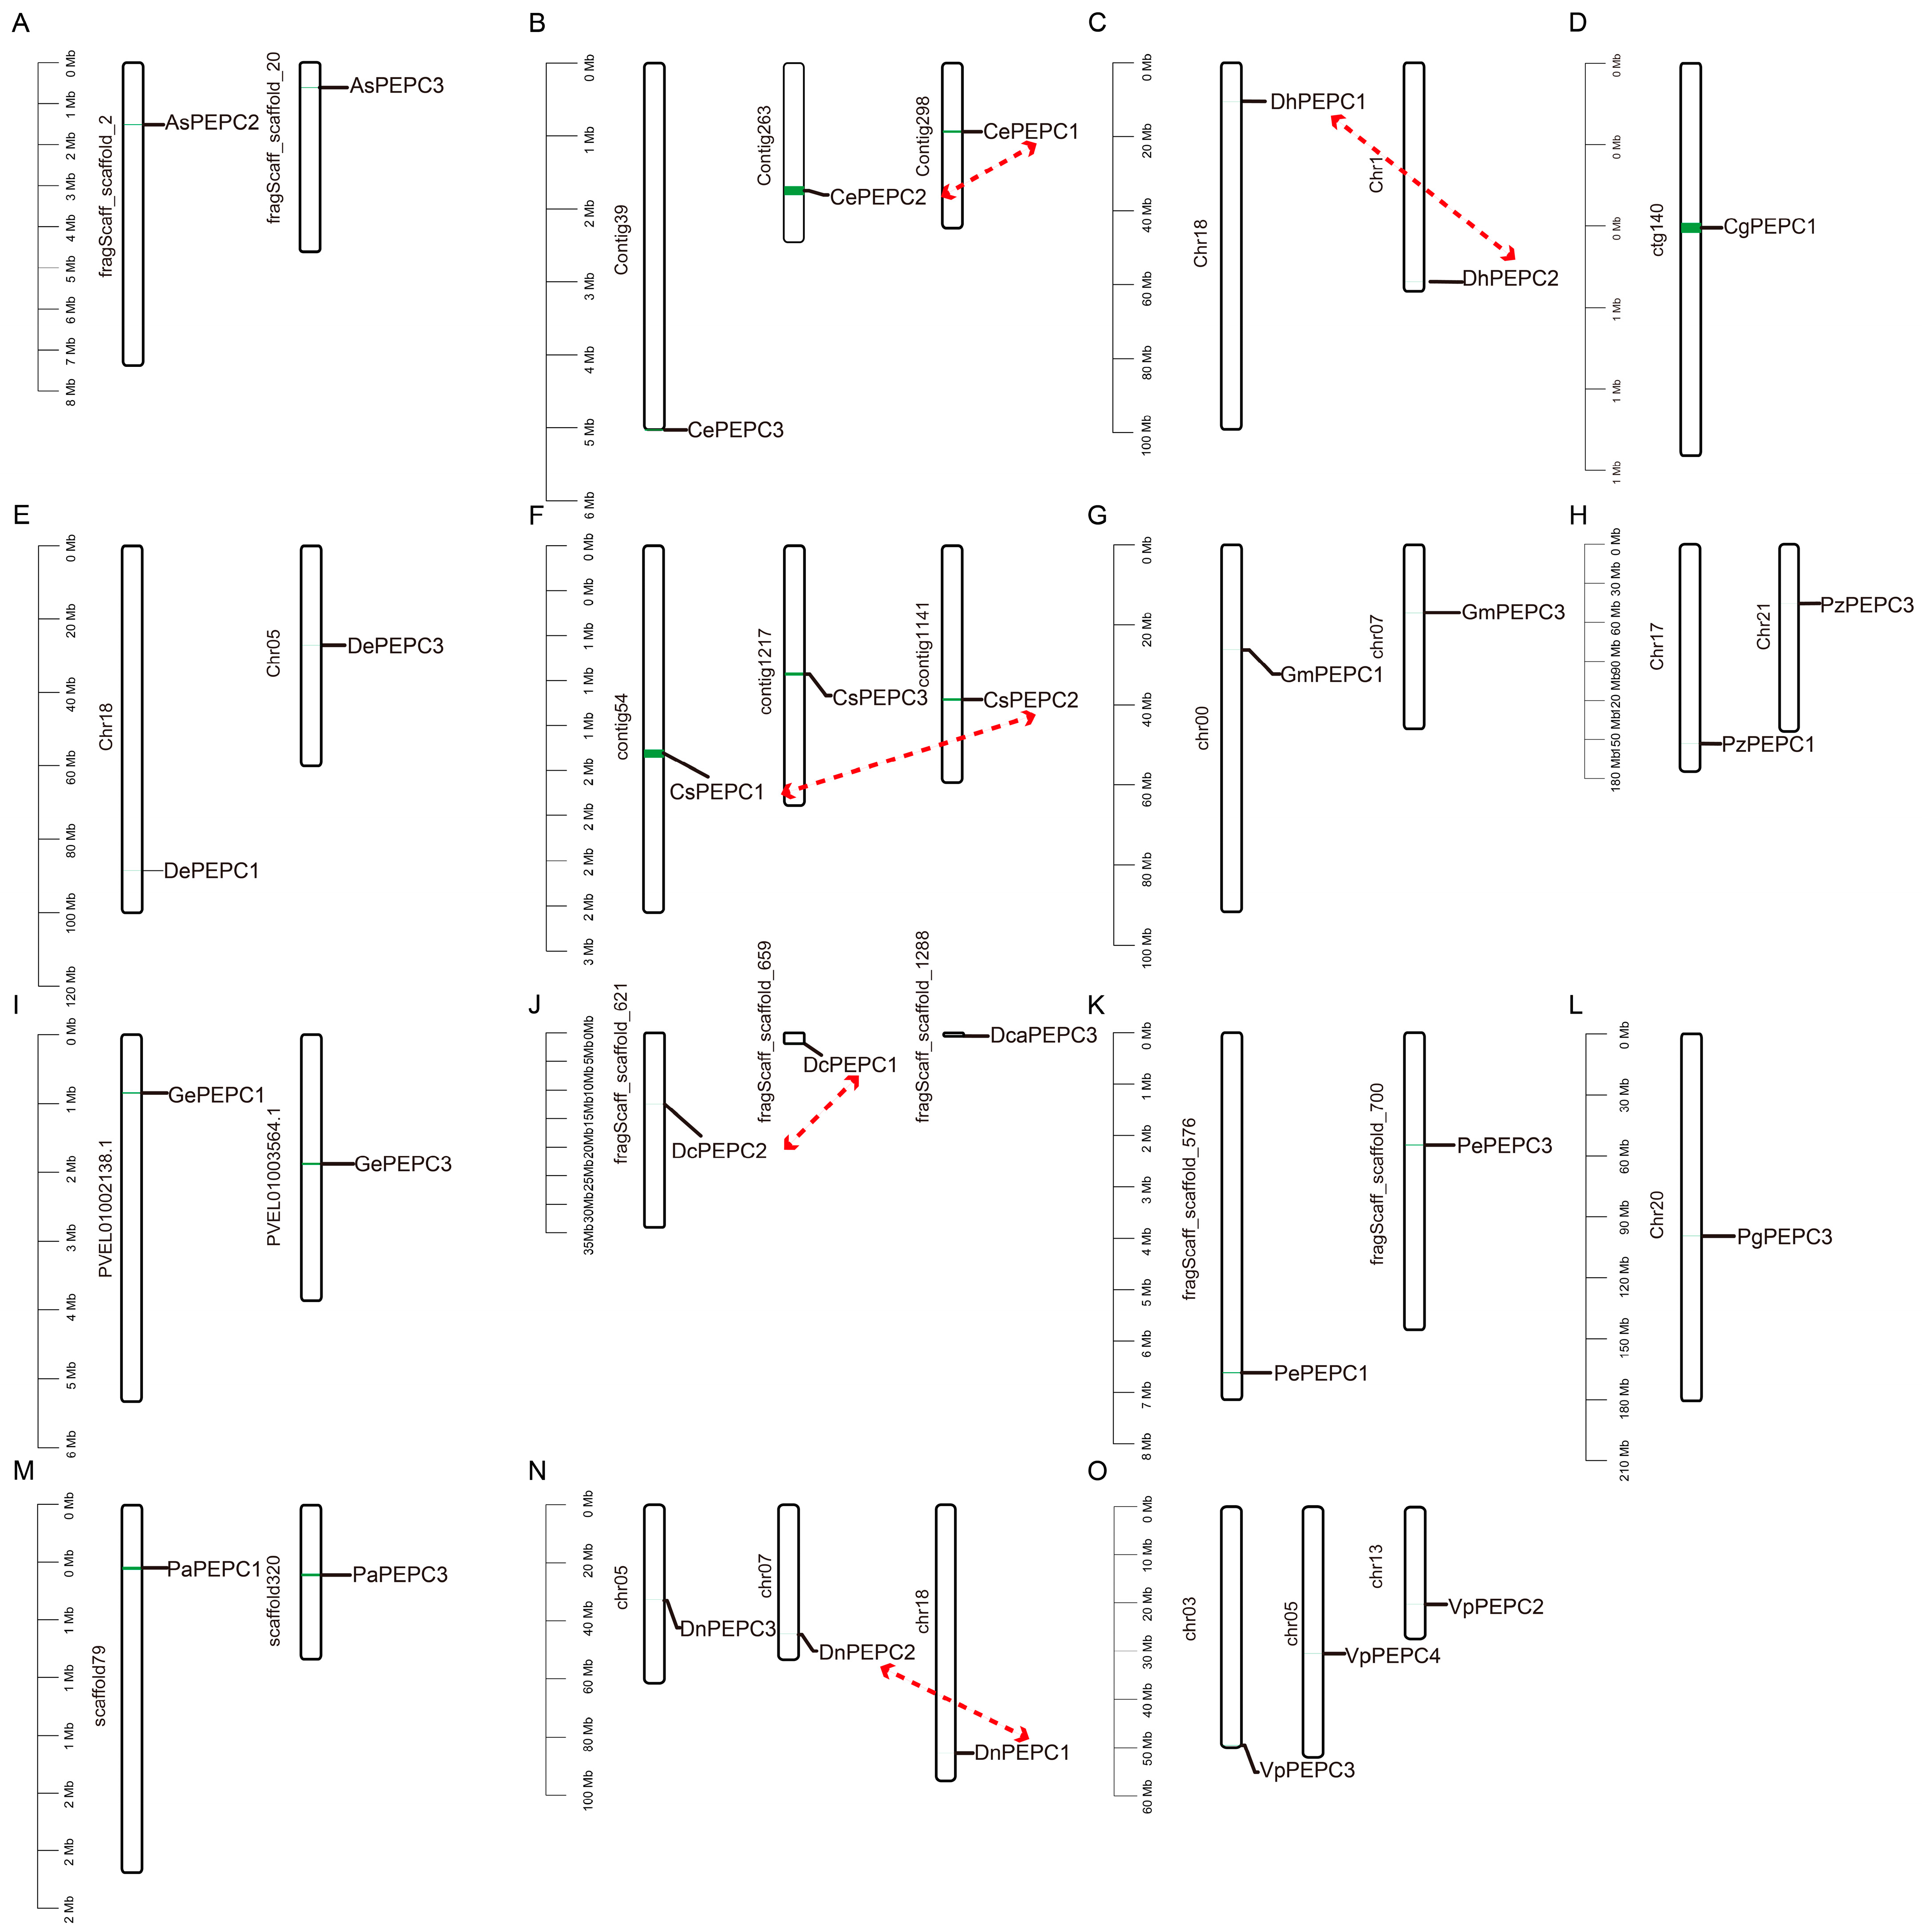
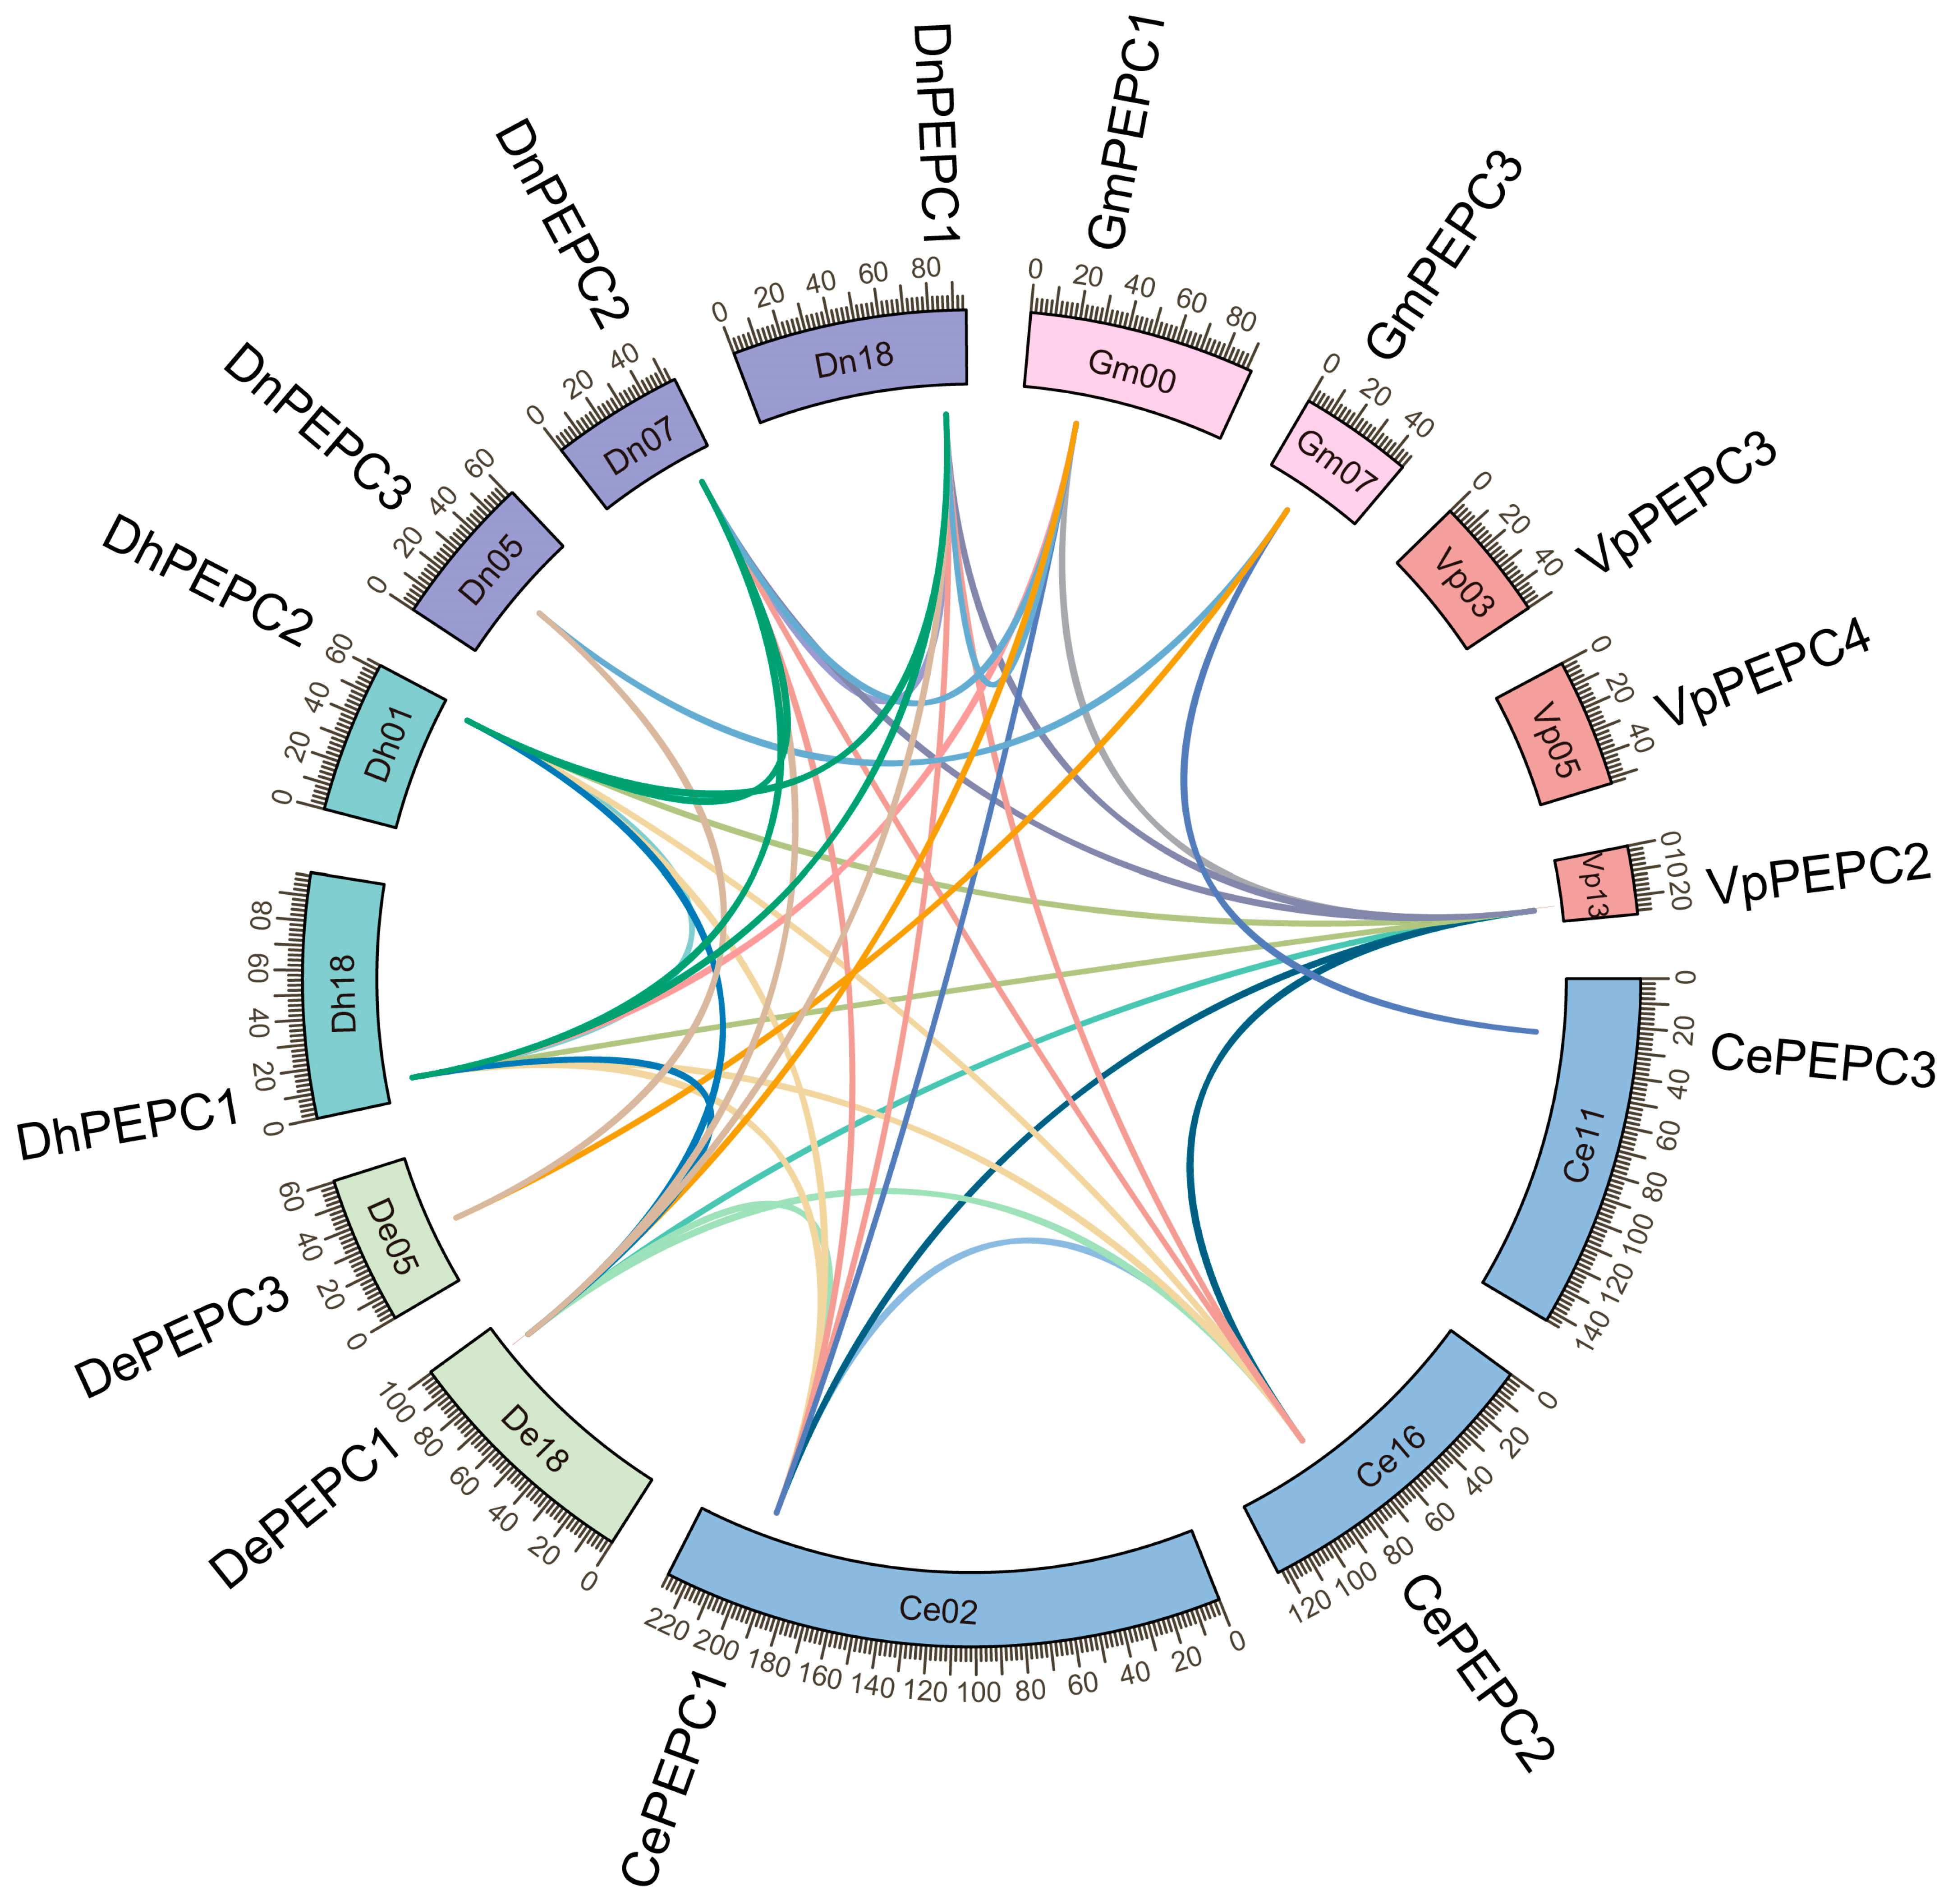
2.4. Chromosomal Localization and Collinearity Analysis of PEPC Genes

We conducted gene localization on chromosomes and gene duplication analysis to elucidate the homologous relationships among genes across the 15 orchid species. Each PEPC gene was situated on distinct chromosomes within all species (Figure 4). A total of five gene pairs were identified within species (CePEPC1 and CePEPC2, CsPEPC1 and CsPEPC2, DcPEPC1 and DcPEPC2, DhPEPC1 and DhPEPC2, and DnPEPC1 and DnPEPC2), and were regarded as duplicated genes. The scattered distribution of PEPC genes on the chromosomes indicated that the duplicated genes in each orchid may result from segmental duplication.
To study the evolutionary regulation of the orchid PEPC gene family, MCScanX was used to identify duplicated gene pairs. The collinear relationships among the 15 PEPC genes of C. ensifolium, D. chrysotoxum, D. huoshanense, D. nobile, G. menghaiensis, and V. planifolia were examined (Figure 5). Duplicated genes intra- or inter-species were investigated, and 38 gene pairs were obtained. To explore the different selective constraints on duplicated PEPC genes in six orchids, the 38 gene pairs were selected for calculating the ratio of the number of non-synonymous substitutions per non-synonymous site (Ka) to the number of synonymous sites (Ks). The results showed that the Ka/Ks ratios of all PEPC gene pairs were less than 1, implying that the orchid PEPC genes mainly experienced strong purifying selection after segmental duplication or WGD (Supplementary Table S2).

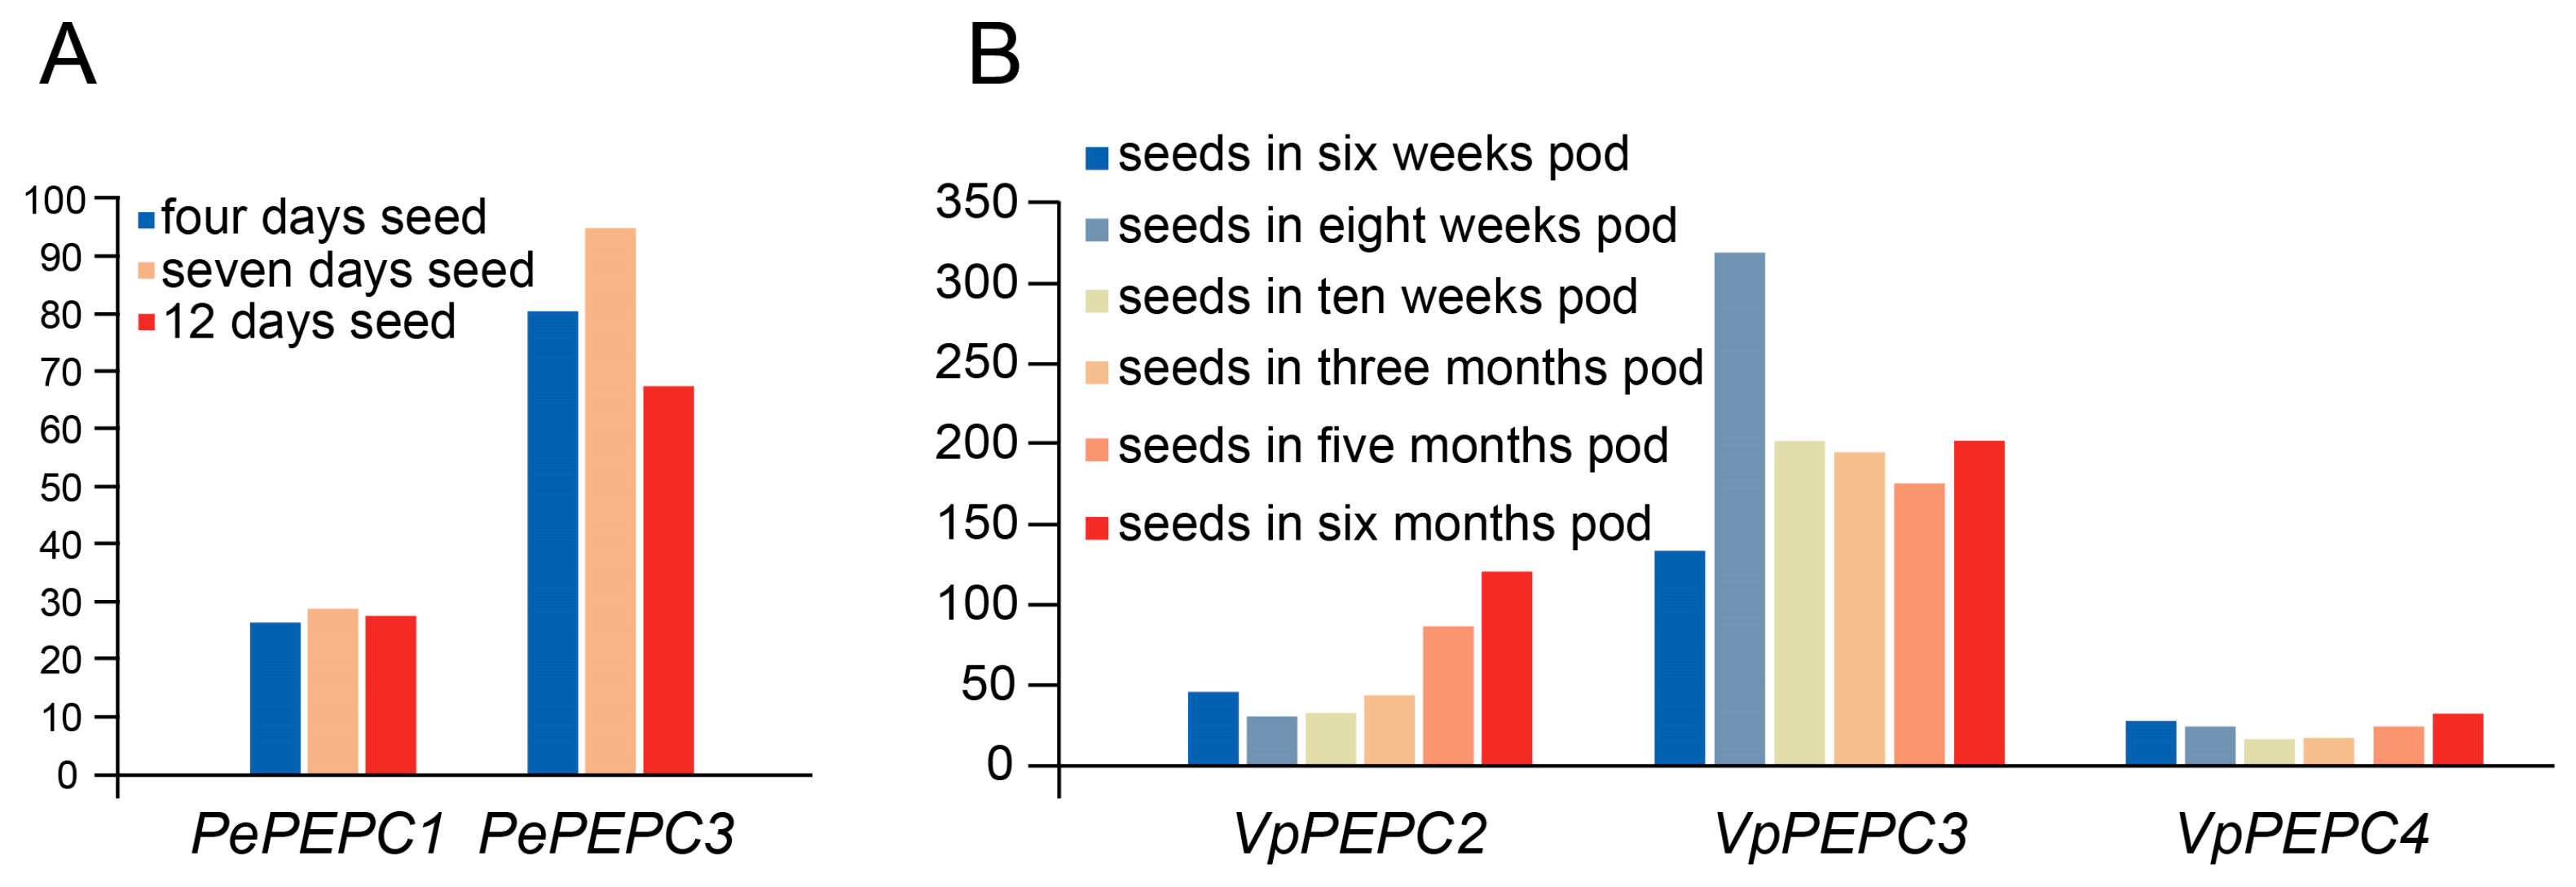
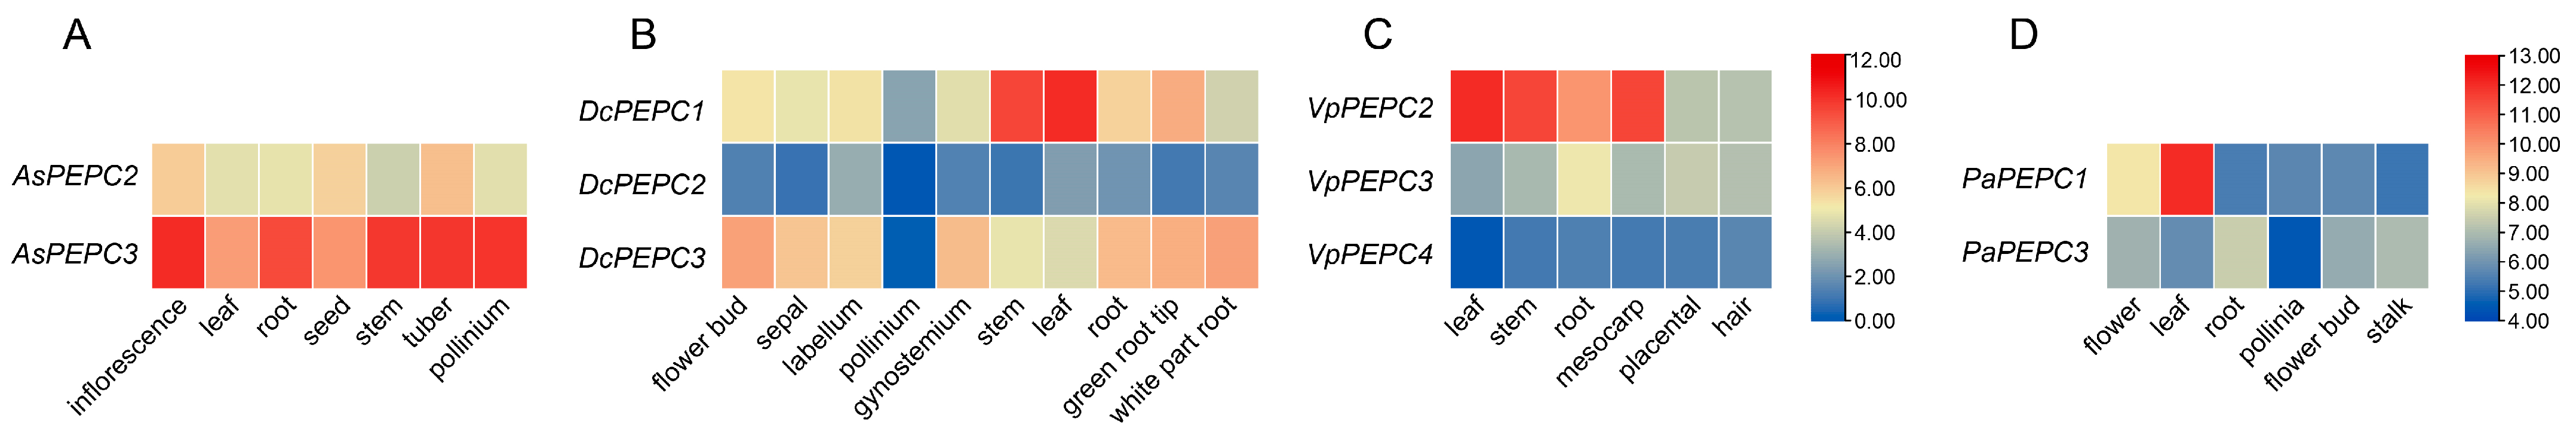
2.5. Expression Analysis of PEPC Genes

To elucidate the function of PEPC genes in orchids, the spatial and temporal expression patterns of PEPC genes in orchids were conducted based on transcriptome datasets. Here, we focused on the developmental seed transcriptome of Ph. equestris, spanning the 4, 7, and 12 days (Figure 6A). The temporal analysis unveiled dynamic expression patterns; the expression of PePEPCs was upregulated from the fourth day to the seventh day, followed by a subsequent downregulation on the 12th day. Notably, PePEPC3 consistently exhibited higher expression levels than PePEPC1. In addition, the developmental seed expression of V. planifolia within six, eight, and ten weeks, as well as three, five, and six-month pods were investigated based on the transcriptome data (Figure 6B). Distinct expression patterns of VpPEPCs in seeds were demonstrated. VpPEPC3 was most abundantly expressed, while VpPEPC4, a BTPC, was barely expressed. VpPEPC3 demonstrated an upward trend from six weeks to eight weeks, followed by a subsequent decline, and a slight rise in the six months. These results collectively underscored the intricate dynamics of PEPC gene expression and emphasized their important roles in seed germination.
The spatial expression patterns of PEPC genes in A. shenzhenica, D. catenatum, Ph aphrodite, and V. planifolia were analyzed to investigate gene biological functions and functional diversity (Figure 7). The expression results revealed that the PEPC gene exhibited widespread expressions in both vegetative tissues (leaf, root, and stem) and reproductive tissues (flower, pollinium, and seed). These findings indicated a diverse array of biological functions in growth and development associated with PEPC genes. Various expression patterns were observed for PEPC genes in different tissues. In A. shenzhenica, AsPEPC3 displayed prominent expressions in sequenced tissues, while AsPEPC2 exhibited lower expressions in all tissues (Figure 7A). The pronounced expression of AsPEPC3 in floral tissues (inflorescence and pollinium) and vegetative tissues (root, stem, and tuber), suggested its involvement in multiple aspects of plant growth. In D. catenatum, DcPEPC1 exhibited the highest expression levels in the stem and leaf, while DcPEPC2 showed minimal expressions (Figure 7B), indicating the function divergence between duplicated PEPC genes. DcPEPC3 exhibited high expressions in all the tested tissues, but lower than the expression level of DcPEPC1 in the stem and leaf. In V. planifolia, the bacterial-type PEPC (VpPEPC4), not reported before, exhibited lower expressions than other VpPEPCs in all the tested tissues (Figure 7C). VpPEPC2 displayed the highest expression level in the leaf, stem, root, and mesocarp of the pod. In Ph aphrodite, PaPEPC1 showed the highest expression in the leaf, followed by the flower, and lowest in the root, pollinia, flower bud, and stalk (Figure 7D). PaPEPC3 demonstrated a relatively low expression level in tested tissues. In summary, orchid PEPC genes showed key functions in various tissues, including seed germination, photosynthetic function, floral development, and root elongation.

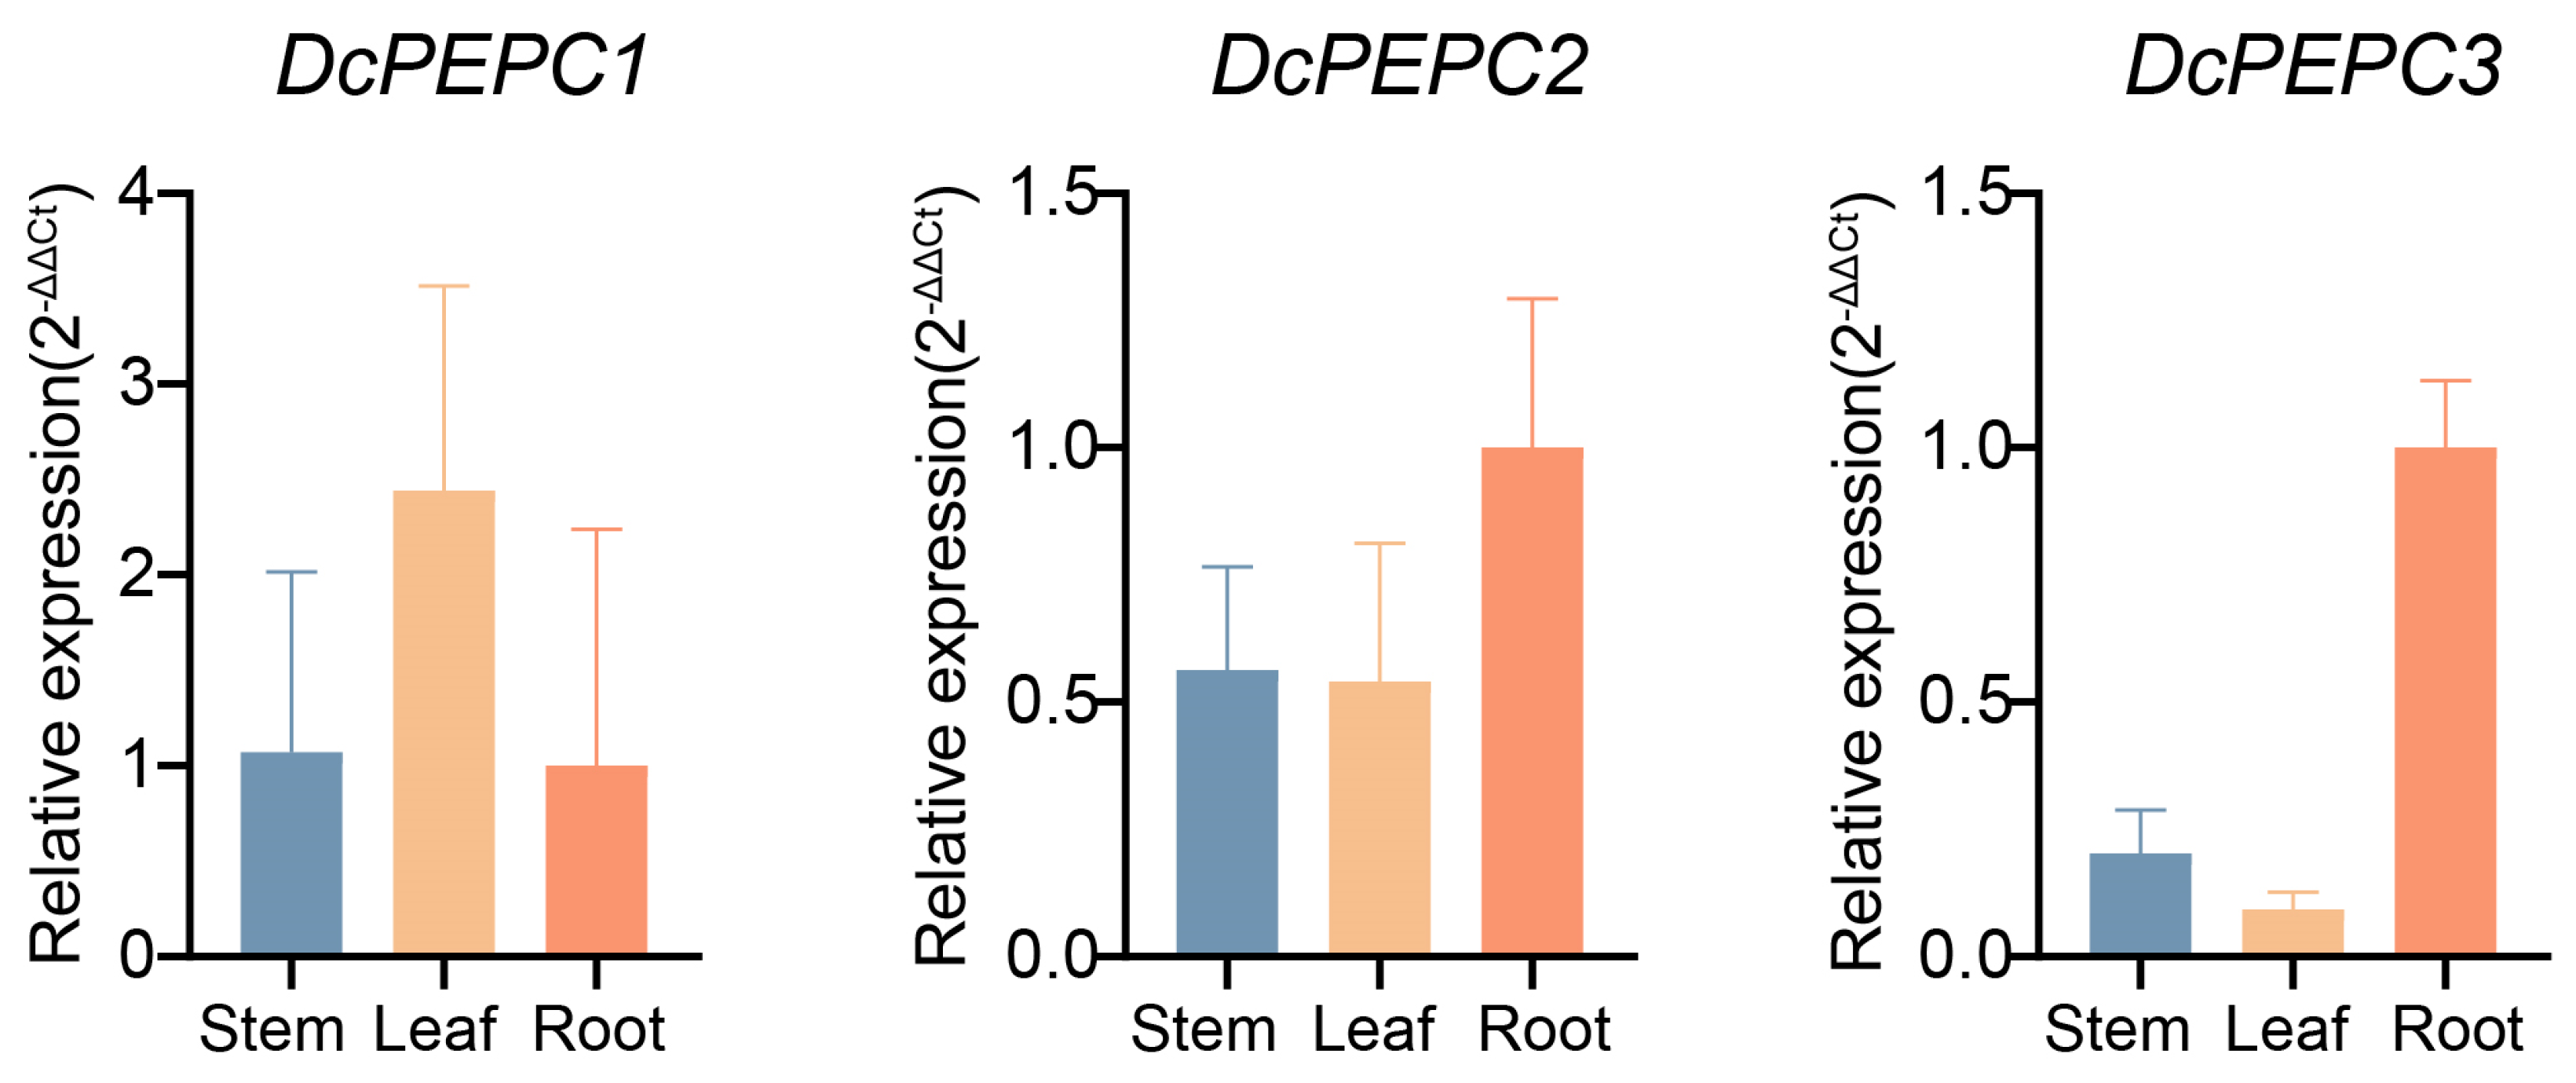
2.6. RT-qPCR of PEPC Genes

RT-qPCR was employed to corroborate the expression profiles of three PEPC genes (DcPEPC1, DcPEPC2, and DcPEPC3) in the stem, leaf, and root tissues. The results showed that DcPEPC1 exhibited high expressions in the leaf, followed by the stem and root (Figure 8, Supplementary Table S5). DcPEPC3 exhibited the highest expression levels in the root, followed by the stem and leaf. These results aligned with the expression patterns observed in the transcriptome data. However, a slight difference in the expression pattern of DePEPC2 was observed between RT-qPCR and transcriptome data. In RT-qPCR, DePEPC2 demonstrated the highest expression level in the root, while transcriptome data indicated a higher expression in the leaf. The expression profiles of three genes in three tissues, as determined by RT-qPCR, were largely consistent with the transcriptome data, substantiating the accuracy of the aforementioned expression patterns.

3. Discussion

3.1. Identification and Phylogenetic Analysis of PEPC Genes

The enzymes encoded by PEPC genes are responsible for primary CO2 fixation into OAA and malate [46]. The PEPC gene family plays a vital role in plant growth and development and has been studied in several plant families, including Crassulaceae, Fabaceae, and Poaceae [16,26,47]. However, the systematic identification or functional reports of the PEPC gene family in Orchidaceae based on the genome data remain limited. This study identified 33 PEPC genes from 15 orchid genomes that contained both C3 and CAM plants [48,49,50,51] (Table 1). The results showed that each species contained one to three PEPC homolog genes, fewer than the counts found in Gossypium [52], wheat, and sorghum [10]. In contrast to the varying tendency of PEPC numbers in Oncidiinae [3], the quantity of PEPC appeared to be unrelated to the type of photosynthesis in this study. This suggested that the gene dosage effect played a minor role in the CAM pathway, consistent with other perspectives [18,43].
A total of 33 PEPC proteins from 15 orchid genomes and four PEPC proteins from A. thaliana were combined to construct a phylogenetic tree. The result showed that orchid PEPCs were divided into two subfamilies: PTPC and BTPC. Further classification of the PTPC revealed three subclades (Figure 1). The phylogenetic relationship was consistent with previous studies [3,18,52]. Both phylogenetic and sequence analyses converged to suggest a single origin prior to the divergence of bacteria and plant lineages (Figure 1, Table 1). PEPC genes with different coding types in plants evolved independently and showed distant relationships (Figure 1). PEPC-iii contained 13 PEPC members, including most orchid species, followed by PEPC-i, implying that compared with PEPC-ii and PEPC-iv, the functional characteristics of PEPC in these two subgroups were relatively conserved. The results indicated numerous duplication and loss events during the evolutionary trajectory, contributing to the variations in the numbers of PEPC homolog genes among different species [18].
In plants, the PEPC gene family mainly consists of PTPC and BTPC. Most species always recruit PTPC, whereas some species recruit BTPC. However, these genes were usually expressed at low levels or exhibited higher expression levels in non-photosynthetic tissues [53]. Notably, Isoetes taiwanensis has been documented to recruit BTPC, exhibiting expression levels surpassing those of PTPC [27]. This study highlighted the presence of VpPEPC4 within the PEPC-iv (Figure 1), a novel finding yet to be reported in orchids. However, conclusive evidence regarding the functional specialization of this PEPC gene within CAM in V. planifolia requires validation through further transcriptomic studies.

3.2. Motif and Gene Structure Analysis of PEPC Genes

The motif and domain analysis revealed the high conservation of PEPC genes in orchids (Figure 2), consistent with other species, such as maize and sorghum [10]. The gene structure analysis revealed that the number of introns and exons in most orchid PEPC genes was similar to AtPEPCs but with some slight variations in the intron length. The gene family of orchids exhibited a longer intron length than the homolog genes in A. thaliana, which was reported previously [36,54]. The prevalence of longer introns in Orchidaceae likely represented a distinctive feature of this plant family. CePEPC2 and PgPEPC3 had unusually long introns (Figure 2C), suggesting that extremely long intron length might be attributed to species-specific evolution. The preference for longer intron over shorter counterparts was posited to release Hill–Robertson (HR) interference to enhance the efficiency of natural selection [55], which might be responsible for the biodiversity of Orchidaceae.

3.3. Cis-Elements in the Promoter Regions of PEPC Genes

Gene expression levels tend to be regulated by the cis-elements of promoter regions [56]. In this study, we identified the cis-elements within the 2000 bp promoter region of 17 PEPC genes from seven orchids (Figure 3). Our results showed a multitude of cis-elements implicated in light responsiveness, indicating the important role of light as a regulatory factor influencing PEPC gene functions. Many elements interacting with MYB transcription factors were identified. These MYB-binding sites were implicated in response to light and drought, suggesting the potential involvement of MYB transcription factors in regulating PEPC expression levels under stress conditions. Similar findings were found in C4 species [10]. This study suggested that the expression profile of the PEPC gene was regulated by multiple factors. Furthermore, compared with PEPC-iii, the promoter regions of PEPC genes at PEPC-i and PEPC-ii contained cis-elements associated with the circadian rhythm, implying that these two subgroups might be involved in photosynthesis.

3.4. Chromosomal Localization and Collinearity Analysis of PEPC Genes

Gene duplication events are a crucial factor in gene expansion or structural and functional divergence [57]. Using collinearity analysis, 38 gene pairs were identified (Figure 5), potentially attributed to WGD or segmental duplication, as evidenced by their chromosomal location [18,52]. The multiplicity of copies among different species ranged from one to three, indicative of probable duplication and loss events during the evolution [18]. Subsequently, these gene pairs were used for Ka/Ks analysis. The Ka/Ks ratio is essential for exploring genomic evolution [58], which can serve as an indicator of purifying selection (Ka/Ks < 1), neutral mutation (Ka/Ks = 1), or positive selection (Ka/Ks > 1). Purifying selection is recognized for its role in preserving existing biological functions [59]. Our study found that all the examined gene pairs exhibited Ka/Ks ratios less than 1 (Supplementary Table S2), suggesting that these PEPCs underwent exceedingly purifying selection, contributing to their high conservation in orchids.

3.5. Expression Analysis and RT-qPCR of PEPC Genes

During the extensive evolutionary history of orchid PEPC genes, duplicated genes may experience functional divergence [60]. Some PEPC genes in PEPC-i and PEPC-ii were identified as duplicated genes (Figure 1 and Figure 4). In D. catenatum, DcPEPC1 demonstrated elevated expression levels, while its duplicated gene DcPEPC2 exhibited minimal expression in all sequenced tissues (Figure 7B). The distinct expression patterns observed between the two genes suggested that the duplicated genes may experience neofunctionalization [52,60].
In V. planifolia, VpPEPC4 was considered a bacterial-type PEPC gene based on phylogenetic analysis (Figure 1). However, the transcriptome data analysis showed that VpPEPC4 was barely expressed in all the tested tissues (Figure 7C), contrasting with the high expression of BTPC in the green tissues of I. taiwanensis [27]. VpPEPC2 exhibited elevated expression in the stem and leaves. In D. catenatum, DcPEPC1 displayed prominent expression in the stem and leaf, much higher than that in other tissues (Figure 7B). The RT-qPCR experiments of DcPEPC1 further verified these results (Figure 8). In Ph. aphrodite, PaPEPC1 showed the most abundant expression level in the stem (Figure 7D). The expression patterns suggested the potential recruitment of DcPEPC1, PaPEPC1, and VpPEPC2 in the CAM pathway. Therefore, combined with the prediction of cis-elements, we hypothesized that genes within the PEPC-i and PEPC-ii clade were CAM-related genes, supporting the previous report [18].

4. Materials and Methods

4.1. Data Sources

The Arabidopsis thaliana and predicted proteins were retrieved from the TAIR10 Genome Release (http://www.arabidopsis.org, accessed on 8 August 2022). The genome datasets of A. shenzhenica (accession number: PRJNA310678), C. goeringii (accession number: PRJNA749652), C. sinense (accession number: PRJNA743748), D. catenatum (accession number: PRJNA262478), D. chrysotoxum (accession number: PRJNA664445), D. huoshanense (accession number: PRJNA597621), D. nobile (accession number: PRJNA725550), G. elata (accession number: PRJNA386713), G. menghaiensis (accession number: PRJNA695369), Ph. equestris (accession number: PRJNA53913), Pl. guangdongensis and Pl. zijinensis (accession number: PRJNA739531), and V. planifolia (accession number: PRJNA633886) were obtained from the National Center for Biotechnology Information (NCBI); data for Ph. aphrodite was downloaded from orchidstra2 (http://orchidstra2.abrc.sinica.edu.tw/orchidstra2/pagenome.php, accessed on 7 January 2022); and data for C. ensifolium (accession number: PRJCA005355) was downloaded from the National Genomics Data Center (NGDC). The PEPC genes and predicted proteins were retrieved from the complete genomes. The transcriptomes of A. shenzhenica, D. catenatum, and Ph. equestris were obtained from Orchidbase (http://orchidbase.itps.ncku.edu.tw/est/home2012.aspx, accessed on 17 August 2023) [61]. The transcriptomes of Ph. aphrodite and V. planifolia were obtained from orchidstra2 (http://orchidstra2.abrc.sinica.edu.tw/orchidstra2/pagenome.php, accessed on 10 January 2024) [62].

4.2. Homolog Gene Identification and Sequence Analysis

The PEPC protein sequences of the model plant A. thaliana were used to conduct a blast search for orthologs within orchids based on the genomic data, employing the BLAST module (Blastp) of TBtools (version 1.121) [63], hitting with e-values less than 1 × 10⁻¹⁰. The detailed information of BLAST result was provided in Supplementary Table S3. Subsequently, all protein sequences further underwent validation using the NCBI batch CD-search tool (https://www.ncbi.nlm.nih.gov/Structure/bwrpsb/bwrpsb.cgi, accessed on 7 October 2023) with a threshold of 0.01 to scrutinize the conserved domain (PF00311), and proteins lacking the complete domain were eliminated. The MEME Suite 5.5.1 online tool (https://meme-suite.org/meme/, accessed on 7 October 2023) [64] was used to analyze motif composition. The intron–exon structure was discerned by the Visualize Gene Structure program of TBtools (version 1.121) [63]. Finally, the visualization of these results was accomplished using the Gene Structure View module of TBtools (version 1.121) [63].
The physicochemical properties of the protein sequences of PEPCs were predicted by ExPASy (https://web.expasy.org/protparam/, accessed on 8 August 2023) [65]. Additionally, subcellular localization predictions were performed on Plant-mPLoc (version 1.0) (http://www.csbio.sjtu.edu.cn/bioinf/plant-multi/, accessed on 8 August 2023) [66].

4.3. Multiple Sequence Alignment and Phylogenetic Tree Construction

Multiple sequences were aligned using MUSCLE integrated into MEGA 7 with the default parameters [67]. The phylogenetic tree of PEPCs was constructed using the neighbor-joining (NJ) method in MEGA7 [67]. Parameters included the ‘Poisson model’ and the ‘Pairwise deletion’ option with a bootstrap test of 1000 replicates. Finally, the phylogenetic tree was imported into iTOL (https://itol.embl.de/itol.cgi, accessed on 30 November 2023) [68] for refinement and polishing, employing circle and none-leaf sorting parameters. And Adobe Illustrator CC 2018 was used for supplementing clade labels.

4.4. Prediction of Cis-Acting Elements

The 2000 bp regions upstream of all PEPCs were extracted using Gtf/Gff3 Sequence Extract and Fasta Extract programs integrated into TBtools (version 1.121) [63]. The online website PlantCARE (https://bioinformatics.psb.ugent.be/webtools/plantcare/html/, accessed on 18 October 2023) [69] was utilized for identifying the putative cis-acting elements in the promoter regions. The Basic Biosequence View module of TBtools (version 1.121) [63] was used to display the findings of cis-acting element annotation and counts.

4.5. Chromosomal Localization and Collinearity Analysis

After obtaining information on the chromosomal locations of the PEPC gene family across 15 orchids from the corresponding genome annotations, the chromosomal location map was generated using the Gene Location Visualize program in TBtools (version 1.121) [63]. The collinear relationship among six orchids was delineated and visualized by the One Step MCScanX fast program of TBtools (version 1.121) [63]. Subsequently, the Ka/Ks ratios of duplicated genes were calculated by the Simple Ka/Ks Calculator integrated into TBtools (version 1.121) [63], using the Nei and Gojobori (NG) method. If Ka > Ks or Ka/Ks > 1, the gene was generally considered to undergo positive selection; if Ka = Ks or Ka/Ks = 1, the gene was subject to neutral evolution; and if Ka < Ks or Ka/Ks < 1, the gene underwent purifying selection [70].

4.6. Expression Patterns Analysis

The expression levels of PEPCs in A. shenzhenica, D. catenatum, and Ph. equestris were obtained from Orchidbase (http://orchidbase.itps.ncku.edu.tw/est/home2012.aspx, accessed on 17 August 2023) [61], Ph. aphrodite and V. planifolia were acquired from orchidstra2 (http://orchidstra2.abrc.sinica.edu.tw/orchidstra2/pagenome.php, accessed on 10 January 2024) [62]. The FPKM values of PEPCs were imported into the Heatmap program of TBtools (version 1.121) [63] for the generation of heat maps.

4.7. RT-qPCR

The plant materials used in this study were sourced from the National Orchid Germplasm Resources of Fujian Agriculture and Forestry University, Fuzhou, China. For RT-qPCR validation, three PEPC genes (DcPEPC1, DcPEPC2, and DcPEPC3) were selected. Total RNA extraction was carried out using the RaPure Total RNA Plus Kit (Magen Biotech Co., Ltd., Guangzhou, China), following the eighth method described in the kit manual for plant samples. Subsequently, cDNA synthesis was performed using the Hifair® AdvanceFast 1st Strand cDNA Synthesis Kit (Yeasen Biotechnology, Shanghai, China). RT-qPCR analysis was conducted on the QuantStudio™ Real-Time PCR (Applied Biosystems, Waltham, MA, USA), employing the Hieff UNICON® Universal Blue qPCR SYBR Green Master Mix (low rox) kit (Yeasen Biotechnology, Shanghai, China). The reaction system comprised a total volume of 20 µL, including 10 µL of Hieff UNICON Universal Blue qPCR SYBR Green Master Mix, 0.4 µL of forward primer (10 µM), 0.4 µL of reverse primer (10 µM), 2 µL of template DNA, and 7.2 µL of sterile ultrapure water. All experiments were conducted using three biological replicates and three technical replicates.
The Ct values obtained from RT-qPCR were analyzed using the 2−ΔΔCT formula to determine the relative expression levels of the three genes in different tissues (stem, leaf, and root). The Ct values of roots were used as the control for calculation, and DcGAPDH was used as the internal reference for normalization. Detailed information on RT-qPCR primers was provided in Supplementary Table S4, and RT-qPCR data details were presented in Supplementary Table S5. The results of RT-qPCR were visualized using GraphPad Prism 8.0.1 for Windows (GraphPad Software version 8.0.1, San Diego, CA, USA, www.graphpad.com, accessed on 10 January 2024).

5. Conclusions

In this study, a comprehensive analysis of the orchid PEPC gene family was conducted. A total of 33 orchid PEPC genes were identified from 15 orchid species. Domain, motif pattern, and gene structure analyses revealed high conservation among all orchid PEPC. These genes were classified into two clades, PTBC and BTPC, exhibiting highly similar characteristics within each respective clade. PTPC was further classified into three subclades. Remarkably, an orchid PEPC in BTPC (VpPEPC4) was identified for the first time. However, the expression level of VpPEPC4 was found to be lower than other VpPEPCs. The cis-acting element in light responsiveness acted in concert with the pivotal role of PEPCs in photosynthesis, and the circadian-related elements were found in most PEPC-i and PEPC-ii genes. The duplicated genes in D. catenatum showed distinct expression patterns and were validated using RT-qPCR results, indicating functional divergence in orchid evolution. These findings provided valuable insights into the characteristics and functions of PEPC in orchids.

Supplementary Materials

The supporting information can be downloaded at: https://www.mdpi.com/article/10.3390/ijms25042055/s1.

Author Contributions

M.-H.L., D.-K.L. and Z.-J.L., conceptualization; R.L. and X.G., bioinformatics analysis and writing—original draft preparation; R.L., Y.W., M.-H.L. and Z.-J.L., data curation, writing—reviewing and editing; R.L. and C.W., validation and resources; D.-K.L., supervision. All authors have read and agreed to the published version of the manuscript.

Funding

This research was funded by the National Natural Science Foundation of China (No. 32271957) and the Outstanding Youth Scientific Fund of Fujian Agriculture and Forestry University (XJQ202005).

Institutional Review Board Statement

Not applicable.

Informed Consent Statement

Not applicable.

Data Availability Statement

All the data are provided within this manuscript.

Conflicts of Interest

The authors declare no conflicts of interest.

References

  1. Chollet, R.; Vidal, J.; O’Leary, M.H. Phosphoenolpyruvate carboxylase: A ubiquitous, highly regulated enzyme in plants. Annu. Rev. Plant Biol. 1996, 47, 273–298. [Google Scholar] [CrossRef] [PubMed]
  2. Izui, K.; Matsumura, H.; Furumoto, T.; Kai, Y. Phosphoenolpyruvate carboxylase, a new era of structural biology. Annu. Rev. Plant Biol. 2004, 55, 69–84. [Google Scholar] [CrossRef] [PubMed]
  3. Silvera, K.; Winter, K.; Rodriguez, B.L.; Albion, R.L.; Cushman, J.C. Multiple isoforms of phosphoenolpyruvate carboxylase in the Orchidaceae (subtribe Oncidiinae), implications for the evolution of crassulacean acid metabolism. J. Exp. Bot. 2014, 65, 3623–3636. [Google Scholar] [CrossRef] [PubMed]
  4. O’Leary, B.; Park, J.; Plaxton, W.C. The remarkable diversity of plant PEPC (phosphoenolpyruvate carboxylase), recent insights into the physiological functions and post-translational controls of non-photosynthetic PEPCs. Biochem. J. 2011, 436, 15–34. [Google Scholar] [CrossRef] [PubMed]
  5. Gennidakis, S.; Rao, S.; Greenham, K.; Uhrig, R.G.; O’Leary, B.; Snedden, W.A.; Lu, C.F.; Plaxton, W.C. Bacterial- and plant-type phosphoenolpyruvate carboxylase polypeptides interact in the hetero-oligomeric Class-2 PEPC complex of developing castor oil seeds. Plant J. 2007, 52, 839–849. [Google Scholar] [CrossRef] [PubMed]
  6. Igawa, T.; Fujiwara, M.; Tanaka, I.; Fukao, Y.; Yanagawa, Y. Characterization of bacterial-type phosphoenolpyruvate carboxylase expressed in male gametophyte of higher plants. BMC Plant Biol. 2010, 10, 200. [Google Scholar] [CrossRef]
  7. O’Leary, B.; Fedosejevs, E.T.; Hill, A.T.; Bettridge, J.; Park, J.; Rao, S.K.; Leach, C.A.; Plaxton, W.C. Tissue-specific expression and post-translational modifications of plant-and bacterial-type phosphoenolpyruvate carboxylase isozymes of the castor oil plant, Ricinus communis L. J. Exp. Bot. 2011, 62, 5485–5495. [Google Scholar] [CrossRef]
  8. Sánchez, R.; Cejudo, F.J. Identification and expression analysis of a gene encoding a bacterial-type phosphoenolpyruvate carboxylase from Arabidopsis and rice. Plant Physiol. 2003, 132, 949–957. [Google Scholar] [CrossRef] [PubMed]
  9. Borland, A.M.; Griffiths, H.; Hartwell, J.; Smith, J.A.C. Exploiting the potential of plants with crassulacean acid metabolism for bioenergy production on marginal lands. J. Exp. Bot. 2009, 60, 2879–2896. [Google Scholar] [CrossRef] [PubMed]
  10. Chen, L.; Yang, Y.; Zhao, Z.; Lu, S.; Lu, Q.; Cui, C.; Parry, M.A.J.; Hu, Y.G. Genome-wide identification and comparative analyses of key genes involved in C4 photosynthesis in five main gramineous crops. Front. Plant Sci. 2023, 14, 1134170. [Google Scholar] [CrossRef] [PubMed]
  11. Cousins, A.B.; Baroli, I.; Badger, M.R.; Ivakov, A.; Lea, P.J.; Leegood, R.C.; von Caemmerer, S. The role of phosphoenolpyruvate carboxylase during C4 photosynthetic isotope exchange and stomatal conductance. Plant Physiol. 2007, 145, 1006–1017. [Google Scholar] [CrossRef]
  12. Ruiz-Ballesta, I.; Baena, G.; Gandullo, J.; Wang, L.Q.; She, Y.M.; Plaxton, W.C.; Echevarría, C. New insights into the post-translational modification of multiple phosphoenolpyruvate carboxylase isoenzymes by phosphorylation and monoubiquitination during sorghum seed development and germination. J. Exp. Bot. 2016, 67, 3523–3536. [Google Scholar] [CrossRef] [PubMed]
  13. Singh, J.; Reddy, G.M.; Agarwal, A.; Chandrasekhar, K.; Sopory, S.K.; Reddy, M.K.; Kaul, T. Molecular and structural analysis of C4-specific PEPC isoform from Pennisetum glaucum plays a role in stress adaptation. Gene 2012, 500, 224–231. [Google Scholar] [CrossRef]
  14. Besnard, G.; Pincon, G.; D’Hont, A.; Hoarau, J.Y.; Cadet, F.; Offmann, B. Characterisation of the phosphoenolpyruvate carboxylase gene family in sugarcane (Saccharum spp.). Theor. Appl. Genet. 2003, 107, 470–478. [Google Scholar] [CrossRef] [PubMed]
  15. Boxall, S.F.; Kadu, N.; Dever, L.V.; Kneřová, J.; Waller, J.L.; Gould, P.J.; Hartwell, J. Kalanchoë PPC1 is essential for crassulacean acid metabolism and the regulation of core circadian clock and guard cell signaling genes. Plant Cell 2020, 32, 1136–1160. [Google Scholar] [CrossRef]
  16. Wang, N.; Zhong, X.; Cong, Y.; Wang, T.; Yang, S.; Li, Y.; Gai, J. Genome-wide analysis of phosphoenolpyruvate carboxylase gene family and their response to abiotic stresses in soybean. Sci. Rep. 2016, 6, 38448. [Google Scholar] [CrossRef]
  17. Besnard, G.; Muasya, A.M.; Russier, F.; Roalson, E.H.; Salamin, N.; Christin, P.A. Phylogenomics of C4 photosynthesis in sedges (Cyperaceae), multiple appearances and genetic convergence. Mol. Biol. Evol. 2009, 26, 1909–1919. [Google Scholar] [CrossRef] [PubMed]
  18. Deng, H.; Zhang, L.S.; Zhang, G.Q.; Zheng, B.Q.; Liu, Z.J.; Wang, Y. Evolutionary history of PEPC genes in green plants, implications for the evolution of CAM in orchids. Mol. Phylogenet. Evol. 2016, 94, 559–564. [Google Scholar] [CrossRef]
  19. Alonso-Cantabrana, H.; Cousins, A.B.; Danila, F.; Ryan, T.; Sharwood, R.E.; von Caemmerer, S.; Furbank, R.T. Diffusion of CO2 across the mesophyll-bundle sheath cell interface in a C4 plant with genetically reduced PEP carboxylase activity. Plant Physiol. 2018, 178, 72–81. [Google Scholar] [CrossRef]
  20. Tang, Y.; Li, X.; Lu, W.; Wei, X.; Zhang, Q.; Lv, C.; Song, N. Enhanced photorespiration in transgenic rice over-expressing maize C4 phosphoenolpyruvate carboxylase gene contributes to alleviating low nitrogen stress. Plant Physiol. Biochem. 2018, 130, 577–588. [Google Scholar] [CrossRef]
  21. Liu, D.; Hu, R.; Zhang, J.; Guo, H.B.; Cheng, H.; Li, L.; Borland, A.M.; Qin, H.; Chen, J.-G.; Muchero, W.; et al. Overexpression of an agave phosphoenolpyruvate carboxylase improves plant growth and stress tolerance. Cells 2021, 10, 582. [Google Scholar] [CrossRef]
  22. Behera, D.; Swain, A.; Karmakar, S.; Dash, M.; Swain, P.; Baig, M.J.; Molla, K.A. Overexpression of Setaria italica phosphoenolpyruvate carboxylase gene in rice positively impacts photosynthesis and agronomic traits. Plant Physiol. Biochem. 2023, 194, 169–181. [Google Scholar] [CrossRef]
  23. Sunagawa, H.; Cushman, J.; Agarie, S. Crassulacean acid metabolism may alleviate production of reactive oxygen species in a facultative CAM plant; the common ice plant Mesembryanthemum crystallinum L. Plant Prod. Sci. 2010, 13, 256–260. [Google Scholar] [CrossRef]
  24. Ming, R.; VanBuren, R.; Wai, C.M.; Tang, H.; Schatz, M.C.; Bowers, J.E.; Lyons, E.; Wang, M.L.; Chen, J.; Biggers, E.; et al. The pineapple genome and the evolution of CAM photosynthesis. Nat. Genet. 2015, 47, 1435–1442. [Google Scholar] [CrossRef] [PubMed]
  25. Fan, W.; He, Z.S.; Zhe, M.; Feng, J.Q.; Zhang, L.; Huang, Y.W.; Liu, F.; Huang, J.L.; Ya, J.D.; Zhang, S.B.; et al. High-quality Cymbidium mannii genome and multifaceted regulation of crassulacean acid metabolism in epiphytes. Plant Commun. 2023, 4, 100564. [Google Scholar] [CrossRef]
  26. Yang, X.; Hu, R.; Yin, H.; Jenkins, J.; Shu, S.; Tang, H.; Liu, D.G.; Weighill, D.A.; Yim, W.C.; Ha, J.; et al. The Kalanchoë genome provides insights into convergent evolution and building blocks of crassulacean acid metabolism. Nat. Commun. 2017, 8, 1899. [Google Scholar] [CrossRef] [PubMed]
  27. Wickell, D.; Kuo, L.Y.; Yang, H.P.; Ashok, A.D.; Irisarri, I.; Dadras, A.; de Vries, S.; de Vries, J.; Huang, Y.M.; Li, Z.; et al. Underwater CAM photosynthesis elucidated by Isoetes genome. Nat. Commun. 2021, 12, 6348. [Google Scholar] [CrossRef] [PubMed]
  28. Silvera, K.; Neubig, K.M.; Whitten, W.; Williams, N.H.; Winter, K.; Cushman, J.C. Evolution along the crassulacean acid metabolism continuum. Funct. Plant Biol. 2010, 37, 995–1010. [Google Scholar] [CrossRef]
  29. Gamisch, A.; Winter, K.; Fischer, G.A.; Comes, H.P. Evolution of crassulacean acid metabolism (CAM) as an escape from ecological niche conservatism in Malagasy Bulbophyllum (Orchidaceae). New Phytol. 2021, 231, 1236–1248. [Google Scholar] [CrossRef] [PubMed]
  30. Smith, J.A.C.; Winter, K. Crassulacean Acid Metabolism: Biochemistry, Ecophysiology and Evolution; Springer: Berlin/Heidelberg, Germany, 1996; pp. 427–436. [Google Scholar]
  31. Silvera, K.; Santiago, L.S.; Cushman, J.C.; Winter, K. Crassulacean acid metabolism and epiphytism linked to adaptive radiations in the Orchidaceae. Plant Physiol. 2009, 149, 1838–1847. [Google Scholar] [CrossRef]
  32. Zhang, G.Q.; Liu, K.W.; Li, Z.; Lohaus, R.; Hsiao, Y.Y.; Niu, S.C.; Wang, J.Y.; Lin, Y.C.; Xu, Q.; Chen, L.J.; et al. The Apostasia genome and the evolution of orchids. Nature 2017, 549, 379–383. [Google Scholar] [CrossRef] [PubMed]
  33. Ai, Y.; Li, Z.; Sun, W.-H.; Chen, J.; Zhang, D.; Ma, L.; Zhang, Q.-H.; Chen, M.-K.; Zheng, Q.-D.; Liu, J.-F.; et al. The Cymbidium genome reveals the evolution of unique morphological traits. Hortic. Res. 2021, 8, 255. [Google Scholar] [CrossRef] [PubMed]
  34. Yang, F.; Gao, J.; Wei, Y.; Ren, R.; Zhang, G.; Lu, C.; Jin, J.; Ai, Y.; Wang, Y.; Chen, L.; et al. The genome of Cymbidium sinense revealed the evolution of orchid traits. Plant Biotechnol. J. 2021, 19, 2501–2516. [Google Scholar] [CrossRef] [PubMed]
  35. Sun, Y.; Chen, G.-Z.; Huang, J.; Liu, D.-K.; Xue, F.; Chen, X.-L.; Chen, S.-Q.; Liu, C.-G.; Liu, H.; Ma, H.; et al. The Cymbidium goeringii genome provides insight into organ development and adaptive evolution in orchids. Ornam. Plant Res. 2021, 1, 10. [Google Scholar]
  36. Zhang, G.Q.; Xu, Q.; Bian, C.; Tsai, W.C.; Yeh, C.M.; Liu, K.W.; Yoshida, K.; Zhang, L.S.; Chang, S.B.; Chen, F.; et al. The Dendrobium catenatum Lindl. genome sequence provides insights into polysaccharide synthase; floral development and adaptive evolution. Sci. Rep. 2016, 6, 19029. [Google Scholar] [CrossRef] [PubMed]
  37. Zhang, Y.; Zhang, G.Q.; Zhang, D.; Liu, X.D.; Xu, X.Y.; Sun, W.H.; Yu, X.; Zhu, X.; Wang, Z.W.; Zhao, X.; et al. Chromosome-scale assembly of the Dendrobium chrysotoxum genome enhances the understanding of orchid evolution. Hortic. Res. 2021, 8, 183. [Google Scholar] [CrossRef]
  38. Han, B.; Jing, Y.; Dai, J.; Zheng, T.; Gu, F.; Zhao, Q.; Zhu, F.; Song, X.; Deng, H.; Wei, P.; et al. A chromosome-level genome assembly of Dendrobium huoshanense using long reads and Hi-C data. Genome Biol. Evol. 2020, 12, 2486–2490. [Google Scholar] [CrossRef]
  39. Xu, Q.; Niu, S.-C.; Li, K.-L.; Zheng, P.-J.; Zhang, X.-J.; Jia, Y.; Liu, Y.; Niu, Y.-X.; Yu, L.-H.; Chen, D.-F.; et al. Chromosome-scale assembly of the Dendrobium nobile genome provides insights into the molecular mechanism of the biosynthesis of the medicinal active ingredient of Dendrobium. Front. Genet. 2022, 13, 844622. [Google Scholar] [CrossRef]
  40. Yuan, Y.; Jin, X.; Liu, J.; Zhao, X.; Zhou, J.; Wang, X.; Wang, D.; Lai, C.; Xu, W.; Huang, J. The Gastrodia elata genome provides insights into plant adaptation to heterotrophy. Nat. Commun. 2018, 9, 1615. [Google Scholar] [CrossRef]
  41. Jiang, Y.; Hu, X.D.; Yuan, Y.; Guo, X.L.; Chase, M.W.; Ge, S.; Li, J.W.; Fu, J.L.; Li, K.; Hao, M.; et al. The Gastrodia menghaiensis (Orchidaceae) genome provides new insights of orchid mycorrhizal interactions. BMC Plant Biol. 2022, 22, 179. [Google Scholar] [CrossRef]
  42. Chao, Y.T.; Chen, W.C.; Chen, C.Y.; Ho, H.Y.; Yeh, C.H.; Kuo, Y.T.; Su, C.L.; Yen, S.H.; Hsueh, H.Y.; Yeh, J.H.; et al. Chromosome-level assembly; genetic and physical mapping of Phalaenopsis aphrodite genome provides new insights into species adaptation and resources for orchid breeding. Plant Biotechnol. 2018, 16, 2027–2041. [Google Scholar] [CrossRef]
  43. Cai, J.; Liu, X.; Vanneste, K.; Tsai, W.C.; Liu, K.W.; Chen, L.J.; He, Y.; Xu, Q.; Bian, C.; Zheng, Z.; et al. The genome sequence of the orchid Phalaenopsis equestris. Nat. Genet. 2015, 47, 65–72. [Google Scholar] [CrossRef]
  44. Li, M.H.; Liu, K.W.; Li, Z.; Lu, H.C.; Ye, Q.L.; Zhang, D.; Wang, J.Y.; Li, Y.F.; Zhong, Z.M.; Liu, X.; et al. Genomes of leafy and leafless Platanthera orchids illuminate the evolution of mycoheterotrophy. Nat. Plants 2022, 8, 373–388. [Google Scholar] [CrossRef]
  45. Hasing, T.; Tang, H.; Brym, M.; Khazi, F.; Huang, T.; Chambers, A.H. A phased Vanilla planifolia genome enables genetic improvement of flavour and production. Nat. Food 2020, 1, 811–819. [Google Scholar] [CrossRef]
  46. Masumoto, C.; Miyazawa, S.I.; Ohkawa, H.; Fukudaa, T.; Taniguchia, Y.; Murayamaa, S.; Kusanob, M.; Saitob, K.; Fukayamaa, H.; Miyao, M. Phosphoenolpyruvate carboxylase intrinsically located in the chloroplast of rice plays a crucial role in ammonium assimilation. Proc. Natl. Acad. Sci. USA 2010, 107, 5226–5231. [Google Scholar] [CrossRef]
  47. Huang, W.; Zhang, L.; Columbus, J.T.; Hu, Y.; Zhao, Y.; Tang, L.; Guo, Z.H.; Chen, W.L.; McKain, M.; Bartlett, M.; et al. A well-supported nuclear phylogeny of Poaceae and implications for the evolution of C4 photosynthesis. Mol. Plant 2022, 15, 755–777. [Google Scholar] [CrossRef]
  48. Zhang, L.; Chen, F.; Zhang, G.Q.; Zhang, Y.Q.; Niu, S.; Xiong, J.-S.; Lin, Z.; Cheng, Z.M.; Liu, Z.J. Origin and mechanism of crassulacean acid metabolism in orchids as implied by comparative transcriptomics and genomics of the carbon fixation pathway. Plant J. 2016, 86, 175–185. [Google Scholar] [CrossRef]
  49. Motomura, H.; Yukawa, T.; Ueno, O.; Kagawa, A. The occurrence of crassulacean acid metabolism in Cymbidium (Orchidaceae) and its ecological and evolutionary implications. J. Plant Res. 2008, 121, 163–177. [Google Scholar] [CrossRef]
  50. Li, M.H.; Liu, D.K.; Zhang, G.Q.; Deng, H.; Tu, X.D.; Wang, Y.; Lan, S.R.; Liu, Z.J. A perspective on crassulacean acid metabolism photosynthesis evolution of orchids on different continents: Dendrobium as a case study. J. Exp. Bot. 2019, 70, 6611–6619. [Google Scholar] [CrossRef]
  51. Torres-Morales, G.; Lasso, E.; Silvera, K.; Turner, B.L.; Winter, K. Occurrence of crassulacean acid metabolism in Colombian orchids determined by leaf carbon isotope ratios. Bot. J. Linn. Soc. 2020, 193, 431–477. [Google Scholar] [CrossRef]
  52. Zhao, Y.; Guo, A.; Wang, Y.; Hua, J. Evolution of PEPC gene family in Gossypium reveals functional diversification and GhPEPC genes responding to abiotic stresses. Gene 2019, 698, 61–71. [Google Scholar] [CrossRef]
  53. Ting, M.K.Y.; She, Y.M.; Plaxton, W.C. Transcript profiling indicates a widespread role for bacterial-type phosphoenolpyruvate carboxylase in malate-accumulating sink tissues. J. Exp. Bot. 2017, 68, 5857–5869. [Google Scholar] [CrossRef]
  54. Zhang, D.; Lan, S.; Yin, W.L.; Liu, Z.J. Genome-wide identification and expression pattern analysis of KNOX gene family in Orchidaceae. Front. Plant Sci. 2022, 13, 901089. [Google Scholar] [CrossRef]
  55. Jo, B.S.; Choi, S.S. Introns, the functional benefits of introns in genomes. Genomics inform. 2015, 13, 112. [Google Scholar] [CrossRef]
  56. Hernandez-Garcia, C.M.; Finer, J.J. Identification and validation of promoters and cis-acting regulatory elements. Plant Sci. 2014, 217, 109–119. [Google Scholar] [CrossRef]
  57. Flagel, L.E.; Wendel, J.F. Gene duplication and evolutionary novelty in plants. New Phytol. 2009, 183, 557–564. [Google Scholar] [CrossRef]
  58. Fay, J.C.; Wu, C.I. Sequence divergence; functional constraint; and selection in protein evolution. Annu. Rev. Genomics Hum. Genet. 2003, 4, 213–235. [Google Scholar] [CrossRef]
  59. Cvijović, I.; Good, B.H.; Desai, M.M. The effect of strong purifying selection on genetic diversity. Genetics 2018, 209, 1235–1278. [Google Scholar] [CrossRef]
  60. Wendel, J.F.; Lisch, D.; Hu, G.; Mason, A.S. The long and short of doubling down, polyploidy; epigenetics; and the temporal dynamics of genome fractionation. Curr. Opin. Genet. Dev. 2018, 49, 1–7. [Google Scholar] [CrossRef]
  61. Hsiao, Y.Y.; Fu, C.H.; Ho, S.Y.; Li, C.I.; Chen, Y.Y.; Wu, W.L.; Wang, J.S.; Zhang, D.Y.; Hu, W.Q.; Yu, X.; et al. OrchidBase 4.0: A database for orchid genomics and molecular biology. BMC Plant Biol. 2021, 21, 371. [Google Scholar] [CrossRef]
  62. Chao, Y.-T.; Yen, S.-H.; Yeh, J.-H.; Chen, W.-C.; Shih, M.-C. Orchidstra 2.0—A Transcriptomics Resource for the Orchid Family. Plant Cell Physiol. 2017, 58, e9. [Google Scholar] [CrossRef]
  63. Chen, C.; Chen, H.; Zhang, Y.; Thomas, H.R.; Frank, M.H.; He, Y.; Xia, R. TBtools, an integrative toolkit developed for interactive analyses of big biological data. Mol. Plant 2020, 13, 1194–1202. [Google Scholar] [CrossRef]
  64. Bailey, T.L.; Johnson, J.; Grant, C.E.; Noble, W.S. The MEME suite. Nucleic Acids Res. 2015, 43, W39–W49. [Google Scholar] [CrossRef]
  65. Gasteiger, E.; Hoogland, C.; Gattiker, A.; Duvaud, S.E.; Wilkins, M.R.; Appel, R.D.; Bairoch, A. Protein Identification and Analysis Tools on the ExPASy Server; Humana Press: Totowa, NJ, USA, 2005; pp. 571–607. [Google Scholar]
  66. Chou, K.C.; Shen, H.B. Plant-mPLoc, a top-down strategy to augment the power for predicting plant protein subcellular localization. PLoS ONE 2010, 5, e11335. [Google Scholar] [CrossRef]
  67. Kumar, S.; Stecher, G.; Tamura, K. MEGA7: Molecular evolutionary genetics analysis version 7.0 for bigger datasets. Mol. Biol. Evol. 2016, 33, 1870–1874. [Google Scholar] [CrossRef]
  68. Letunic, I.; Bork, P. Interactive Tree Of Life (ITOL): An online tool for phylogenetic tree display and annotation. Bioinformatics 2007, 23, 127–128. [Google Scholar] [CrossRef]
  69. Lescot, M.; Déhais, P.; Thijs, G.; Marchal, K.; Moreau, Y.; Van de Peer, Y.; Rouzé, P.; Rombauts, S. PlantCARE, a database of plant cis-acting regulatory elements and a portal to tools for in silico analysis of promoter sequences. Nucleic Acids Res. 2002, 30, 325–327. [Google Scholar] [CrossRef]
  70. Hurst, L.D. The Ka/Ks ratio: Diagnosing the form of sequence evolution. Trends Genet. 2002, 18, 486–487. [Google Scholar] [CrossRef]
Figure 1. Phylogenetic trees of PEPC proteins based on 33 orchid PEPC proteins and 4 AtPEPC proteins. The different sizes of the circle on the nodes represent bootstrap percentages; the upper left corner shows the phylogenetic topology structure. PEPC-i, PEPC-ii, PEPC-iii, and PEPC-iv are grouped together as indicated in pale red, pink, blue, and green, respectively. A. shenzhenica, C. ensifolium, C. goeringii, C. sinense, D. catenatum, D. chrysotoxum, D. huoshanense, D. nobile, G. elata, G. menghaiensis, Ph aphrodite, Ph. equestris, Pl guangdongensis, Pl. zijinensis, and V. planifolia are labeled as As, Ce, Cg, Cs, Dc, De, Dh, Dn, Ge, Gm, Pa, Pe, Pg, Pz, and Vp, respectively.
Ijms 25 02055 g001
Figure 2. Gene structure, conserved motifs, and domains of PEPCs. (A) The NJ tree contains 33 orchid PEPCs. (B) Squares of different colors represent conserved motifs of PEPCs. (C) Squares of different colors represent the gene structures of PEPCs.
Ijms 25 02055 g002
Figure 3. Cis-acting elements in the promoter regions of PEPC genes. (A) Functions of cis-acting elements in different orchid PEPCs. (B) Number of cis-acting elements in different orchid PEPCs.
Ijms 25 02055 g003
Figure 4. Chromosomal localization of PEPC genes. The scale bars on the left are the length (Mb) of the chromosomes of each orchid. Red lines connect the possible duplicated genes. (A) A. shenzhenica; (B) C. ensifolium; (C) D. huoshanense; (D) C. goeringii; (E) D. chrysotoxum; (F) C. sinense; (G) G. menghaiensis; (H) Pl. zijinensis; (I) G. elata; (J) D. catenatum; (K) Ph. equestris; (L) Pl. guangdongensis; (M) Ph. aphrodite; (N) D. nobile; (O) V. planifolia.
Ijms 25 02055 g004
Figure 5. Location and orthologs or paralogs of 38 PEPC gene pairs intra- or inter-species of G. menghaiensis, V. planifolia, C. ensifolium, D. chrysotoxum, D. huoshanense, and D. nobile genomes. The chromosomes of G. menghaiensis, V. planifolia, C. ensifolium, D. chrysotoxum, D. huoshanense, and D. nobile were shown with different colors and labeled as Gm, Vp, Ce, De, Dh, and Dn, respectively. The gene pairs among different species are shown with different colors.
Ijms 25 02055 g005
Figure 6. Temporal expression patterns of PEPC genes in orchids. Gene expression levels were quantified in FPKM. (A) Ph. equestris; (B) V. planifolia.
Ijms 25 02055 g006
Figure 7. Spatial expression patterns of PEPC genes in orchids. Gene expression levels (FPKM) were normalized by log2 scale. (A) A. shenzhenica; (B) D. catenatum; (C) V. planifolia, mesocarp, placental, and hairs in three months pod; (D) Ph. aphrodite, flower bud: 2.5 cm, stalk: 1.5–3 cm.
Ijms 25 02055 g007
Figure 8. RT-qPCR analysis of three DcPEPCs genes in D. catenatum in different tissues (stem, leaf, and root). Error bars indicate the SD of three biological replicates.
Ijms 25 02055 g008
Table 1. Information of PEPC homologs in 15 orchid genomes and A. thaliana.
Gene Name aGene IDIntronAmino Acid Number
(aa)
Molecular Weight (kDa)Theoretical Isoelectric PointGrand Average of HydrophobicitySubcellular Localization
AsPEPC3Ash0068779968110.685.71−0.405Cytoplasm
AsPEPC2Ash0030909961109.326.28−0.375Cytoplasm
CePEPC3JL0015839965110.365.78−0.379Cytoplasm
CePEPC1JL0087099964109.906.04−0.374Cytoplasm
CePEPC2JL007930111076122.436.33−0.349Cytoplasm
CgPEPC1GL0104110960109.576.30−0.399Cytoplasm
CsPEPC2Mol0089669958108.956.10−0.336Cytoplasm
CsPEPC3Mol012516886599.016.17−0.381Cytoplasm
CsPEPC1Mol013879883495.426.46−0.354Cytoplasm
DcPEPC3Dca0196089965110.145.81−0.402Cytoplasm
DcPEPC1Dca0108789964109.856.00−0.390Cytoplasm
DcPEPC2Dca0003449920105.125.85−0.361Cytoplasm
DePEPC3Maker1138069965110.215.76−0.411Cytoplasm
DePEPC1Maker105367101032117.696.64−0.328Cytoplasm
DhPEPC1Dhu0000146449976111.335.98−0.374Cytoplasm
DhPEPC2Dhu0000252819949108.385.91−0.368Cytoplasm
DnPEPC3cds-KAI0522578.19965110.225.75−0.392Cytoplasm
DnPEPC2cds-KAI0516232.19965110.065.93−0.356Cytoplasm
DnPEPC1cds-KAI0492914.19965110.046.16−0.399Cytoplasm
GePEPC1Gel0079549965109.946.04−0.375Cytoplasm
GePEPC3Gel0114789965110.236.05−0.385Cytoplasm
GmPEPC3Gme.evm.model.scaffold_67.2199965110.346.12−0.396Cytoplasm
GmPEPC1Gme.evm.model.scaffold_80.689965109.896.02−0.361Cytoplasm
PaPEPC3PAXXG242960-mRNA19965109.915.82−0.376Cytoplasm
PaPEPC1PAXXG121890-mRNA19953108.395.97−0.371Cytoplasm
PePEPC3Peq0069049965110.035.82−0.377Cytoplasm
PePEPC1Peq0057479953108.356.00−0.356Cytoplasm
PgPEPC3PGU0054969965109.905.71−0.361Cytoplasm
PzPEPC1PZI0195299974111.015.91−0.348Cytoplasm
PzPEPC3PZI023524884295.595.95−0.359Cytoplasm
VpPEPC2Vpla_KAG0455466.19965109.766.02−0.358Cytoplasm
VpPEPC3Vpla_KAG0489408.110982112.666.25−0.433Cytoplasm
VpPEPC4Vpla_KAG0480734.1191049118.096.23−0.350Cytoplasm
AtPEPC1AT1G53310.19967110.295.72−0.391Cytoplasm
AtPEPC2AT2G42600.19963109.755.57−0.387Cytoplasm
AtPEPC3AT3G14940.19968110.165.73−0.389Cytoplasm
AtPEPC4AT1G68750.1191032116.596.68−0.419Cytoplasm
a As, A. shenzhenica; Ce, C. ensifolium; Cg, C. goeringii; Cs, C. sinense; Dc, D. catenatum; De, D. chrysotoxum; Dh, D. huoshanense; Dn, D. nobile; Ge, G. elata; Gm, G. menghaiensis; Pa, Ph aphrodite; Pe, Ph. equestris; Pg, Pl guangdongensis; Pz, Pl. zijinensis; Vp, V. planifolia.
Disclaimer/Publisher’s Note: The statements, opinions and data contained in all publications are solely those of the individual author(s) and contributor(s) and not of MDPI and/or the editor(s). MDPI and/or the editor(s) disclaim responsibility for any injury to people or property resulting from any ideas, methods, instructions or products referred to in the content.

