
Supplemented Infant Formula and Human Breast Milk Show Similar Patterns in Modulating Infant Microbiota Composition and Function In Vitro


Abstract
1. Introduction
2. Results
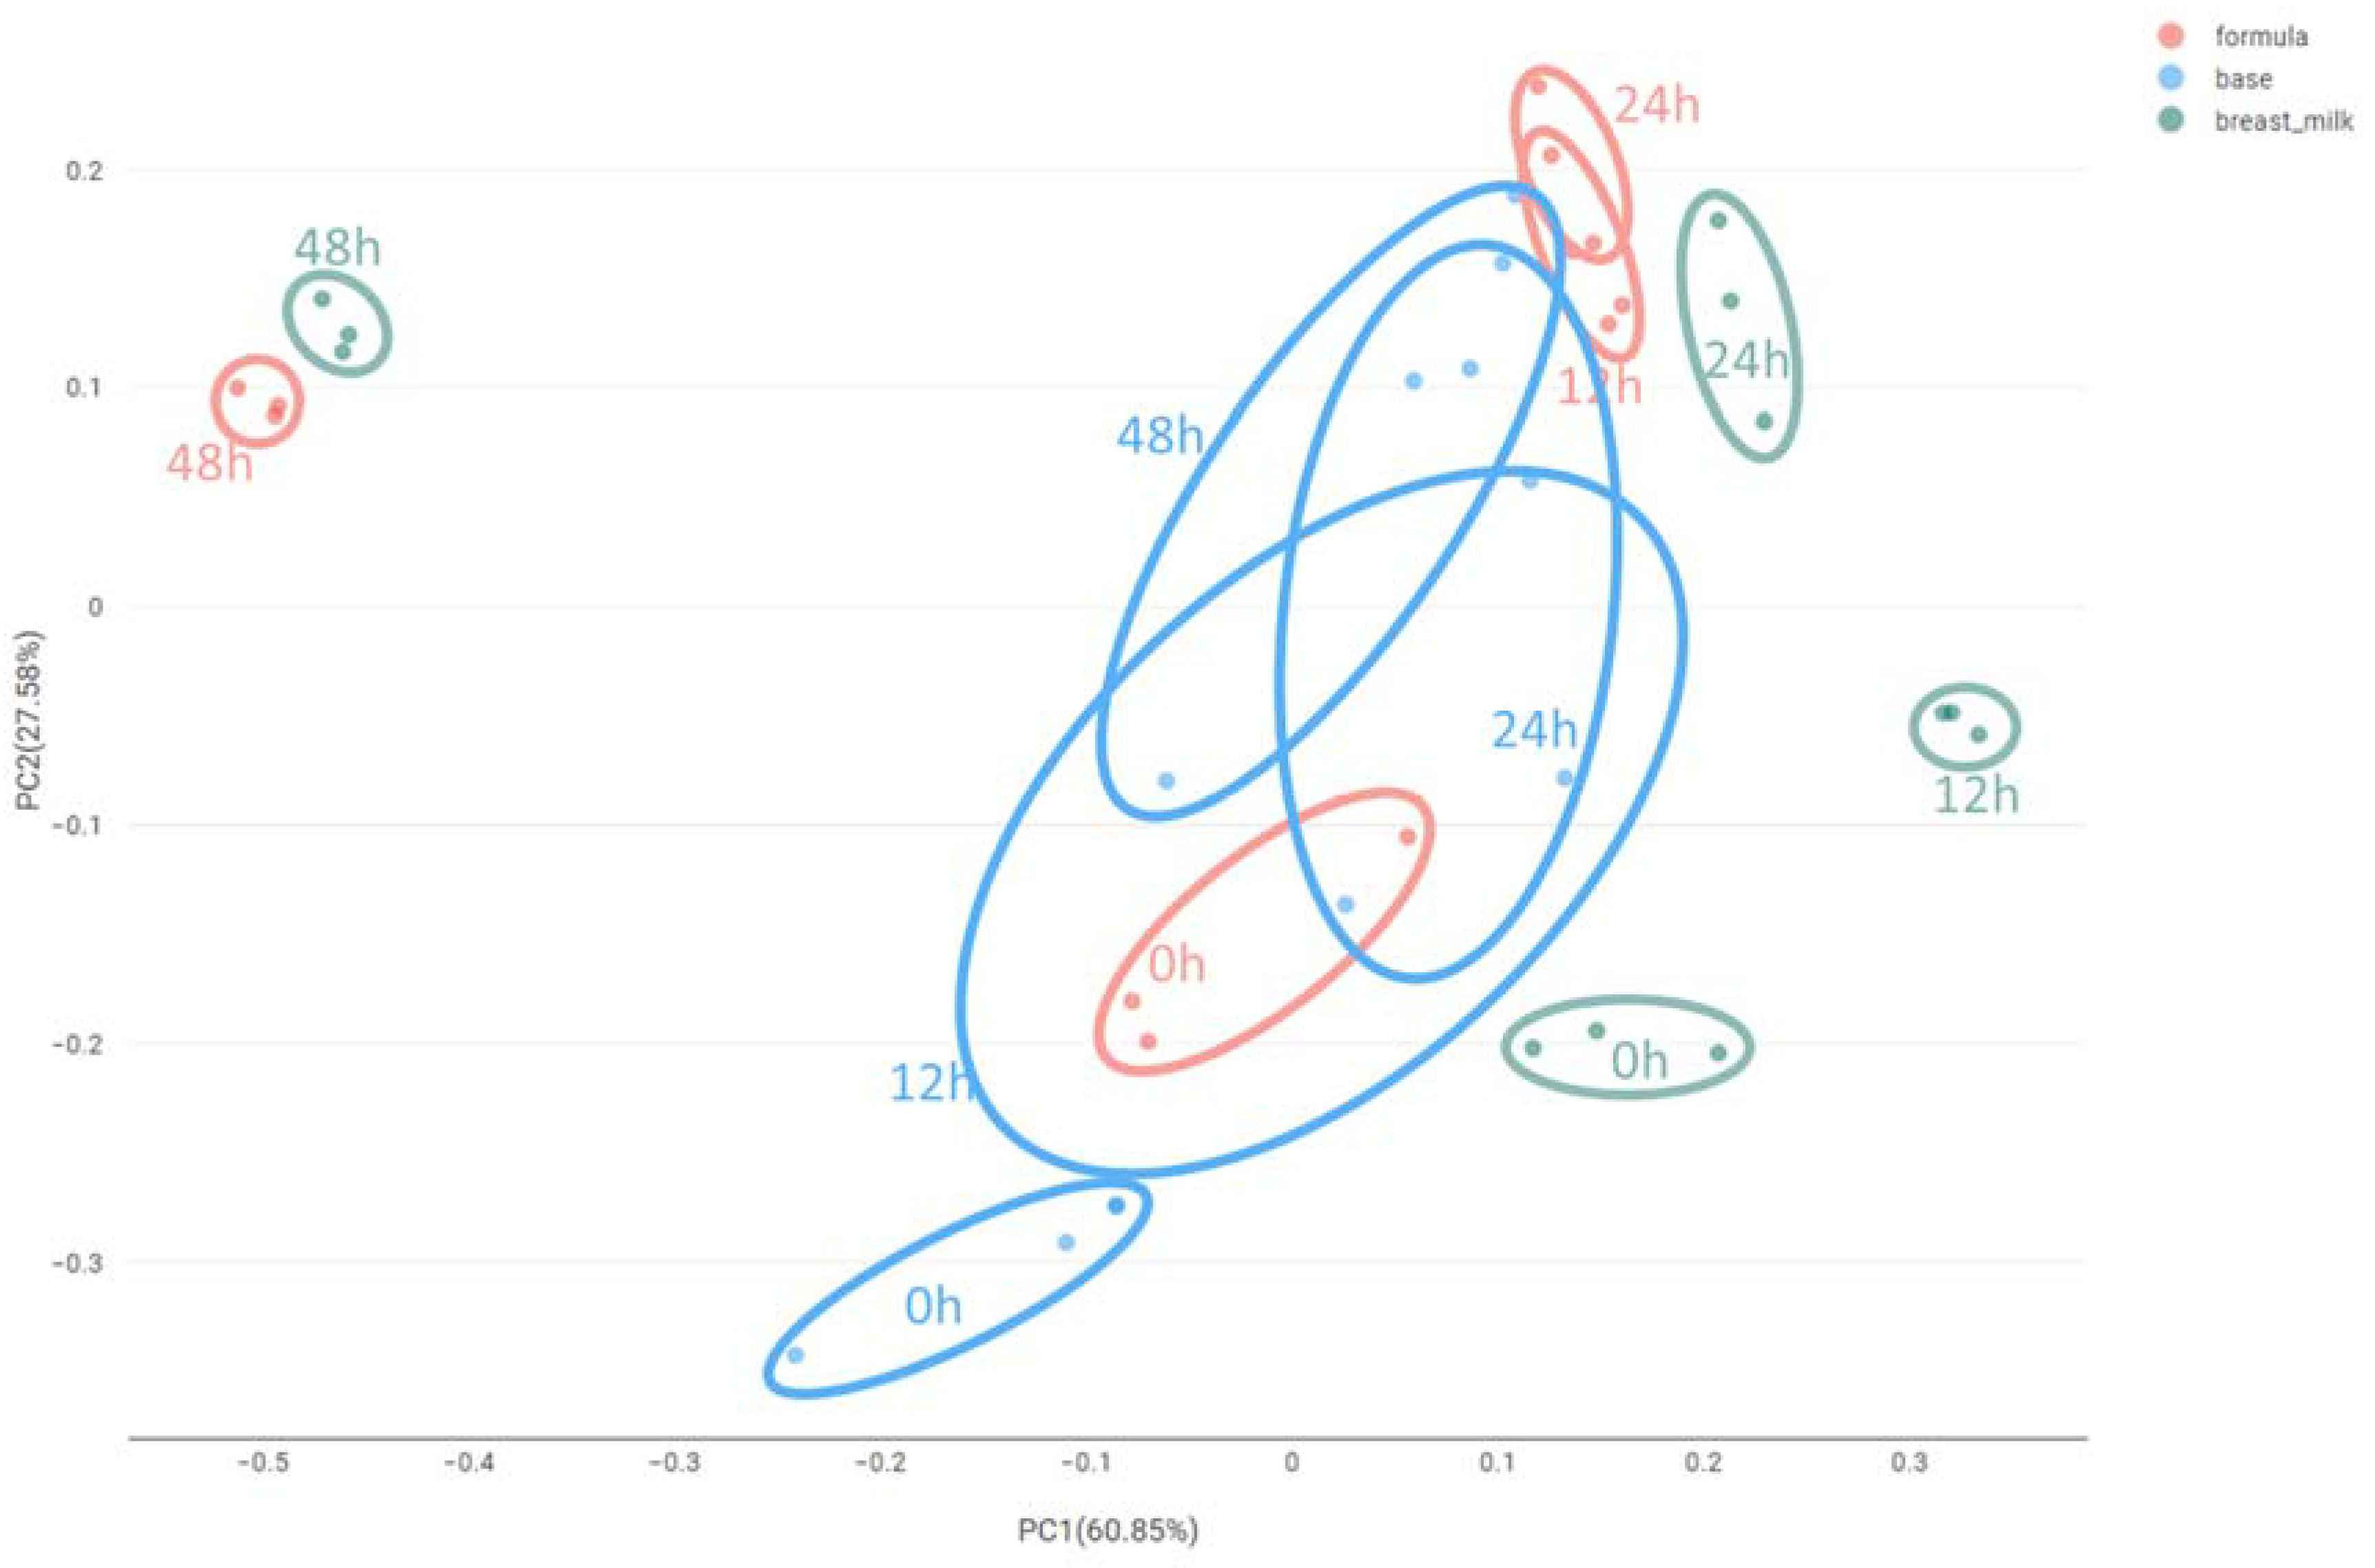
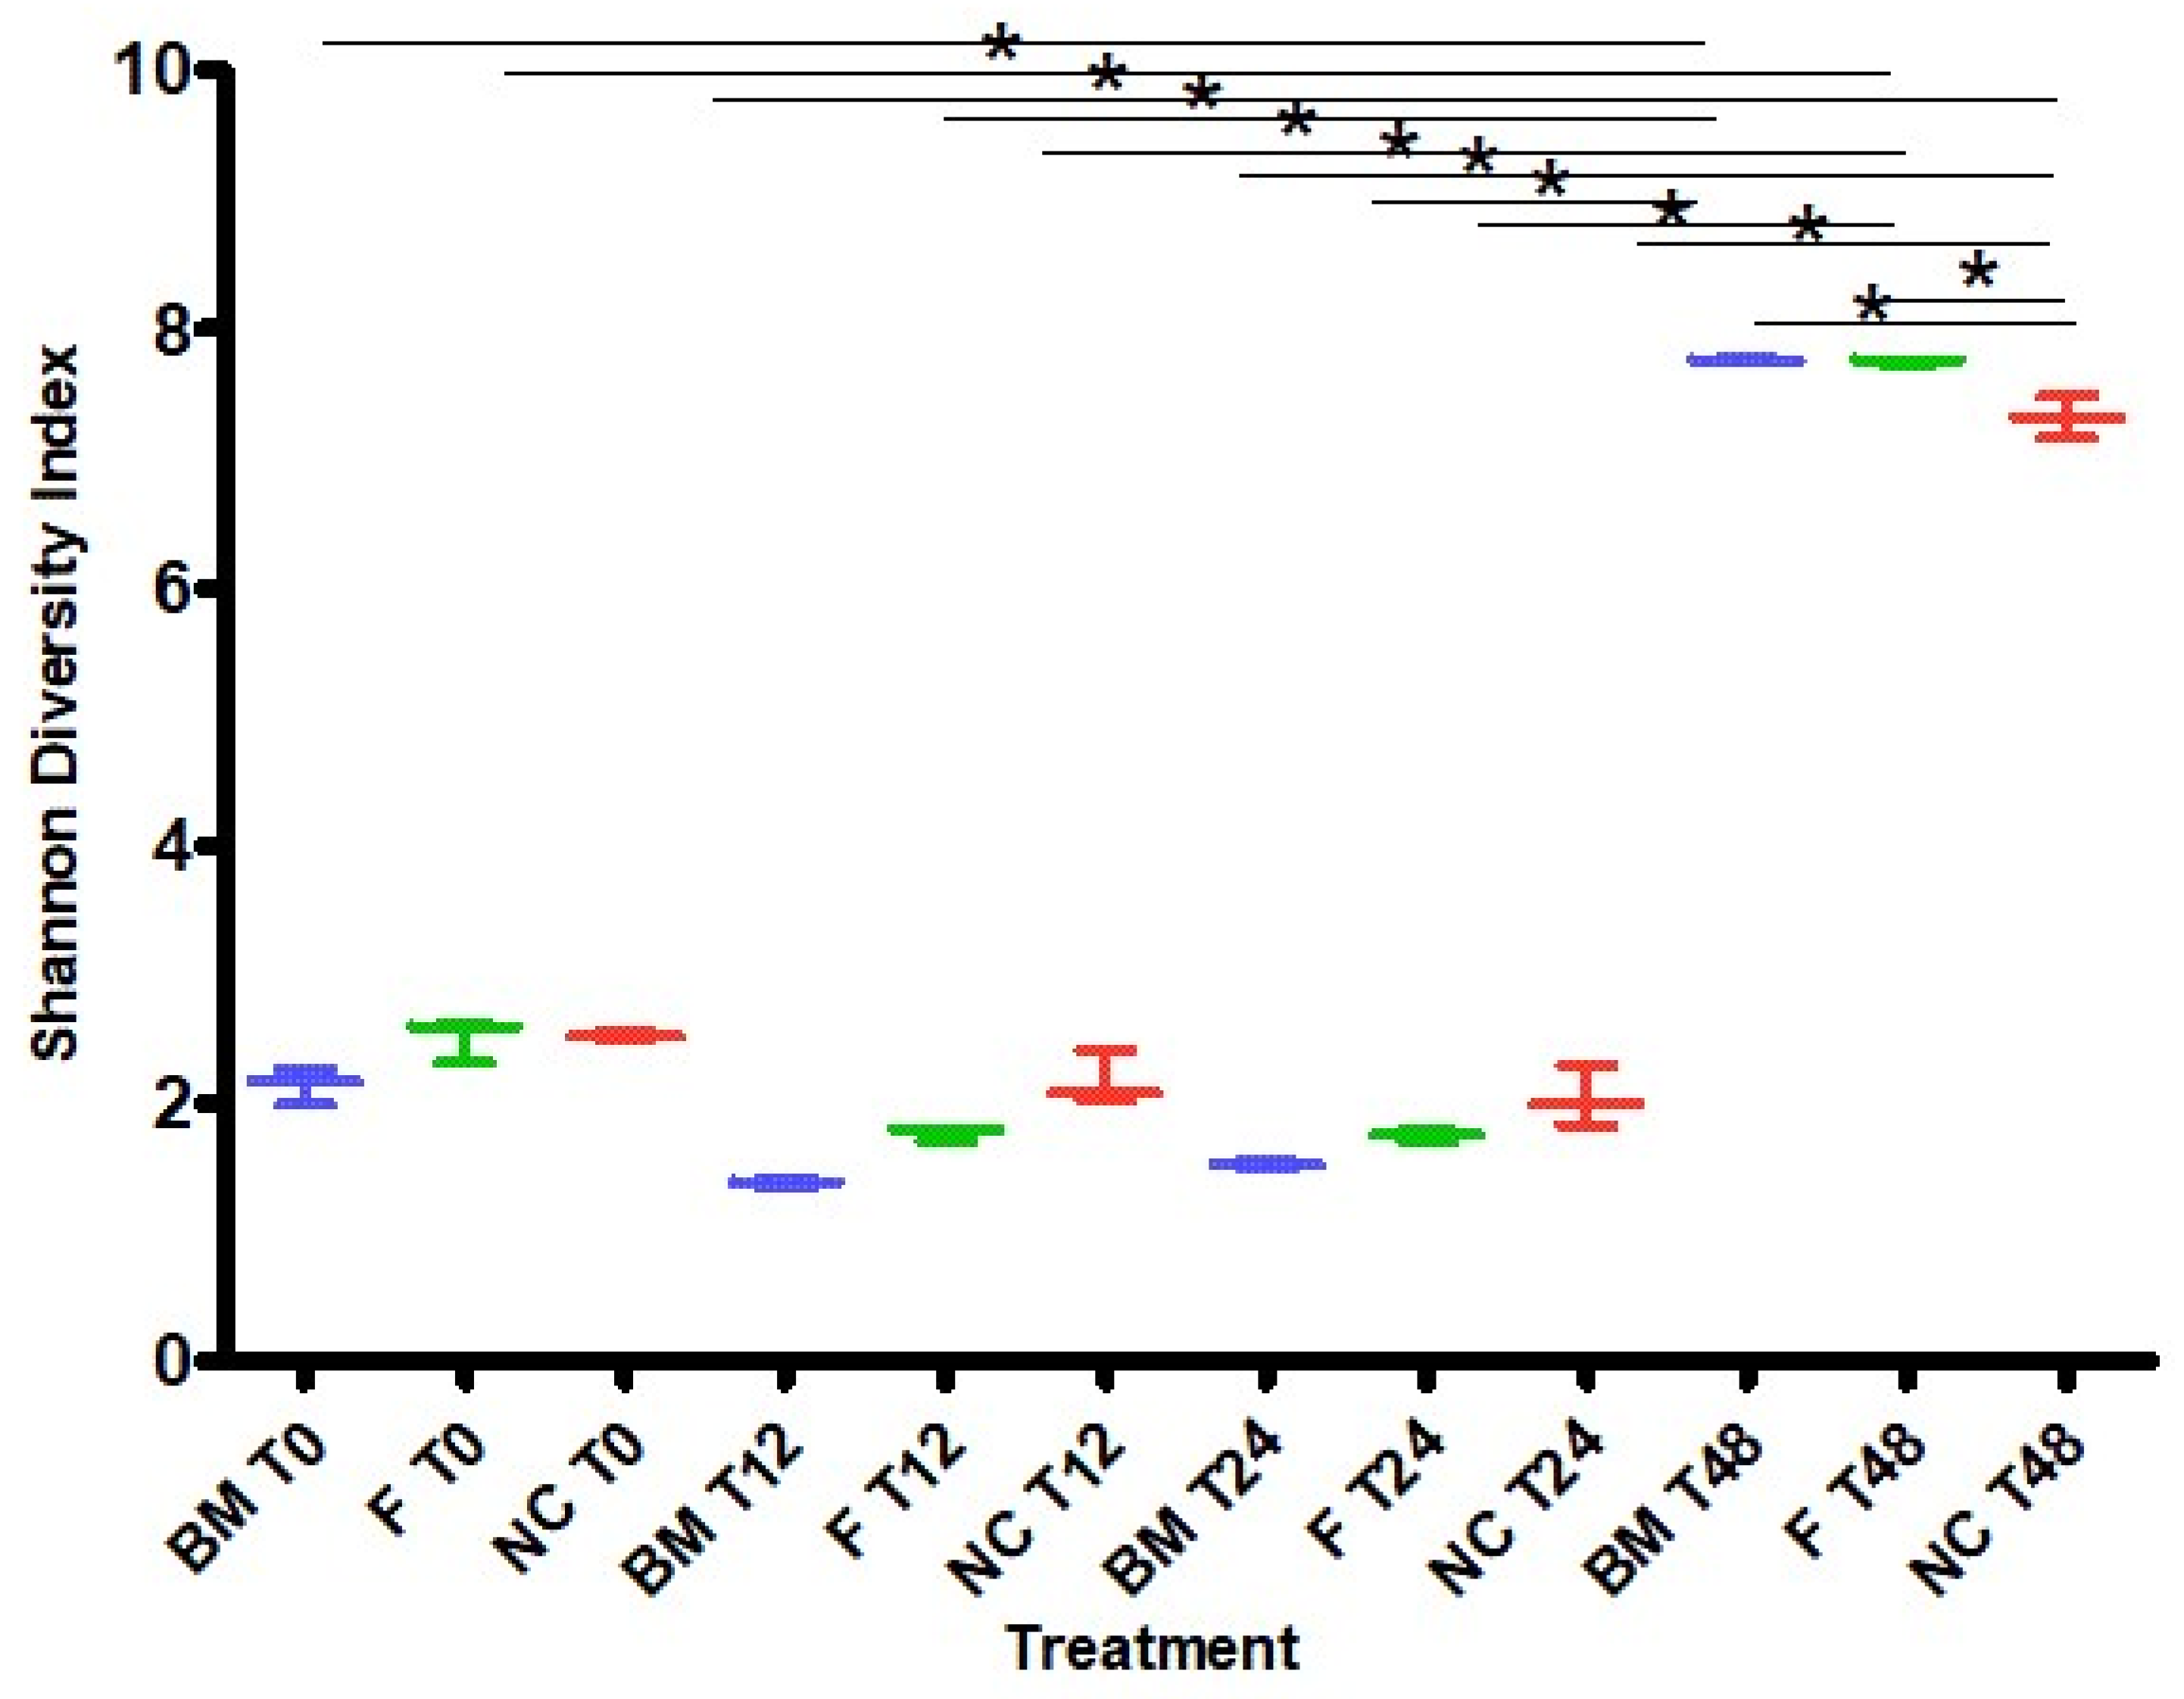
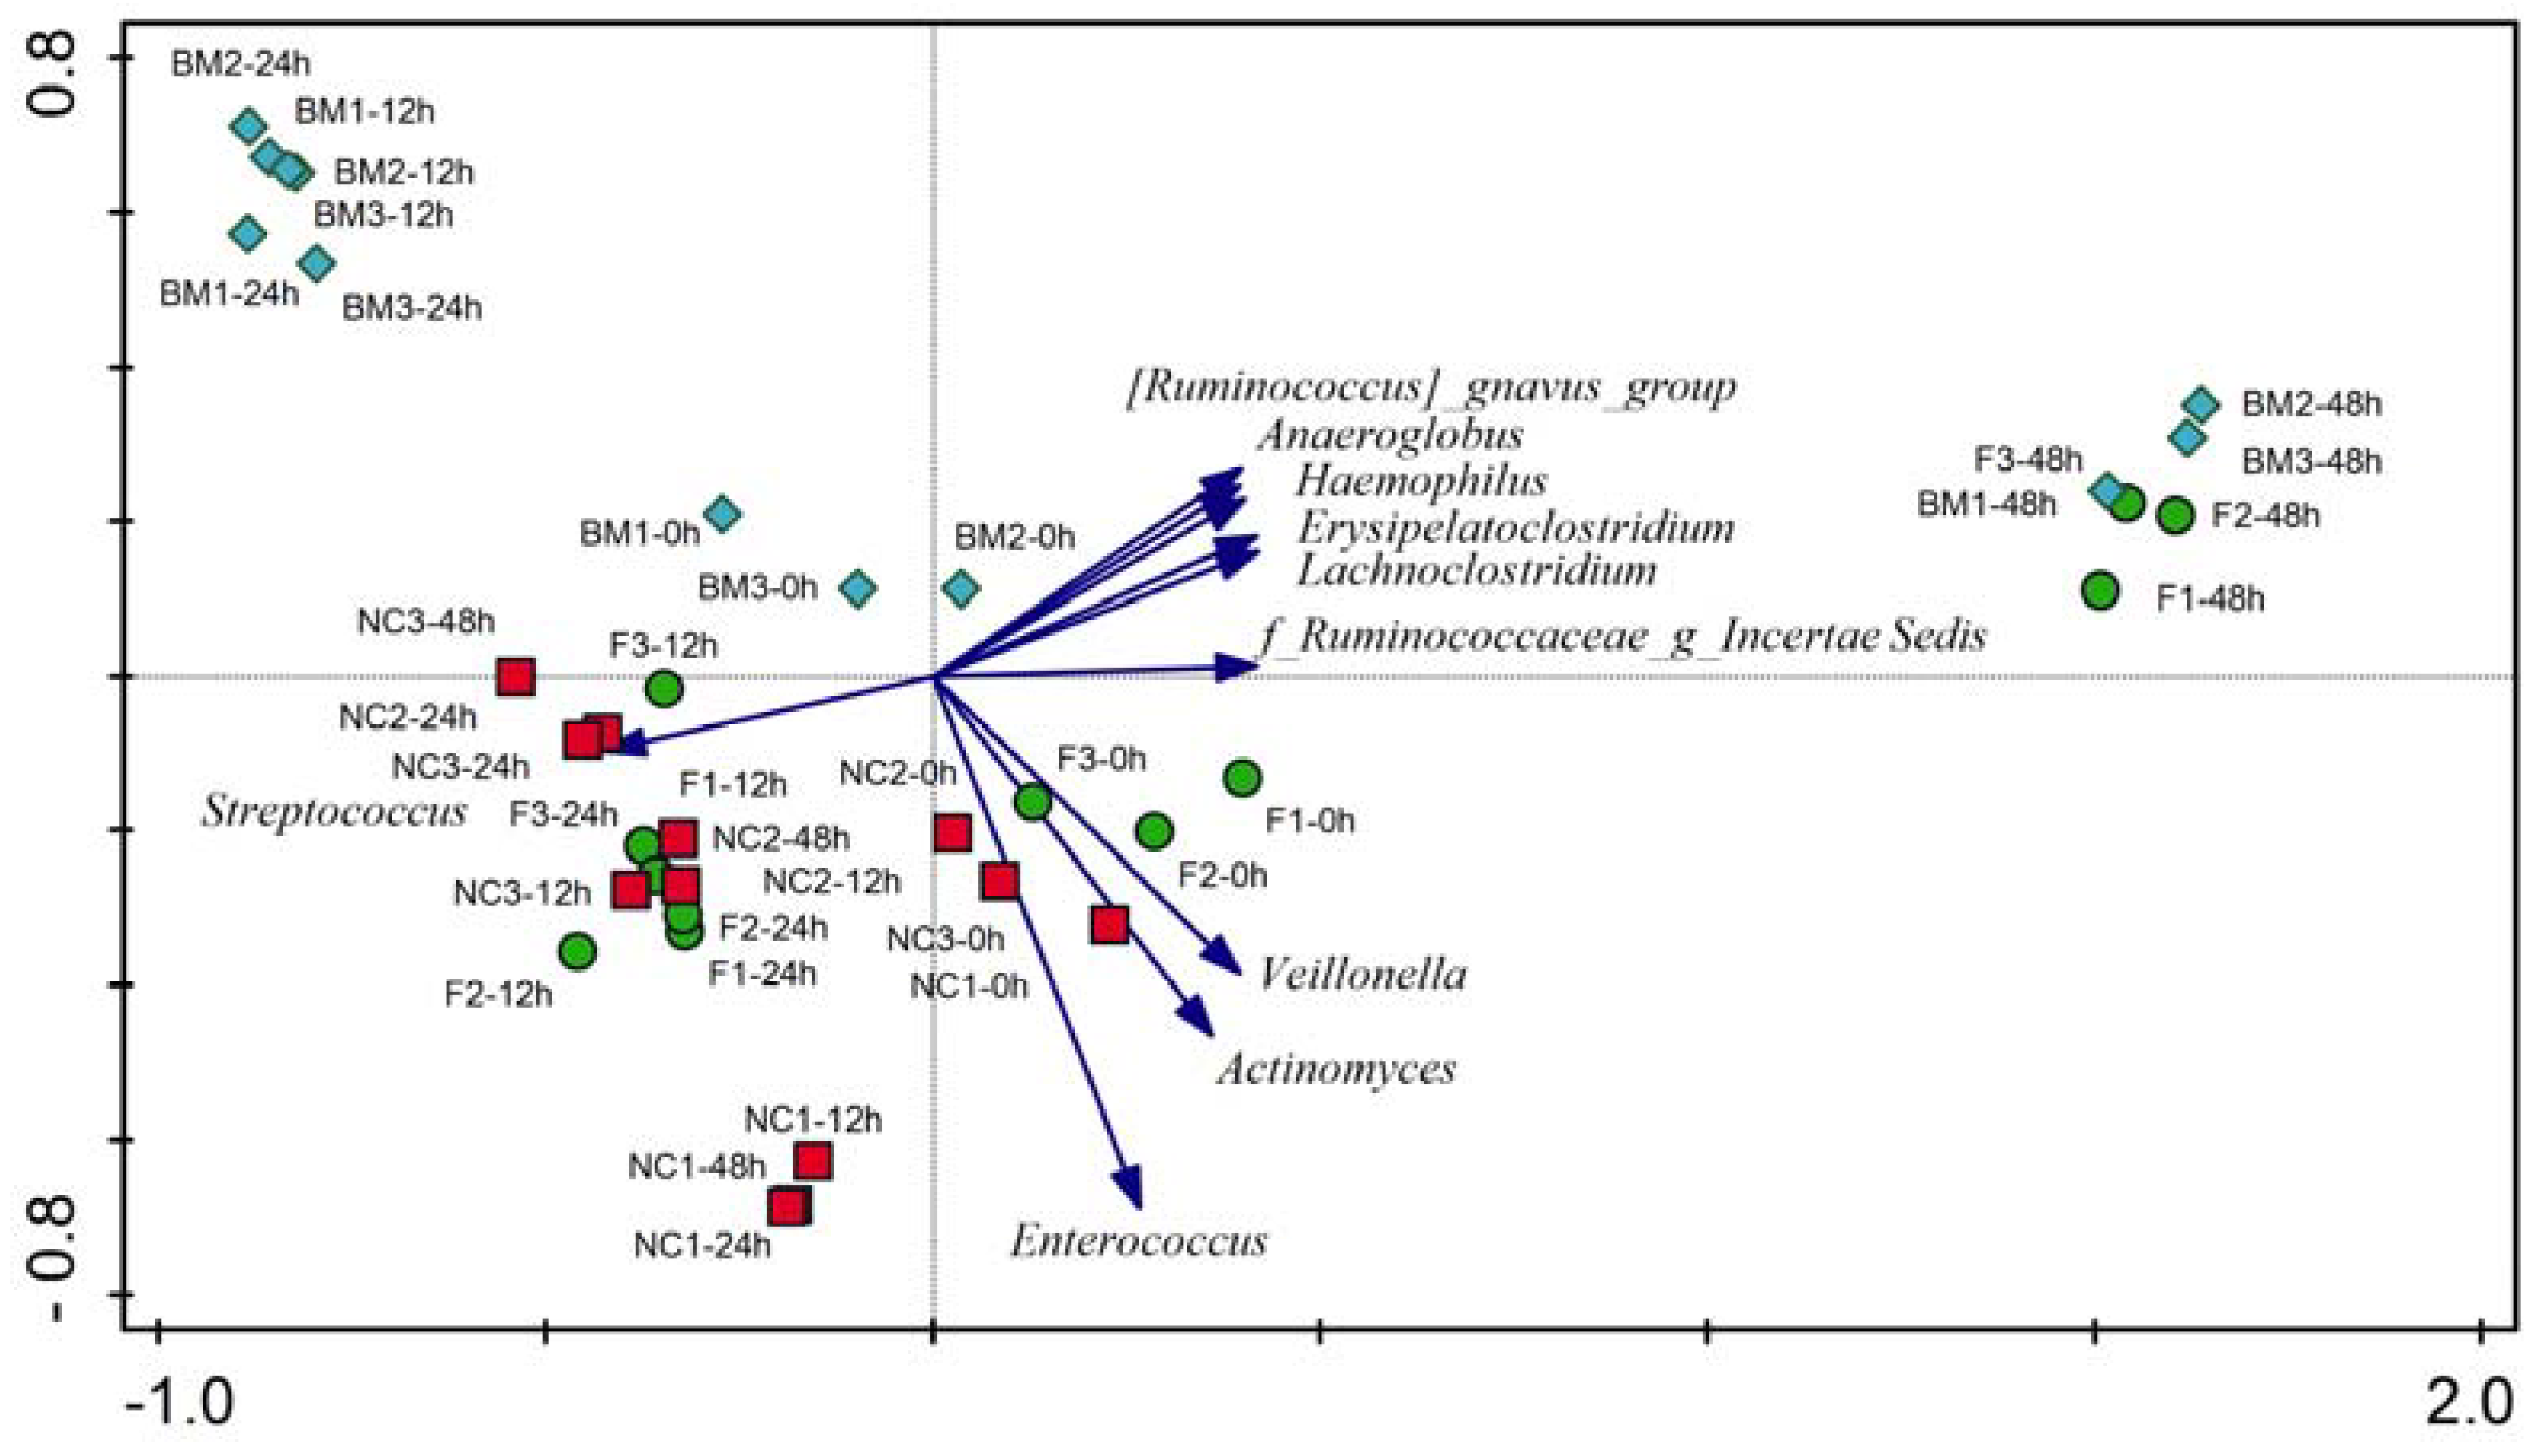
2.1. High-Throughput Sequencing
2.2. qPCR Using Bifidobacterium spp. Specific Primers
2.3. Short-Chain Fatty Acid Analysis
3. Discussion
3.1. Batch Culture Fermentations
3.2. Microbiota Variation during Fermentation
3.3. Short-Chain Fatty Acid Analysis
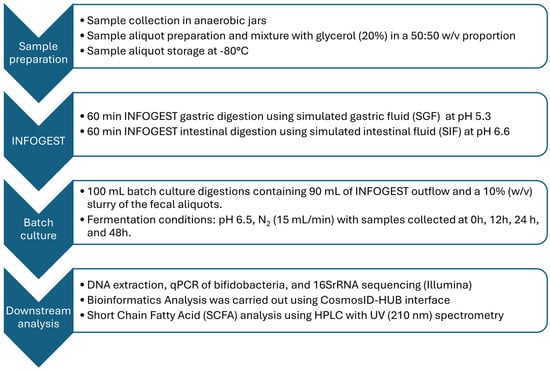
4. Materials and Methods
4.1. INFOGEST Digestion
4.2. Batch Culture
4.3. High-Throughput Sequencing
4.4. qPCR Using Bifidobacterium spp. Specific Primers
4.5. Short-Chain Fatty Acid Analysis
5. Conclusions
Supplementary Materials
Author Contributions
Funding
Institutional Review Board Statement
Informed Consent Statement
Data Availability Statement
Acknowledgments
Conflicts of Interest
References
- Ballard, O.; Morrow, A.L. Human milk composition: Nutrients and bioactive factors. Pediatr. Clin. N. Am. 2013, 60, 49–74. [Google Scholar] [CrossRef]
- WHO. Infant and Young Child Nutrition—Global Strategy on Infant and Young Child Feeding; WHO: Geneva, Switzerland, 2023.
- Young, B. Variation in Infant Formula Macronutrient Ingredients Is Associated with Infant Anthropometrics. Nutrients 2020, 12, 3465. [Google Scholar] [CrossRef]
- Carr, L.E.; Virmani, M.D.; Rosa, F.; Munblit, D.; Matazel, K.S.; Elolimy, A.A.; Yeruva, L. Role of Human Milk Bioactives on Infants’ Gut and Immune Health. Front. Immunol. 2021, 12, 604080. [Google Scholar] [CrossRef]
- De Almagro García, M.C.; Moreno Muñoz, J.A.; Jiménez López, J.; Rodríguez-Palmero Seuma, M. New ingredients in infant formula. Health and functional benefits. Nutr. Hosp. 2017, 34 (Suppl. 4), 8–12. [Google Scholar]
- Bakshi, S.; Paswan, V.K.; Yadav, S.P.; Bhinchhar, B.K.; Kharkwal, S.; Rose, H.; Kanetkar, P.; Kumar, V.; Al-Zamani, Z.A.S.; Bunkar, D.S. A comprehensive review on infant formula: Nutritional and functional constituents, recent trends in processing and its impact on infants’ gut microbiota. Front. Nutr. 2023, 10, 1194679. [Google Scholar] [CrossRef]
- Hedrick, J.; Yeiser, M.; Harris, C.L.; Wampler, J.L.; London, H.E.; Patterson, A.C.; Wu, S.S. Infant Formula with Added Bovine Milk Fat Globule Membrane and Modified Iron Supports Growth and Normal Iron Status at One Year of Age: A Randomized Controlled Trial. Nutrients 2021, 13, 4541. [Google Scholar] [CrossRef] [PubMed]
- Yang, I.; Corwin, E.J.; Brennan, P.A.; Jordan, S.; Murphy, J.R.; Dunlop, A. The Infant Microbiome: Implications for Infant Health and Neurocognitive Development. Nurs. Res. 2016, 65, 76–88. [Google Scholar] [CrossRef] [PubMed]
- Iacob, S.; Iacob, D.G.; Luminos, L.M. Intestinal Microbiota as a Host Defense Mechanism to Infectious Threats. Front. Microbiol. 2018, 9, 3328. [Google Scholar] [CrossRef] [PubMed]
- Cheng, X.; Zheng, J.; Lin, A.; Xia, H.; Zhang, Z.; Gao, Q.; Lv, W.; Liu, H. A review: Roles of carbohydrates in human diseases through regulation of imbalanced intestinal microbiota. J. Funct. Foods 2020, 74, 104197. [Google Scholar] [CrossRef]
- Moraes-Pinto, M.I.; Suano-Souza, F.; Aranda, C.S. Immune system: Development and acquisition of immunological competence. J. Pediatr. 2021, 97 (Suppl. 1), S59–S66. [Google Scholar] [CrossRef] [PubMed]
- Cho, S.; Samuel, T.M.; Li, T.; Howell, B.R.; Baluyot, K.; Hazlett, H.C.; Elison, J.T.; Zhu, H.; Hauser, J.; Sprenger, N.; et al. Interactions between Bifidobacterium and Bacteroides and human milk oligosaccharides and their associations with infant cognition. Front. Nutr. 2023, 10, 1216327. [Google Scholar] [CrossRef]
- Stuivenberg, G.A.; Burton, J.P.; Bron, P.A.; Reid, G. Why Are Bifidobacteria Important for Infants? Microorganisms 2022, 10, 278. [Google Scholar] [CrossRef] [PubMed]
- John, P.; Carel, T.; Piet, A.v.d.B.; Ischa, K.; Bianca, S.; Foekje, S.; Hanne, A.; Ronald van, R.; Ellen, E.S. Gut microbiota composition and development of atopic manifestations in infancy: The KOALA Birth Cohort Study. Gut 2007, 56, 661. [Google Scholar]
- Lee, S.H.; Gong, Y.N.; Ryoo, E. Clostridium difficile colonization and/or infection during infancy and the risk of childhood allergic diseases. Korean J. Pediatr. 2017, 60, 145–150. [Google Scholar] [CrossRef] [PubMed]
- Boss, M.; Gardner, H.; Hartmann, P. Normal Human Lactation: Closing the gap. F1000Res 2018, 7, 801. [Google Scholar] [CrossRef] [PubMed]
- Jiang, B.; Xia, Y.; Zhou, L.; Liang, X.; Chen, X.; Chen, M.; Li, X.; Lin, S.; Zhang, N.; Zheng, L.; et al. Safety and tolerance assessment of milk fat globule membrane-enriched infant formulas in healthy term Chinese infants: A randomised multicenter controlled trial. BMC Pediatr. 2022, 22, 465. [Google Scholar] [CrossRef] [PubMed]
- Quast, C.; Pruesse, E.; Yilmaz, P.; Gerken, J.; Schweer, T.; Yarza, P.; Peplies, J.; Glöckner, F.O. The SILVA ribosomal RNA gene database project: Improved data processing and web-based tools. Nucleic Acids Res. 2012, 41, D590–D596. [Google Scholar] [CrossRef] [PubMed]
- Cammarota, G.; Ianiro, G.; Tilg, H.; Rajilić-Stojanović, M.; Kump, P.; Satokari, R.; Sokol, H.; Arkkila, P.; Pintus, C.; Hart, A.; et al. European consensus conference on faecal microbiota transplantation in clinical practice. Gut 2017, 66, 569–580. [Google Scholar] [CrossRef] [PubMed]
- Raspini, B.; Vacca, M.; Porri, D.; De Giuseppe, R.; Calabrese, F.M.; Chieppa, M.; Liso, M.; Cerbo, R.M.; Civardi, E.; Garofoli, F.; et al. Early Life Microbiota Colonization at Six Months of Age: A Transitional Time Point. Front. Cell. Infect. Microbiol. 2021, 11, 590202. [Google Scholar] [CrossRef]
- Reygner, J.; Charrueau, C.; Delannoy, J.; Mayeur, C.; Robert, V.; Cuinat, C.; Meylheuc, T.; Mauras, A.; Augustin, J.; Nicolis, I.; et al. Freeze-dried fecal samples are biologically active after long-lasting storage and suited to fecal microbiota transplantation in a preclinical murine model of Clostridioides difficile infection. Gut Microbes 2020, 11, 1405–1422. [Google Scholar] [CrossRef]
- Aguirre, M.; Ramiro-Garcia, J.; Koenen, M.E.; Venema, K. To pool or not to pool? Impact of the use of individual and pooled fecal samples for in vitro fermentation studies. J. Microbiol. Methods 2014, 107, 1–7. [Google Scholar] [CrossRef]
- de Carvalho, N.M.; Oliveira, D.L.; Dib Saleh, M.A.; Pintado, M.; Madureira, A.R. Preservation of Human Gut Microbiota Inoculums for In Vitro Fermentations Studies. Fermentation 2021, 7, 14. [Google Scholar] [CrossRef]
- Tamburini, S.; Shen, N.; Wu, H.C.; Clemente, J.C. The microbiome in early life: Implications for health outcomes. Nat. Med. 2016, 22, 713–722. [Google Scholar] [CrossRef] [PubMed]
- Shao, Y.; Forster, S.C.; Tsaliki, E.; Vervier, K.; Strang, A.; Simpson, N.; Kumar, N.; Stares, M.D.; Rodger, A.; Brocklehurst, P.; et al. Stunted microbiota and opportunistic pathogen colonization in caesarean-section birth. Nature 2019, 574, 117–121. [Google Scholar] [CrossRef] [PubMed]
- Coles, L.T.; Moughan, P.J.; Darragh, A.J. In vitro digestion and fermentation methods, including gas production techniques, as applied to nutritive evaluation of foods in the hindgut of humans and other simple-stomached animals. Anim. Feed Sci. Technol. 2005, 123–124, 421–444. [Google Scholar] [CrossRef]
- Underwood, M.A.; German, J.B.; Lebrilla, C.B.; Mills, D.A. Bifidobacterium longum subspecies infantis: Champion colonizer of the infant gut. Pediatr. Res. 2015, 77, 229–235. [Google Scholar] [CrossRef] [PubMed]
- Rivas-Serna, I.M.; Polakowski, R.; Shoemaker, G.K.; Mazurak, V.C.; Clandinin, M.T. Profiling gangliosides from milk products and other biological membranes using LC/MS. J. Food Compos. Anal. 2015, 44, 45–55. [Google Scholar] [CrossRef]
- He, X.; Parenti, M.; Grip, T.; Lönnerdal, B.; Timby, N.; Domellöf, M.; Hernell, O.; Slupsky, C.M. Fecal microbiome and metabolome of infants fed bovine MFGM supplemented formula or standard formula with breast-fed infants as reference: A randomized controlled trial. Sci. Rep. 2019, 9, 11589. [Google Scholar] [CrossRef]
- Ben, X.M.; Li, J.; Feng, Z.T.; Shi, S.Y.; Lu, Y.D.; Chen, R.; Zhou, X.Y. Low level of galacto-oligosaccharide in infant formula stimulates growth of intestinal Bifidobacteria and Lactobacilli. World J. Gastroenterol. 2008, 14, 6564–6568. [Google Scholar] [CrossRef]
- Fanaro, S.; Marten, B.; Bagna, R.; Vigi, V.; Fabris, C.; Peña-Quintana, L.; Argüelles, F.; Scholz-Ahrens, K.E.; Sawatzki, G.; Zelenka, R.; et al. Galacto-oligosaccharides are bifidogenic and safe at weaning: A double-blind randomized multicenter study. J. Pediatr. Gastroenterol. Nutr. 2009, 48, 82–88. [Google Scholar] [CrossRef]
- Jie, Z.; Bang-Yao, L.; Ming-Jie, X.; Hai-Wei, L.; Zu-Kang, Z.; Ting-Song, W.; Craig, S.A. Studies on the effects of polydextrose intake on physiologic functions in Chinese people. Am. J. Clin. Nutr. 2000, 72, 1503–1509. [Google Scholar] [CrossRef] [PubMed]
- Scalabrin, D.M.; Mitmesser, S.H.; Welling, G.W.; Harris, C.L.; Marunycz, J.D.; Walker, D.C.; Bos, N.A.; Tölkkö, S.; Salminen, S.; Vanderhoof, J.A. New prebiotic blend of polydextrose and galacto-oligosaccharides has a bifidogenic effect in young infants. J. Pediatr. Gastroenterol. Nutr. 2012, 54, 343–352. [Google Scholar] [CrossRef] [PubMed]
- Zhao, J.; Yi, W.; Liu, B.; Dai, Y.; Jiang, T.; Chen, S.; Wang, J.; Feng, B.; Qiao, W.; Liu, Y.; et al. MFGM components promote gut Bifidobacterium growth in infant and in vitro. Eur. J. Nutr. 2022, 61, 277–288. [Google Scholar] [CrossRef] [PubMed]
- Jungersen, M.; Wind, A.; Johansen, E.; Christensen, J.E.; Stuer-Lauridsen, B.; Eskesen, D. The Science behind the Probiotic Strain Bifidobacterium animalis subsp. lactis BB-12®. Microorganisms 2014, 2, 92–110. [Google Scholar] [CrossRef] [PubMed]
- Xi, M.; Na, X.; Ma, X.; Lan, H.; Sun, T.; Liu, W.-H.; Hung, W.; Zhao, A. Maternal diet associated with infants’ intestinal microbiota mediated by predominant long-chain fatty acid in breast milk. Front. Microbiol. 2023, 13, 1004175. [Google Scholar] [CrossRef] [PubMed]
- Jiang, T.; Liu, B.; Li, J.; Dong, X.; Lin, M.; Zhang, M.; Zhao, J.; Dai, Y.; Chen, L. Association between sn-2 fatty acid profiles of breast milk and development of the infant intestinal microbiome. Food Funct. 2018, 9, 1028–1037. [Google Scholar] [CrossRef]
- Lackey, K.A.; Williams, J.E.; Meehan, C.L.; Zachek, J.A.; Benda, E.D.; Price, W.J.; Foster, J.A.; Sellen, D.W.; Kamau-Mbuthia, E.W.; Kamundia, E.W.; et al. What’s Normal? Microbiomes in Human Milk and Infant Feces Are Related to Each Other but Vary Geographically: The INSPIRE Study. Front. Nutr. 2019, 6, 45. [Google Scholar] [CrossRef]
- Kim, S.Y.; Yi, D.Y. Analysis of the human breast milk microbiome and bacterial extracellular vesicles in healthy mothers. Exp. Mol. Med. 2020, 52, 1288–1297. [Google Scholar] [CrossRef]
- Yelverton, C.A.; Killeen, S.L.; Feehily, C.; Moore, R.L.; Callaghan, S.L.; Geraghty, A.A.; Byrne, D.F.; Walsh, C.J.; Lawton, E.M.; Murphy, E.F.; et al. Maternal breastfeeding is associated with offspring microbiome diversity; A secondary analysis of the MicrobeMom randomized control trial. Front. Microbiol. 2023, 14, 1154114. [Google Scholar] [CrossRef]
- Roger, L.C.; Costabile, A.; Holland, D.T.; Hoyles, L.; McCartney, A.L. Examination of faecal Bifidobacterium populations in breast- and formula-fed infants during the first 18 months of life. Microbiology 2010, 156, 3329–3341. [Google Scholar] [CrossRef]
- Chichlowski, M.; van Diepen, J.A.; Prodan, A.; Olga, L.; Ong, K.K.; Kortman, G.A.M.; Dunger, D.B.; Gross, G. Early development of infant gut microbiota in relation to breastfeeding and human milk oligosaccharides. Front. Nutr. 2023, 10, 1003032. [Google Scholar] [CrossRef]
- Csordas, A. Butyrate, aspirin and colorectal cancer. Eur. J. Cancer Prev. 1996, 5, 221–231. [Google Scholar] [CrossRef] [PubMed]
- Tsukuda, N.; Yahagi, K.; Hara, T.; Watanabe, Y.; Matsumoto, H.; Mori, H.; Higashi, K.; Tsuji, H.; Matsumoto, S.; Kurokawa, K.; et al. Key bacterial taxa and metabolic pathways affecting gut short-chain fatty acid profiles in early life. ISME J. 2021, 15, 2574–2590. [Google Scholar] [CrossRef]
- Duncan, S.H.; Louis, P.; Flint, H.J. Lactate-Utilizing Bacteria, Isolated from Human Feces, That Produce Butyrate as a Major Fermentation Product. Appl. Environ. Microbiol. 2004, 70, 5810–5817. [Google Scholar] [CrossRef]
- Bridgman, S.L.; Azad, M.B.; Field, C.J.; Haqq, A.M.; Becker, A.B.; Mandhane, P.J.; Subbarao, P.; Turvey, S.E.; Sears, M.R.; Scott, J.A.; et al. Fecal Short-Chain Fatty Acid Variations by Breastfeeding Status in Infants at 4 Months: Differences in Relative versus Absolute Concentrations. Front. Nutr. 2017, 4, 11. [Google Scholar] [CrossRef] [PubMed]
- Goldberg, I.; Rokem, J. Organic and Fatty Acid Production, Microbial. In Encyclopedia of Microbiology; Elsevier: Amsterdam, The Netherlands, 2009. [Google Scholar]
- Sakata, T.; Kojima, T.; Fujieda, M.; Takahashi, M.; Michibata, T. Influences of probiotic bacteria on organic acid production by pig caecal bacteria in vitro. Proc. Nutr. Soc. 2003, 62, 73–80. [Google Scholar] [CrossRef] [PubMed]
- Macfarlane, S.; Macfarlane, G.T. Regulation of short-chain fatty acid production. Proc. Nutr. Soc. 2003, 62, 67–72. [Google Scholar] [CrossRef]
- Louis, P.; Flint, H.J. Formation of propionate and butyrate by the human colonic microbiota. Environ. Microbiol. 2017, 19, 29–41. [Google Scholar] [CrossRef]
- Wei, Y.-H.; Ma, X.; Zhao, J.-C.; Wang, X.-Q.; Gao, C.-Q. Succinate metabolism and its regulation of host-microbe interactions. Gut Microbes 2023, 15, 2190300. [Google Scholar] [CrossRef]
- Wolin, M.J.; Miller, T.L.; Yerry, S.; Zhang, Y.; Bank, S.; Weaver, G.A. Changes of fermentation pathways of fecal microbial communities associated with a drug treatment that increases dietary starch in the human colon. Appl. Environ. Microbiol. 1999, 65, 2807–2812. [Google Scholar] [CrossRef]
- Łoniewski, I.; Skonieczna-Żydecka, K.; Stachowska, L.; Fraszczyk-Tousty, M.; Tousty, P.; Łoniewska, B. Breastfeeding Affects Concentration of Faecal Short Chain Fatty Acids During the First Year of Life: Results of the Systematic Review and Meta-Analysis. Front. Nutr. 2022, 9, 939194. [Google Scholar] [CrossRef]
- Koletzko, B.; Baker, S.; Cleghorn, G.; Neto, U.F.; Gopalan, S.; Hernell, O.; Hock, Q.S.; Jirapinyo, P.; Lonnerdal, B.; Pencharz, P.; et al. Global standard for the composition of infant formula: Recommendations of an ESPGHAN coordinated international expert group. J. Pediatr. Gastroenterol. Nutr. 2005, 41, 584–599. [Google Scholar] [CrossRef] [PubMed]
- Bourlieu, C.; Ménard, O.; Bouzerzour, K.; Mandalari, G.; Macierzanka, A.; Mackie, A.R.; Dupont, D. Specificity of infant digestive conditions: Some clues for developing relevant in vitro models. Crit. Rev. Food Sci. Nutr. 2014, 54, 1427–1457. [Google Scholar] [CrossRef] [PubMed]
- Minekus, M.; Alminger, M.; Alvito, P.; Ballance, S.; Bohn, T.; Bourlieu, C.; Carrière, F.; Boutrou, R.; Corredig, M.; Dupont, D.; et al. A standardised static in vitro digestion method suitable for food—An international consensus. Food Funct. 2014, 5, 1113–1124. [Google Scholar] [CrossRef]
- Armand, M.; Hamosh, M.; Mehta, N.R.; Angelus, P.A.; Philpott, J.R.; Henderson, T.R.; Dwyer, N.K.; Lairon, D.; Hamosh, P. Effect of human milk or formula on gastric function and fat digestion in the premature infant. Pediatr. Res. 1996, 40, 429–437. [Google Scholar] [CrossRef] [PubMed]
- Roman, C.; Carriere, F.; Villeneuve, P.; Pina, M.; Millet, V.; Simeoni, U.; Sarles, J. Quantitative and qualitative study of gastric lipolysis in premature infants: Do MCT-enriched infant formulas improve fat digestion? Pediatr. Res. 2007, 61, 83–88. [Google Scholar] [CrossRef] [PubMed]
- de Oliveira, S.C.; Bellanger, A.; Menard, O.; Pladys, P.; Le Gouar, Y.; Dirson, E.; Kroell, F.; Dupont, D.; Deglaire, A.; Bourlieu, C. Impact of human milk pasteurization on gastric digestion in preterm infants: A randomized controlled trial. Am. J. Clin. Nutr. 2017, 105, 379–390. [Google Scholar] [CrossRef]
- Roussel, A.; Canaan, S.; Egloff, M.P.; Rivière, M.; Dupuis, L.; Verger, R.; Cambillau, C. Crystal structure of human gastric lipase and model of lysosomal acid lipase, two lipolytic enzymes of medical interest. J. Biol. Chem. 1999, 274, 16995–17002. [Google Scholar] [CrossRef] [PubMed]
- Hyde, G.A. Gastric secretions following neonatal surgery. J. Pediatr. Surg. 1968, 3, 691–695. [Google Scholar] [CrossRef]
- Zoppi, G.; Andreotti, G.; Pajno-Ferrara, F.; Bellini, P.; Gaburro, D. The development of specific responses of the exocrine pancreas to pancreozymin and secretin stimulation in newborn infants. Pediatr. Res. 1973, 7, 198–203. [Google Scholar] [CrossRef]
- Signer, E.; Murphy, G.M.; Edkins, S.; Anderson, C.M. Role of bile salts in fat malabsorption of premature infants. Arch. Dis. Child. 1974, 49, 174–180. [Google Scholar] [CrossRef] [PubMed]
- Norman, A.; Strandvik, B.; Ojamäe, O. Bile acids and pancreatic enzymes during absorption in the newborn. Acta Paediatr. Scand. 1972, 61, 571–576. [Google Scholar] [CrossRef] [PubMed]
- Poquet, L.; Wooster, T.J. Infant digestion physiology and the relevance of in vitro biochemical models to test infant formula lipid digestion. Mol. Nutr. Food Res. 2016, 60, 1876–1895. [Google Scholar] [CrossRef] [PubMed]
- Kleigrewe, K.; Haack, M.; Baudin, M.; Ménabréaz, T.; Crovadore, J.; Masri, M.; Beyrer, M.; Andlauer, W.; Lefort, F.; Dawid, C.; et al. Dietary Modulation of the Human Gut Microbiota and Metabolome with Flaxseed Preparations. Int. J. Mol. Sci. 2022, 23, 10473. [Google Scholar] [CrossRef] [PubMed]
- Herlemann, D.P.; Labrenz, M.; Jürgens, K.; Bertilsson, S.; Waniek, J.J.; Andersson, A.F. Transitions in bacterial communities along the 2000 km salinity gradient of the Baltic Sea. ISME J. 2011, 5, 1571–1579. [Google Scholar] [CrossRef] [PubMed]
- Callahan, B.J.; McMurdie, P.J.; Holmes, S.P. Exact sequence variants should replace operational taxonomic units in marker-gene data analysis. ISME J. 2017, 11, 2639–2643. [Google Scholar] [CrossRef] [PubMed]
- Straub, D.; Blackwell, N.; Langarica-Fuentes, A.; Peltzer, A.; Nahnsen, S.; Kleindienst, S. Interpretations of Environmental Microbial Community Studies Are Biased by the Selected 16S rRNA (Gene) Amplicon Sequencing Pipeline. Front. Microbiol. 2020, 11, 550420. [Google Scholar] [CrossRef]
- Kechin, A.; Boyarskikh, U.; Kel, A.; Filipenko, M. cutPrimers: A New Tool for Accurate Cutting of Primers from Reads of Targeted Next Generation Sequencing. J. Comput. Biol. 2017, 24, 1138–1143. [Google Scholar] [CrossRef]
- Lepš, J.; Šmilauer, P. Multivariate Analysis of Ecological Data using CANOCO; Cambridge University Press: Cambridge, UK, 2003. [Google Scholar]
- Caporaso, J.G.; Kuczynski, J.; Stombaugh, J.; Bittinger, K.; Bushman, F.D.; Costello, E.K.; Fierer, N.; Peña, A.G.; Goodrich, J.K.; Gordon, J.I.; et al. QIIME allows analysis of high-throughput community sequencing data. Nat. Methods 2010, 7, 335–336. [Google Scholar] [CrossRef]
- Rinttilä, T.; Kassinen, A.; Malinen, E.; Krogius, L.; Palva, A. Development of an extensive set of 16S rDNA-targeted primers for quantification of pathogenic and indigenous bacteria in faecal samples by real-time PCR. J. Appl. Microbiol. 2004, 97, 1166–1177. [Google Scholar] [CrossRef]
- Shapiro, S.S.; Wilk, M.B. An Analysis of Variance Test for Normality (Complete Samples). Biometrika 1965, 52, 591–611. [Google Scholar] [CrossRef]


| (a) | ||||||||||||||||||
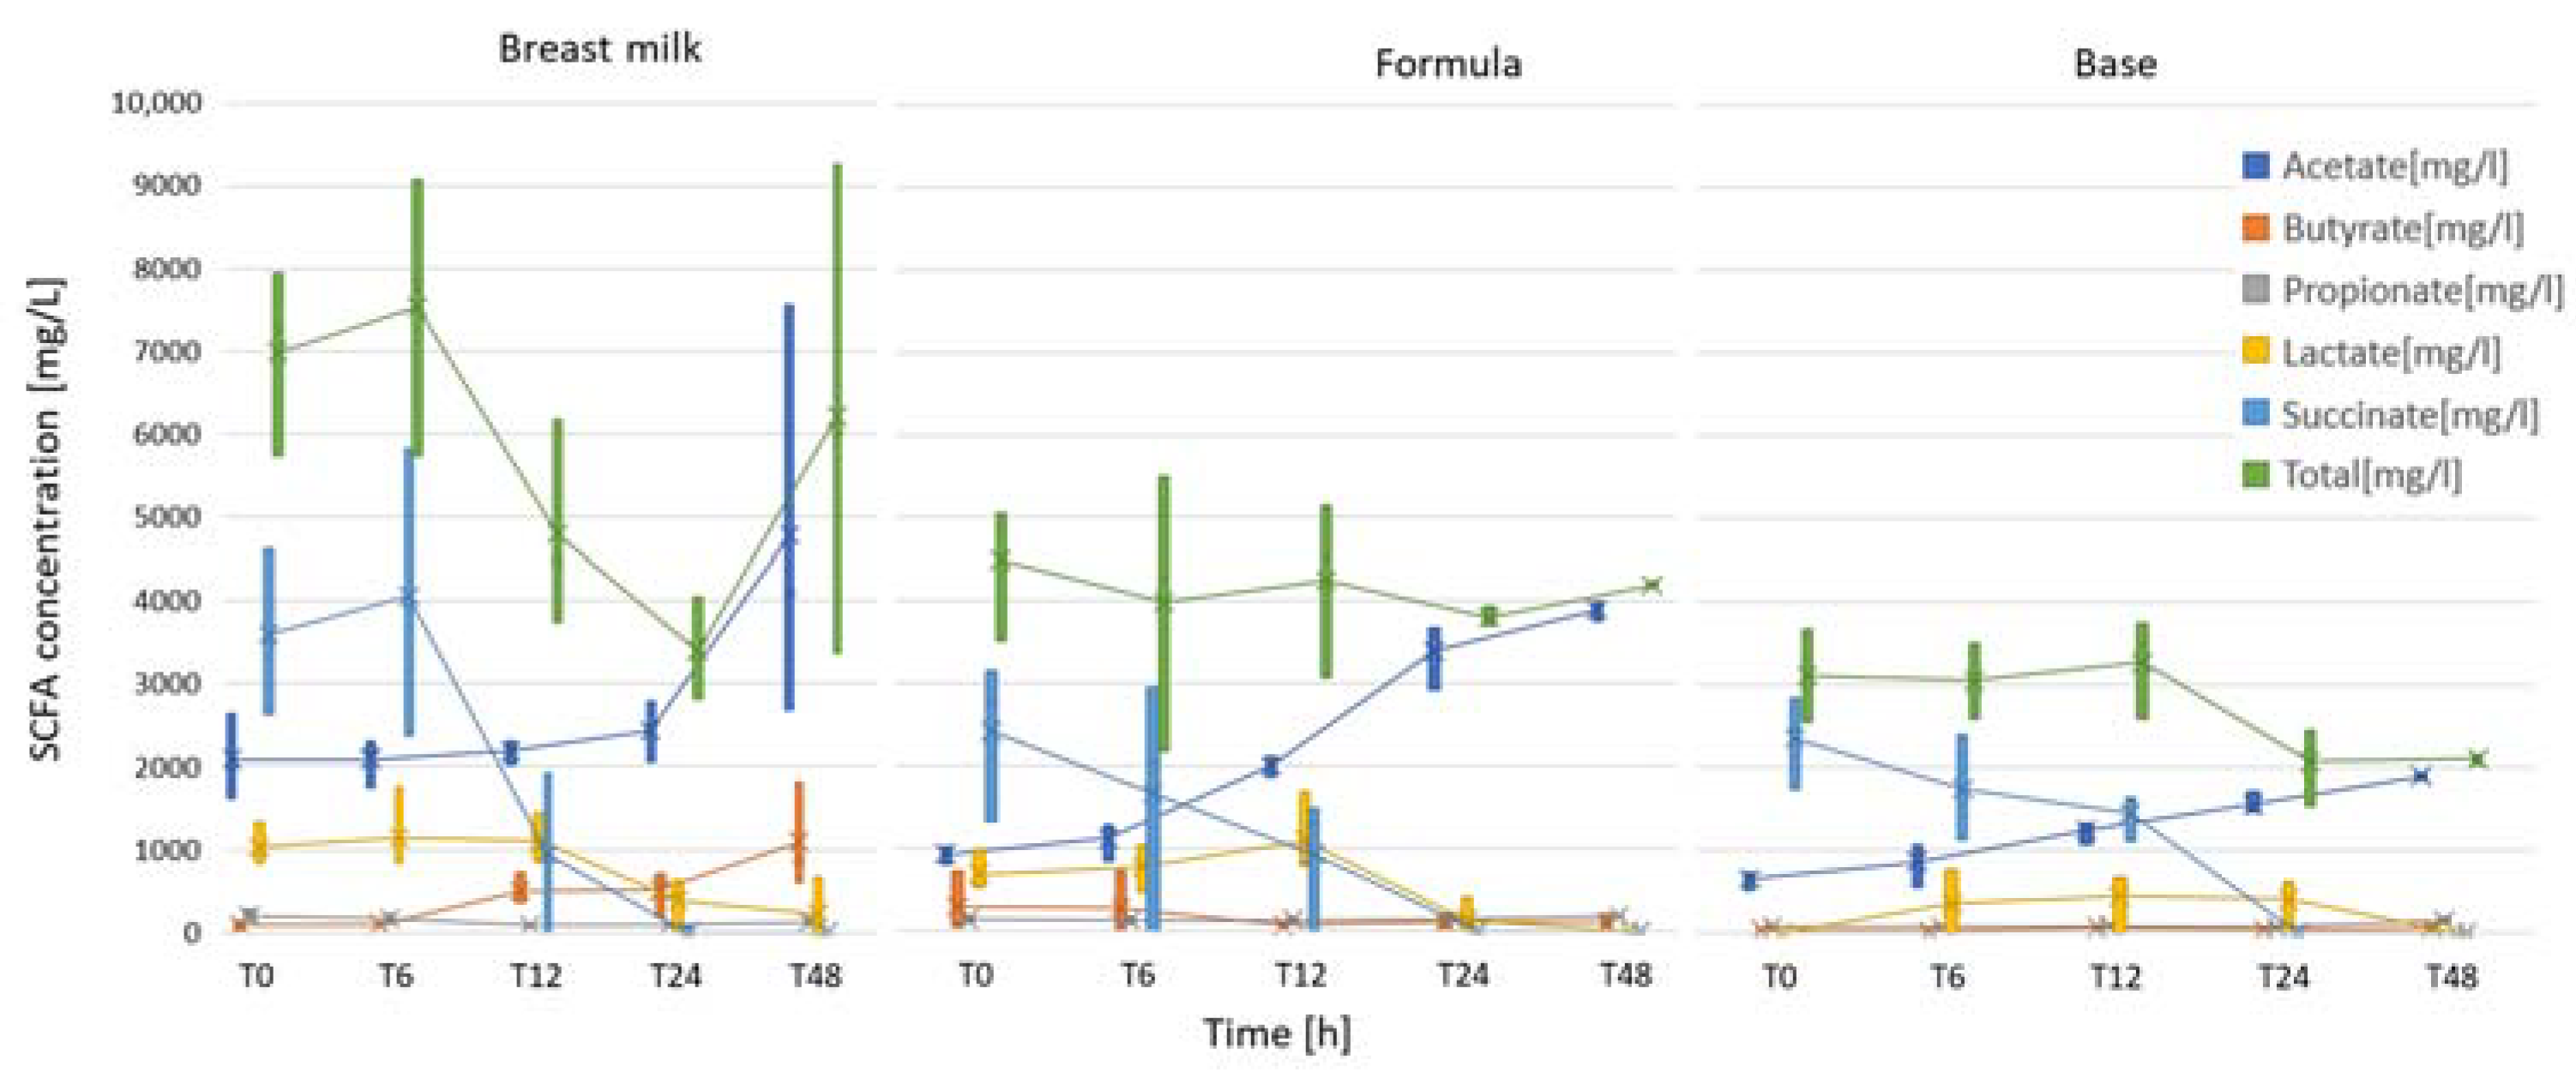
| Avg. Concentrations | T0 | T6 | T12 | T24 | T48 | All Timepoints | ||||||||||||
| SCFA | Formula | Base | Breast milk | Formula | Base | Breast milk | Formula | Base | Breast milk | Formula | Base | Breast milk | Formula | Base | Breast milk | Formula | Base | BM |
| Acetate [mg/L] | 936 | 655 | 2088 | 1125 | 862 | 2090 | 2000 | 1243 | 2188 | 3396 | 1553 | 2437 | 3900 | 1898 | 4784 | 2271 | 1242 | 2717 |
| Butyrate [mg/L] | 296 | 31 | 83 | 283 | 13 | 93 | 68 | 64 | 495 | 121 | 44 | 501 | 107 | 56 | 1093 | 175 | 42 | 453 |
| Lactate [mg/L] | 693 | 0 | 1030 | 780 | 360 | 1143 | 1103 | 440 | 1097 | 137 | 403 | 380 | 0 | 0 | 220 | 543 | 241 | 774 |
| Propionate [mg/L] | 142 | 74 | 196 | 130 | 74 | 156 | 138 | 85 | 81 | 151 | 70 | 85 | 189 | 153 | 124 | 150 | 91 | 128 |
| Succinate [mg/L] | 2423 | 2353 | 3597 | 1667 | 1743 | 4063 | 937 | 1443 | 940 | 0 | 0 | 0 | 0 | 0 | 0 | 1005 | 1108 | 1720 |
| Total [mg/L] | 4491 | 3114 | 6995 | 3985 | 3053 | 7545 | 4245 | 3275 | 4800 | 3804 | 2070 | 3403 | 4196 | 2108 | 6221 | 4144 | 2724 | 5793 |
| (b) | ||||||||||||||||||
| p-values | T0 | T6 | T12 | T24 | T48 | All Timepoints | ||||||||||||
| SCFA | All groups | FvBM | FvB | All groups | FvBM | FvB | All groups | FvBM | FvB | All groups | FvBM | FvB | All groups | FvBM | FvB | Time Effect | Treatment Effect | |
| Acetate [mg/L] | 0.027 | 0.050 | 0.050 | NS | 0.,050 | NS | NS | NS | 0.050 | 0.03 | 0.050 | 0.050 | NS | NS | 0.050 | 0.000 | 0.000 | |
| Butyrate [mg/L] | NS | NS | 0.050 | NS | NS | NS | NS | 0.050 | NS | NS | NS | NS | NS | 0.050 | NS | NS | 0.000 | |
| Lactate [mg/L] | 0.046 | NS | 0.037 | NS | NS | NS | NS | NS | 0.050 | NS | NS | NS | NS | NS | nan | 0.002 | 0.008 | |
| Propionate [mg/L] | 0.039 | NS | 0.050 | NS | NS | 0.050 | NS | 0.050 | 0.050 | 0.04 | 0.050 | 0.050 | NS | 0.050 | NS | NS | 0.000 | |
| Succinate [mg/L] | NS | NS | NS | NS | NS | NS | NS | NS | NS | nan | nan | nan | nan | nan | nan | 0.000 | NS | |
| Total [mg/L] | 0.039 | 0.050 | NS | NS | 0.050 | NS | NS | NS | NS | NS | NS | 0.050 | NS | NS | 0.050 | NS | 0.000 | |
Disclaimer/Publisher’s Note: The statements, opinions and data contained in all publications are solely those of the individual author(s) and contributor(s) and not of MDPI and/or the editor(s). MDPI and/or the editor(s) disclaim responsibility for any injury to people or property resulting from any ideas, methods, instructions or products referred to in the content. |
© 2024 by the authors. Licensee MDPI, Basel, Switzerland. This article is an open access article distributed under the terms and conditions of the Creative Commons Attribution (CC BY) license (https://creativecommons.org/licenses/by/4.0/).
Share and Cite
Borewicz, K.; Brück, W.M. Supplemented Infant Formula and Human Breast Milk Show Similar Patterns in Modulating Infant Microbiota Composition and Function In Vitro. Int. J. Mol. Sci. 2024, 25, 1806. https://doi.org/10.3390/ijms25031806
Borewicz K, Brück WM. Supplemented Infant Formula and Human Breast Milk Show Similar Patterns in Modulating Infant Microbiota Composition and Function In Vitro. International Journal of Molecular Sciences. 2024; 25(3):1806. https://doi.org/10.3390/ijms25031806
Chicago/Turabian StyleBorewicz, Klaudyna, and Wolfram Manuel Brück. 2024. "Supplemented Infant Formula and Human Breast Milk Show Similar Patterns in Modulating Infant Microbiota Composition and Function In Vitro" International Journal of Molecular Sciences 25, no. 3: 1806. https://doi.org/10.3390/ijms25031806
APA StyleBorewicz, K., & Brück, W. M. (2024). Supplemented Infant Formula and Human Breast Milk Show Similar Patterns in Modulating Infant Microbiota Composition and Function In Vitro. International Journal of Molecular Sciences, 25(3), 1806. https://doi.org/10.3390/ijms25031806