
In Vitro MRS of Cells Treated with Trastuzumab at 1.5 Tesla
 , ,
, ,  , , , ,

Abstract
1. Introduction
2. Results
2.1. MCF-7 Cells
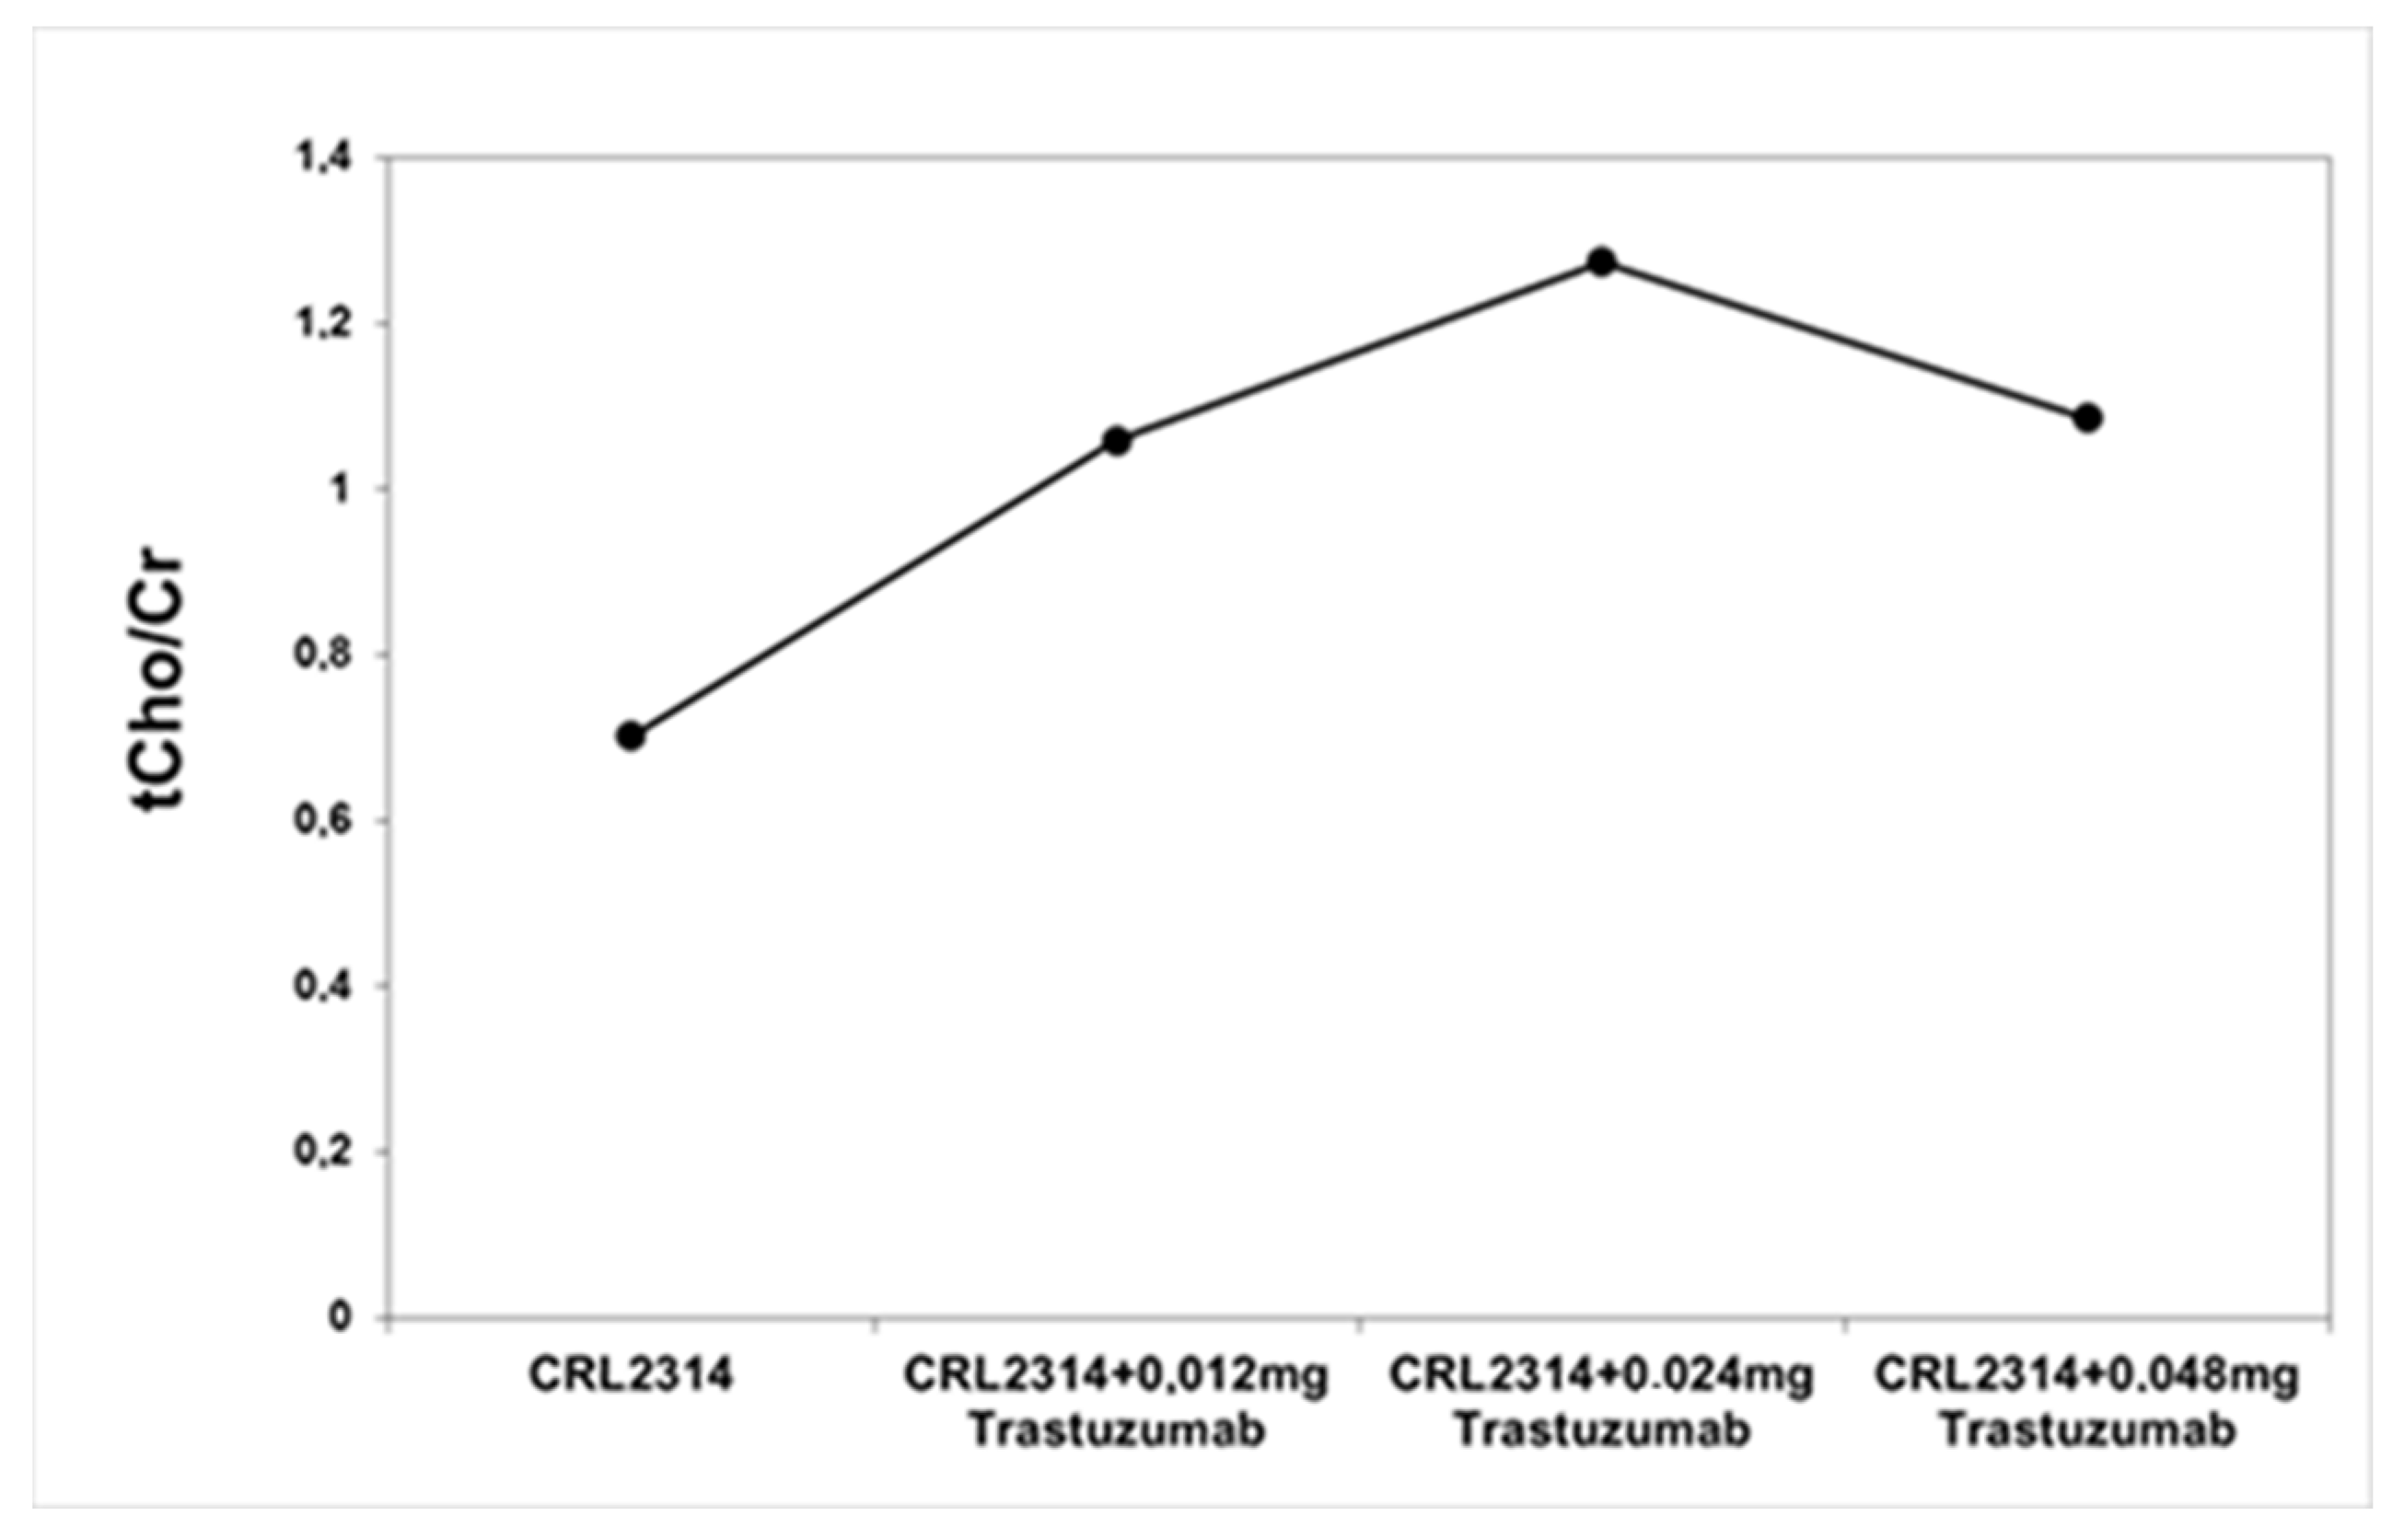
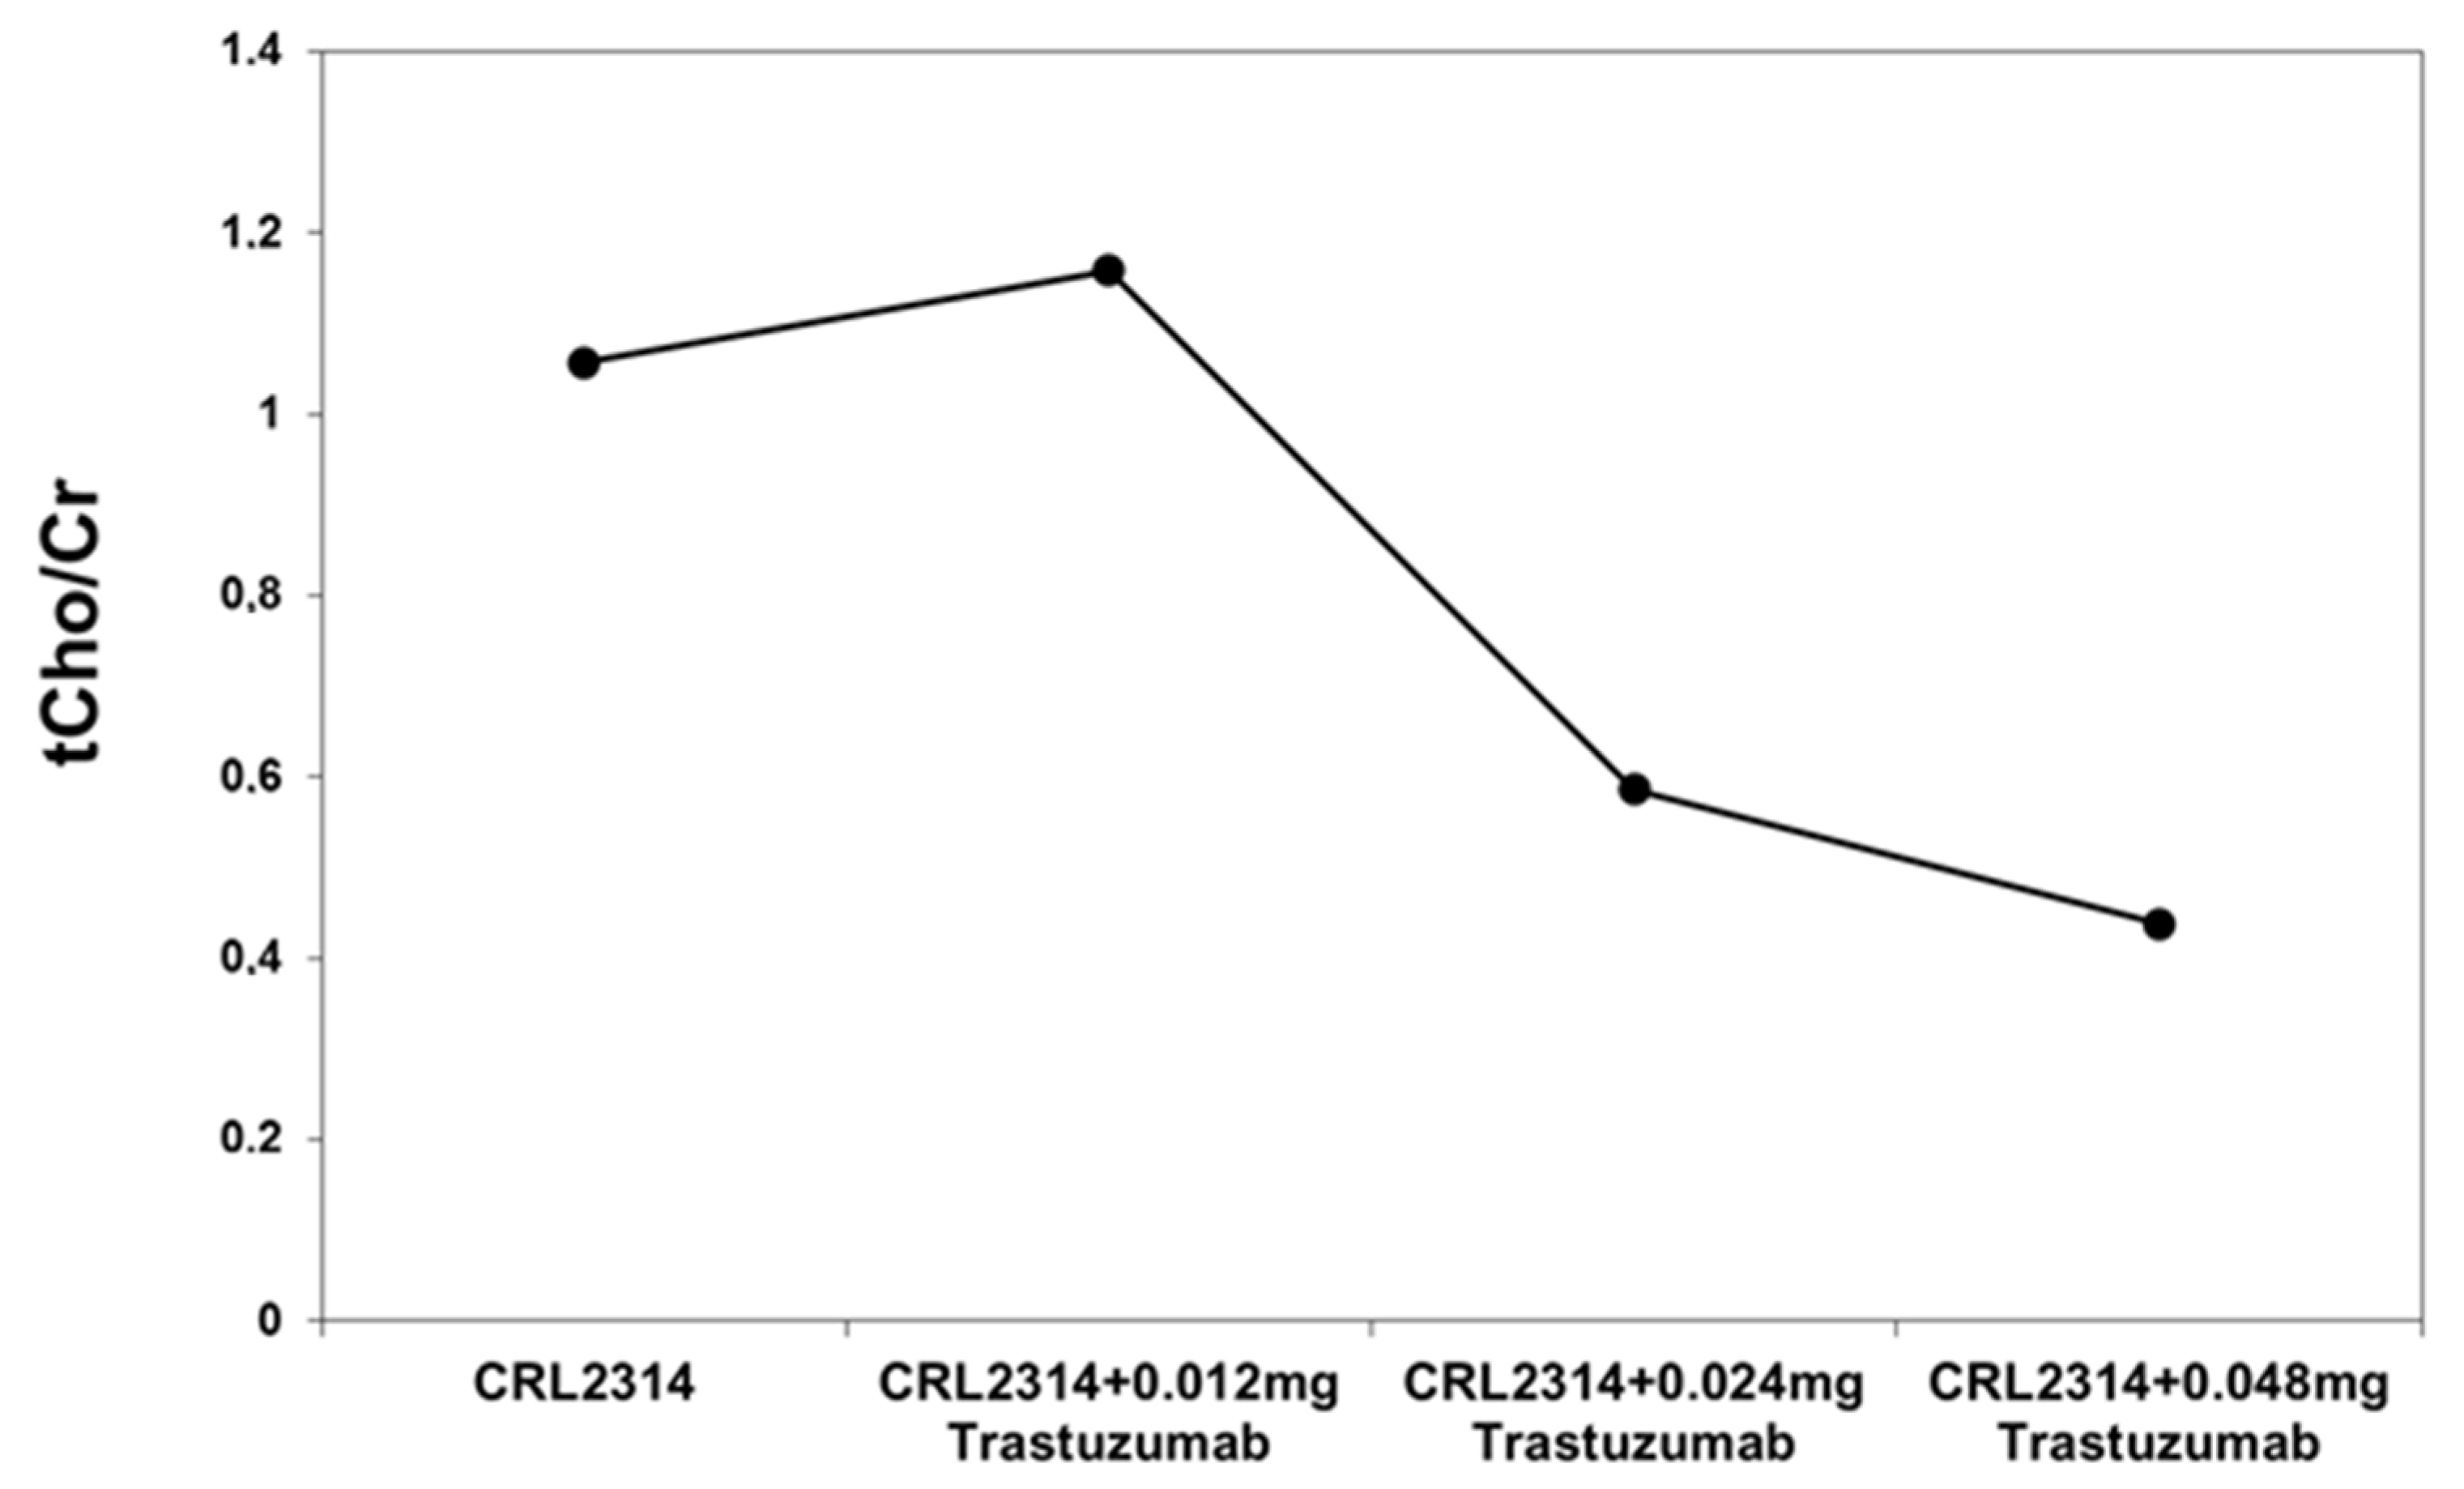
2.2. CRL-2314 Cells
3. Discussion
4. Materials and Methods
5. Conclusions
Author Contributions
Funding
Conflicts of Interest
References
- Bertholdo, D.; Watcharakorn, A.; Castillo, M. Brain proton magnetic resonance spectroscopy: Introduction and overview. Neuroimaging Clin. N. Am. 2013, 23, 359–380. [Google Scholar] [CrossRef]
- Igarashi, H.; Takeda, M.; Natsumeda, M.; Fujii, Y. Proton magnetic resonance spectroscopy (1H-MRS). No Shinkei Geka. 2021, 49, 438–444. [Google Scholar]
- DeSantis, C.E.; Bray, F.; Ferlay, J.; Lortet-Tieulent, J.; Anderson, B.O.; Jemal, A. International Variation in Female Breast Cancer Incidence and Mortality Rates. Cancer Epidemiol. Biomark. Prev. 2015, 24, 1495–1506. [Google Scholar] [CrossRef] [PubMed]
- Ginsburg, O.; Yip, C.H.; Brooks, A.; Cabanes, A.; Caleffi, M.; Dunstan Yataco, J.A.; Gyawali McCormack, V.; McLaughlin de Anderson, M.; Mehrotra, R.; Mohar, A.; et al. Breast cancer early detection: A phased approach to implementation. Cancer 2020, 126, 2379–2393. [Google Scholar] [CrossRef]
- Wild, C.P.; Weiderpass, E.; Stewart, B.W. World Cancer Report: Cancer Research for Cancer Prevention; International Agency for Research on Cancer: Lyon, France, 2020; Available online: http://publications.iarc.fr/586 (accessed on 17 January 2022).
- Lambert, J.M. Antibody−Drug Conjugates (ADCs): Magic Bullets at Last! Mol. Pharm. 2015, 12, 1701–1702. [Google Scholar] [CrossRef] [PubMed]
- Stender, M.J.; Neuberg, D.; Wood, W.; Slegde, A. Correlation of circulating c-erbB2 extracellular domain (HER-2) with clinical outcome in patients with mwtastacic breast cancer. Proc. Am. Soc. Oncol. 1997, 16, 541. [Google Scholar]
- Sjögren, S.; Inganäs, M.; Lindgren, A.; Holmberg, L.; Bergh, J. Prognostic and predictive value of c-erbB-2 overexpression in primary breast cancer, alone and in combination with other prognostic markers. J. Clin. Oncol. 1998, 16, 462–469. [Google Scholar] [CrossRef] [PubMed]
- Ng, C.K.; Martelotto, L.G.; Gauthier, A.; Wen, H.C.; Piscuoglio, S.; Lim, R.S.; Cowell, C.F.; Wilkerson, P.M.; Wai, P.; Rodrigues, D.N.; et al. Intra-tumor genetic heterogeneity and alternative driver genetic alterations in breast cancers with heterogeneous HER2 gene amplification. Genome Biol. 2015, 16, 107. [Google Scholar] [CrossRef] [PubMed]
- Rimawi, M.F.; Schiff, R.; Osborne, C.K. Targeting HER2 for the treatment of breast cancer. Annu. Rev. Med. 2015, 66, 111–128. [Google Scholar] [CrossRef]
- Rexer, B.N.; Arteaga, C.L. Intrinsic and acquired resistance to HER2-targeted therapies in HER2 gene-amplified breast cancer: Mechanisms and clinical implications. Crit. Rev. Oncog. 2012, 17, 1–16. [Google Scholar] [CrossRef]
- Yeo, B.; Kotsori, K.; Mohammed, K.; Walsh, G.; Smith, I.E. Long-term outcome of HER2 positive metastatic breast cancer patients treated with first-line trastuzumab. Breast 2015, 24, 751–757. [Google Scholar] [CrossRef] [PubMed]
- Zhang, H.; Xu, H.B.; Kurban, E.; Luo, H.W. LncRNA SNHG14 promotes hepatocellular carcinoma progression via H3K27 acetylation activated PABPC1 by PTEN signaling. Cell Death Dis. 2020, 11, 646. [Google Scholar] [CrossRef]
- Bali, P.; Pranpat, M.; Swaby, R.; Fiskus, W.; Yamaguchi, H.; Balasis, M.; Rocha, K.; Wang, H.G.; Richon, V.; Bhalla, K. Activity of suberoylanilide hydroxamic Acid against human breast cancer cells with amplification of her-2. Clin Cancer Res. 2005, 11, 6382–6389. [Google Scholar] [CrossRef]
- Thompson, E.W.; Reich, R.; Shima, T.B.; Albini, A.; Graf, J.; Martin, G.R.; Dickson, R.B.; Lippman, M.E. Differential regulation of growth and invasiveness of MCF-7 breast cancer cells by antiestrogens. Cancer Res. 1988, 48, 6764–6768. [Google Scholar] [PubMed]
- Ibrahim, E.; Al-Gahmi, A.M.; Zeenelin, A.A.; Zekri, J.M.; Elkhodary, T.R.; Gaballa, H.E.; Fawzy, E.E.; El Sayed, M.E.; Alzahrani, M.S. Basal vs. luminal A breast cancer subtypes: A matched case-control study using estrogen receptor, progesterone receptor, and HER-2 as surrogate markers. Med. Oncol. 2009, 26, 372–378. [Google Scholar] [CrossRef]
- Le, X.F.; Pruefer, F.; Bast, R. Her-2-targeting antibodies modulate the cyclin-dependent kinase inhibitor p27Kip1 via multiple signaling pathways. Cell Cycle 2005, 4, 87–95. [Google Scholar] [CrossRef] [PubMed]
- Pegram, M.D.; Hsu, S.; Lewis, G.; Pietras, R.; Beryt, M.; Sliwkowski, M.; Coombs, D.; Baly, D.; Kabbinavar, F.; Slamon, D. Inhibitory effects of combinations of Her-2/neu antibody and chemotherapeutic agents used for treatment of human breast cancer. Oncogene 1999, 18, 2241–2251. [Google Scholar] [CrossRef]
- Piccart-Gebhart, M.J.; Procter, M.; Leyland-Jones, B.; Goldhirsch, A.; Untch, M.; Smith, I.; Gianni, L.; Baselga, J.; Bell, R.; Jackisch, C.; et al. Herceptin Adjuvant (HERA) Trial Study Team, Trastuzumab after adjuvant chemotherapy in Her-2-positive breast cancer. N. Engl. J. Med. 2005, 353, 1659–1672. [Google Scholar] [CrossRef]
- Shin, D.H.; Koo, M.J.; Kim, J.S.; Kim, J.S. Herceptin-conjugated temperature-sensitive immunoliposomes encapsulating gemcitabine for breast cancer. Arch. Pharmacal Res. 2016; Epub ahead of print. [Google Scholar] [CrossRef]
- Baltzer, P.A.; Dietzel, M. Breast lesions: Diagnosis by using proton MR spectroscopy at 1.5 and 3.0 T. Radiology 2013, 267, 735–746. [Google Scholar] [CrossRef]
- Wang, X.; Wang, X.J.; Song, H.S.; Chen, L.H. 1H-MRS evaluation of breast lesions by using total choline signal-to-noise ratio as an indicator of malignancy: A meta-analysis. Med. Oncol. 2015, 32, 160. [Google Scholar] [CrossRef]
- Bitencourt, A.G.V.; Pinker, K.; Thakur, S. Elevated glycine detected on in vivo magnetic resonance spectroscopy in a breast cancer patient: Case report and literature review. BJR Case Rep. 2020, 6, 20190090. [Google Scholar] [CrossRef]
- El Ansari, R.; McIntyre, A.; Craze, M.L.; Ellis, I.O.; Rakha, E.A.; Green, A.R. Altered glutamine metabolism in breast cancer; subtype dependencies and alternative adaptations. Histopathology 2018, 72, 183–190. [Google Scholar] [CrossRef]
- Zhang, J.; Pavlova, N.N.; Thompson, C.B. Cancer cell metabolism: The essential role of a nonessential amino acid, glutamine. EMBO J. 2017, 36, 1302–1315. [Google Scholar] [CrossRef]
- Yanagida, O.; Kanai, Y.; Chairoungdua, A.; Kim, D.K.; Segawa, H.; Nii, T.; Cha, S.H.; Matsuo, H.; Fukushima, J.; Fukasawa, Y.; et al. Human l-type amino acid transporter 1 (LAT1): Characterization of function and expression in tumor cell lines. Biochim. Biophys. Acta. 2001, 1514, 291–302. [Google Scholar] [CrossRef]
- Rivera, S.; Azcon-Bieto, J.; Lopez-Soriano, F.J.; Miralpeix, M.; Argiles, J.M. Amino acid metabolism in tumour-bearing mice. Biochem. J. 1988, 249, 443–449. [Google Scholar] [CrossRef]
- DeBerardinis, R.J.; Cheng, T. Q’s next: The diverse functions of glutamine in metabolism, cell biology and cancer. Oncogene 2010, 29, 313–324. [Google Scholar] [CrossRef]
- van Geldermalsen, M.; Quek, L.E.; Turner, N.; Freidman, N.; Pang, A.; Guan, Y.F.; Krycer, J.R.; Ryan, R.; Wang, Q.; Holst, J. Benzylserine inhibits breast cancer cell growth by disrupting intracellular amino acid homeostasis and triggering amino acid response pathways. BMC Cancer 2018, 18, 689. [Google Scholar] [CrossRef] [PubMed]
- Li, H.; Wang, J.; Yi, Z.; Li, C.; Wang, H.; Zhang, J.; Wang, T.; Nan, P.; Lin, F.; Xu, D.; et al. CDK12 inhibition enhances sensitivity of HER2+ breast cancers to HER2-tyrosine kinase inhibitor via suppressing PI3K/AKT. Eur. J. Cancer 2021, 145, 92–108. [Google Scholar] [CrossRef]
- Maria, R.M.; Altei, W.F.; Selistre-de-Araujo, H.S.; Colnago, L.A. Impact of chemotherapy on metabolic reprogramming: Characterization of the metabolic profile of breast cancer MDA-MB-231 cells using 1H HR-MAS NMR spectroscopy. J. Pharm. Biomed. Anal. 2017, 146, 324–328. [Google Scholar] [CrossRef] [PubMed]
- Euceda, L.R.; Haukaas, T.H.; Giskeødegård, G.F.; Vettukattil, M.R.; Engel, J.; Silwal-Pandit, L.; Lundgren, S.; Borgen, E.; Garred, Ø.; Postma, G.; et al. Evaluation of Metabolomic Changes during Neoadjuvant Chemotherapy Combined with Bevacizumab in Breast Cancer Using MR Spectroscopy. Metabolomics 2017, 13, 37. [Google Scholar] [CrossRef]
- Warburg, O. On the origin of cancer cells. Science 1956, 123, 309–314. [Google Scholar] [CrossRef]
- Bathen, T.F.; Geurts, B.; Sitter, B.; Fjøsne, H.E.; Lundgren, S.; Buydens, L.M.; Gribbestad, I.S.; Postma, G.; Giskeødegård, G.F. Feasibility of MR Metabolomics for Immediate Analysis of Resection Margins during Breast Cancer Surgery. PLoS ONE 2013, 8, e61578. [Google Scholar] [CrossRef]
- Cheng, L.L.; Chang, I.W.; Smith, B.L.; Gonzalez, R.G. Evaluating Human Breast Ductal Carcinomas with High-Resolution Magic-Angle Spinning Proton Magnetic Resonance Spectroscopy. J. Magn. Reson. 1998, 135, 194–202. [Google Scholar] [CrossRef] [PubMed]
- Sitter, B.; Lundgren, S.; Bathen, T.F.; Halgunset, J.; Fjosne, H.E.; Gribbestad, I.S. Comparison of HR MAS MR Spectroscopic Profiles of Breast Cancer Tissue with Clinical Parameters. NMR Biomed. 2006, 19, 30–40. [Google Scholar] [CrossRef] [PubMed]
- Choi, J.S.; Baek, H.M.; Kim, S.; Kim, M.J.; Youk, J.H.; Moon, H.J.; Kim, E.K.; Han, K.H.; Kim, D.H.; Kim, S.I.; et al. HR-MAS MR spectroscopy of breast cancer tissue obtained with core needle biopsy: Correlation with prognostic factors. PLoS ONE 2012, 7, e51712. [Google Scholar] [CrossRef]
- Sitter, B.; Bathen, T.F.; Singstad, T.E.; Fjøsne, H.E.; Lundgren, S.; Halgunset, J.; Gribbestad, I.S. Quantification of metabolites in breast cancer patients with different clinical prognosis using HR MAS MR spectroscopy. NMR Biomed. 2010, 23, 424–431. [Google Scholar] [CrossRef] [PubMed]
- Giskeødegård, G.F.; Lundgren, S.; Sitter, B.; Fjøsne, H.E.; Postma, G.; Buydens, L.M.; Gribbestad, I.S.; Bathen, T.F. Lactate and glycine—Potential MR biomarkers of prognosis in estrogen receptor-positive breast cancers. NMR Biomed. 2021, 25, 1271–1279. [Google Scholar] [CrossRef] [PubMed]
- Demas, D.M.; Demo, S.; Fallah, Y.; Clarke, R.; Nephew, K.P.; Althouse, S.; Sandusky, G.; He, W.; Shajahan-Haq, A.N. Glutamine Metabolism Drives Growth in Advanced Hormone Receptor Positive Breast Cancer. Front. Oncol. 2019, 9, 686. [Google Scholar] [CrossRef]
- Guerra, Â.R.; Paulino, A.F.; Castro, M.M.; Oliveira, H.; Duarte, M.F.; Duarte, I.F. Triple Negative Breast Cancer and Breast Epithelial Cells Differentially Reprogram Glucose and Lipid Metabolism upon Treatment with Triterpenic Acids. Biomolecules 2020, 10, 1163. [Google Scholar] [CrossRef] [PubMed]
- Crémillieux, Y.; Salvati, R.; Dumont, U.; Pinaud, N.; Bouchaud, V.; Sanchez, S.; Glöggler, S.; Wong, A. 1H-MRS measurements of time-varying lactate production in an animal model of glioma during administration of an anti-tumoral drug. NMR Biomed. 2018, 31, e3861. [Google Scholar] [CrossRef]
- Jobard, E.; Pontoizeau, C.; Blaise, B.J.; Bachelot, T.; Elena-Herrmann, B.; Trédan, O. A serum nuclear magnetic resonance-based metabolomic signature of advanced metastatic human breast cancer. Cancer Lett. 2014, 343, 33–41. [Google Scholar] [CrossRef] [PubMed]
- Hart, C.D.; Vignoli, A.; Tenori, L.; Uy, G.L.; Van To, T.; Adebamowo, C.; Hossain, S.M.; Biganzoli, L.; Risi, E.; Love, R.R.; et al. Serum Metabolomic Profiles Identify ER-Positive Early Breast Cancer Patients at Increased Risk of Disease Recurrence in a Multicenter Population. Clin. Cancer Res. 2017, 23, 1422–1431. [Google Scholar] [CrossRef] [PubMed]
- Singh, A.; Sharma, R.K.; Chagtoo, M.; Agarwal, G.; George, N.; Sinha, N.; Godbole, M.M. 1H NMR metabolomics reveals association of high expression of inositol 1, 4, 5 trisphosphate receptor and Metabolites in breast cancer patients. PLoS ONE 2017, 12, e0169330. [Google Scholar] [CrossRef]
- Suman, S.; Sharma, R.K.; Kumar, V.; Sinha, N.; Shukla, Y. Metabolic fingerprinting in breast cancer stages through 1H NMR spectroscopy-based metabolomic analysis of plasma. J. Pharm. Biomed. Anal. 2018, 160, 38–45. [Google Scholar] [CrossRef]
- Richard, V.; Conotte, R.; Mayne, D.; Colet, J.M. Does the 1H-NMR plasma metabolome reflect the host-tumor interactions in human breast cancer? Oncotarget 2017, 8, 49915–49930. [Google Scholar] [CrossRef]
- Kauraniemi, P.; Hautaniemi, S.; Autio, R.; Astola, J.; Monni, O.; Elkahloun, A.; Kallioniemi, A. Effects of Herceptin treatment on global gene expression patterns in Her-2 amplified and nonamplified breast cancer cell lines. Oncogene 2004, 23, 1010–1013. [Google Scholar] [CrossRef]
- Bartusik, D.; Tomanek, B.; Lattová, E.; Perreault, H.; Fallone, G. Ex vivo assays of CEM cells cultured and treated in the three dimensional cultures. Biomed. Pharm. 2010, 64, 390–395. [Google Scholar] [CrossRef] [PubMed]
- Sorace, A.G.; Elkassem, A.A.; Galgano, S.J.; Lapi, S.E.; Larimer, B.M.; Partridge, S.C.; Quarles, C.C.; Reeves, K.; Napier, T.S.; Song, P.N.; et al. Imaging for Response Assessment in Cancer Clinical Trials. Semin. Nucl. Med. 2020, 50, 488–504. [Google Scholar] [CrossRef]
- Flores, L.G., 2nd; Yeh, H.H.; Soghomonyan, S.; Young, D.; Bankson, J.; Hu, Q.; Alauddin, M.; Huff, V.; Gelovani, J.G. Monitoring therapy with MEK inhibitor U0126 in a novel Wilms tumor model in Wt1 knockout Igf2 transgenic mice using 18F-FDG PET with dual-contrast enhanced CT and MRI: Early metabolic response without inhibition of tumor growth. Mol. Imaging Biol. 2013, 15, 175–185. [Google Scholar] [CrossRef]
- Capozza, M.; Anemone, A.; Dhakan, C.; Della Peruta, M.; Bracesco, M.; Zullino, S.; Villano, D.; Terreno, E.; Longo, D.L.; Aime, S. GlucoCEST MRI for the Evaluation Response to Chemotherapeutic and Metabolic Treatments in a Murine Triple-Negative Breast Cancer: A Comparison with[18F]F-FDG-PET. Mol. Imaging Biol. 2022, 24, 126–134. [Google Scholar] [CrossRef]
- Kristian, A.; Revheim, M.E.; Qu, H.; Mælandsmo, G.M.; Engebråten, O.; Seierstad, T.; Malinen, E. Dynamic (18)F-FDG-PET for monitoring treatment effect following anti-angiogenic therapy in triple-negative breast cancer xenografts. Acta Oncol. 2013, 52, 1566–1572. [Google Scholar] [CrossRef]
- Napier, T.S.; Hunter, C.L.; Song, P.N.; Larimer, B.M.; Sorace, A.G. Preclinical PET Imaging of Granzyme B Shows Promotion of Immunological Response Following Combination Paclitaxel and Immune Checkpoint Inhibition in Triple Negative Breast Cancer. Pharmaceutics 2022, 14, 440. [Google Scholar] [CrossRef]
- Zhang, P.; Zhu, W.; Wang, D.; Yan, J.; Wang, Y.; He, L. Enantioselective Effects of Metalaxyl Enantiomers on Breast Cancer Cells Metabolic Profiling Using HPLC-QTOF-Based Metabolomics. Int. J. Mol. Sci. 2017, 18, 142. [Google Scholar] [CrossRef]
- Mao, C.; Wang, M.; Li, L.; Tang, J.H. Circulating metabolites serve as diagnostic biomarkers for HER2-positive breast cancer and have predictive value for trastuzumab therapy outcomes. J. Clin. Lab. Anal. 2022, 36, 24212. [Google Scholar] [CrossRef]
- Chihanga, T.; Hausmann, S.M.; Ni, S.; Kennedy, M.A. Influence of media selection on NMR based metabolic profiling of human cell lines. Metabolomics 2018, 14, 28. [Google Scholar] [CrossRef]
- Daskalaki, E.; Pillon, N.J.; Krook, A.; Wheelock, C.E.; Checa, A. The influence of culture media upon observed cell secretome metabolite profiles: The balance between cell viability and data interpretability. Anal. Chim. Acta 2018, 1037, 338–350. [Google Scholar] [CrossRef]
- Boyer, J.Z.; Phillips, G.D.L.; Nitta, H.; Garsha, K.; Admire, B.; Kraft, R.; Dennis, E.; Vela, E.; Towne, P. Activity of trastuzumab emtansine (T-DM1) in 3D cell culture. Breast Cancer Res. Treat. 2021, 188, 65–75. [Google Scholar] [CrossRef] [PubMed]
- Hosseinzadeh, A.; Merikhian, P.; Naseri, N.; Eisavand, M.R.; Farahmand, L. MUC1 is a potential target to overcome trastuzumab resistance in breast cancer therapy. Cancer Cell Int. 2022, 22, 110. [Google Scholar] [CrossRef] [PubMed]
- Nagana Gowda, G.A.; Barding, G.A., Jr.; Dai, J.; Gu, H.; Margineantu, D.H.; Hockenbery, D.M.; Raftery, D. A Metabolomics Study of BPTES Altered Metabolism in Human Breast Cancer Cell Lines. Front. Mol. Biosci. 2018, 5, 49. [Google Scholar] [CrossRef] [PubMed]
- Sharma, U.; Jagannathan, N.R. Magnetic Resonance Imaging (MRI) and MR Spectroscopic Methods in Understanding Breast Cancer Biology and Metabolism. Metabolites 2022, 12, 295. [Google Scholar] [CrossRef] [PubMed]
- Romero-Garcia, S.; Lopez-Gonzalez, J.S.; Báez-Viveros, J.L.; Aguilar-Cazares, D.; Prado-Garcia, H. Tumor cell metabolism: An integral view. Cancer Biol Ther. 2011, 12, 939–948. [Google Scholar] [CrossRef] [PubMed]
- Dong, H.; Wang, W.; Mo, S.; Liu, Q.; Chen, X.; Chen, R.; Zhang, Y.; Zou, K.; Ye, M.; He, X.; et al. Long noncoding RNA SNHG14 induces trastuzumab resistance in breast cancer by regulating PABPC1 expression via H3K27 acetylation. J. Cell Mol. Med. 2018, 22, 4935–4947. [Google Scholar] [CrossRef] [PubMed]
- Meng, Q.; Chen, X.; Sun, L.; Zhao, C.; Sui, G.; Cai, L. Carbamazepine promotes Her-2 protein degradation in breast cancer cells by modulating HDAC6 activity and acetylation of Hsp90. Mol. Cell Biochem. 2011, 348, 165–171. [Google Scholar] [CrossRef]


| Detected Cellular Composition | Untreated MCF-7 | Treated MCF-7 |
|---|---|---|
| Glutamine; | x | x |
| Creatine | x | x |
| Total Choline | x | x |
| Taurine | x | x |
| Glycine | x | x |
| PCho | x | - |
| GPC | x | x |
| Alanine | x | x |
| Pylosorbate 20 | - | x |
| L-Histidine | - | x |
| D-Trehalose | - | x |
| Trastuzumab | - | x |
| Sample | Viable Cells/mL | Viability [%] | Total Cells/mL |
|---|---|---|---|
| CRL-2314 | 9.7 × 10⁵ ± 0.3 × 10⁵ | 93.1 | 1.04 × 10⁶ ± 0.03 × 10⁶ |
| CRL-2314 + 0.012 mg Trastuzumab | 1.43 × 10⁶ ± 0.05 × 10⁶ | 93.3 | 1.54 × 10⁶ ± 0.05 × 10⁶ |
| CRL-2314 + 0.024 mg Trastuzumab | 2.43 × 10⁶ ± 0.08 × 10⁶ | 89.6 | 2.72 × 10⁶ ± 0.08 × 10⁶ |
| CRL-2314 + 0.048 mg Trastuzumab | 2.1 × 10⁶ ± 0.07 × 10⁶ | 95.3 | 2.21 × 10⁶ ± 0.07 × 10⁶ |
| Sample | Viable Cells/mL | Viability [%] | Total Cells/mL |
|---|---|---|---|
| CRL-2314 | 1.08 × 10⁷ ± 0.03 × 10⁷ | 96.3 | 1.12 × 10⁷ ± 0.03 × 10⁷ |
| CRL-2314 + 0.012 mg Trastuzumab | 1.71 × 10⁷ ± 0.06 × 10⁷ | 98.9 | 1.73 × 10⁷ ± 0.03 × 10⁷ |
| CRL-2314 + 0.024 mg Trastuzumab | 1.07 × 10⁷ ± 0.03 × 10⁷ | 98.1 | 1.09 × 10⁷ ± 0.03 × 10⁷ |
| CRL-2314 + 0.048 mg Trastuzumab | 8.09 × 10⁶ ± 0.25 × 10⁶ | 98.7 | 8.2 × 10⁶ ± 0.25 × 10⁶ |
Disclaimer/Publisher’s Note: The statements, opinions and data contained in all publications are solely those of the individual author(s) and contributor(s) and not of MDPI and/or the editor(s). MDPI and/or the editor(s) disclaim responsibility for any injury to people or property resulting from any ideas, methods, instructions or products referred to in the content. |
© 2024 by the authors. Licensee MDPI, Basel, Switzerland. This article is an open access article distributed under the terms and conditions of the Creative Commons Attribution (CC BY) license (https://creativecommons.org/licenses/by/4.0/).
Share and Cite
Guz, W.; Podgórski, R.; Bober, Z.; Aebisher, D.; Truszkiewicz, A.; Olek, M.; Machorowska Pieniążek, A.; Kawczyk-Krupka, A.; Bartusik-Aebisher, D. In Vitro MRS of Cells Treated with Trastuzumab at 1.5 Tesla. Int. J. Mol. Sci. 2024, 25, 1719. https://doi.org/10.3390/ijms25031719
Guz W, Podgórski R, Bober Z, Aebisher D, Truszkiewicz A, Olek M, Machorowska Pieniążek A, Kawczyk-Krupka A, Bartusik-Aebisher D. In Vitro MRS of Cells Treated with Trastuzumab at 1.5 Tesla. International Journal of Molecular Sciences. 2024; 25(3):1719. https://doi.org/10.3390/ijms25031719
Chicago/Turabian StyleGuz, Wiesław, Rafal Podgórski, Zuzanna Bober, David Aebisher, Adrian Truszkiewicz, Marcin Olek, Agnieszka Machorowska Pieniążek, Aleksandra Kawczyk-Krupka, and Dorota Bartusik-Aebisher. 2024. "In Vitro MRS of Cells Treated with Trastuzumab at 1.5 Tesla" International Journal of Molecular Sciences 25, no. 3: 1719. https://doi.org/10.3390/ijms25031719
APA StyleGuz, W., Podgórski, R., Bober, Z., Aebisher, D., Truszkiewicz, A., Olek, M., Machorowska Pieniążek, A., Kawczyk-Krupka, A., & Bartusik-Aebisher, D. (2024). In Vitro MRS of Cells Treated with Trastuzumab at 1.5 Tesla. International Journal of Molecular Sciences, 25(3), 1719. https://doi.org/10.3390/ijms25031719