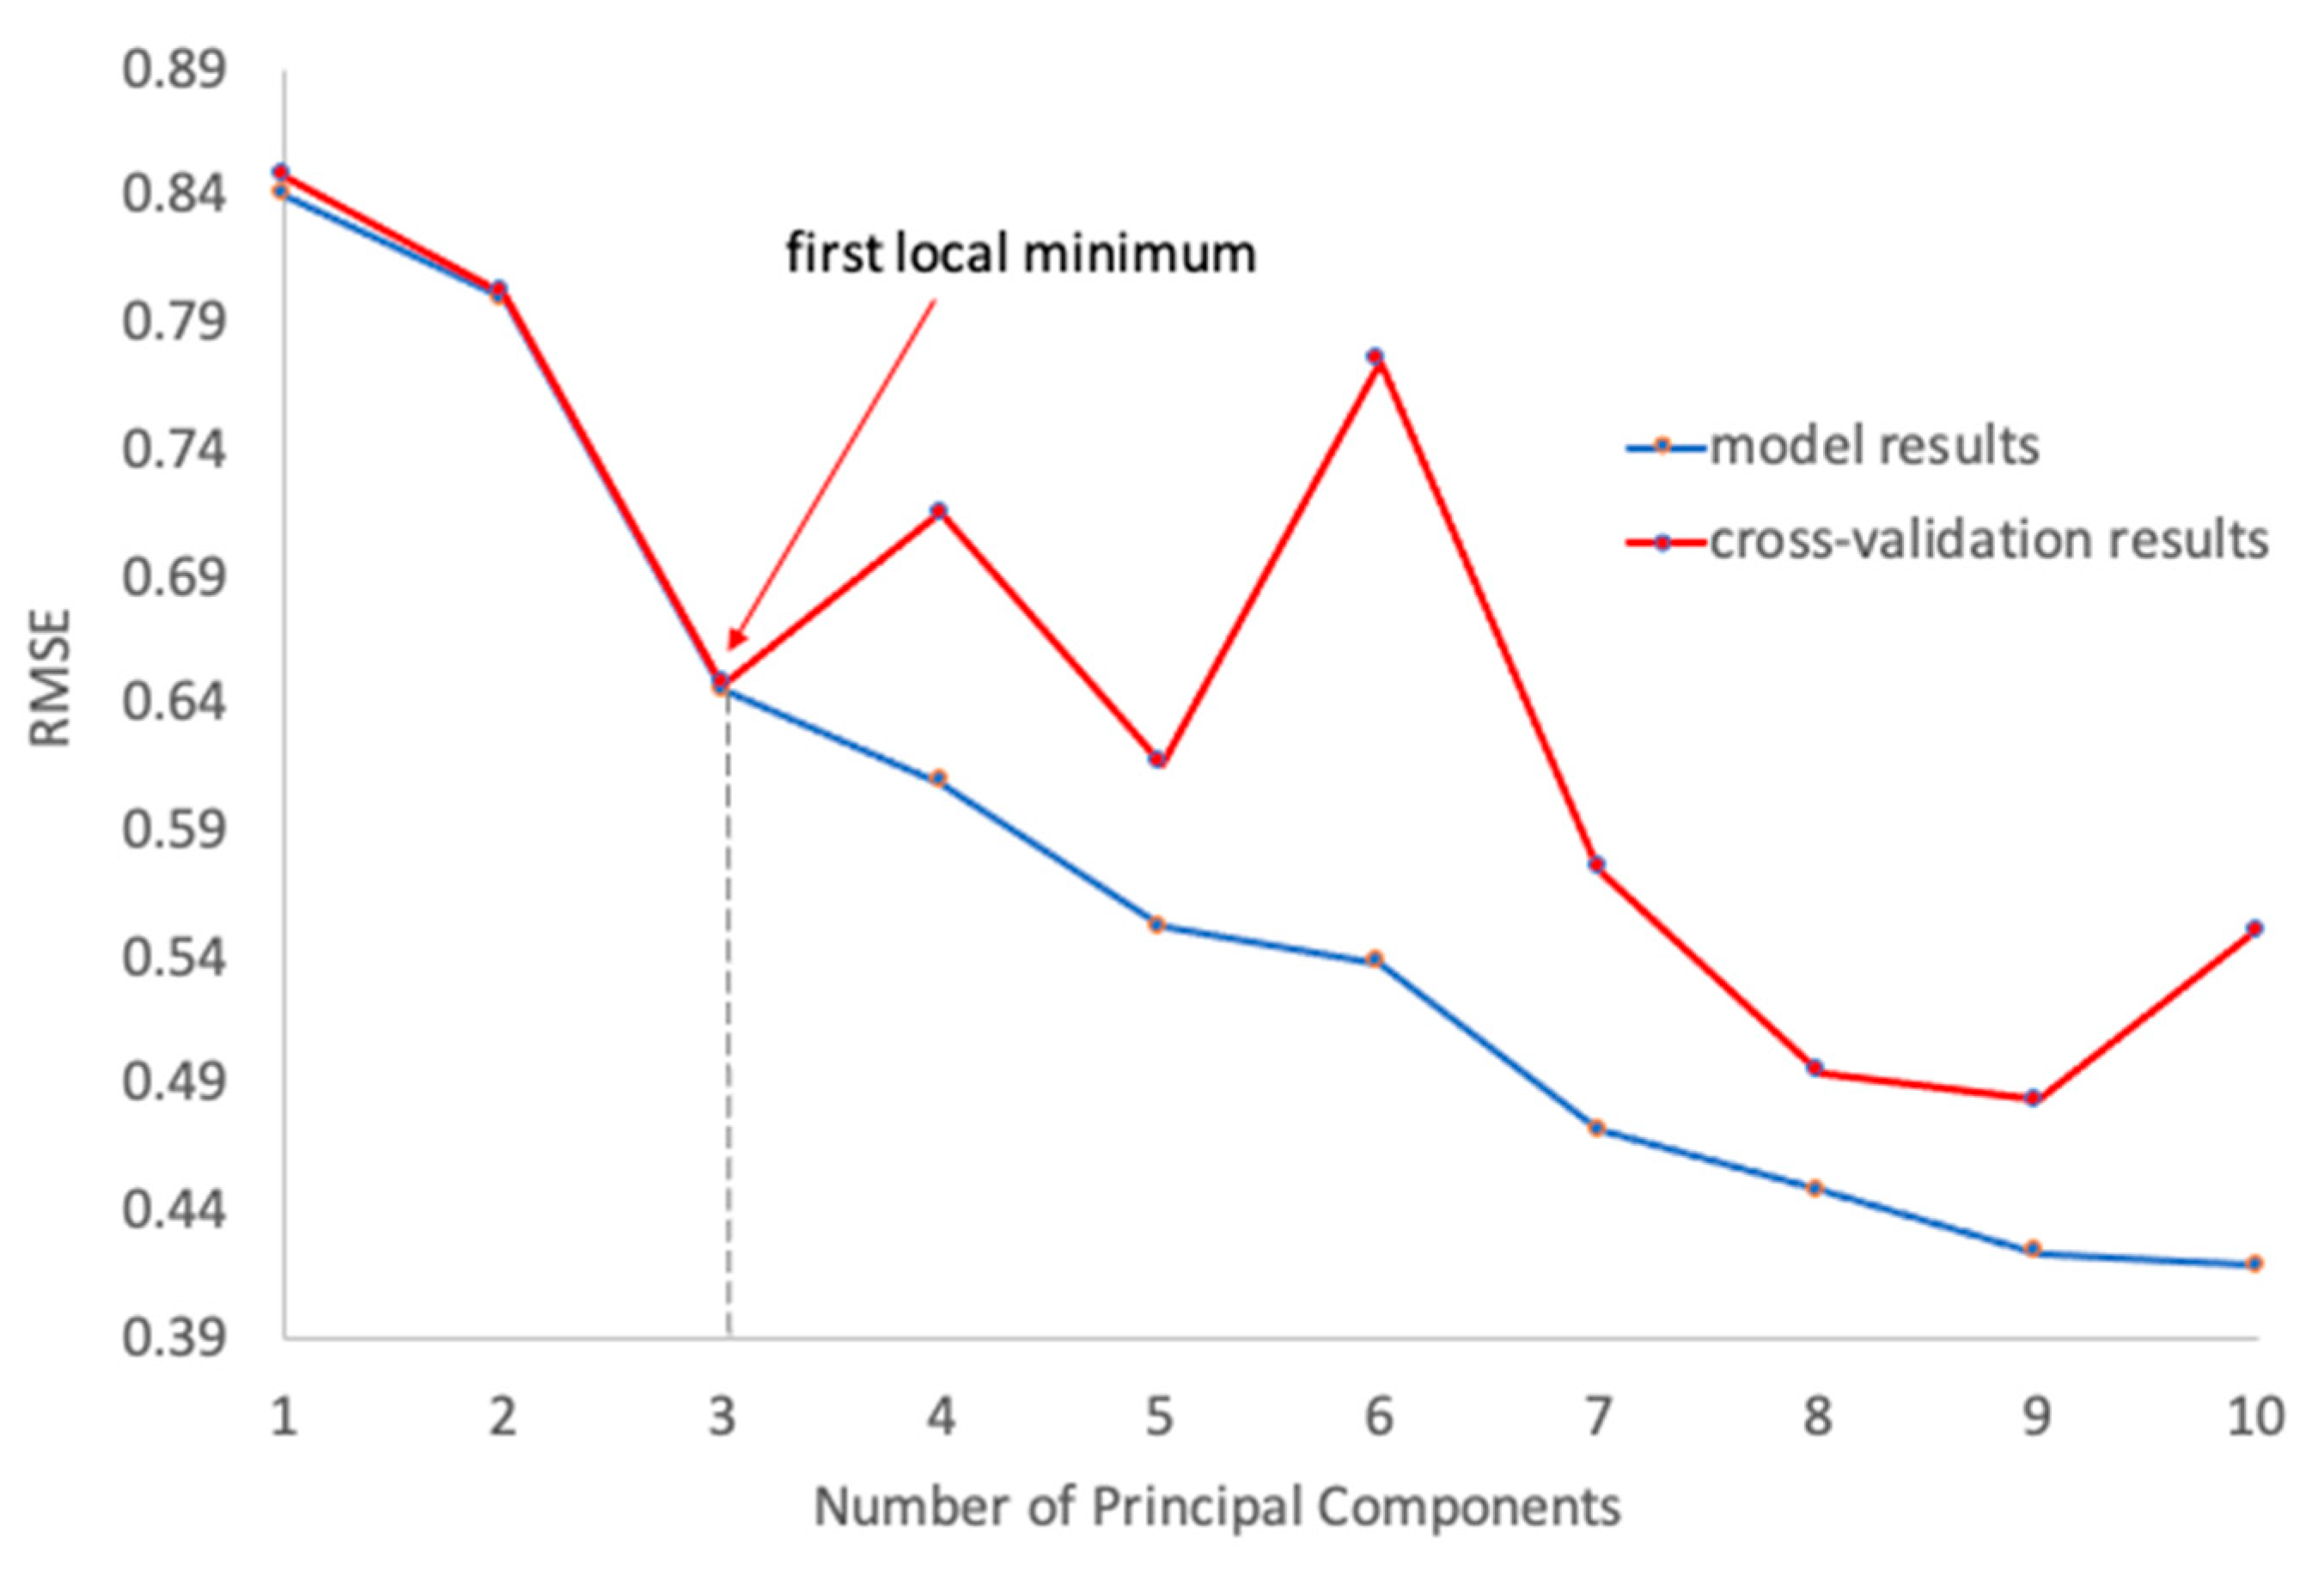
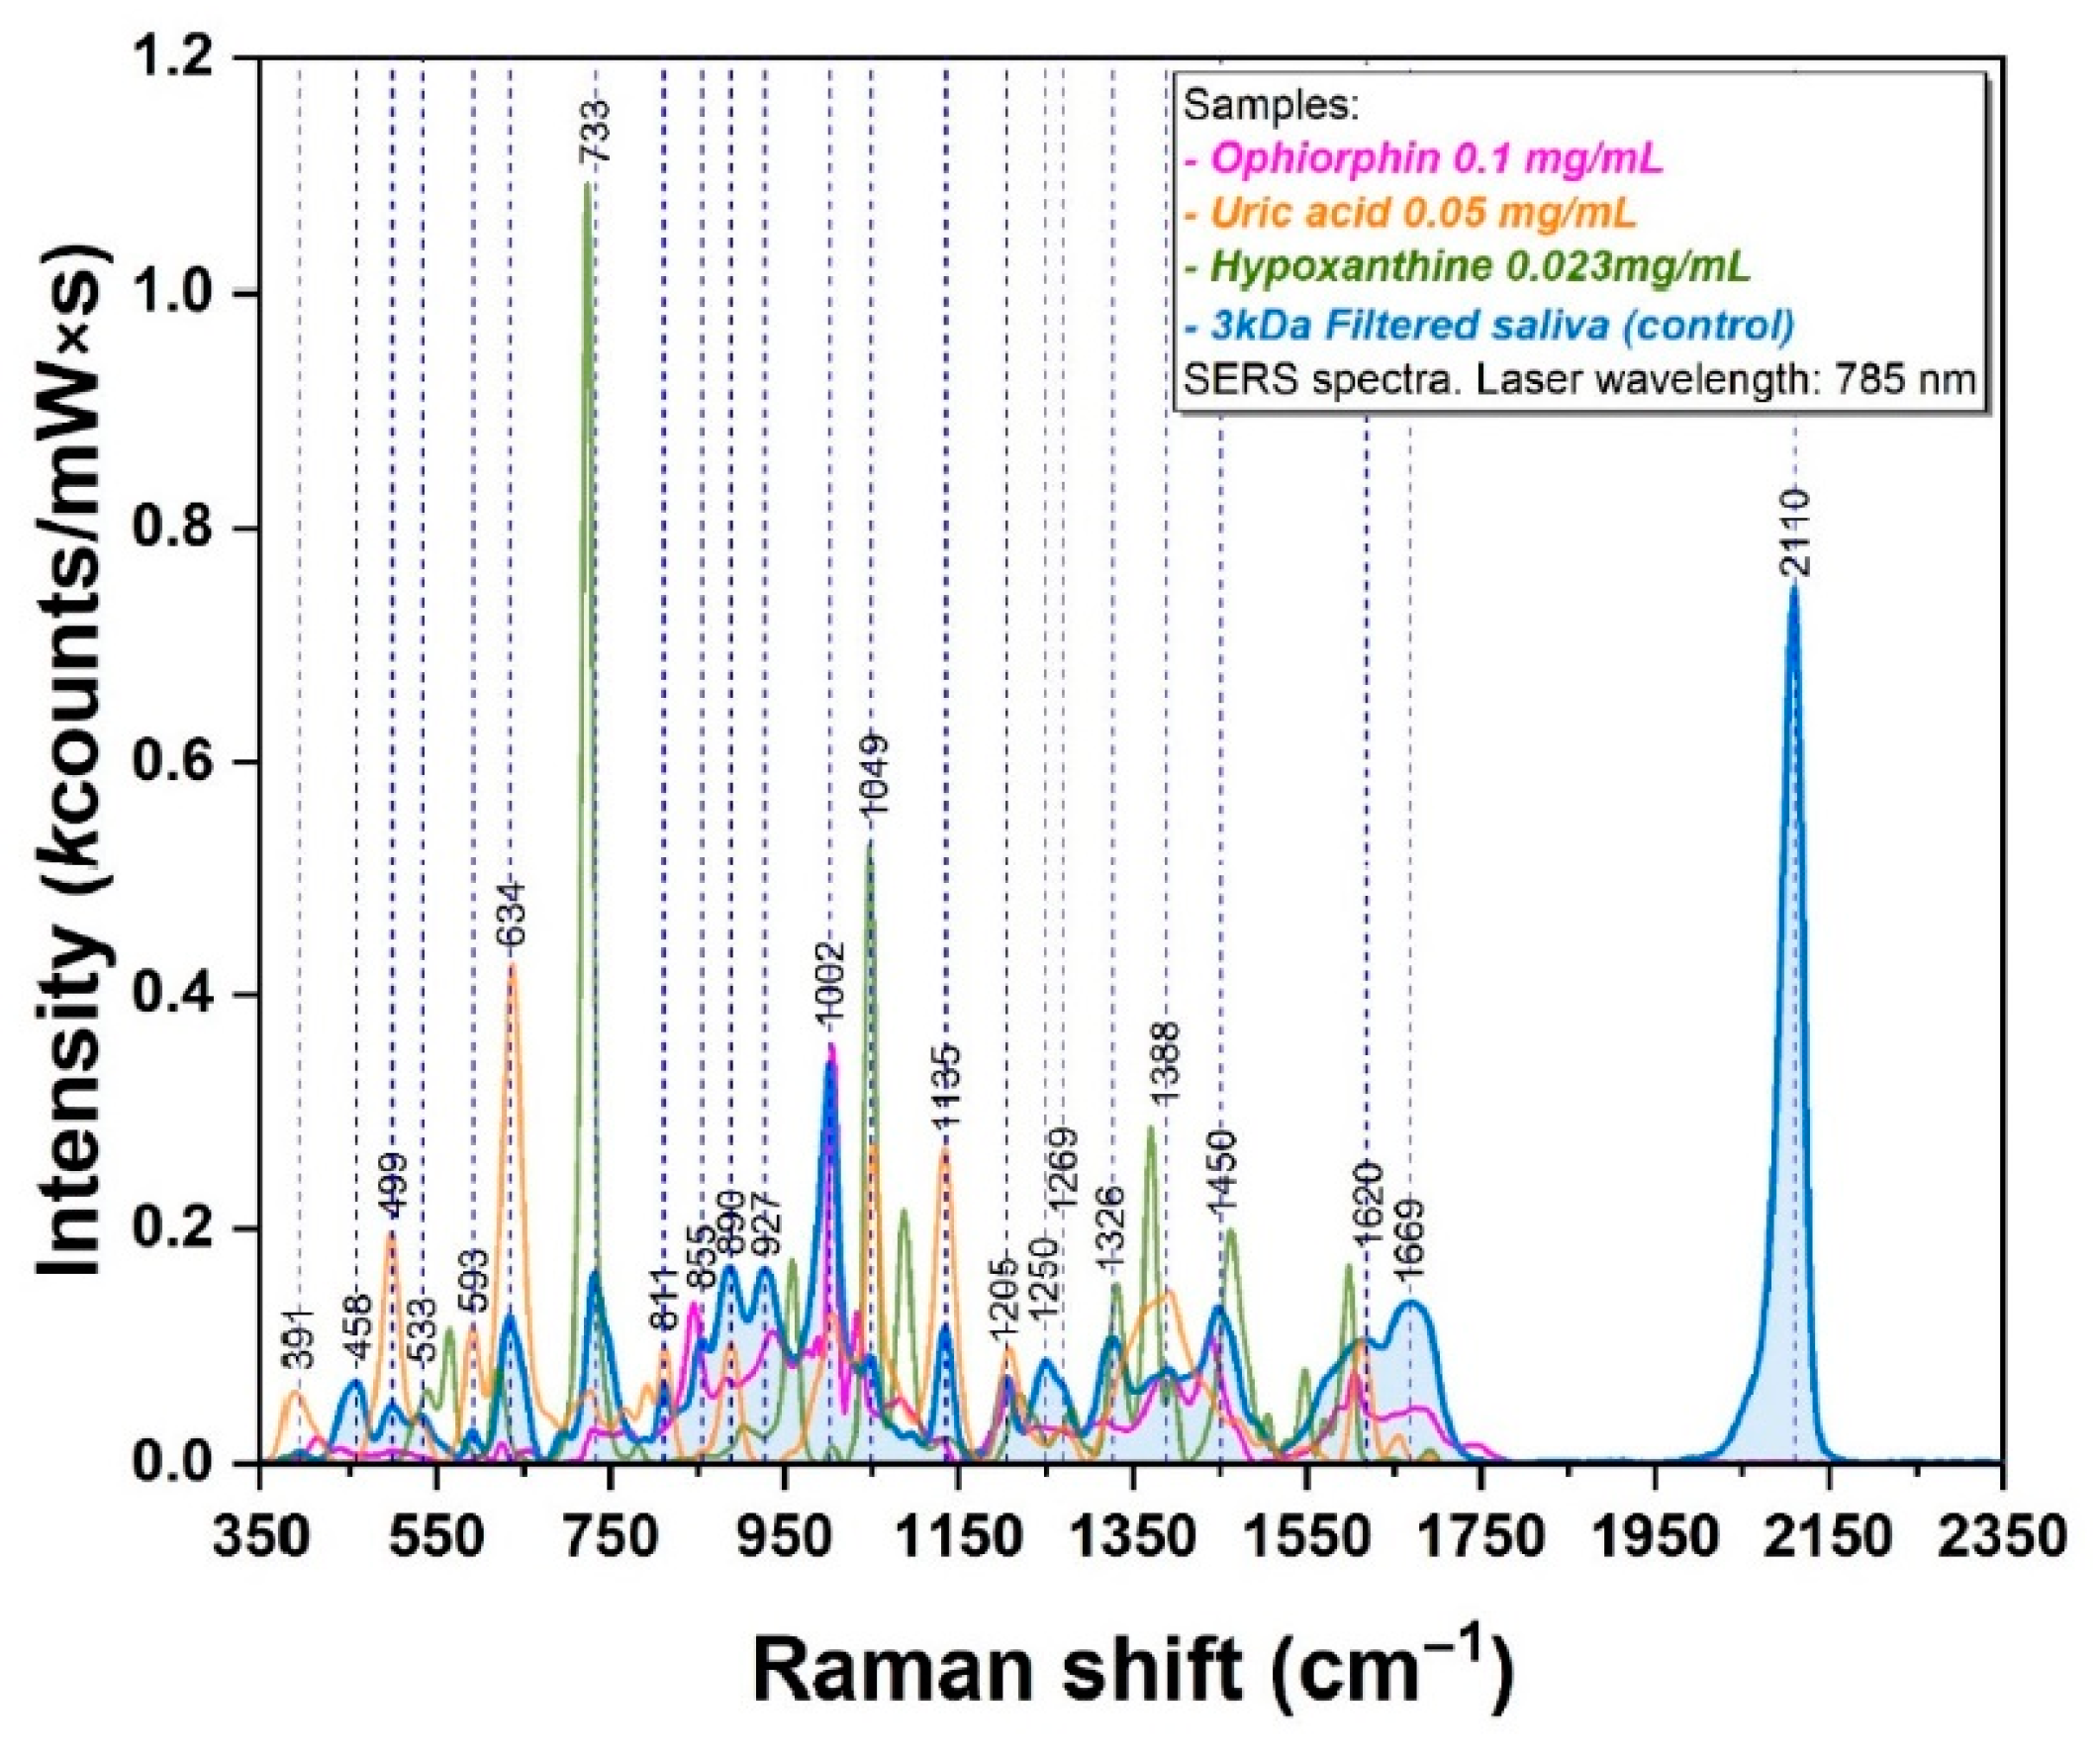
Comment on Borșa et al. Developing New Diagnostic Tools Based on SERS Analysis of Filtered Salivary Samples for Oral Cancer Detection. Int. J. Mol. Sci. 2023, 24, 12125
Abstract
Author Contributions
Funding
Conflicts of Interest
References
- Fornasaro, S.; Alsamad, F.; Baia, M.; Batista de Carvalho, L.A.; Beleites, C.; Byrne, H.J.; Chiadò, A.; Chis, M.; Chisanga, M.; Daniel, A.; et al. Surface enhanced Raman spectroscopy for quantitative analysis: Results of a large-scale European multi-instrument interlaboratory study. Anal. Chem. 2020, 92, 4053–4064. [Google Scholar] [CrossRef] [PubMed]
- Bonifacio, A.; Cervo, S.; Sergo, V. Label-free surface-enhanced Raman spectroscopy of biofluids: Fundamental aspects and diagnostic applications. Anal. Bioanal. Chem. 2015, 407, 8265–8277. [Google Scholar] [CrossRef] [PubMed]
- Chen, S.; Zhang, H.; Yang, X.; Shao, X.; Li, T.; Chen, N.; Chen, Z.; Xue, W.; Pan, J.; Liu, S. Raman Spectroscopy Reveals Abnormal Changes in the Urine Composition of Prostate Cancer: An Application of an Intelligent Diagnostic Model with a Deep Learning Algorithm. Adv. Intell. Syst. 2021, 3, 2000090. [Google Scholar] [CrossRef]
- Bratchenko, L.A.; Al-Sammarraie, S.Z.; Tupikova, E.N.; Konovalova, D.Y.; Lebedev, P.A.; Zakharov, V.P.; Bratchenko, I.A. Analyzing the serum of hemodialysis patients with end-stage chronic kidney disease by means of the combination of SERS and machine learning. Biomed. Opt. Express 2022, 13, 4926–4938. [Google Scholar] [CrossRef]
- Moisoiu, T.; Iancu, S.D.; Burghelea, D.; Dragomir, M.P.; Iacob, G.; Stefancu, A.; Cozan, R.G.; Antal, O.; Bálint, Z.; Muntean, V.; et al. SERS Liquid Biopsy Profiling of Serum for the Diagnosis of Kidney Cancer. Biomedicines 2022, 10, 233. [Google Scholar] [CrossRef]
- Moisoiu, V.; Iancu, S.D.; Stefancu, A.; Moisoiu, T.; Pardini, B.; Dragomir, M.P.; Crisan, N.; Avram, L.; Crisan, D.; Andras, I.; et al. SERS liquid biopsy: An emerging tool for medical diagnosis. Colloids Surf. B Biointerfaces 2021, 208, 112064. [Google Scholar] [CrossRef]
- Esposito, A.; Bonifacio, A.; Sergo, V.; Fornasaro, S. Label-free Surface Enhanced Raman Scattering (SERS) on Centrifugal Silver Plasmonic Paper (CSPP): A Novel Methodology for Unprocessed Biofluids Sampling and Analysis. Biosensors 2021, 11, 467. [Google Scholar] [CrossRef]
- Khristoforova, Y.; Bratchenko, L.; Bratchenko, I. Raman-Based Techniques in Medical Applications for Diagnostic Tasks: A Review. Int. J. Mol. Sci. 2023, 24, 15605. [Google Scholar] [CrossRef]
- Khristoforova, Y.; Bratchenko, L.; Bratchenko, I. Combination of Raman spectroscopy and chemometrics: A review of recent studies published in the Spectrochimica Acta, Part A: Molecular and Biomolecular Spectroscopy Journal. arXiv 2022, arXiv:2210.10051. [Google Scholar] [CrossRef]
- Bratchenko, I.A.; Bratchenko, L.A. Comment on “Serum Raman spectroscopy combined with multiple classification models for rapid diagnosis of breast cancer”. Photodiagn. Photodyn. Ther. 2023, 41, 103215. [Google Scholar] [CrossRef]
- Queral-Beltran, A.; Marín-García, M.; Lacorte, S.; Tauler, R. UV-Vis absorption spectrophotometry and LC-DAD-MS-ESI(+)-ESI(−) coupled to chemometrics analysis of the monitoring of sulfamethoxazole degradation by chlorination, photodegradation, and chlorination/photodegradation. Anal. Chim. Acta 2023, 1276, 341563. [Google Scholar] [CrossRef] [PubMed]
- Kucheryavskiy, S. mdatools—R package for chemometrics. Chemom. Intell. Lab. Syst. 2020, 198, 103937. [Google Scholar] [CrossRef]
- Borșa, R.-M.; Toma, V.; Onaciu, A.; Moldovan, C.-S.; Mărginean, R.; Cenariu, D.; Știufiuc, G.-F.; Dinu, C.-M.; Bran, S.; Opriș, H.-O.; et al. Developing New Diagnostic Tools Based on SERS Analysis of Filtered Salivary Samples for Oral Cancer Detection. Int. J. Mol. Sci. 2023, 24, 12125. [Google Scholar] [CrossRef] [PubMed]
- Al-Sammarraie, S.Z.; Bratchenko, L.A.; Typikova, E.N.; Zakharov, V.P.; Bratchenko, I.A.; Lebedev, P.A. Silver nanoparticles-based substrate for blood serum analysis under 785 nm laser excitation. J. Biomed. Photonics Eng. 2022, 8, 010301. [Google Scholar] [CrossRef]
- Jolliffe, I.T. Principal Component Analysis, 2nd ed.; Springer Series in Statistics: New York, NY, USA, 2002. [Google Scholar]
- Bratchenko, L.A.; Bratchenko, I.A.; Khristoforova, Y.A.; Artemyev, D.N.; Konovalova, D.Y.; Lebedev, P.A.; Zakharov, V.P. Raman spectroscopy of human skin for kidney failure detection. J. Biophotonics 2021, 14, e202000360. [Google Scholar] [CrossRef]
- Bratchenko, I.A.; Bratchenko, L.A. Comment on “Combining derivative Raman with autofluorescence to improve the diagnosis performance of echinococcosis”. Spectrochim. Acta Part A Mol. Biomol. Spectrosc. 2021, 252, 119514. [Google Scholar] [CrossRef]
- Brkljačić, L.; Sabalić, M.; Salarić, I.; Jerić, I.; Alajbeg, I.; Nemet, I. Development and validation of a liquid chromatography-tandem mass spectrometry method for the quantification of opiorphin in human saliva. J. Chromatogr. B 2011, 879, 3920–3926. [Google Scholar] [CrossRef]
- Jaiswal, A.; Madaan, S.; Acharya, N.; Kumar, S.; Talwar, D.; Dewani, D. Salivary Uric Acid: A Noninvasive Wonder for Clinicians? Cureus 2021, 13, e19649. [Google Scholar] [CrossRef]
- Zlotogorski-Hurvitz, A.; Dayan, D.; Chaushu, G.; Korvala, J.; Salo, T.; Sormunen, R.; Vered, M. Human Saliva-Derived Exosomes. J. Histochem. Cytochem. 2015, 63, 181–189. [Google Scholar] [CrossRef]
- Parlatan, U.; Ozen, M.O.; Kecoglu, I.; Koyuncu, B.; Torun, H.; Khalafkhany, D.; Loc, I.; Ogut, M.G.; Inci, F.; Akin, D.; et al. Label-Free Identification of Exosomes using Raman Spectroscopy and Machine Learning. Small 2023, 19, 2205519. [Google Scholar] [CrossRef]
- Bonifacio, A. Label free SERS for clinical applications. In Principles and Clinical Applications of SERS; Wang, Y., Ed.; Elsevier: Amsterdam, The Netherlands, 2021; ISBN 9780128231982. [Google Scholar]
- Gurian, E.; Di Silvestre, A.; Mitri, E.; Pascut, D.; Tiribelli, C.; Giuffrè, M.; Crocè, L.S.; Sergo, V.; Bonifacio, A. Repeated double cross-validation applied to the PCA-LDA classification of SERS spectra: A case study with serum samples from hepatocellular carcinoma patients. Anal. Bioanal. Chem. 2021, 413, 1303–1312. [Google Scholar] [CrossRef] [PubMed]


Disclaimer/Publisher’s Note: The statements, opinions and data contained in all publications are solely those of the individual author(s) and contributor(s) and not of MDPI and/or the editor(s). MDPI and/or the editor(s) disclaim responsibility for any injury to people or property resulting from any ideas, methods, instructions or products referred to in the content. |
© 2024 by the authors. Licensee MDPI, Basel, Switzerland. This article is an open access article distributed under the terms and conditions of the Creative Commons Attribution (CC BY) license (https://creativecommons.org/licenses/by/4.0/).
Share and Cite
Bratchenko, I.; Bratchenko, L. Comment on Borșa et al. Developing New Diagnostic Tools Based on SERS Analysis of Filtered Salivary Samples for Oral Cancer Detection. Int. J. Mol. Sci. 2023, 24, 12125. Int. J. Mol. Sci. 2024, 25, 13030. https://doi.org/10.3390/ijms252313030
Bratchenko I, Bratchenko L. Comment on Borșa et al. Developing New Diagnostic Tools Based on SERS Analysis of Filtered Salivary Samples for Oral Cancer Detection. Int. J. Mol. Sci. 2023, 24, 12125. International Journal of Molecular Sciences. 2024; 25(23):13030. https://doi.org/10.3390/ijms252313030
Chicago/Turabian StyleBratchenko, Ivan, and Lyudmila Bratchenko. 2024. "Comment on Borșa et al. Developing New Diagnostic Tools Based on SERS Analysis of Filtered Salivary Samples for Oral Cancer Detection. Int. J. Mol. Sci. 2023, 24, 12125" International Journal of Molecular Sciences 25, no. 23: 13030. https://doi.org/10.3390/ijms252313030
APA StyleBratchenko, I., & Bratchenko, L. (2024). Comment on Borșa et al. Developing New Diagnostic Tools Based on SERS Analysis of Filtered Salivary Samples for Oral Cancer Detection. Int. J. Mol. Sci. 2023, 24, 12125. International Journal of Molecular Sciences, 25(23), 13030. https://doi.org/10.3390/ijms252313030


