Article

Epigenetic Regulation of Anthocyanin Biosynthesis in Betula pendula ‘Purple Rain’

1
State Key Laboratory of Tree Genetics and Breeding, Chinese Academy of Forestry, Northeast Forestry University, Harbin 150040, China
2
College of Life Science, Northeast Forestry University, Harbin 150040, China
*
Authors to whom correspondence should be addressed.
Int. J. Mol. Sci. 2024, 25(22), 12030; https://doi.org/10.3390/ijms252212030
Submission received: 20 October 2024 / Revised: 3 November 2024 / Accepted: 7 November 2024 / Published: 8 November 2024
(This article belongs to the Special Issue Recent Advances in Epigenetics in Plant Research)

Abstract

:
Betula pendula ‘Purple Rain’ is characterized by its purple leaves and has ornamental applications. A green mutant line NL, which was mutated by line NZ of B. pendula ‘Purple Rain’ during tissue culture, shows green leaves instead of the typical purple color of B. pendula ‘Purple Rain’. This study quantified the leaf color traits of NL and a normal B. pendula ‘Purple Rain’ line NZ, and uncovered differentially expressed genes involved in flavonoid biosynthesis pathway genes in NL through RNA-Seq analysis. Compared to NZ, reduced levels of six anthocyanins contained in NL were revealed via flavonoids-targeted metabolomics. Sequence mutations in transcription factors that could explain NL’s phenotype failed to be screened via whole-genome resequencing, suggesting an epigenetic basis for this variant. Therefore, a key gene, BpMYB113, was identified in NL via the combined analysis of small RNA sequencing, whole-genome methylation sequencing, and transcriptomics. In NL, this gene features a hyper CHH context methylation site and a lower transcription level compared to NZ, disrupting the expression of downstream genes in the phenylalanine metabolism pathway, and thereby reducing flavonoid biosynthesis. Our study elucidates an epigenetic mechanism underlying color variation in variegated trees, providing pivotal insights for the breeding and propagation of colored-leaf tree species.

1. Introduction

Ornamental foliage plants, characterized by their prolonged aesthetic appeal, high color intensity, and diverse coloration, have become integral components in contemporary landscape architecture. Leaf coloration primarily results from variations in the proportions of chlorophyll, carotenoids, and flavonoids, with flavonoids playing a dominant role. Flavonoids constitute a broad class of compounds unified by a common C6-C3-C6 structure, formed by two benzene rings linked through three carbon atoms, exhibiting extensive diversity and commonly classified into anthocyanins, proanthocyanins, flavonols, isoflavones, flavanones, and flavones [1,2]. Flavonoid compounds possess functionalities to mitigate both biotic and abiotic stresses, and they also hold significant positions in medicine and pharmaceuticals, and as nutritional compounds [3]. Anthocyanins are the predominant flavonoid pigments responsible for the reddish or purple hues observed in plant tissues. The anthocyanin biosynthetic pathway, conserved among higher plants, initiates with cytoplasmic phenylalanine and proceeds through a series of enzymatic reactions catalyzed by phenylalanine ammonia-lyase (PAL), cinnamate 4-hydroxylase (C4H), 4-coumarate-CoA ligase (4CL), chalcone synthase (CHS), chalcone isomerase (CHI), flavonoid 3′-hydroxylase (F3′H), flavanone 3-hydroxylase (F3H), dihydroflavonol 4-reductase (DFR), and anthocyanidin synthase (ANS) [4,5,6]. The levels of these flavonoids and their intermediates in the biosynthetic pathway can be quantified using metabolomics techniques, such as ultra-performance liquid chromatography coupled with tandem mass spectrometry (UPLC-MS/MS), which offers high sensitivity and resolution. Integrating these metabolic profiling outcomes with transcriptomic sequencing data facilitates an in-depth investigation into the variations occurring at different stages of the anthocyanin biosynthesis pathway [2,7,8].
Anthocyanin biosynthesis is predominantly regulated by three classes of transcription factors, MYB, bHLH, and WDR, which together form the MBW complex [9]. The sequences of the MYB domain are highly conserved. Gene subfamilies containing two to three repeats of this conserved MYB motif are designated as R2R3-MYB. Within the MBW complex, R2R3-MYB family proteins play a principal role, typically exerting positive control over anthocyanin synthesis [10,11,12,13]. MYB113 and MYB114 share sequence similarities and belong to the R2R3-MYB subfamily [14]. These MYB proteins positively modulate anthocyanin synthesis [15], functioning as key inducers of anthocyanin production in trees, exemplified by EgrMYB113 in Eucalyptus grandis [16], XsMYB113-1 in Xanthoceras sorbifolium [17], the MYB113-like transcription factor GbBM in Gossypium hirsutum [18], and MdMYB114 in Malus domestica [19]. Furthermore, several additional transcription factors, including COP1 [20,21], JAZ [20], NAC [22], SPL [23], and WRKY [24], can influence anthocyanin biosynthesis through interactions with the MBW complex, thereby exerting secondary regulatory effects on anthocyanin content in plants.
DNA methylation in plants constitutes a chemical modification (5mC) of genomic cytosines, capable of altering gene expression without modifying sequences. It is widely regarded that DNA methylation suppresses gene expression [25]. This suppression arises from the reduction in negative charges on the DNA molecule, leading to reduced chromatin accessibility, and by impairing the binding efficiency of transcription factors to DNA [25]. Based on a kind of siRNA mainly measuring 24 nt in length, RdDM represents a plant-specific mechanism for the establishment and maintenance of DNA methylation, which enable the stable heritability of asymmetric CHH methylation patterns in genomic DNA [26,27,28].
Betula pendula ‘Purple Rain’ (Figure 1A–C, left), distinguished by its purple leaves [29] and notable resistance to abiotic stresses [30], holds promise for both afforestation and ornamental applications. Previous studies have identified functional genes involved in the anthocyanin biosynthesis pathway of Purple Rain birch [31]; however, the key transcription factors governing these genes remain elusive. Through tissue culture, a green mutant line NL was derived from the clone NZ of B. pendula ‘Purple Rain’, exhibiting diminished purple coloration in young leaves and a near-complete loss in mature ones (Figure 1A–C, right). The green leaf phenotype of NL was consistently maintained through asexual reproduction. This study employs a multi-omics sequencing approach to compare the B. pendula ‘Purple Rain’ clone NZ with its green mutant NL, elucidating the molecular mechanisms underlying pigment production and maintenance in variegated plants, thereby furnishing a theoretical framework for advancing genetic breeding in such plants.

2. Results

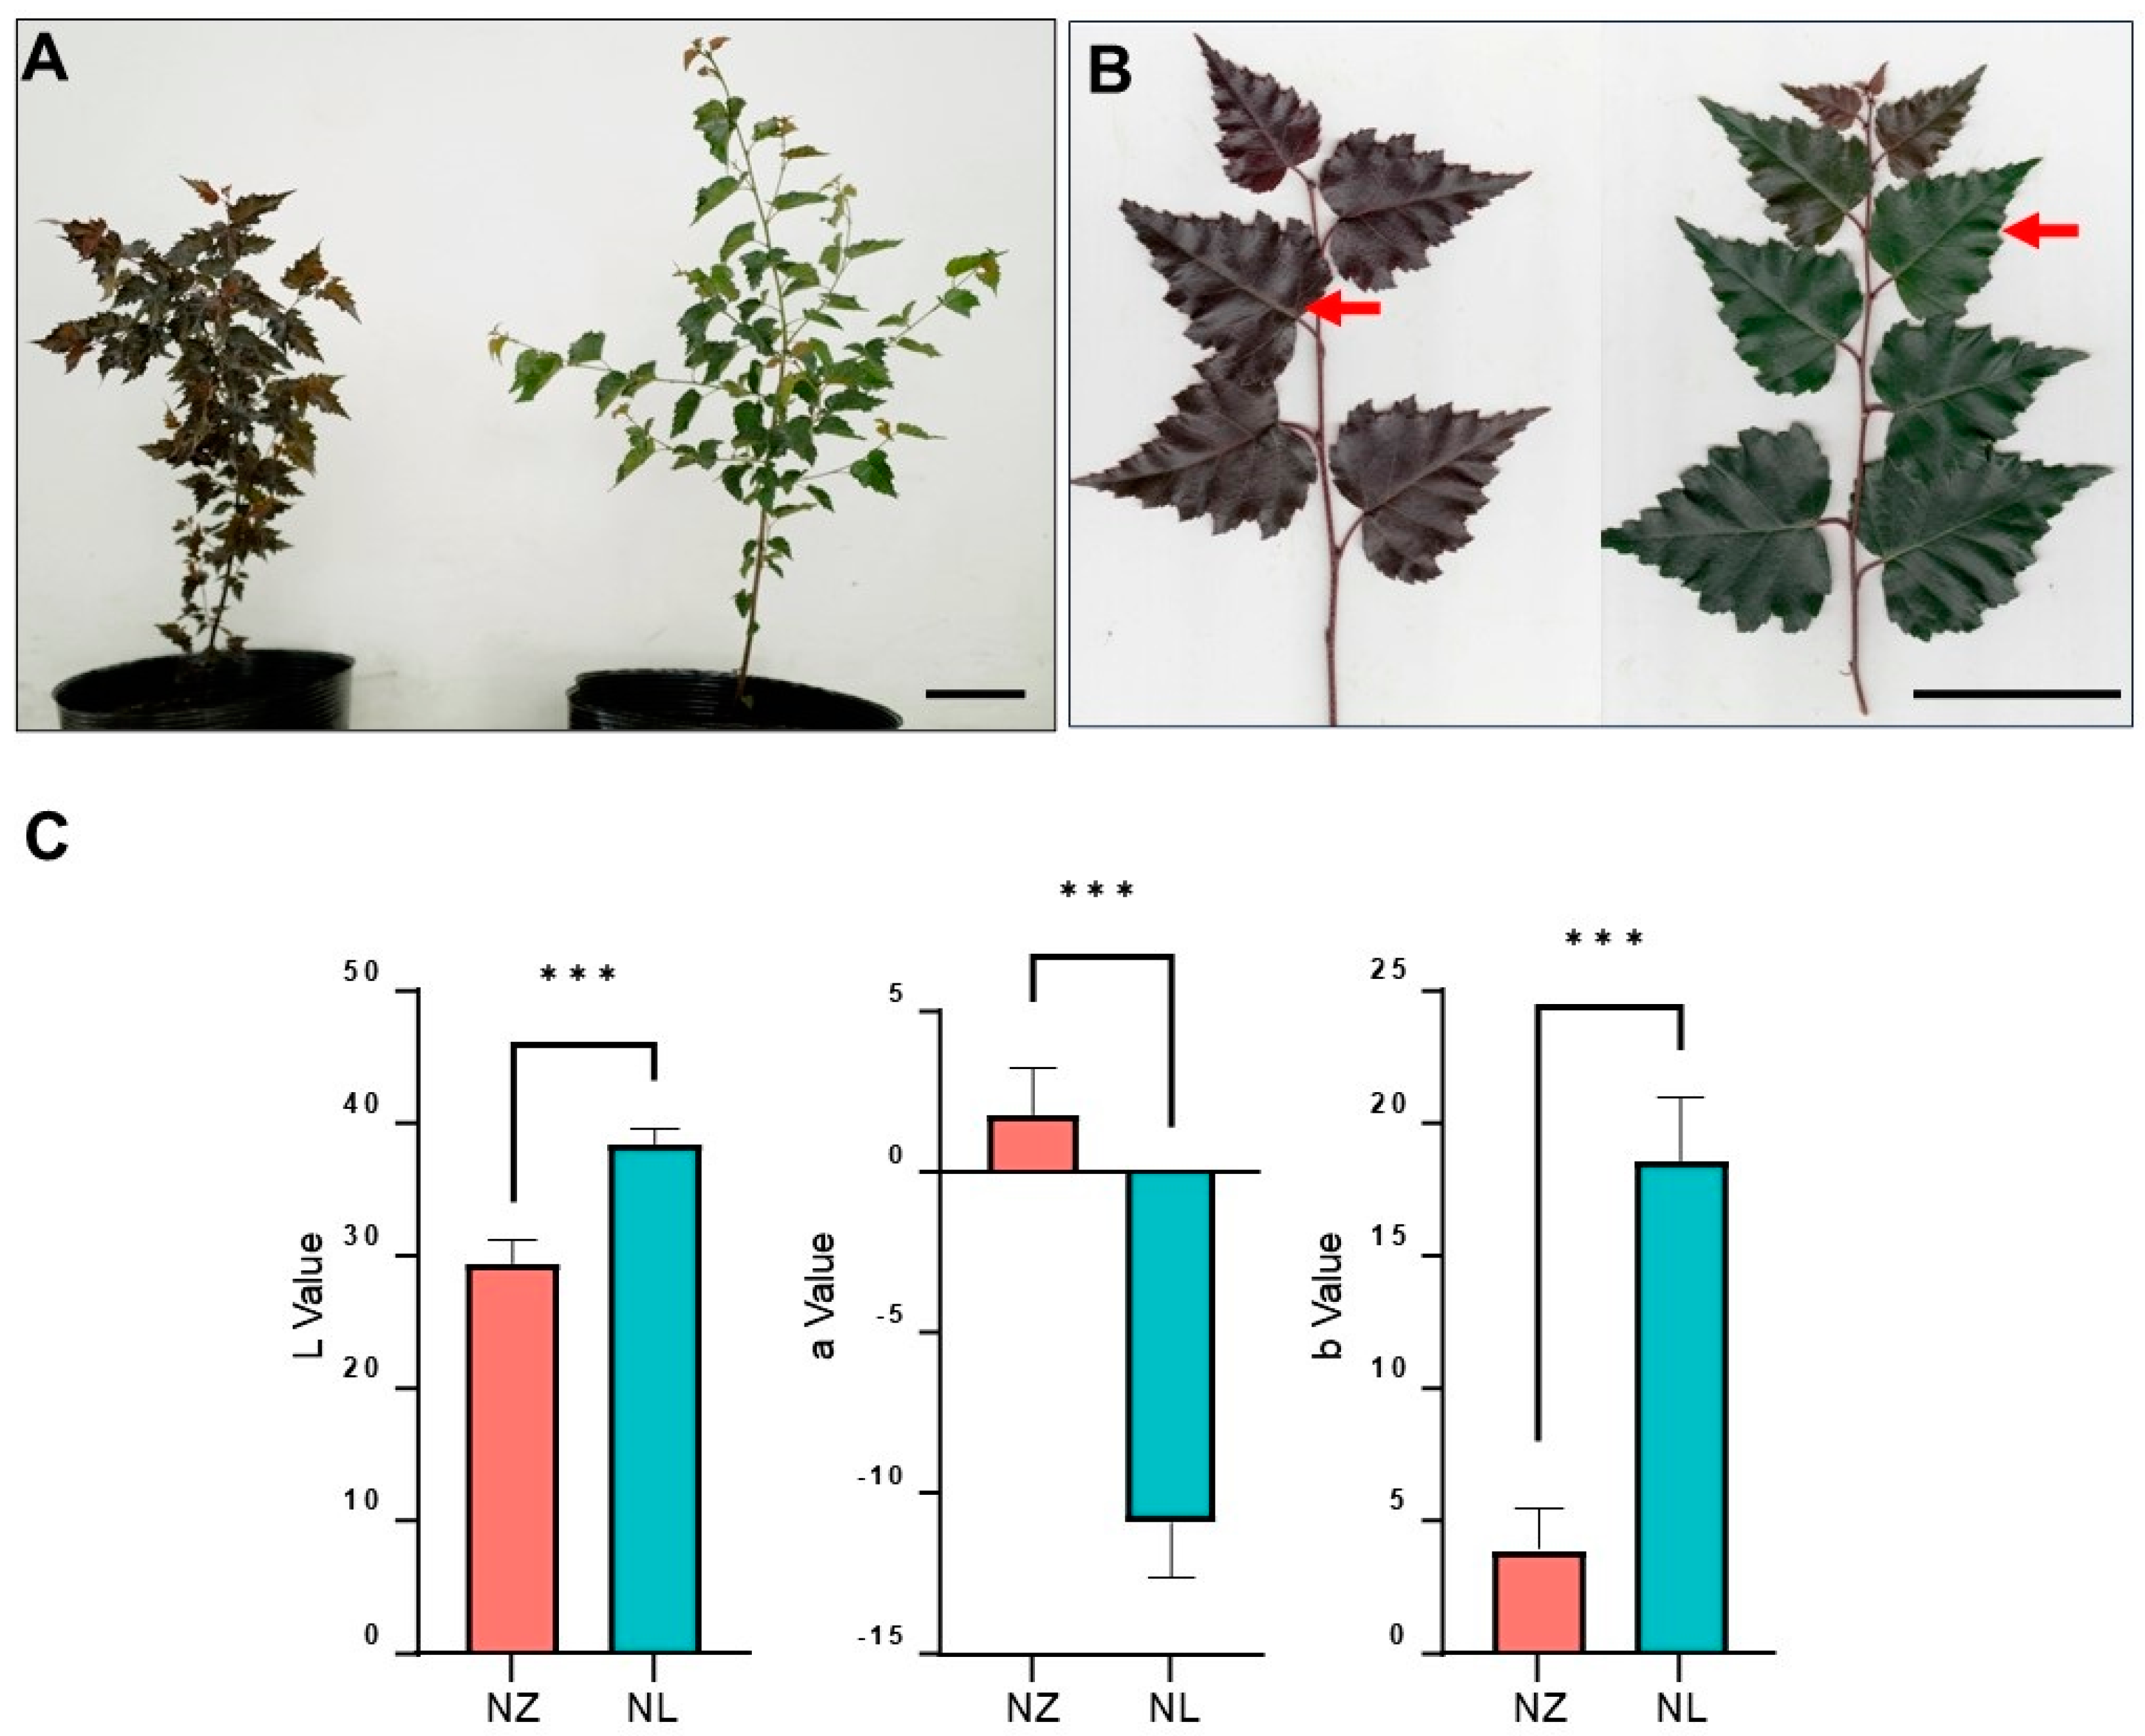
2.1. Leaf Color Phenotype Difference

The mutant NL exhibited leaf coloration that was lighter than that of the wild-type NZ during tissue culture (Supplementary Figure S1). Upon transplantation outdoors, juvenile leaves of NL displayed a weaker purple hue compared to NZ, with the purple coloration in the mature leaves nearly vanishing (Figure 1A). In June, the intermediate leaves of the mutant line NL (Figure 1B) exhibited a deep green color (L* = 38.54, a* = −10.09, b* = 18.65), contrasting with the purple tone of the B. pendula ‘Purple Rain’ NZ (L* = 29.57, a* = 1.84, b* = 3.96) (Figure 1C).

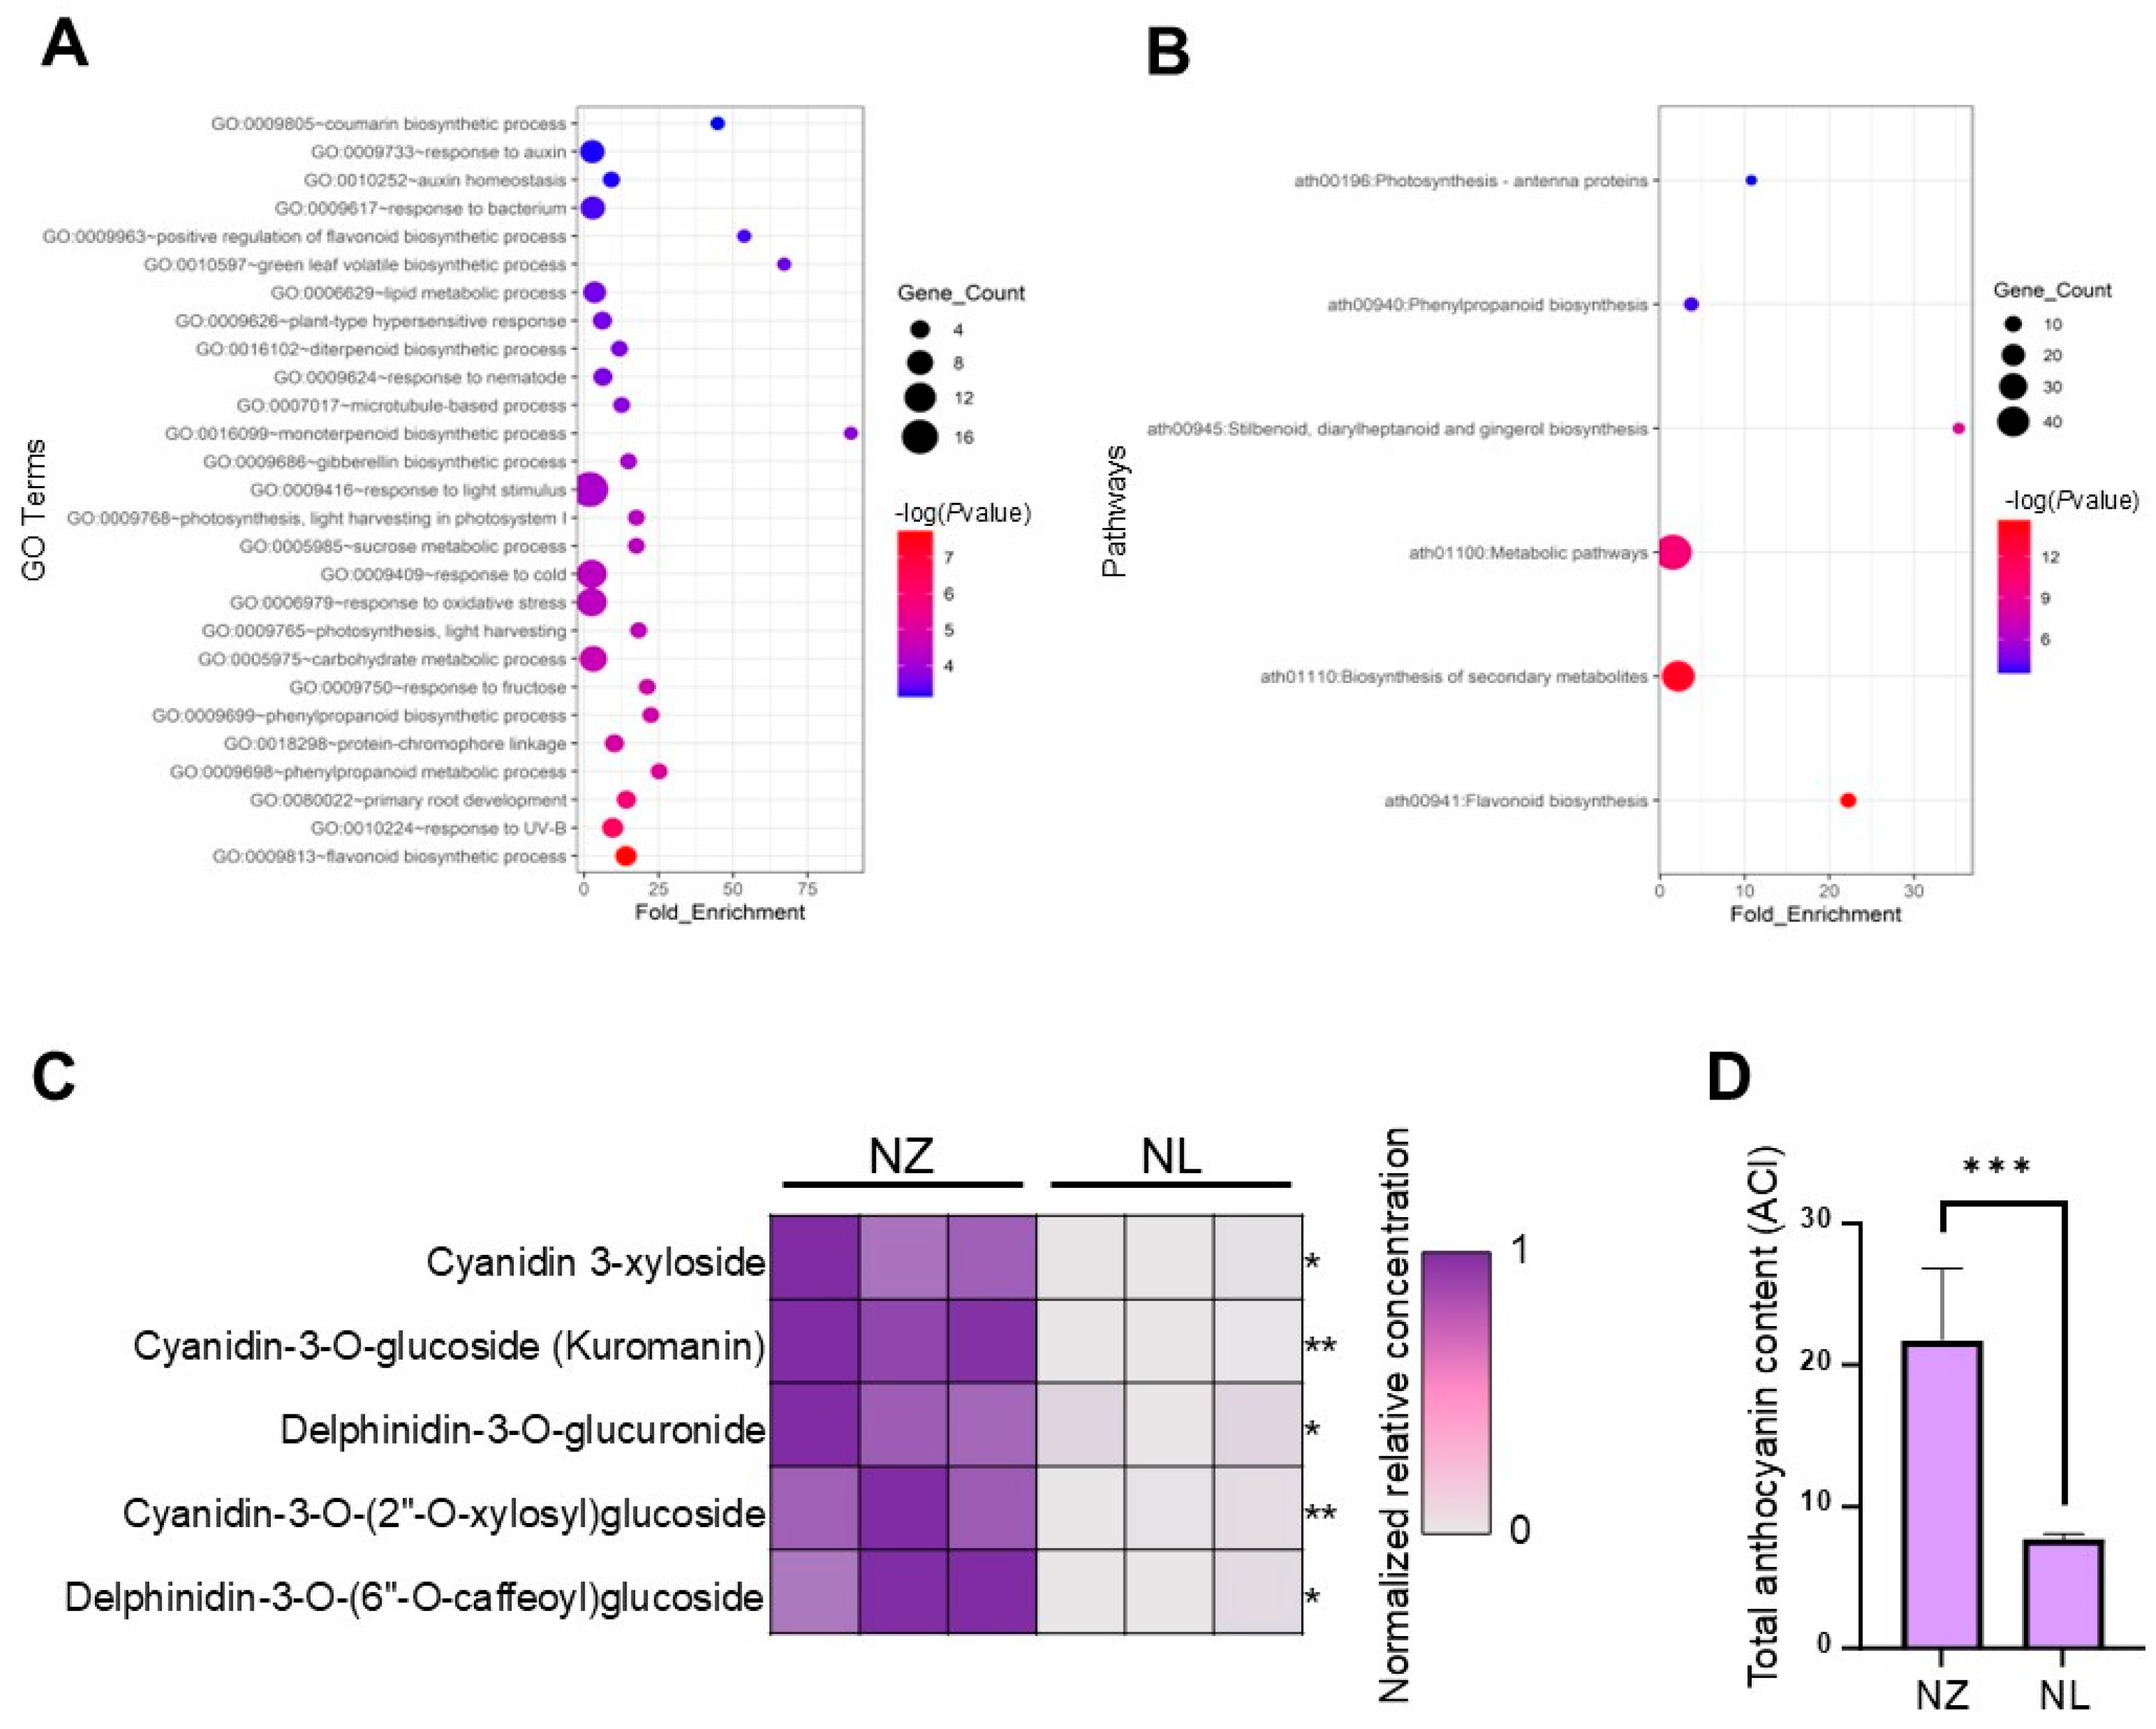
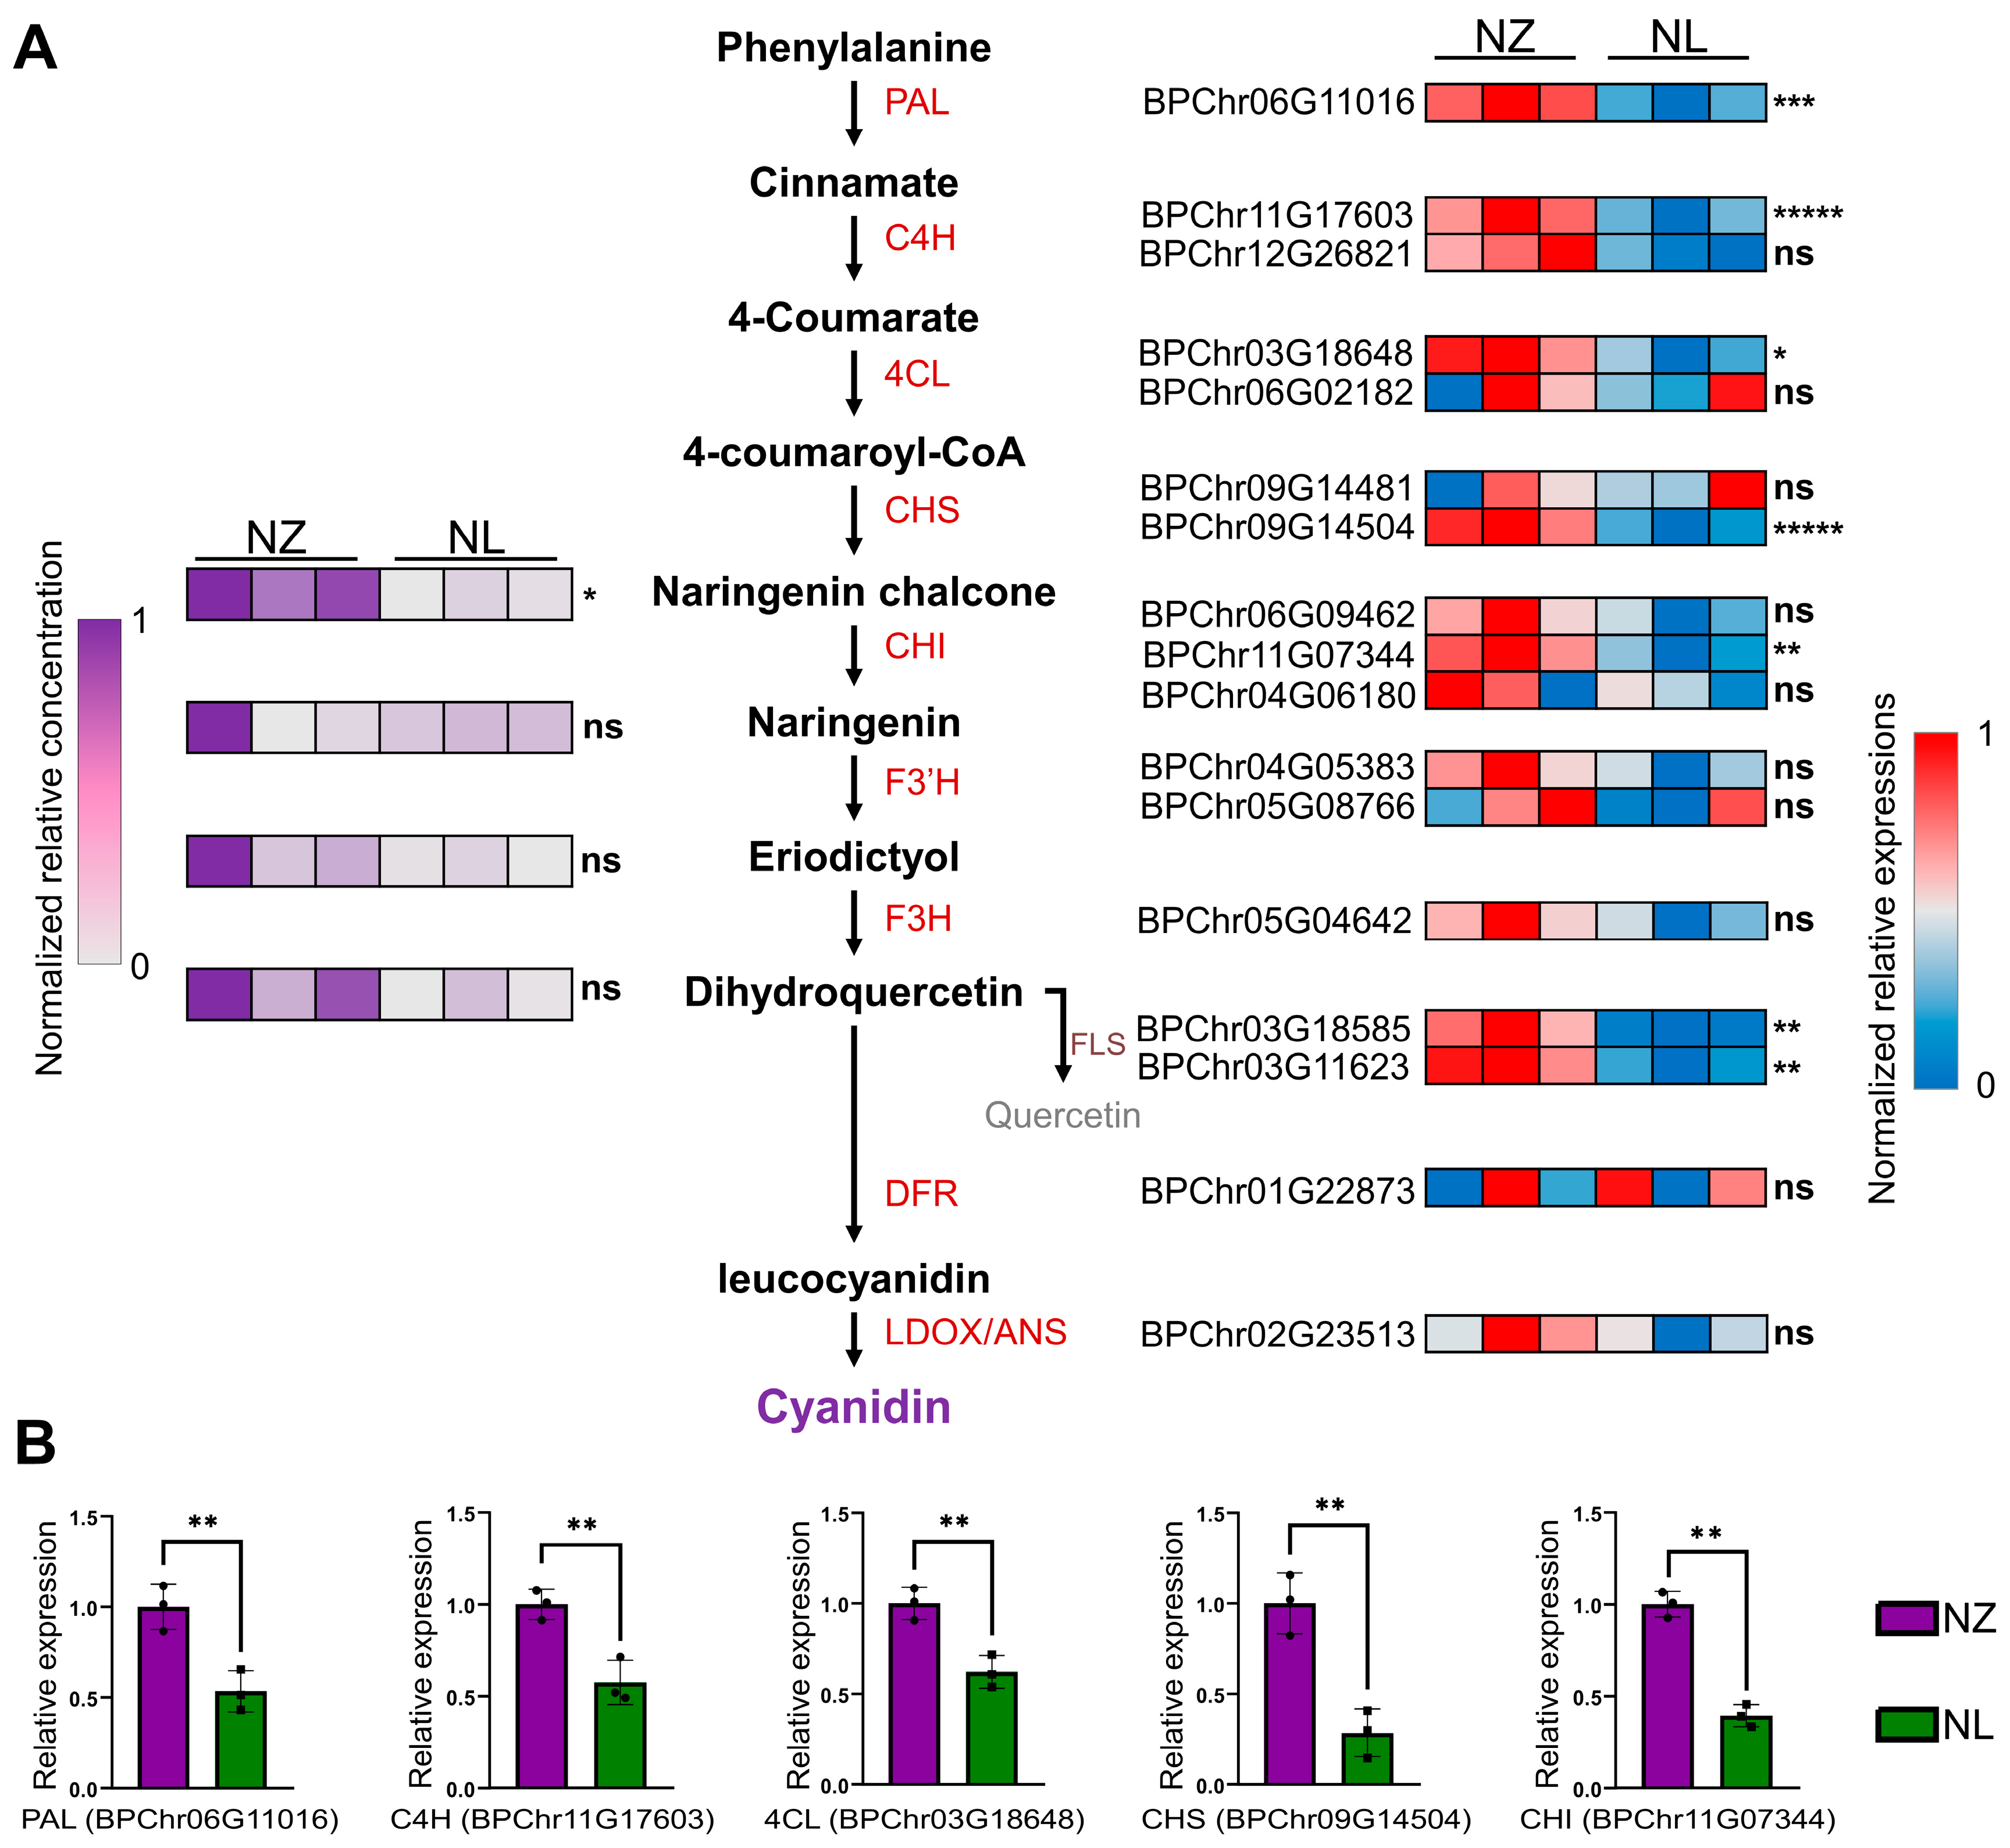
2.2. RNA-Seq and Metabolomic Analysis Showed That the Anthocyanin Biosynthesis Pathway Was Down-Regulated by Changes in Some TFs

To further determine the molecular mechanisms underlying the leaf color of B. pendula ‘Purple Rain’, we carried out RNA-Seq analysis. A total of 87.9 Gb of clean RNA-Seq data was acquired, with an average mapping rate to the reference Betula genome of 94.28%. The principal component analysis (Supplementary Figure S2A) and correlation heatmap (Supplementary Figure S2B) revealed a clear separation of gene expression profiles between the NZ and NL clones.
In total, 18,738 genes were found to be expressed in either NZ or NL, among which 464 genes with expressions of Padj ≤ 0.01 and |log2FC| ≥ 1.0 were selected as differentially expressed genes (DEGs) (Supplementary Figure S2C). These DEGs were significantly enriched in thirteen pathways, including phenylalanine metabolism and flavonoid biosynthesis (Figure 2A,B). Enrichment analyses for other sets of differential genes are detailed in Supplementary Table S2. Given that the phenylalanine metabolism pathway and the flavonoid biosynthesis pathway impact anthocyanin synthesis, it is inferred that anthocyanins are the principal pigments underlying the color difference between NL and NZ. To substantiate this, targeted metabolomics using UPLC-MS/MS was employed to quantify anthocyanins in NL and NZ, revealing a significant reduction in five anthocyanins in the NL (Figure 2C). Consequently, the anthocyanin content in the NL leaves was found to be less than 40% of that in the NZ (Figure 2D).
To elucidate the specific alterations in the anthocyanin biosynthesis process of NL, an integrative analysis was conducted, correlating gene expression profiles along the anthocyanin biosynthetic pathway with flavonoid metabolomics. The findings revealed diminished expression of PAL, C4Hs, 4CL, CHS, and CHI (Figure 3A, right), which consequently led to reduced naringenin chalcone levels in NL (Figure 3A, left), with chalcone being a pivotal precursor for anthocyanin biosynthesis. Additional flavonoid metabolomic data are provided in Supplementary Table S3. The down-regulated transcription levels of PAL, C4Hs, 4CL, CHS, and CHI in NL were further validated by qRT-PCR (Figure 3B). In the NL, a decrease in the transcription of genes involved in chalcone synthesis within the phenylalanine metabolic pathway was observed, which indicates that some of the transcription factors that could activate this pathway have a reduction or destruction of function, or that an abnormal function enhancement exists in the transcription repressor factors that down-regulate this pathway. A WGS was then deployed to reveal this variated transcription factor.

2.3. SNPs/InDels Mutations Are Not Supported as a Cause of Phenotypic Variation

To explore the potential genetic variations regarding the leaf color changes, we performed WGS in the NZ and NL. A total of 131 Gbp of raw WGS data was obtained from NZ and NL, with Q30 scores exceeding 90%. For the sake of the rigor of the SNP analysis, only reads for high-quality alignment (screened by SAMtools with ‘-q’ parameter = 20) were retained. Among these high-quality reads, SNP calling was performed with only pair ends that were perfectly aligned to the genome with a positive and negative pair (screened by SAMtools with ‘-f’ parameter = 2). These reads, which are of high quality and correctly aligned, account for 75.26% of the total data and yielded 304,215,255 pairs of high-quality reads, from which 10,211,111 SNPs/InDels markers were retained from NZ and NL. A principal component analysis (PCA), incorporating SNP data from five green-leaf wild-type B. pendula, indicated that NL and NZ belong to the same clonal lineage (Supplementary Figure S3). A total of 7552 mutations with distinct genotypes were identified, comprising 139 non-synonymous mutations affecting 127 genes. According to the annotation results (Supplementary Table S4), none of these variant genes were recognized as transcription factors influencing anthocyanin accumulation genes PAL, C4Hs, 4CL, CHS, and CHI, at the same time as the result of the RNA-Seq. Although a non-synonymous mutation was found in BPChr06G11016 (PAL2), the diminished ability to synthesize anthocyanins should not be attributed to variation in this single gene, otherwise the reduction in other functional genes cannot be explained. SNPs/InDels mutations are not thought to be responsible for the leaf color changes in B. pendula ‘Purple Rain’ during tissue cultures.

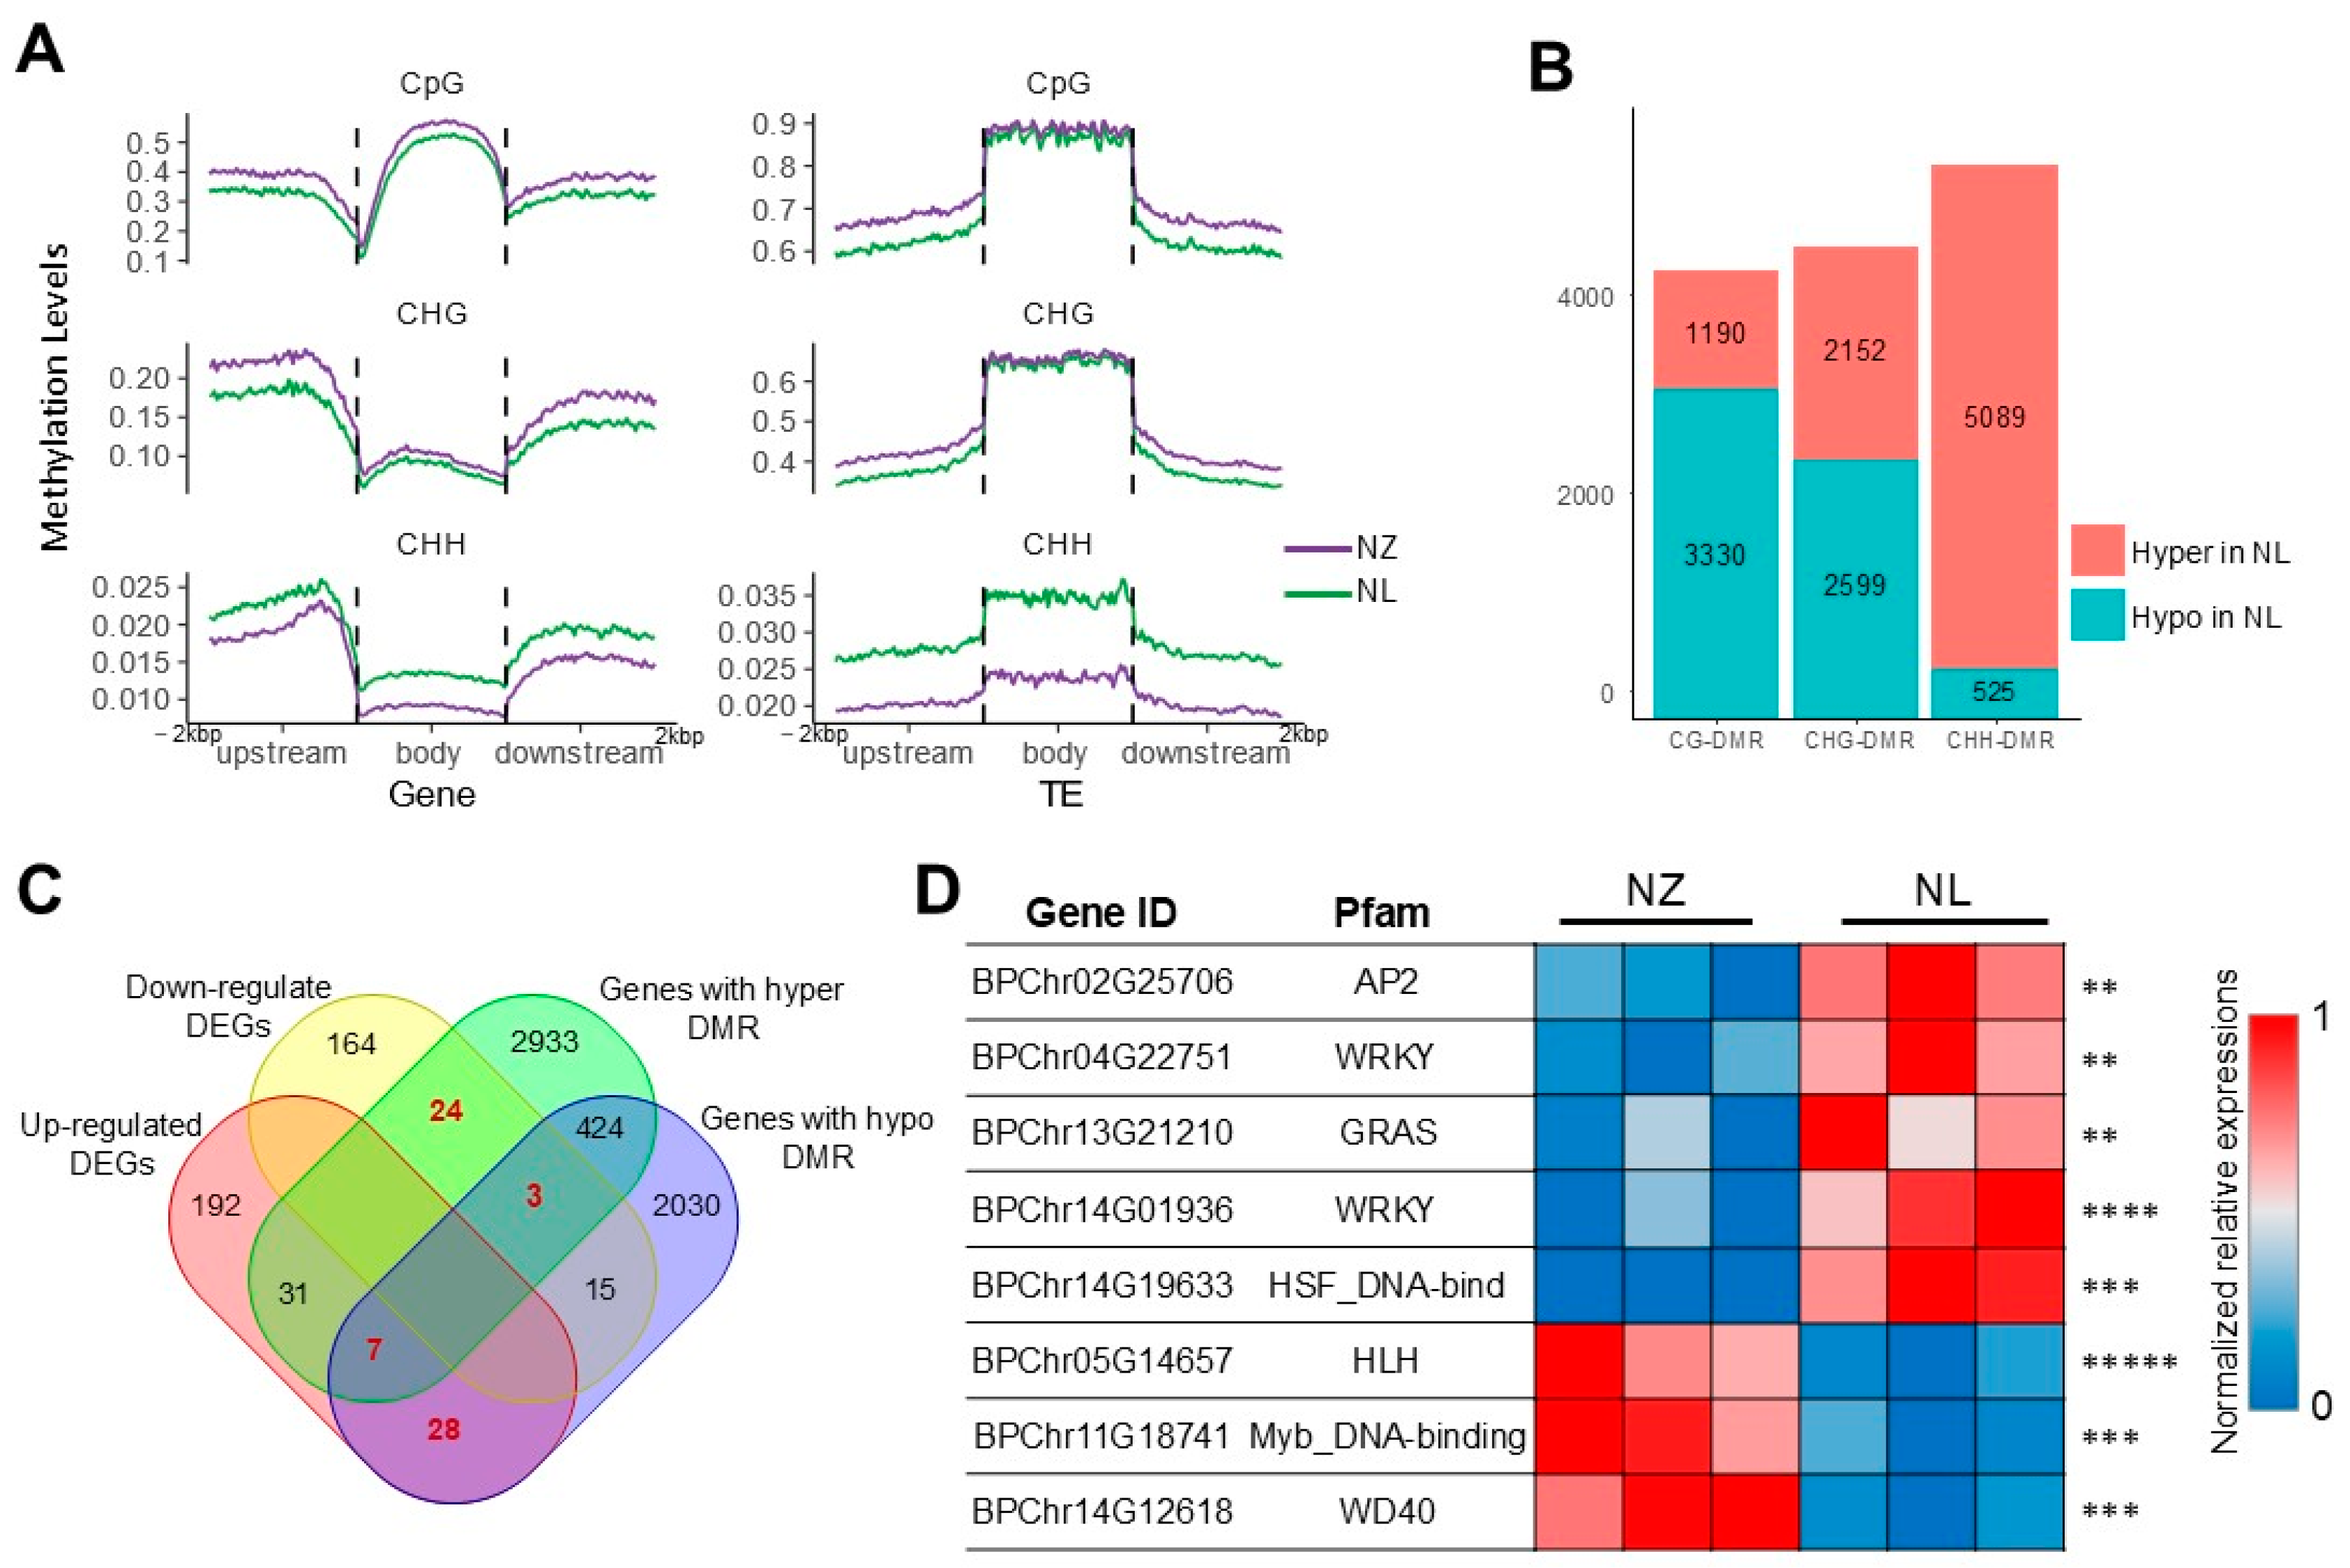
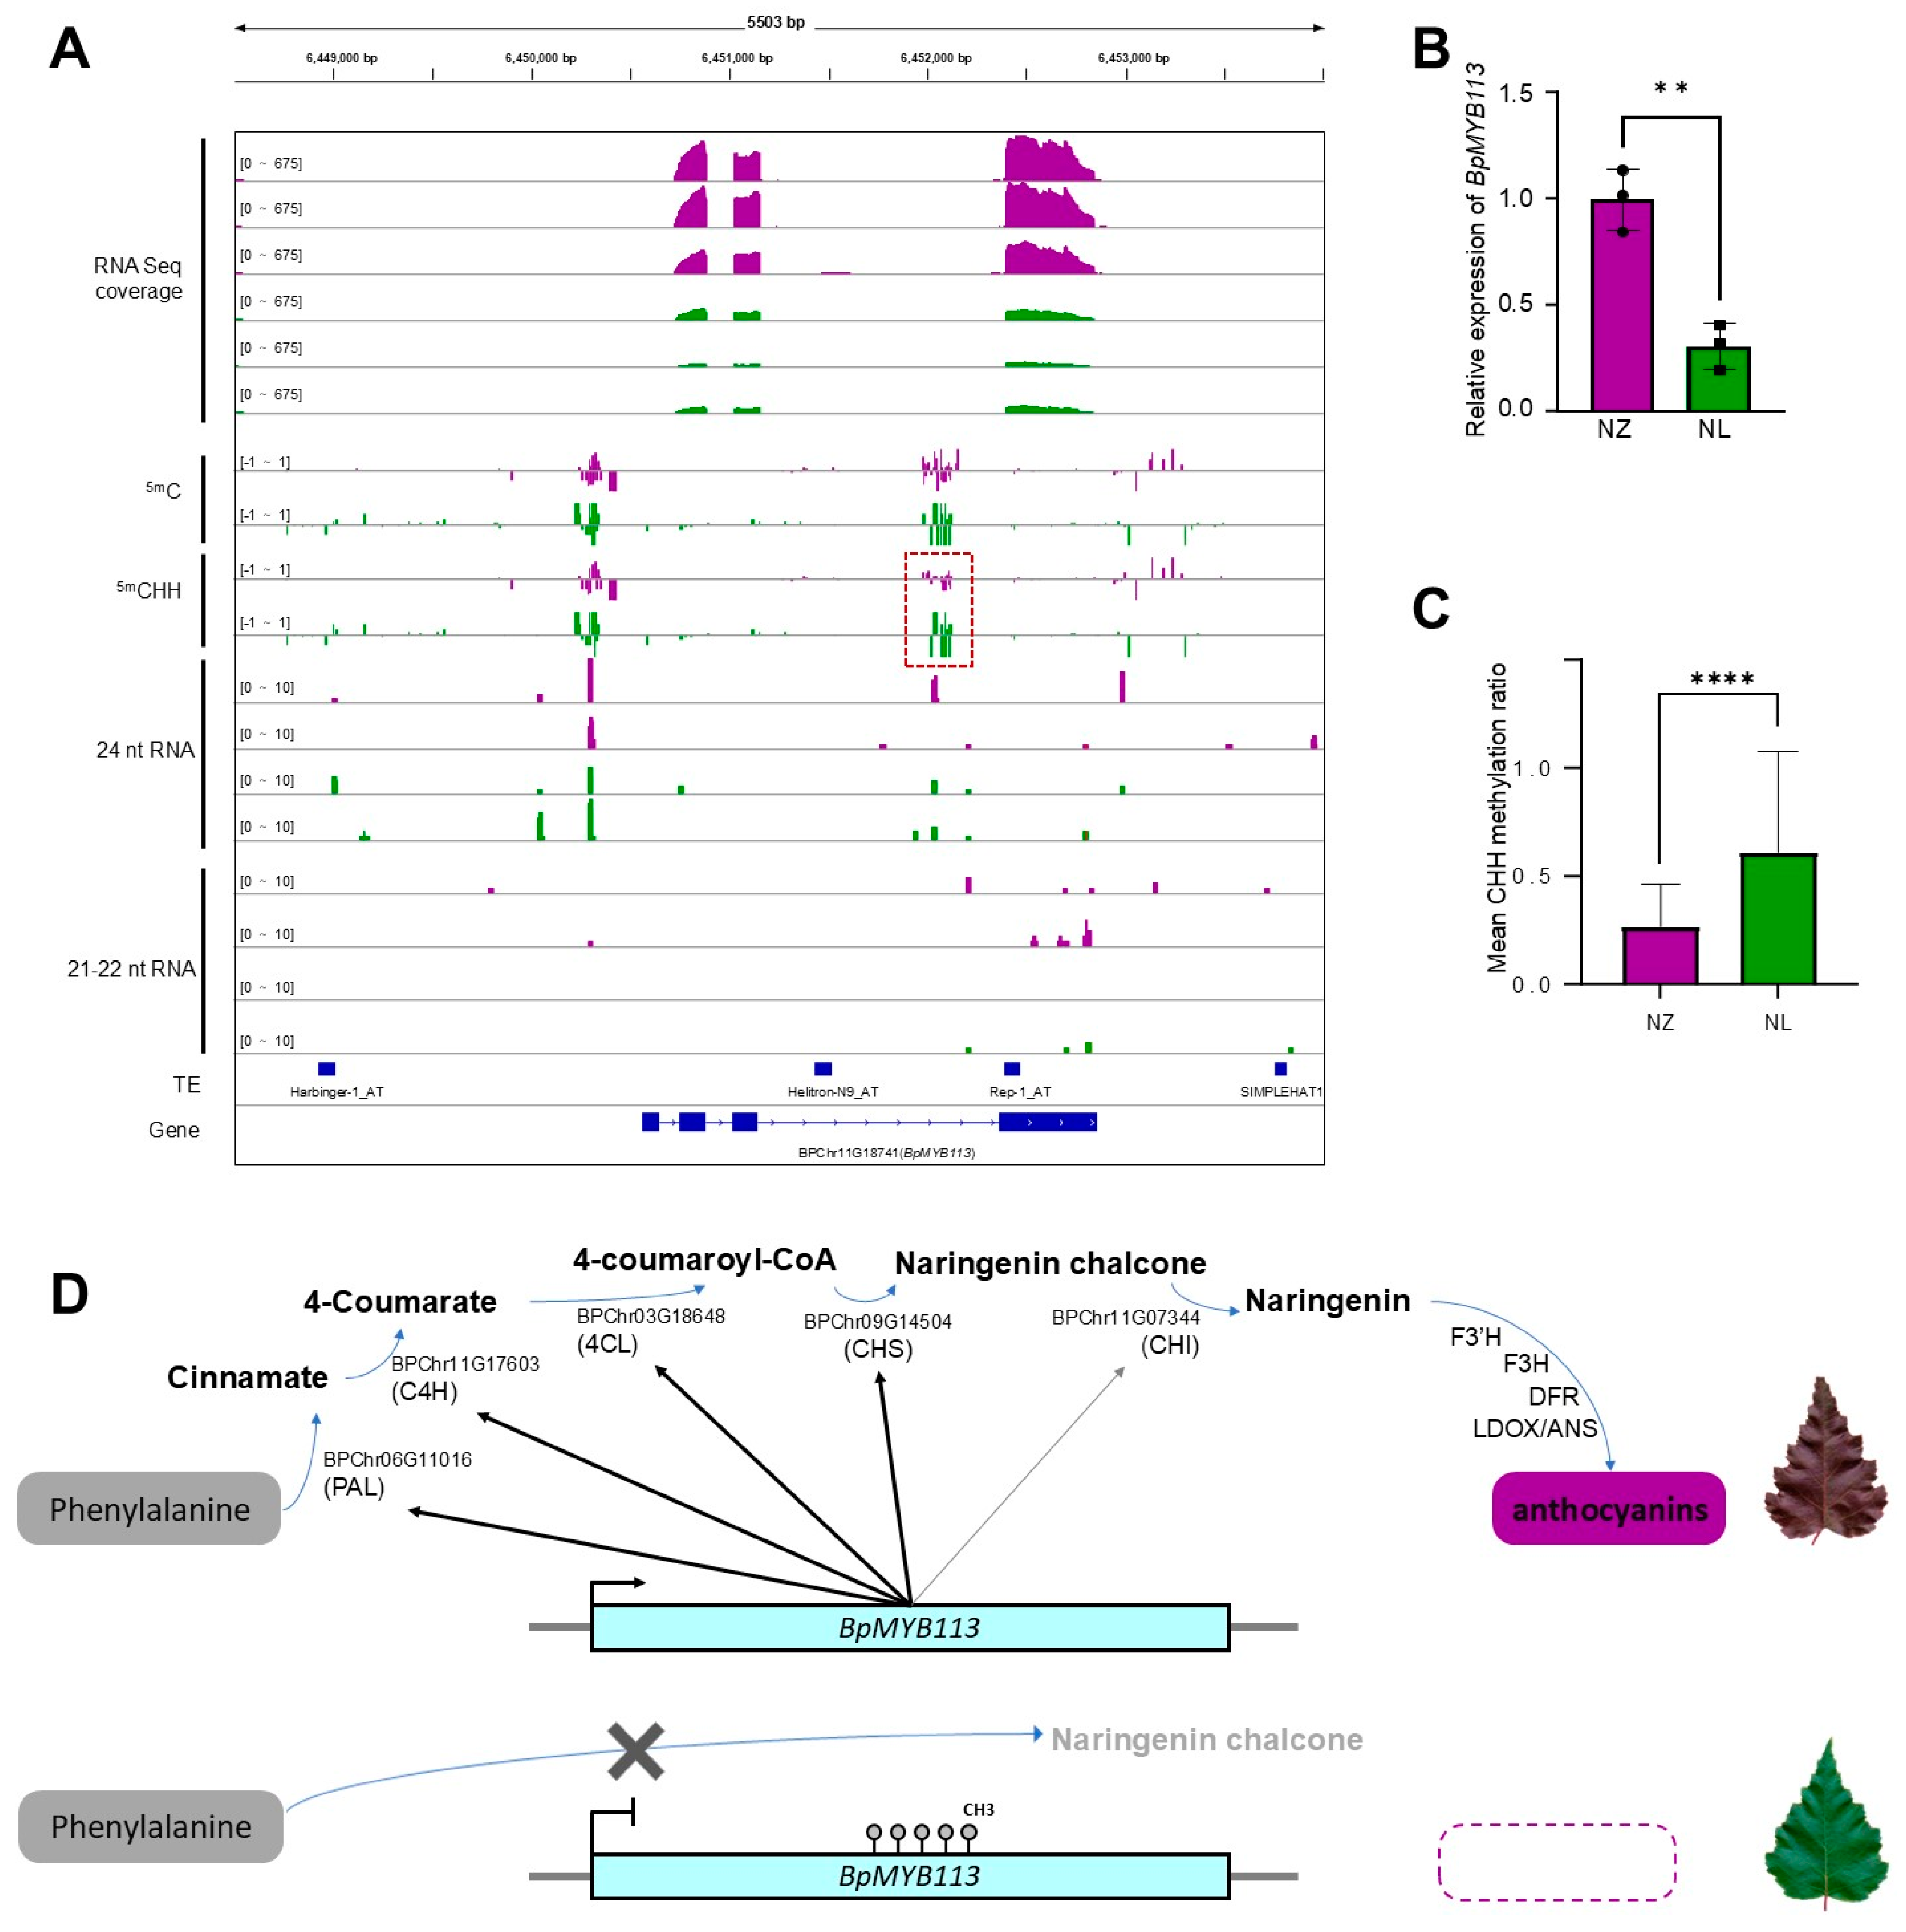
2.4. Epigenetic Analysis Reveals Regulation of Anthocyanin Biosynthesis by MYB113

DNA methylation, a prominent epigenetic modification, frequently leads to the repression of gene expression in the vicinity of hypermethylated regions. To investigate the epigenetic modifications underlying the green leaf phenotype in the NL lineage, comprehensive genome-wide DNA methylation profiles of NL and NZ were examined. In total, 71.1 Gbp of clean WGBS data with an unmethylated cytosine BS conversion (C to T) rate over 99% (according to the report on the quality of sequencing data provided by Annoroda Gene Technology) were generated, and the average alignment rate to the reference Betula genome was 91.4%. The DNA methylation at the genome-wide level is shown in Supplementary Figure S4. The analysis of the methylation differences revealed elevated CHH methylation levels in the NL compared to the NZ, notably in both genic regions and transposable elements (TEs) regions (Figure 4A). The differential methylation site analysis disclosed that while the majority of the differing CG sites showed hypomethylation status in the NL, a predominant trend of hypermethylation at differential CHH sites was observed in the NL (Figure 4B).
CHH methylation in higher plants is often maintained through the RdDM pathway [26,27,28], relying on 24 nt small RNAs, thereby exhibiting a tight correlation with small RNA abundance. Consequently, small RNA sequencing was performed on NL and NZ samples. This yielded 50.06 million clean small RNA reads, with an average mapping rate of 90.57%. The combined small RNA datasets from the NL and NZ were assembled and compared against previously reported small RNA sequencing data for European white birch [32], yielding specific small RNA precursors for B. pendula ‘Purple Rain’, detailed in Supplementary Table S5.
A comparative assessment of the abundance of 21–22 nt small RNAs across various gene loci in NL and NZ revealed discrepancies affecting 240 genes (expression Padj ≤ 0.01 and |log2FC| ≥ 1.0) (Supplementary Figure S5A). However, these differential small RNAs led to transcript abundance variations in only two genes (Supplementary Figure S5B), both of which, upon functional annotation, were found to be unrelated to anthocyanin biosynthesis (BPChr14G20643, serine hydrolase (FSH1), EF-hand_1, FSH1) (BPChr06G16470, NB-ARC, RPW8).
In contrast, the impact of differentially methylated sites on gene expression variability is more profound. A total of 62 differential genes exhibit differential methylation modifications (Figure 4C), predominantly characterized by elevated transcription levels accompanying reduced methylation (28 cases) and, conversely, decreased transcription accompanying increased methylation (24 cases). To elucidate the key epigenetic variants underlying the differential expression of the phenylalanine metabolic pathway, eight transcription factors among the 62 differentially methylated genes were annotated (Figure 4D), implicating families such as AP2, WRKY, GRAS, HLH, HSF, MYB, and WD40. While members of the AP2, WRKY, and WD40 families are generally implicated in a potential positive correlation with anthocyanin synthesis, according to the eggNOG-mapper annotation (Supplementary Table S6), the most direct association is observed with BPChr11G18741, a gene belonging to the Myb_DNA-binding family. Based on alignment outcomes, this gene has been designated as BpMYB113.
BpMYB113 carries a hyper CHH methylation site in NL (Figure 5A), coinciding with a down-regulated expression level (Figure 5B). This differential CHH methylation site, situated within the gene body, is significantly hyper in NL (Figure 5C). Although the CHH methylation site is accompanied by the presence of some 24 nt siRNAs (Figure 5A), no differential content of 21–22 nt or 24 nt RNAs was discerned between NL and NZ. The low expression of BpMYB113 directly or indirectly influenced the transcript level of BPChr06G11016 (PAL), BPChr11G17603 (C4H), BPChr03G18648 (4CL), BPChr09G14504 (CHS) and BPChr11G07344 (CHI). The decreased expression of these genes led to a decrease in flavonoids, especially naringenin chalcone, the most important substrate for anthocyanin synthesis, and eventually caused a green leaf color (Figure 5D).

3. Materials and Methods

3.1. Plant Materials

A wild-type line of B. pendula ‘Purple Rain’ (NZ) is distinguished by its purple leaves and cultivated by vegetative propagation (Figure 1A–C, left) through a previously described tissue culture protocol [33]. A green-leaf mutant line (NL) is from NZ (Figure 1A–C, right). One-year-old seedlings of NZ and NL grew in plastic pots at birch seed orchard (126.622615 east longitude, 45.716848 north latitude) in Northeast Forestry University. Soil substrate, growth conditions, and field management were established following previous cultivation experience [30]. For leaf color trait measurement, one leaf was collected from each of the 3 seedlings of each line. For flavonoids-targeted metabolomics determination, RNA sequencing, and qRT-PCR, 3 to 5 leaves were collected from each of the 3 seedlings of each line as 3 biological replicates. For small RNA sequencing, 3 to 5 leaves were collected from each of the 2 seedlings of each line as 2 biological replicates. For WGS, 3 to 5 leaves were collected from each of the 2 seedlings of NZ line and 3 seedlings of NL line as 2 or 3 biological replicates. For WGBS, 1 leaf was collected from each of 15 seedlings of each line and mixed as 2 pools. The leaf samples for sequencing and metabolomics determination were quickly frozen with dry ice after they were collected. The leaf samples for qRT-PCR were quickly frozen with liquid nitrogen after they were collected. All leaf materials in this study were intermediate leaves of a branch (Figure 1C) and collected on 1 June 2022.

3.2. Leaf Color Measurement

Leaf colors were quantified into the L*, a*, b* color space (CIE 1976, CIELAB) by color difference meter (CR-400, Minolta, Osaka, Japan). The L value indicates the brightness of the color and can range from 0 to 100, where 0 is pure black and 100 is pure white. In color measurement, the L value determines the brightness and contrast of an object’s surface, and thus evaluates its appearance quality. The A value represents the red–green color, and the value ranges from −128 to +127, where −128 is green and +127 is red. By measuring the a-value of an object’s surface, it is possible to know whether the surface of an object is biased to red or green, so as to evaluate its color accuracy and consistency. a > 0 is red and a < 0 is green. The b-value represents the yellow–blue degree of the color and ranges from −128 to +127, where −128 is blue and +127 is yellow. By measuring the b-value of an object’s surface, it is possible to know whether the surface of an object is biased to yellow or blue, so as to evaluate its color accuracy and consistency. b > 0 is yellow and b < 0 is blue. Leaf anthocyanin content was estimated by anthocyanin content tester (OPTI-SCIENCES ACM-200+, Hudson, NH, USA).

3.3. Flavonoids-Targeted Metabolomics Determination

Three biological repetitions were performed for NL and NZ. Metabolite extraction and determination were performed by Metware Biotechnology (Wuhan, China) with SHIMADZU Nexera X2 (Kyoto, Japan) and Applied Biosystems 4500 QTRAP platform (Fremont, CA, USA). Significantly regulated metabolites between groups were determined by VIP ≥ 1 and absolute of base-2 logarithm of fold change (|log2FC|) ≥ 1, from which VIP values were extracted from OPLS-DA results and generated with R package MetaboAnalystR 3.0 [34,35,36].

3.4. Whole Genome Re-Sequencing (WGS)

DNA extraction, database building, sequencing, data quality control, and data cleaning were completed by Annoroda Gene Technology (Beijing, China). The Illumina Novaseq6000-Sequencing platform (San Diego, CA, USA) was used. Clean sequencing data from multiple times of database building were merged to ensure the final sequencing depth for each line was over 50×. Clean reads were aligned to reference Betula genome [37] using BWA (Version: 0.7.18) [38]. Processing files were parsed using SAMtools (Version: 1.20) [39], and mutations including single-nucleotide polymorphisms (SNPs) and small insertions and deletions (InDels) were identified using BCFtools (Version: 1.20) [40]. Different SNPs/InDels were screened with Fisher test, with p ≤ 0.01 as the threshold, and the effects were predicted with AnnoSNP (https://github.com/lhui2010/AnnoSNP, accessed on 19 October 2024). Variant genes were annotated with eggNOG-mapper (Version: 2.1.12) [41]. Principal components of SNPs were analyzed with Plink (Version: 1.90) [42]. WGS data of five wild-type B. pendula randomly selected form birch seed orchard at Northeast Forestry University were sequenced using the same sequencing platform as in some of our previous studies.

3.5. RNA Sequencing

Three biological repetitions were performed for each line. DNA extraction, database building, sequencing, and data quality control were completed by Annoroda Gene Technology (Beijing, China) using the Illumina Novaseq6000-Sequencing platform, with sequencing data over 6 GbP for each replicate. Clean reads were aligned to reference Betula genome [37] using Hisat2 (Version 2.2.1) [43]. Gene expressions were quantified using StringTie (Version: 2.2.3) [44,45]. Gene expression difference analyses were performed using the R package DESeq2 (https://bioconductor.org/packages/release/bioc/html/DESeq2.html, accessed on 19 October 2024) [46]. Genes with expressions of Padj ≤ 0.01 and |log2FC| ≥ 1.0 were considered differentially expressed genes (DEGs). KEGG enrichment analyses were performed using The Database for Annotation, Visualization and Integrated Discovery (DAVID, Version: v2023q4) [47].

3.6. Small RNA Sequencing

Two biological repetitions were performed for each line. RNA extraction, library construction, and sequencing were completed by Biozeron company (Shanghai, China) using the Illumina Novaseq6000 Sequencing platform with sequencing data of 10 M reads for each replicate. Data quality control, filtering, and adapter removal were performed using fastp (Version: 0.23.4) [48]. Small RNA de novo predictions were performed using miRDeep-P2 (https://github.com/TF-Chan-Lab/miRDeep-P2_pipeline, accessed on 19 October 2024) [49]. In total, 21–22 nt micro-RNA reads were aligned to the reference Betula genome [37] using bowtie2 (Version: 2.5.4) [50] and counted using HTSeq-count (Version: 2.0.4) [51]. Significant differences of 21–22 nt micro-RNA numbers on each gene were analyzed using independent samples t-test. Genes with 21–22 nt RNA numbers of Padj ≤ 0.01 and |log2FC| ≥ 1.0 were considered differentially mi-RNA-regulated genes.

3.7. Whole Genome Bisulfite Sequencing (WGBS)

Total DNA was extracted using a DNA Extraction Kit (bio-filtration column type; KONVIER Group, Beijing, China). DNA bisulfite treatment, database building, sequencing, and data quality control were completed by Annoroda Gene Technology (Beijing, China) using the Illumina Novaseq6000-Sequencing platform with a sequencing depth for each line over 20×. The acquired sequence data were aligned to the reference Betula genome [37] and the methylation level was analyzed using bsmap (Version 2.90) [52].

3.8. qRT-PCR

Total RNA was extracted using a plant RNA Extraction Kit (BioTeke Co., Beijing, China) and reverse-transcribed to cDNA using a PrimeScript RT reagent kit with gDNA Eraser (Takara, Osaka, Japan). The reverse-transcribed cDNA at 1:10 served as a template. The SYBR Green PCR kit (Toyobo Co., Ltd., Osaka, Japan) was used for qRT-PCR amplification. In addition, 18S RNA was used as the internal reference gene, like in the previous study on B. pendula ’Purple Rain’ [30].
The relative expression of each gene was calculated using the formula RE = 2−ΔΔCt, where CT is the cycle threshold, representing the number of cycles required for the fluorescent signal in the reaction tube to reach the threshold, ΔCt = the CT value of the target gene − the average CT value of the internal reference gene, and ΔΔCt = ΔCT (sample 1) − ΔCT (sample 2), and the gene expression in NZ leaf was used as a control. All primers are listed in Supplementary Table S1.

4. Discussion

The green mutant NL of B. pendula ‘Purple Rain’, when cultivated under field conditions, exhibits pale purple juvenile leaves transitioning to green in maturity (Figure 1A–C), contrasting with the uniformly purple foliage of B. pendula ‘Purple Rain’ and the consistently green leaves of European white birch. This unique phenotype enables the creation of more visually diverse horticultural landscapes. NL, with its reduced anthocyanin content, serves as a valuable material for studying the biosynthesis of birch anthocyanins, facilitating comparisons with B. pendula ‘Purple Rain’ to uncover additional factors influencing total anthocyanin accumulation. In prior comparative studies between B. pendula ‘Purple Rain’ and European white birch, chalcone synthase was identified as a pivotal gene responsible for the purple pigmentation in B. pendula ‘Purple Rain’ [31]. By integrating flavonoid metabolomics with transcriptomic analyses, our study uncovered a concurrent transcriptional down-regulation of the entire phenylalanine metabolic pathway, including chalcone synthase, in NL, leading to a reduction in total chalcone levels, whereas genes in the anthocyanin biosynthetic pathway showed no substantial alterations (Figure 3A). The variations observed in NL predominantly affect phenylalanine metabolism, evidenced by significant down-regulation of four phenylalanine metabolic genes and one CHI gene. However, there is no indication that these mutations exert an impact on BpChr05G08766 (encoding F3′H) or BPChr01G22873 (encoding DFR).
In the tissue culture system utilized for establishing and propagating the NL line, cells underwent dedifferentiation to form callus tissue, which subsequently re-differentiated into plantlets [33]. During the process of dedifferentiation in plant cells, which enables the restoration of totipotency through reprogramming, alterations in methylation levels occur, rendering the cells susceptible to epigenetic variations at random sites [53,54].
Concurrently, spontaneous occurrences of random DNA sequence mutations also take place. Both genetic mutations and epigenetic variations must be considered in mutant studies, and the epigenetic nature of traits cannot be definitively ascertained until recurrent instances of mutants spontaneously reverting to the wild type are observed. This investigation employed WGS to rule out genetic mutations before ultimately characterizing the epigenetic alterations in NL. NL exhibits genome-wide increases in CHH methylation in both genic regions and transposable element regions, suggesting activation or reinforcement of the de novo establishment or maintenance mechanisms of CHH methylation. This phenomenon may be associated with hormonal stimuli [55] or osmotic stress experienced during tissue culture processes [56].
MYB proteins are characterized by their highly conserved MYB-repeat domains, whose binding specificity and interacting partners dictate their precise regulatory effects on target genes [15]. MYB113 has been demonstrated in various tree species to play a positive regulatory role in anthocyanin biosynthesis, to the extent that artificially elevating its transcription level has led to the creation of new tree varieties with purple organs [16,17,18]. In this study, BpMYB113 stands as the sole transcription factor in NL causing an epigenetic trait heritable during asexual reproduction, with a known positive regulatory function in anthocyanin synthesis. Its hyper methylation site within the gene body is correlated with reduced transcriptional activity. The expression of BpMYB113 exhibits spatial and temporal dynamics; its down-regulation does not completely abolish the expression of all phenylalanine metabolic and anthocyanin biosynthesis genes, allowing for the retention of anthocyanins in NL’s young leaves, manifesting as a purple hue.
DNA methylation frequently influences anthocyanin accumulation in plants. In Raphanus sativus ‘Xinlimei’, a CACTA transposon situated within the promoter region of the RsMYB1 gene acts as a transcriptional enhancer, leading to substantial anthocyanin accumulation in roots [57]. Upon methylation of this CACTA transposon, reduced transcription of RsMYB1 results in the disappearance of anthocyanins in the roots [57]. The transcription factor CmMYB6 in Chrysanthemum morifolium regulates anthocyanin accumulation in YP petal tissues. Individuals with methylated CmMYB6 promoters exhibit a shift from pink to yellow petals due to decreased anthocyanins; conversely, targeted demethylation of the promoter restores the pink petal color [6]. XsMYB113, which governs the basal petal color in Xanthoceras sorbifolium, experiences differential transcription levels at various flower developmental stages due to altered promoter methylation patterns, causing a gradual color change in the petal base. Furthermore, target genes in the anthocyanin biosynthesis pathway under MYB regulation also exhibit transcript level variations due to methylation modifications; for instance, the uneven distribution of methylation on PrDFR and PrANS genes in Paeonia rockii ‘Xibei’ petals contributes to disparities in anthocyanin content, giving rise to petal spotting [58]. In this instance, the differential methylation site of BpMYB113 occurs in the CHH context, a feature that is asymmetric in double-stranded DNA molecules and is peculiar to plants. Both the de novo establishment and maintenance of CHH methylation are associated with the RNA-directed DNA methylation (RdDM) mechanism [26,27]. The analysis of the microRNAs revealed the presence of 24 nt RNA at the differential CHH methylation site of the key variant gene, BpMYB113, in the NL (Figure 5A). However, no substantial increase in 24 nt RNA levels was observed concomitantly with the heightened methylation at this site in NL, indicating that the underlying mechanism driving this variation remains to be elucidated.
Gene body methylation (gbM) refers to genes with an enrichment of CG DNA methylation within the transcribed regions and depletion at the transcriptional start and termination sites [59]. The function of gbM remains elusive; gbM genes were expressed, on average, in more single-cell replicates than unmethylated genes [60], which means that gbM has some positive influence on transcription. However, at the common CG/CHG gbM site in BpMYB113, cytosine in the CHH context was methylated in the NL line (Figure 5A). This modification might change the original function of this gbM site and enhance the negative effects of DNA methylation on chromatin openness by switching the mean methylation into an over-hyper level [25,57], and therefore reducing the expression of BpMYB113. Demethylation editing with dCas9-TET tools targeting BpMYB113 in both B. pendula ‘PurpleRain’ and the green mutant NL will be carried out in our future study to explore the role of this atypical gbM site in the gene regulation of birch.

5. Conclusions

The mutant NL exhibited leaf coloration that was lighter than that of the wild-type B. pendula ‘Purple Rain’. RNA-Seq and metabolomic analysis revealed that the changing of the NL leaf color was due to a lower anthocyanin concentration, caused by the reduced expression of multiple functional genes. Genetic variations are not supported as a cause of these changes in NL, which suggests that the phenomenon is a result of epigenetic regulation. A multi-omics analysis of WGBS, small RNA-Seq, and RNA-Seq designated the key gene as BpMYB113, which carries a hyper CHH methylation site in NL. This methylation site is associated with a lower expression of BpMYB113, which weakens the transcription of genes required for anthocyanin synthesis.

Supplementary Materials

The following supporting information can be downloaded at: https://www.mdpi.com/article/10.3390/ijms252212030/s1.

Author Contributions

C.G. and H.X. conducted parts of the data analysis and wrote the manuscript; Q.Y. discovered the mutant materials, conducted parts of the data analysis, and conducted the qRT-PCR experiments; Q.Z. carried out the experiment instructions about epigenetics; G.L. and J.J. designed the research; J.H., K.Y. and Y.Z. carried out the cultivation and maintenance of the plant materials. All authors have read and agreed to the published version of the manuscript.

Funding

This work was supported by National College Student Innovation and Entrepreneurship Training Program (202310225167).

Institutional Review Board Statement

Not applicable.

Informed Consent Statement

Not applicable.

Data Availability Statement

All high-throughput sequencing data have been uploaded and published in the Bio-Project PRJCA030863 of China National Center for Bioinformatics (https://ngdc.cncb.ac.cn/bioproject/browse/PRJCA030863, accessed on 19 October 2024).

Conflicts of Interest

The authors declare that the research was conducted in the absence of any commercial or financial relationships that could be construed as a potential conflict of interest.

References

  1. Liu, Y.; Qian, J.; Li, J.; Xing, M.; Grierson, D.; Sun, C.; Xu, C.; Li, X.; Chen, K. Hydroxylation decoration patterns of flavonoids in horticultural crops: Chemistry, bioactivity, and biosynthesis. Hortic. Res. 2022, 9, uhab068. [Google Scholar] [CrossRef] [PubMed]
  2. Ruan, H.; Gao, L.; Fang, Z.; Lei, T.; Xing, D.; Ding, Y.; Rashid, A.; Zhuang, J.; Zhang, Q.; Gu, C.; et al. A flavonoid metabolon: Cytochrome b 5 enhances B-ring trihydroxylated flavan-3-ols synthesis in tea plants. Plant J. 2024, 118, 1793–1814. [Google Scholar] [CrossRef] [PubMed]
  3. Liga, S.; Paul, C.; Péter, F. Flavonoids: Overview of Biosynthesis, Biological Activity, and Current Extraction Techniques. Plants 2023, 12, 2732. [Google Scholar] [CrossRef] [PubMed]
  4. Mannino, G.; Gentile, C.; Ertani, A.; Serio, G.; Bertea, C.M. Anthocyanins: Biosynthesis, Distribution, Ecological Role, and Use of Biostimulants to Increase Their Content in Plant Foods—A Review. Agriculture 2021, 11, 212. [Google Scholar] [CrossRef]
  5. Mekapogu, M.; Vasamsetti, B.M.K.; Kwon, O.-K.; Ahn, M.-S.; Lim, S.-H.; Jung, J.-A. Anthocyanins in Floral Colors: Biosynthesis and Regulation in Chrysanthemum Flowers. Int. J. Mol. Sci. 2020, 21, 6537. [Google Scholar] [CrossRef]
  6. Tang, M.; Xue, W.; Li, X.; Wang, L.; Wang, M.; Wang, W.; Yin, X.; Chen, B.; Qu, X.; Li, J.; et al. Mitotically heritable epigenetic modifications of CmMYB6 control anthocyanin biosynthesis in chrysanthemum. New Phytol. 2022, 236, 1075–1088. [Google Scholar] [CrossRef]
  7. Liu, Y.; Li, Y.; Liu, Z.; Wang, L.; Bi, Z.; Sun, C.; Yao, P.; Zhang, J.; Bai, J.; Zeng, Y. Integrated transcriptomic and metabolomic analysis revealed altitude-related regulatory mechanisms on flavonoid accumulation in potato tubers. Food Res. Int. 2023, 170, 112997. [Google Scholar] [CrossRef]
  8. Song, M.; Wang, L.; Zhang, Y.; Wang, Q.; Han, X.; Yang, Q.; Zhang, J.; Tong, Z. Temporospatial pattern of flavonoid metabolites and potential regulatory pathway of PbMYB211-coordinated kaempferol-3-O-rhamnoside biosynthesis in Phoebe bournei. Plant Physiol. Biochem. 2023, 202, 107913. [Google Scholar] [CrossRef]
  9. Zhao, X.; Zhang, Y.; Long, T.; Wang, S.; Yang, J. Regulation Mechanism of Plant Pigments Biosynthesis: Anthocyanins, Carotenoids, and Betalains. Metabolites 2022, 12, 871. [Google Scholar] [CrossRef]
  10. Fu, Z.; Jiang, H.; Chao, Y.; Dong, X.; Yuan, X.; Wang, L.; Zhang, J.; Xu, M.; Wang, H.; Li, Y.; et al. Three Paralogous R2R3-MYB Genes Contribute to Delphinidin-Related Anthocyanins Synthesis in Petunia hybrida. J. Plant Growth Regul. 2021, 40, 1687–1700. [Google Scholar] [CrossRef]
  11. He, G.; Zhang, R.; Jiang, S.; Wang, H.; Ming, F. The MYB transcription factor RcMYB1 plays a central role in rose anthocyanin biosynthesis. Hortic. Res. 2023, 10, uhad080. [Google Scholar] [CrossRef] [PubMed]
  12. Jiang, L.; Yue, M.; Liu, Y.; Zhang, N.; Lin, Y.; Zhang, Y.; Wang, Y.; Li, M.; Luo, Y.; Zhang, Y.; et al. A novel R2R3-MYB transcription factor FaMYB5 positively regulates anthocyanin and proanthocyanidin biosynthesis in cultivated strawberries (Fragaria x ananassa). Plant Biotechnol. J. 2023, 21, 1140–1158. [Google Scholar] [CrossRef] [PubMed]
  13. Piao, C.; Wu, J.; Cui, M.-L. The combination of R2R3-MYB gene AmRosea1 and hairy root culture is a useful tool for rapidly induction and production of anthocyanins in Antirrhinum majus L. AMB Express 2021, 11, 128. [Google Scholar] [CrossRef] [PubMed]
  14. Muñoz-Gómez, S.; Suárez-Baron, H.; Alzate, J.F.; González, F.; Pabón-Mora, N. Evolution of the Subgroup 6 R2R3-MYB Genes and Their Contribution to Floral Color in the Perianth-Bearing Piperales. Front. Plant Sci. 2021, 12, 633227. [Google Scholar] [CrossRef] [PubMed]
  15. Gonzalez, A.; Zhao, M.; Leavitt, J.M.; Lloyd, A.M. Regulation of the anthocyanin biosynthetic pathway by the TTG1/bHLH/Myb transcriptional complex in Arabidopsis seedlings. Plant J. 2008, 53, 814–827. [Google Scholar] [CrossRef]
  16. Zhu, L.; Liao, Y.; Lin, K.; Wu, W.; Duan, L.; Wang, P.; Xiao, X.; Zhang, T.; Chen, X.; Wang, J.; et al. Cytokinin promotes anthocyanin biosynthesis via regulating sugar accumulation and MYB113 expression in Eucalyptus. Tree Physiol. 2024, 44, tpad154. [Google Scholar] [CrossRef]
  17. Lu, Y.; Wang, H.; Liu, Z.; Zhang, T.; Li, Z.; Cao, L.; Wu, S.; Liu, Y.; Yu, S.; Zhang, Q.; et al. A naturally-occurring phenomenon of flower color change during flower development in Xanthoceras sorbifolium. Front. Plant Sci. 2022, 13, 1072185. [Google Scholar] [CrossRef]
  18. Abid, M.A.; Wei, Y.; Meng, Z.; Wang, Y.; Ye, Y.; Wang, Y.; He, H.; Zhou, Q.; Li, Y.; Wang, P.; et al. Increasing floral visitation and hybrid seed production mediated by beauty mark in Gossypium hirsutum. Plant Biotechnol. J. 2022, 20, 1274–1284. [Google Scholar] [CrossRef]
  19. Jiang, S.; Sun, Q.; Zhang, T.; Liu, W.; Wang, N.; Chen, X. MdMYB114 regulates anthocyanin biosynthesis and functions downstream of MdbZIP4-like in apple fruit. J. Plant Physiol. 2021, 257, 153353. [Google Scholar] [CrossRef]
  20. He, K.; Du, J.; Han, X.; Li, H.; Kui, M.; Zhang, J.; Huang, Z.; Fu, Q.; Jiang, Y.; Hu, Y. PHOSPHATE STARVATION RESPONSE1 (PHR1) interacts with JASMONATE ZIM-DOMAIN (JAZ) and MYC2 to modulate phosphate deficiency-induced jasmonate signaling in Arabidopsis. Plant Cell 2023, 35, 2132–2156. [Google Scholar] [CrossRef]
  21. Li, Y.; Xing, M.; Yang, Q.; Wang, Y.; Jiang, J.; Zhao, Y.; Zhao, X.; Shen, A.; Feng, Y.; Zhao, X.; et al. SmCIP7, a COP1 interactive protein, positively regulates anthocyanin accumulation and fruit size in eggplant. Int. J. Biol. Macromol. 2023, 234, 123729. [Google Scholar] [CrossRef] [PubMed]
  22. Li, X.; Martín-Pizarro, C.; Zhou, L.; Hou, B.; Wang, Y.; Shen, Y.; Li, B.; Posé, D.; Qin, G. Deciphering the regulatory network of the NAC transcription factor FvRIF, a key regulator of strawberry (Fragaria vesca) fruit ripening. Plant Cell 2023, 35, 4020–4045. [Google Scholar] [CrossRef] [PubMed]
  23. Wang, Y.; Liu, W.; Wang, X.; Yang, R.; Wu, Z.; Wang, H.; Wang, L.; Hu, Z.; Guo, S.; Zhang, H.; et al. MiR156 regulates anthocyanin biosynthesis through SPL targets and other microRNAs in poplar. Hortic. Res. 2020, 7, 118. [Google Scholar] [CrossRef] [PubMed]
  24. Wang, C.; Ye, D.; Li, Y.; Hu, P.; Xu, R.; Wang, X. Genome-wide identification and bioinformatics analysis of the WRKY transcription factors and screening of candidate genes for anthocyanin biosynthesis in azalea (Rhododendron simsii). Front. Genet. 2023, 14, 1172321. [Google Scholar] [CrossRef]
  25. Héberlé, É.; Bardet, A.F. Sensitivity of transcription factors to DNA methylation. Essays Biochem. 2019, 63, 727–741. [Google Scholar] [CrossRef]
  26. Erdmann, R.M.; Picard, C.L. RNA-directed DNA Methylation. PLoS Genet. 2020, 16, e1009034. [Google Scholar] [CrossRef]
  27. Matzke, M.A.; Mosher, R.A. RNA-directed DNA methylation: An epigenetic pathway of increasing complexity. Nat. Rev. Genet. 2014, 15, 394–408. [Google Scholar] [CrossRef]
  28. Zhang, H.; Zhu, J. RNA-directed DNA methylation. Curr. Opin. Plant Biol. 2011, 14, 142–147. [Google Scholar] [CrossRef]
  29. Zhang, M.; Gao, Y.; Su, X.; Liu, W.; Guo, Y.; Jiang, J.; Ma, W. Characterization of the complete chloroplast genome of Betula pendula purple rain (betulaceae). Mitochondrial DNA Part B 2023, 8, 281–284. [Google Scholar] [CrossRef]
  30. Lyu, D.; Lin, L.; Guo, Y.; Han, R.; Jiang, J. Characterization of gene expression in anthocyanin synthesis and salt tolerance of Betula pendula ‘Purple Rain’ (In Chinese). J. Nanjing For. Univ. 2018, 42, 25–32. [Google Scholar]
  31. Lin, L.; Mu, H.; Jiang, J.; Liu, G. Transcriptomic analysis of purple leaf determination in birch. Gene 2013, 526, 251–258. [Google Scholar] [CrossRef] [PubMed]
  32. Gu, C.; Han, R.; Liu, C.; Fang, G.; Yuan, Q.; Zheng, Z.; Yu, Q.; Jiang, J.; Liu, S.; Xie, L.; et al. Heritable epigenetic modification of BpPIN1 is associated with leaf shapes in Betula pendula. Tree Physiol. 2023, 43, 1811–1824. [Google Scholar] [CrossRef] [PubMed]
  33. Zhang, X.; Gu, C.; Jiang, J.; Guifeng, L.; Huiyu, L. Heritable Epigenetic Modification of BpIAA9 Causes the Reversion Mutation of Leaf Shapes in Betula pendula ‘Dalecarlica’. Forests 2024, 15, 95. [Google Scholar] [CrossRef]
  34. Chong, J.; Xia, J. MetaboAnalystR: An R package for flexible and reproducible analysis of metabolomics data. Bioinformatics 2018, 34, 4313–4314. [Google Scholar] [CrossRef]
  35. Chong, J.; Yamamoto, M.; Xia, J. MetaboAnalystR 2.0: From Raw Spectra to Biological Insights. Metabolites 2019, 9, 57. [Google Scholar] [CrossRef]
  36. Pang, Z.; Chong, J.; Li, S.; Xia, J. MetaboAnalystR 3.0: Toward an Optimized Workflow for Global Metabolomics. Metabolites 2020, 10, 186. [Google Scholar] [CrossRef]
  37. Chen, S.; Wang, Y.; Yu, L.; Zheng, T.; Wang, S.; Yue, Z.; Jiang, J.; Kumari, S.; Zheng, C.; Tang, H.; et al. Genome sequence and evolution ofBetula platyphylla. Hortic. Res. 2021, 8, 1–12. [Google Scholar] [CrossRef]
  38. Jung, Y.; Han, D. BWA-MEME: BWA-MEM emulated with a machine learning approach. Bioinformatics 2022, 38, 2404–2413. [Google Scholar] [CrossRef]
  39. Li, H.; Handsaker, B.; Wysoker, A.; Fennell, T.; Ruan, J.; Homer, N.; Marth, G.; Abecasis, G.; Durbin, R.; 1000 Genome Project Data Processing Subgroup. The Sequence Alignment/Map format and SAMtools. Bioinformatics 2009, 25, 2078–2079. [Google Scholar] [CrossRef]
  40. Narasimhan, V.; Danecek, P.; Scally, A.; Xue, Y.; Tyler-Smith, C.; Durbin, R. BCFtools/RoH: A hidden Markov model approach for detecting autozygosity from next-generation sequencing data. Bioinformatics 2016, 32, 1749–1751. [Google Scholar] [CrossRef]
  41. Cantalapiedra, C.P.; Hernández-Plaza, A.; Letunic, I.; Bork, P.; Huerta-Cepas, J. eggNOG-mapper v2: Functional Annotation, Orthology Assignments, and Domain Prediction at the Metagenomic Scale. Mol. Biol. Evol. 2021, 38, 5825–5829. [Google Scholar] [CrossRef] [PubMed]
  42. Chang, C.C.; Chow, C.C.; Tellier, L.C.; Vattikuti, S.; Purcell, S.M.; Lee, J.J. Second-generation PLINK: Rising to the challenge of larger and richer datasets. GigaScience 2015, 4, 7. [Google Scholar] [CrossRef]
  43. Kim, D.; Paggi, J.M.; Park, C.; Bennett, C.; Salzberg, S.L. Graph-based genome alignment and genotyping with HISAT2 and HISAT-genotype. Nat. Biotechnol. 2019, 37, 907–915. [Google Scholar] [CrossRef] [PubMed]
  44. Pertea, M.; Pertea, G.M.; Antonescu, C.M.; Chang, T.-C.; Mendell, J.T.; Salzberg, S.L. StringTie enables improved reconstruction of a transcriptome from RNA-seq reads. Nat. Biotechnol. 2015, 33, 290–295. [Google Scholar] [CrossRef] [PubMed]
  45. Pertea, M.; Kim, D.; Pertea, G.M.; Leek, J.T.; Salzberg, S.L. Transcript-level expression analysis of RNA-seq experiments with HISAT, StringTie and Ballgown. Nat. Protoc. 2016, 11, 1650–1667. [Google Scholar] [CrossRef] [PubMed]
  46. Love, M.I.; Huber, W.; Anders, S. Moderated estimation of fold change and dispersion for RNA-seq data with DESeq2. Genome Biol. 2014, 15, 550. [Google Scholar] [CrossRef]
  47. Sherman, B.T.; Hao, M.; Qiu, J.; Jiao, X.; Baseler, M.W.; Lane, H.C.; Imamichi, T.; Chang, W. DAVID: A web server for functional enrichment analysis and functional annotation of gene lists (2021 update). Nucleic Acids Res. 2022, 50, W216–W221. [Google Scholar] [CrossRef]
  48. Chen, S.; Zhou, Y.; Chen, Y.; Gu, J. fastp: An ultra-fast all-in-one FASTQ preprocessor. Bioinformatics 2018, 34, i884–i890. [Google Scholar] [CrossRef]
  49. Kuang, Z.; Wang, Y.; Li, L.; Yang, X. miRDeep-P2: Accurate and fast analysis of the microRNA transcriptome in plants. Bioinformatics. 2019, 35, 2521–2522. [Google Scholar] [CrossRef]
  50. Langmead, B.; Salzberg, S.L. Fast gapped-read alignment with Bowtie 2. Nat. Methods 2012, 9, 357–359. [Google Scholar] [CrossRef]
  51. Anders, S.; Pyl, P.T.; Huber, W. HTSeq—A Python framework to work with high-throughput sequencing data. Bioinformatics 2015, 31, 166–169. [Google Scholar] [CrossRef] [PubMed]
  52. Xi, Y.; Li, W. BSMAP: Whole genome bisulfite sequence MAPping program. BMC Bioinform. 2009, 10, 232. [Google Scholar] [CrossRef] [PubMed]
  53. Debnath, S.C.; Ghosh, A. Phenotypic variation and epigenetic insight into tissue culture berry crops. Front. Plant Sci. 2022, 13, 1042726. [Google Scholar] [CrossRef] [PubMed]
  54. Müller-Xing, R.; Xing, Q. The plant stem-cell niche and pluripotency: 15 years of an epigenetic perspective. Front. Plant Sci. 2022, 13, 1018559. [Google Scholar] [CrossRef] [PubMed]
  55. Mateo-Bonmatí, E.; Casanova-Sáez, R.; Ljung, K. Epigenetic Regulation of Auxin Homeostasis. Biomolecules 2019, 9, 623. [Google Scholar] [CrossRef]
  56. Singroha, G.; Kumar, S.; Gupta, O.P.; Singh, G.P.; Sharma, P. Uncovering the Epigenetic Marks Involved in Mediating Salt Stress Tolerance in Plants. Front. Genet. 2022, 13, 811732. [Google Scholar] [CrossRef]
  57. Wang, Q.; Wang, Y.; Sun, H.; Sun, L.; Zhang, L. Transposon-induced methylation of the RsMYB1 promoter disturbs anthocyanin accumulation in red-fleshed radish. J. Exp. Bot. 2020, 71, 2537–2550. [Google Scholar] [CrossRef]
  58. Zhu, J.; Wang, Y.; Wang, Q.; Li, B.; Wang, X.; Zhou, X.; Zhang, H.; Xu, W.; Li, S.; Wang, L. The combination of DNA methylation and positive regulation of anthocyanin biosynthesis by MYB and bHLH transcription factors contributes to the petal blotch formation in Xibei tree peony. Hortic. Res. 2023, 10, uhad100. [Google Scholar] [CrossRef]
  59. Bewick, A.J.; Schmitz, R.J. Gene body DNA methylation in plants. Curr. Opin. Plant Biol. 2017, 36, 103–110. [Google Scholar] [CrossRef]
  60. Horvath, R.; Laenen, B.; Takuno, S.; Slotte, T. Single-cell expression noise and gene-body methylation in Arabidopsis thaliana. Heredity 2019, 123, 81–91. [Google Scholar] [CrossRef]
Figure 1. Color difference between NZ and NL. (A), NZ (left) and NL (right) plants propagated by tissue culturing. Bar, 10 cm. (B), Branch of NZ (left) and NL (right). Red arrows indicate the intermediate leaves that were collected for measurement. Bar, 5 cm. (C), Bar plot of leaf color trait measurement (*** = p < 0.0001). L represents lightness, with a positive value indicating higher brightness and a negative value indicating lower brightness; a represents the red–green saturation, with a positive value indicating a redder hue and a negative value indicating a greener hue; b represents the yellow–blue saturation, with a positive value indicating a yellower hue and a negative value indicating a bluer hue. Student’s t-test was used to assess the significance level between the two lines. Error bars represent standard deviation of each group.
Ijms 25 12030 g001
Figure 2. RNA-Seq and metabolomics result. (A), Bubble charts of GO enrichment BP terms of down-regulated DEGs. (B), Bubble charts of KEGG enrichment of down-regulated DEGs. (C), Heat map of five anthocyanin molecules’ contents with significant differences at * = p < 0.05, ** = p < 0.01. (D), Bar plot of total anthocyanin content in NZ and NL leaves at *** = p < 0.001. Student’s t-test was used to assess the significance level between the two lines.
Ijms 25 12030 g002
Figure 3. RNA-Seq and metabolomics combined analysis of anthocyanin biosynthesis pathway. (A), Heatmap of precursor contents for anthocyanin synthesis and anthocyanin biosynthesis structural genes expression. The left panel of heatmap represents the concentration of 4 precursor contents. The right panel of heatmap represents the expression of structural genes belonging to the nearby categories in the middle panel. Color scale represents the relative levels of metabolite concentration or relative gene expression, * = Padj ≤ 0.05, ** = Padj ≤ 0.01. *** = Padj ≤ 0.001, ***** = Padj ≤ 0.00001. ‘ns’ = no significant difference. (B), Bar plot of qRT-PCR result of 5 differentially expressed anthocyanin biosynthesis structural genes. ** = p ≤ 0.01. Student’s t-test was used to assess the significance level between the two lines. Error bars represent data range of each group. All primers are listed in Supplementary Table S1.
Ijms 25 12030 g003
Figure 4. WGBS and RNA-Seq combined analysis detected TFs affected by epigenetic regulation. (A), DNA methylation level by context around genes and transposon regions. Purple curves represent methylation level of NZ; green curves represent methylation level of NL. (B), DMR numbers. (C), Venn plot showing DEGs carrying DMRs. (D), Differentially expressed TFs carrying DMRs, ** = Padj ≤ 0.01, *** = Padj ≤ 0.001, **** = Padj ≤ 0.0001, ***** = Padj ≤ 0.00001.
Ijms 25 12030 g004
Figure 5. Epigenetic mutation of BPChr11G18741 (BpMYB113) regulates anthocyanin biosynthesis. (A), Gene expression level, DNA methylation level, and small RNA abundance of BPChr11G18741 (BpMYB113). Purple plots represent NZ and green plots represent NL. Red square represents DMR by CHH context. (B), Bar plot of qRT-PCR result of BPChr11G18741 (BpMYB113), ** = p ≤ 0.01. Student’s t-test was used to assess the significance level between the two lines. Error bars represent data range of each group. (C), Mean CHH methylation ratios of DMR. **** = p ≤ 0.0001. Mann–Whitney U-test was used to assess the significance level between the two lines. Error bars represent standard error. (D), Mechanism of leaf color changes in NL. The low expression of BpMYB113 associated with DNA methylation weakens the transcription of some genes required for anthocyanin synthesis. × represents the weakening of metabolic pathways; purple dotted square represents the absence of anthocyanin.
Ijms 25 12030 g005
Disclaimer/Publisher’s Note: The statements, opinions and data contained in all publications are solely those of the individual author(s) and contributor(s) and not of MDPI and/or the editor(s). MDPI and/or the editor(s) disclaim responsibility for any injury to people or property resulting from any ideas, methods, instructions or products referred to in the content.

