
Serum Neurofilament and Free Light Chain Levels in Patients Undergoing Treatment for Chronic Inflammatory Demyelinating Polyneuropathy

 , , , ,
  ,
, 
Abstract
1. Introduction
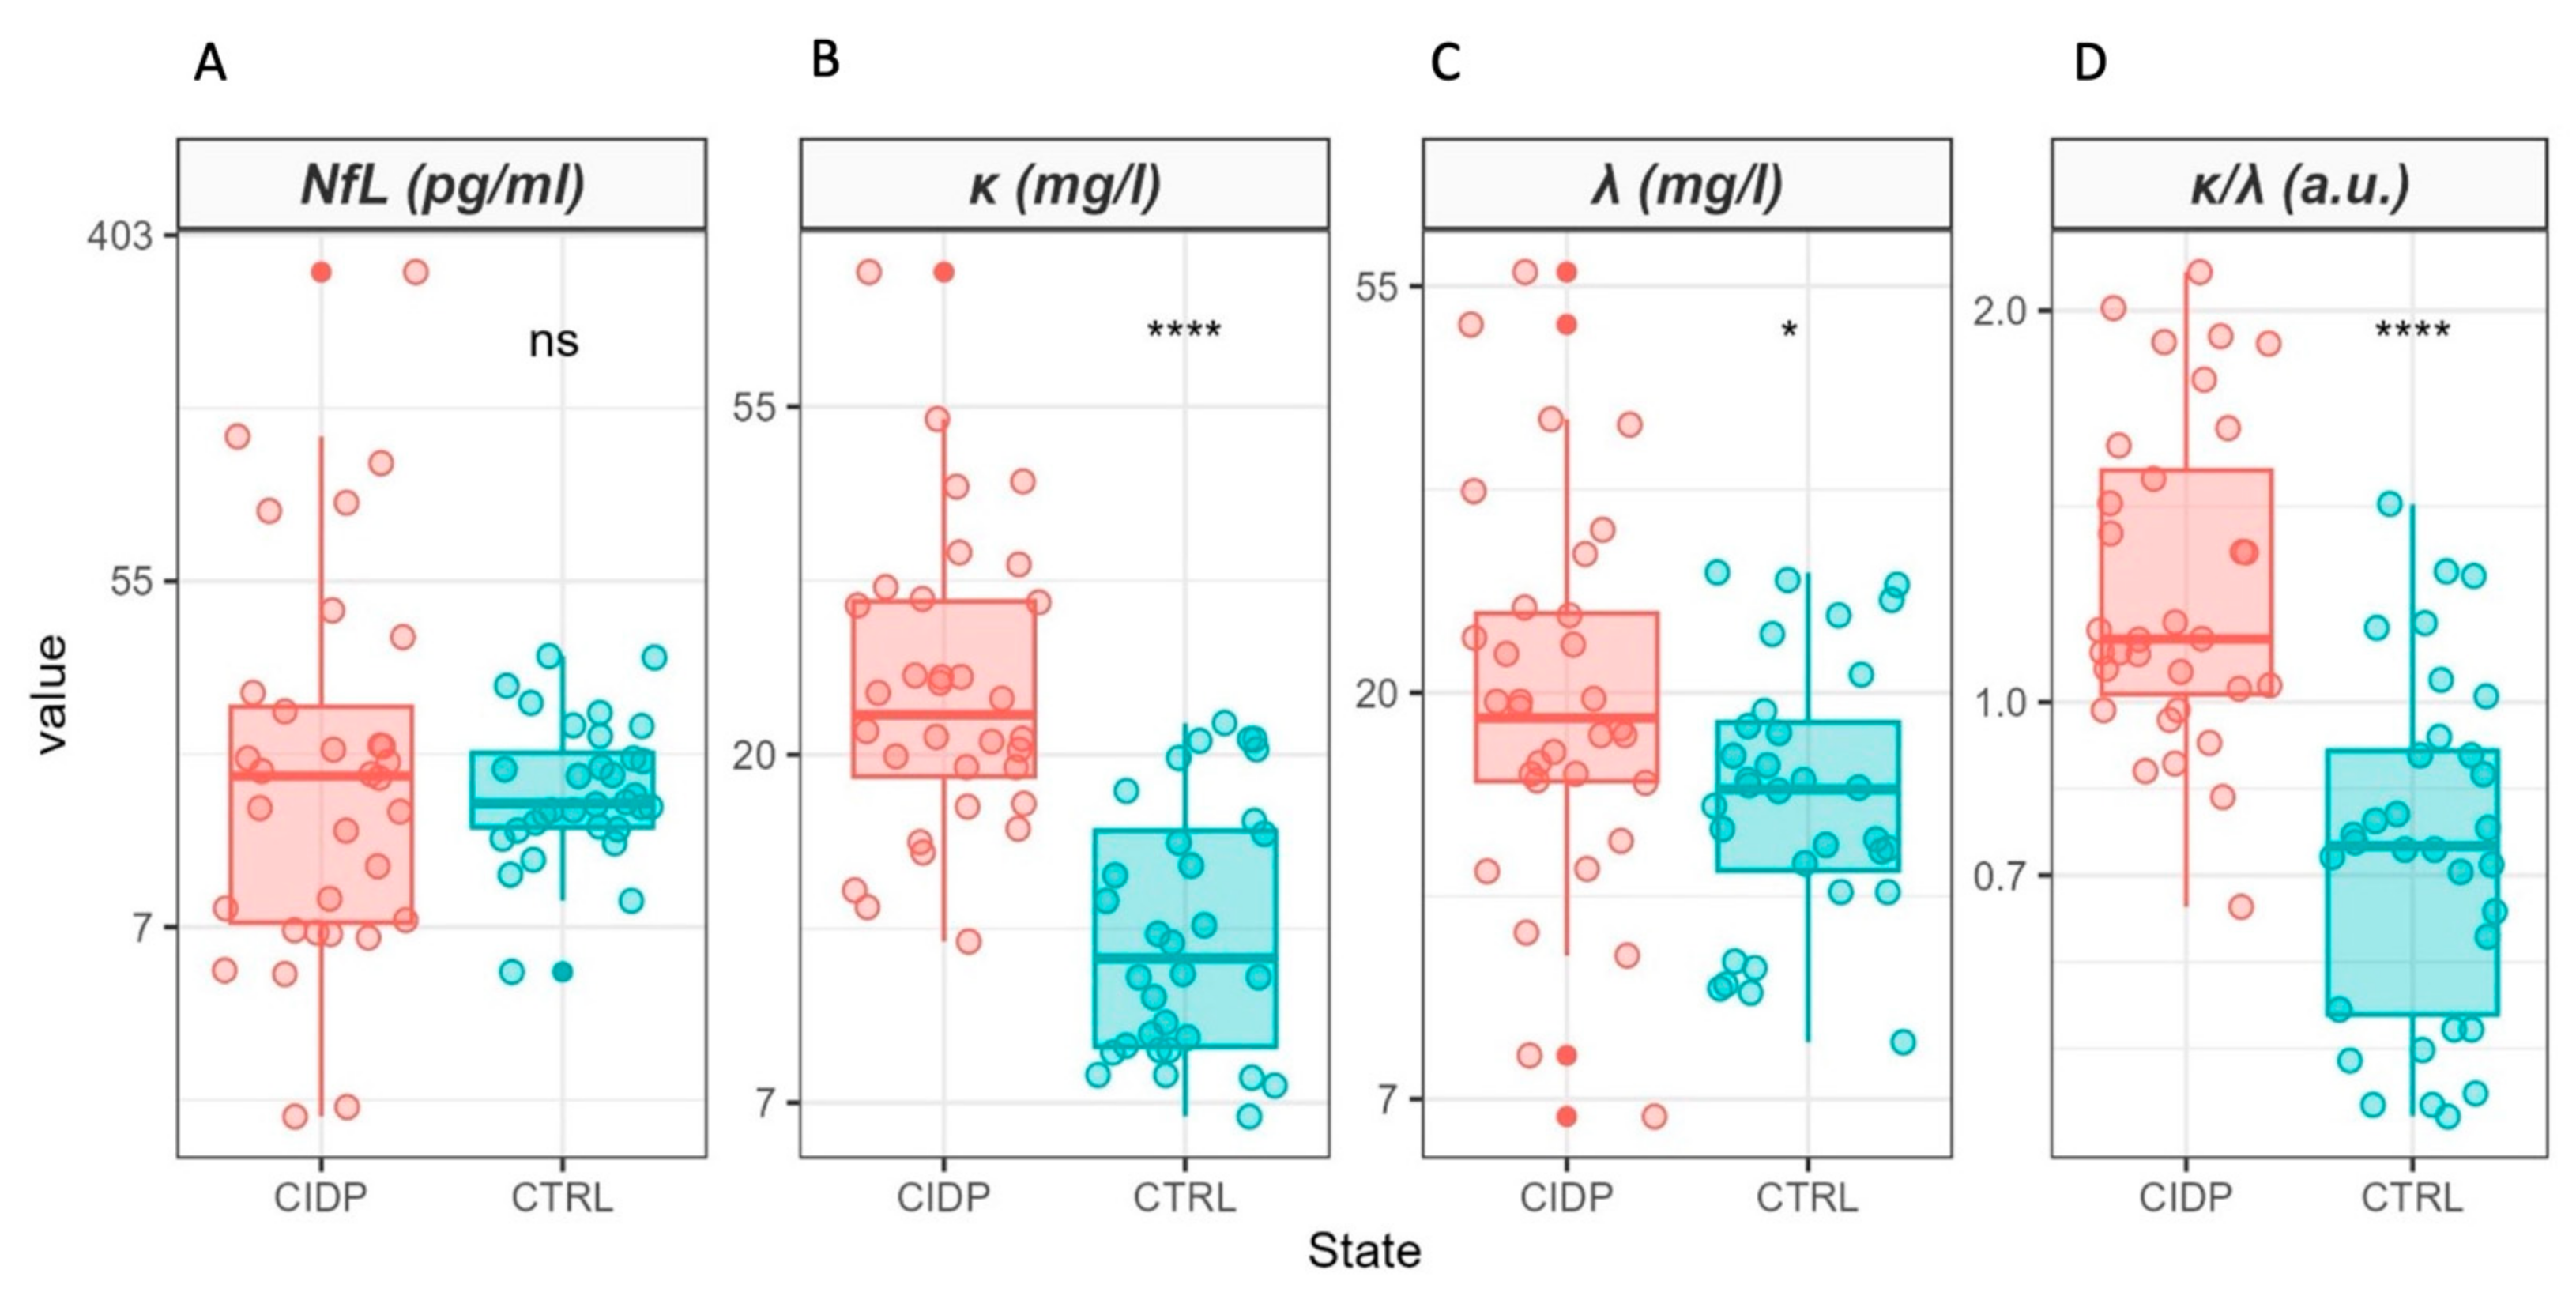
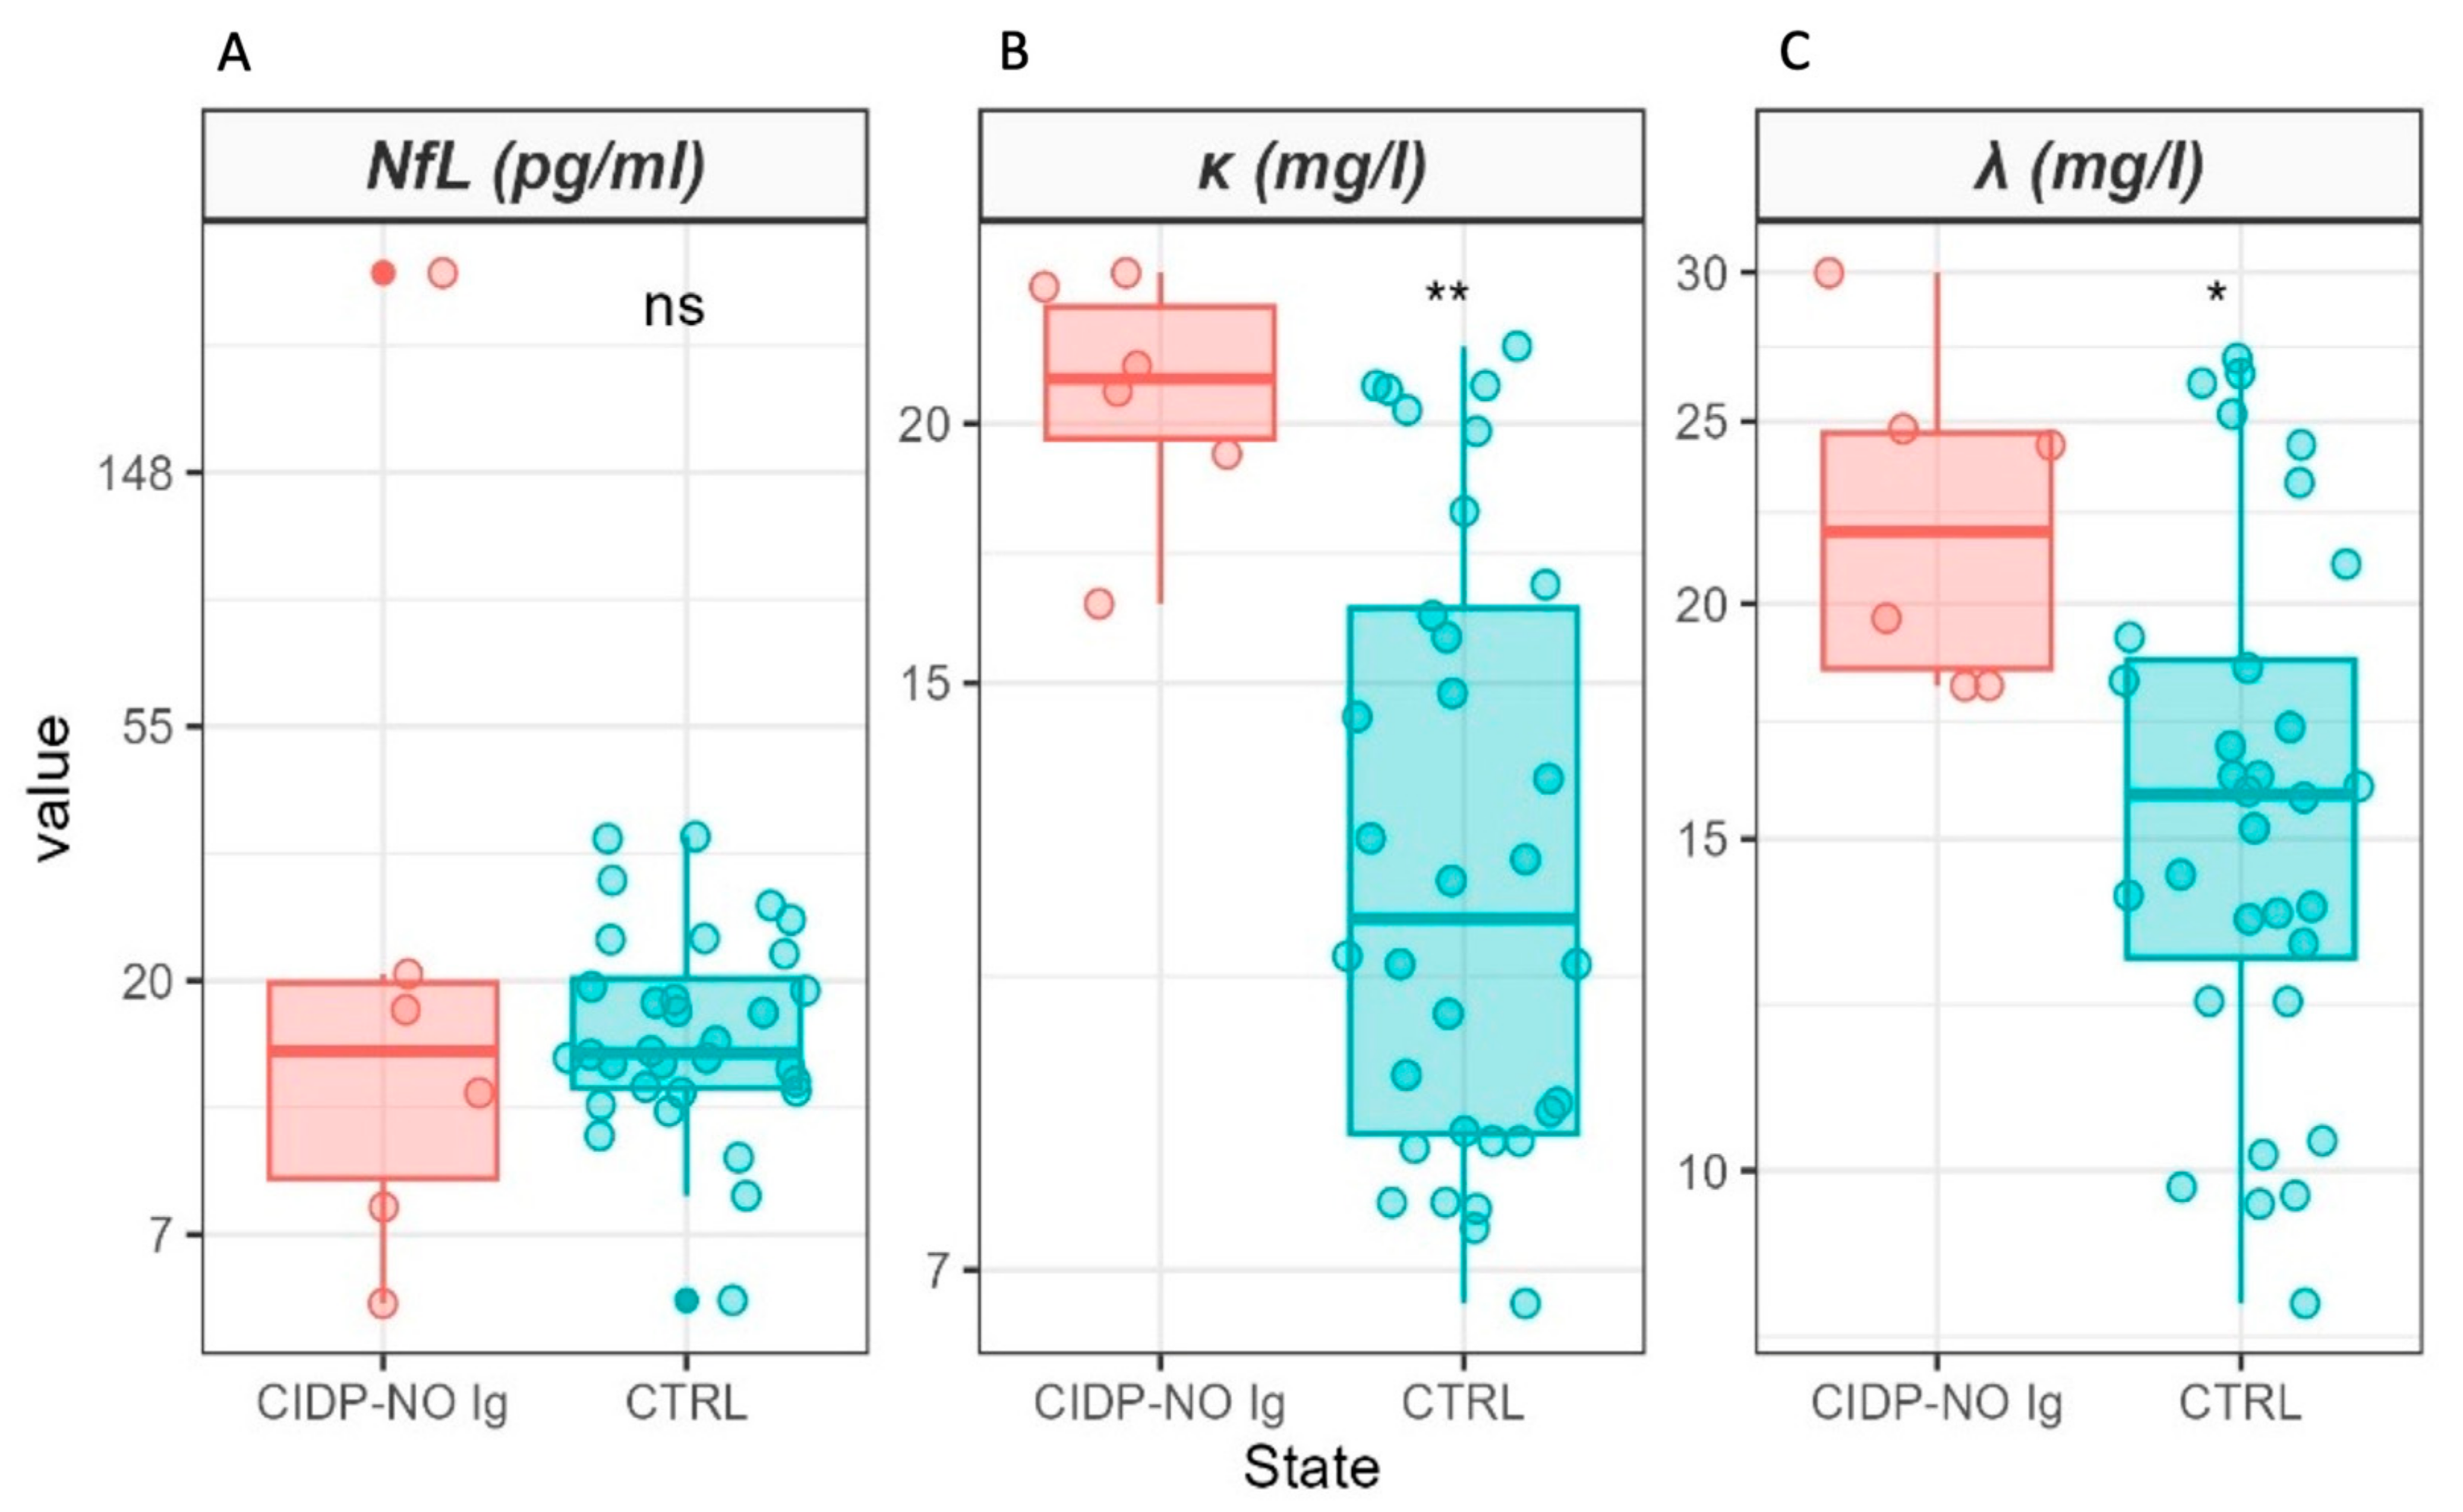
2. Results
3. Discussion
4. Materials and Methods
4.1. Patient Recruitment and Clinical Assessment
4.2. Laboratory Testing
4.3. Statistical Analysis
5. Conclusions
Author Contributions
Funding
Institutional Review Board Statement
Informed Consent Statement
Data Availability Statement
Acknowledgments
Conflicts of Interest
References
- Dziadkowiak, E.; Waliszewska-Prosół, M.; Nowakowska-Kotas, M.; Budrewicz, S.; Koszewicz, Z.; Koszewicz, M. Pathophysiology of the Different Clinical Phenotypes of Chronic Inflammatory Demyelinating Polyradiculoneuropathy (CIDP). Int. J. Mol. Sci. 2021, 23, 179. [Google Scholar] [CrossRef] [PubMed]
- Van den Bergh, P.Y.K.; van Doorn, P.A.; Hadden, R.D.M.; Avau, B.; Vankrunkelsven, P.; Allen, J.A.; Attarian, S.; Blomkwist-Markens, P.H.; Cornblath, D.R.; Eftimov, F.; et al. European Academy of Neurology/Peripheral Nerve Society guideline on diagnosis and treatment of chronic inflammatory demyelinating polyradiculoneuropathy: Report of a joint Task Force-Second revision. J. Peripher. Nerv. Syst. 2021, 26, 242–268. [Google Scholar] [CrossRef] [PubMed]
- Van Lieverloo, G.G.A.; Wieske, L.; Verhamme, C.; Vrancken, A.F.J.; van Doorn, P.A.; Michalak, Z.; Barro, C.; van Schaik, I.N.; Kuhle, J.; Eftimov, F. Serum neurofilament light chain in chronic inflammatory demyelinating polyneuropathy. J. Peripher. Nerv. Syst. 2019, 24, 187–194. [Google Scholar] [CrossRef] [PubMed]
- Wieske, L.; Smyth, D.; Lunn, M.P.; Eftimov, F.; Teunissen, C.E. Fluid Biomarkers for Monitoring Structural Changes in Polyneuropathies: Their Use in Clinical Practice and Trials. Neurotherapeutics 2021, 18, 2351–2367. [Google Scholar] [CrossRef] [PubMed]
- Kmezic, I.; Samuelsson, K.; Finn, A.; Upate, Z.; Blennow, K.; Zetterberg, H.; Press, R. Neurofilament light chain and total tau in the differential diagnosis and prognostic evaluation of acute and chronic inflammatory polyneuropathies. Eur. J. Neurol. 2022, 29, 2810–2822. [Google Scholar] [CrossRef]
- Kapoor, M.; Carr, A.; Foiani, M.; Heslegrave, A.; Zetterberg, H.; Malaspina, A.; Compton, L.; Hutton, E.; Rossor, A.; Reilly, M.M.; et al. Association of plasma neurofilament light chain with disease activity in chronic inflammatory demyelinating polyradiculoneuropathy. Eur. J. Neurol. 2022, 29, 3347–3357. [Google Scholar] [CrossRef] [PubMed]
- Disanto, G.; Barro, C.; Benkert, P.; Naegelin, Y.; Schädelin, S.; Giardiello, A.; Zecca, C.; Blennow, K.; Zetterberg, H.; Leppert, D.; et al. Serum Neurofilament light: A biomarker of neuronal damage in multiple sclerosis. Ann. Neurol. 2017, 81, 857–870. [Google Scholar] [CrossRef]
- Gaetani, L.; Blennow, K.; Calabresi, P.; Di Filippo, M.; Parnetti, L.; Zetterberg, H. Neurofilament light chain as a biomarker in neurological disorders. J. Neurol. Neurosurg. Psychiatry 2019, 90, 870–881. [Google Scholar] [CrossRef]
- Shastri, A.; Al Aiyan, A.; Kishore, U.; Farrugia, M.E. Immune-Mediated Neuropathies: Pathophysiology and Management. Int. J. Mol. Sci. 2023, 24, 7288. [Google Scholar] [CrossRef]
- Arneth, B.; Kraus, J. The Use of Kappa Free Light Chains to Diagnose Multiple Sclerosis. Medicina 2022, 58, 1512. [Google Scholar] [CrossRef]
- Hegen, H.; Walde, J.; Berek, K.; Arrambide, G.; Gnanapavan, S.; Kaplan, B.; Khalil, M.; Saadeh, R.; Teunissen, C.; Tumani, H.; et al. Cerebrospinal fluid kappa free light chains for the diagnosis of multiple sclerosis: A systematic review and meta-analysis. Mult. Scler. 2023, 29, 169–181. [Google Scholar] [CrossRef] [PubMed]
- Singh, G.; Cotter, T.; Ye Mon, M.; Xu, H.; Bollag, R.J. Quantification of Free Immunoglobulin Light Chains in Urine. J. Appl. Lab. Med. 2023, 8, 1101–1114. [Google Scholar] [CrossRef] [PubMed]
- Brebner, J.A.; Stockley, R.A. Polyclonal free light chains: A biomarker of inflammatory disease or treatment target? F1000 Med. Rep. 2013, 5, 4. [Google Scholar] [CrossRef] [PubMed]
- Napodano, C.; Pocino, K.; Rigante, D.; Stefanile, A.; Gulli, F.; Marino, M.; Basile, V.; Rapaccini, G.L.; Basile, U. Free light chains and autoimmunity. Autoimmun. Rev. 2019, 18, 484–492. [Google Scholar] [CrossRef] [PubMed]
- Gulli, F.; Napodano, C.; Marino, M.; Ciasca, G.; Pocino, K.; Basile, V.; Visentini, M.; Stefanile, A.; Todi, L.; De Spirito, M.; et al. Serum immunoglobulin free light chain levels in systemic autoimmune rheumatic diseases. Clin. Exp. Immunol. 2020, 199, 163–171. [Google Scholar] [CrossRef] [PubMed]
- Shaw, A.C.; Swat, W.; Davidson, L.; Alt, F.W. Induction of Ig light chain gene rearrangement in heavy chain-deficient B cells by activated Ras. Proc. Natl. Acad. Sci. USA 1999, 96, 2239–2243. [Google Scholar] [CrossRef] [PubMed]
- Gudowska-Sawczuk, M.; Mroczko, B. Free Light Chains κ and λ as New Biomarkers of Selected Diseases. Int. J. Mol. Sci. 2023, 24, 9531. [Google Scholar] [CrossRef] [PubMed]
- Kaya, Z.Z.; Tuzuner, M.B.; Sahin, B.; Akgun, E.; Aksungar, F.; Koca, S.; Serdar, M.; Sahin, S.; Cinar, N.; Karsidag, S.; et al. Kappa/Lambda light-chain typing in Alzheimer’s Disease. Curr. Alzheimer Res. 2022, 19, 84–93. [Google Scholar] [CrossRef]
- Konen, F.F.; Wurster, U.; Witte, T.; Jendretzky, K.F.; Gingele, S.; Tumani, H.; Sühs, K.-W.; Stangel, M.; Schwenkenbecher, P.; Skripuletz, T. The Impact of Immunomodulatory Treatment on Kappa Free Light Chains as Biomarker in Neuroinflammation. Cells 2020, 9, 842. [Google Scholar] [CrossRef]
- Khalil, M.; Pirpamer, L.; Hofer, E.; Voortman, M.M.; Barro, C.; Leppert, D.; Benkert, P.; Ropele, S.; Enzinger, C.; Fazekas, F.; et al. Serum neurofilament light levels in normal aging and their association with morphologic brain changes. Nat. Commun. 2020, 11, 812. [Google Scholar] [CrossRef]
- Pocino, K.; Napodano, C.; Gragnani, L.; Ciasca, G.; Colantuono, S.; Marri, S.; Vantaggio, L.; Gulli, F.; Lorini, S.; Barini, A.; et al. Solving the mystery of HBV-related mixed cryoglobulinemia: Potential biomarkers of disease progression. Rheumatology 2021, 60, 4418–4427. [Google Scholar] [CrossRef]
- Pocino, K.; Napodano, C.; Marino, M.; Di Santo, R.; Miele, L.; De Matthaeis, N.; Gulli, F.; Saporito, R.; Rapaccini, G.L.; Ciasca, G.; et al. A Comparative Study of Serum Angiogenic Biomarkers in Cirrhosis and Hepatocellular Carcinoma. Cancers 2021, 14, 11. [Google Scholar] [CrossRef]
- R Core Team. R: A Language and Environment for Statistical Computing; R Foundation for Statistical Computing: Vienna, Austria, 2016; Available online: https://www.R-project.org/ (accessed on 23 December 2023).
- Sjoberg, D.; Whiting, K.; Curry, M.; Jessica, A.L.; Larmarange, J. Reproducible Summary Tables with the gtsummary Package. R J. 2021, 13, 570–580. [Google Scholar] [CrossRef]
- Wei, T.; Simko, V.; Levy, M.; Xie, Y.; Jin, Y.; Zemla, J. Package ‘corrplot’. Statistician 2017, 56, 316–324. [Google Scholar]
- Napodano, C.; Callà, C.; Fiorita, A.; Marino, M.; Taddei, E.; Di Cesare, T.; Passali, G.C.; Di Santo, R.; Stefanile, A.; Fantoni, M.; et al. Salivary Biomarkers in COVID-19 Patients: Towards a Wide-Scale Test for Monitoring Disease Activity. J. Pers. Med. 2021, 11, 385. [Google Scholar] [CrossRef] [PubMed]
- Wei, T.; Simko, V. Corrplot: Visualization of a Correlation Matrix. R Package Version 0.77. 2016. Available online: https://cran.r-project.org/package=corrplot (accessed on 23 December 2023).


| Variable | N | CIDP, N = 32 1 | CTRL, N = 32 1 | p-Value 2 |
|---|---|---|---|---|
| Age | 64 | 56 (43, 72) | 53 (48, 59) | 0.4 |
| Sex | 64 | >0.9 | ||
| F | 13/32 (41%) | 13/32 (41%) | ||
| M | 19/32 (59%) | 19/32 (59%) | ||
| NfL (pg/mL) | 64 | 18 (8, 26) | 15 (13, 20) | 0.9 |
| κ (mg/L) | 64 | 23 (19, 31) | 11 (9, 16) | <0.001 |
| λ (mg/L) | 64 | 19 (16, 24) | 16 (13, 19) | 0.022 |
| κ/λ (a.u.) | 64 | 1.12 (1.01, 1.51) | 0.78 (0.58, 0.92) | <0.001 |
| mRS | 32 | |||
| <4 | 28/32 (88%) | |||
| ≥4 | 4/32 (12%) | |||
| ONLS—arm score | 32 | |||
| <3 | 19/32 (59%) | |||
| ≥3 | 13/32 (41%) | |||
| ONLS—leg score | 32 | |||
| <4 | 29/32 (91%) | |||
| ≥4 | 3/32 (9.4%) | |||
| ONLS | 32 | |||
| <7 | 28/32 (88%) | |||
| ≥7 | 4/32 (12%) |
| Variable | Coefficient | SE | p-Value |
|---|---|---|---|
| Intercept | 4.03 | 3.24 | 0.22 |
| λ | 0.54 | 0.19 | 0.006 |
| CIDP | −0.48 | 3.92 | 0.9 |
| λ*CIDP | 0.52 | 0.21 | 0.02 |
| F(3,59) = 81.7; p-value < 2.2 × 10− 16; Adj. R2 = 0.80 | |||
| Variable | Coefficient | SE | p-Value |
|---|---|---|---|
| Intercept | −2.46 | 4.67 | 0.60 |
| Age | 0.38 | 0.09 | 0.0001 |
| F(1,30) = 19.4; p-value < 1.2 × 10⁻⁴; Adj. R2 = 0.37 | |||
Disclaimer/Publisher’s Note: The statements, opinions and data contained in all publications are solely those of the individual author(s) and contributor(s) and not of MDPI and/or the editor(s). MDPI and/or the editor(s) disclaim responsibility for any injury to people or property resulting from any ideas, methods, instructions or products referred to in the content. |
© 2024 by the authors. Licensee MDPI, Basel, Switzerland. This article is an open access article distributed under the terms and conditions of the Creative Commons Attribution (CC BY) license (https://creativecommons.org/licenses/by/4.0/).
Share and Cite
Luigetti, M.; Primiano, G.; Basile, V.; Vitali, F.; Pignalosa, S.; Romano, A.; Sabino, A.; Marino, M.; Di Santo, R.; Ciasca, G.; et al. Serum Neurofilament and Free Light Chain Levels in Patients Undergoing Treatment for Chronic Inflammatory Demyelinating Polyneuropathy. Int. J. Mol. Sci. 2024, 25, 1254. https://doi.org/10.3390/ijms25021254
Luigetti M, Primiano G, Basile V, Vitali F, Pignalosa S, Romano A, Sabino A, Marino M, Di Santo R, Ciasca G, et al. Serum Neurofilament and Free Light Chain Levels in Patients Undergoing Treatment for Chronic Inflammatory Demyelinating Polyneuropathy. International Journal of Molecular Sciences. 2024; 25(2):1254. https://doi.org/10.3390/ijms25021254
Chicago/Turabian StyleLuigetti, Marco, Guido Primiano, Valerio Basile, Francesca Vitali, Stefano Pignalosa, Angela Romano, Andrea Sabino, Mariapaola Marino, Riccardo Di Santo, Gabriele Ciasca, and et al. 2024. "Serum Neurofilament and Free Light Chain Levels in Patients Undergoing Treatment for Chronic Inflammatory Demyelinating Polyneuropathy" International Journal of Molecular Sciences 25, no. 2: 1254. https://doi.org/10.3390/ijms25021254
APA StyleLuigetti, M., Primiano, G., Basile, V., Vitali, F., Pignalosa, S., Romano, A., Sabino, A., Marino, M., Di Santo, R., Ciasca, G., & Basile, U. (2024). Serum Neurofilament and Free Light Chain Levels in Patients Undergoing Treatment for Chronic Inflammatory Demyelinating Polyneuropathy. International Journal of Molecular Sciences, 25(2), 1254. https://doi.org/10.3390/ijms25021254