

Integration of Cell-Free DNA End Motifs and Fragment Lengths Can Identify Active Genes in Liquid Biopsies
 , , and
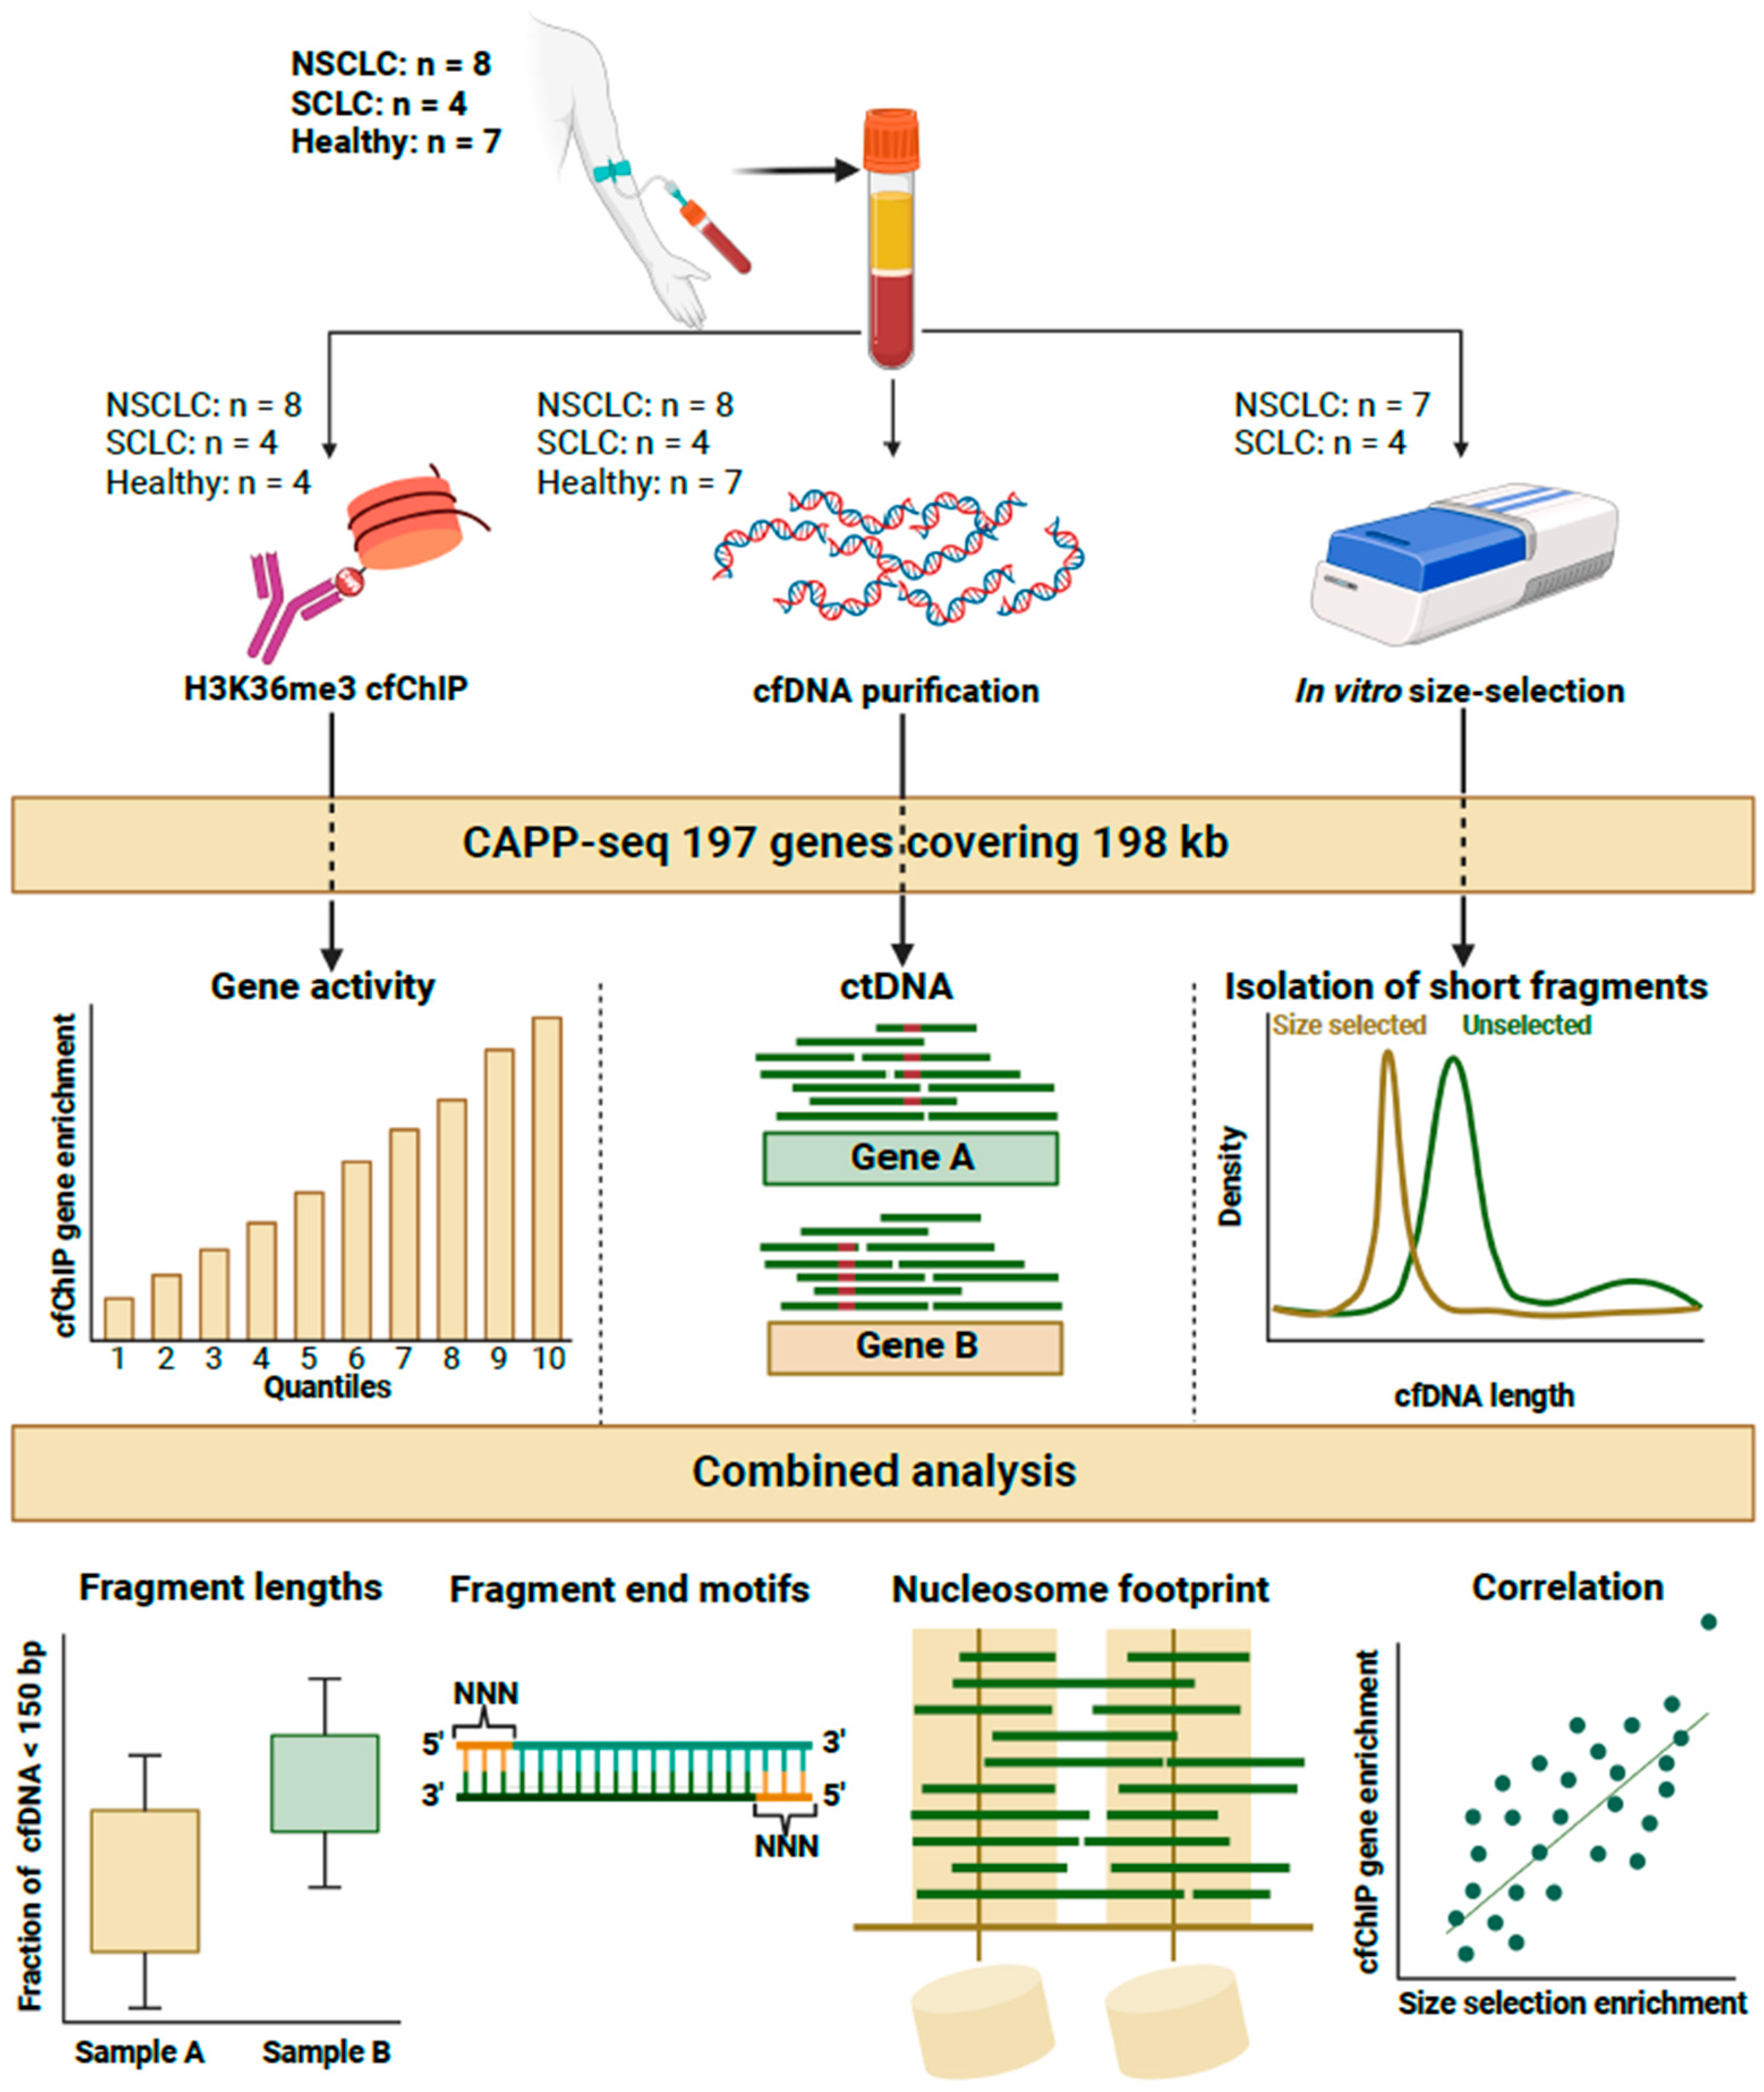
Abstract
1. Introduction
2. Results
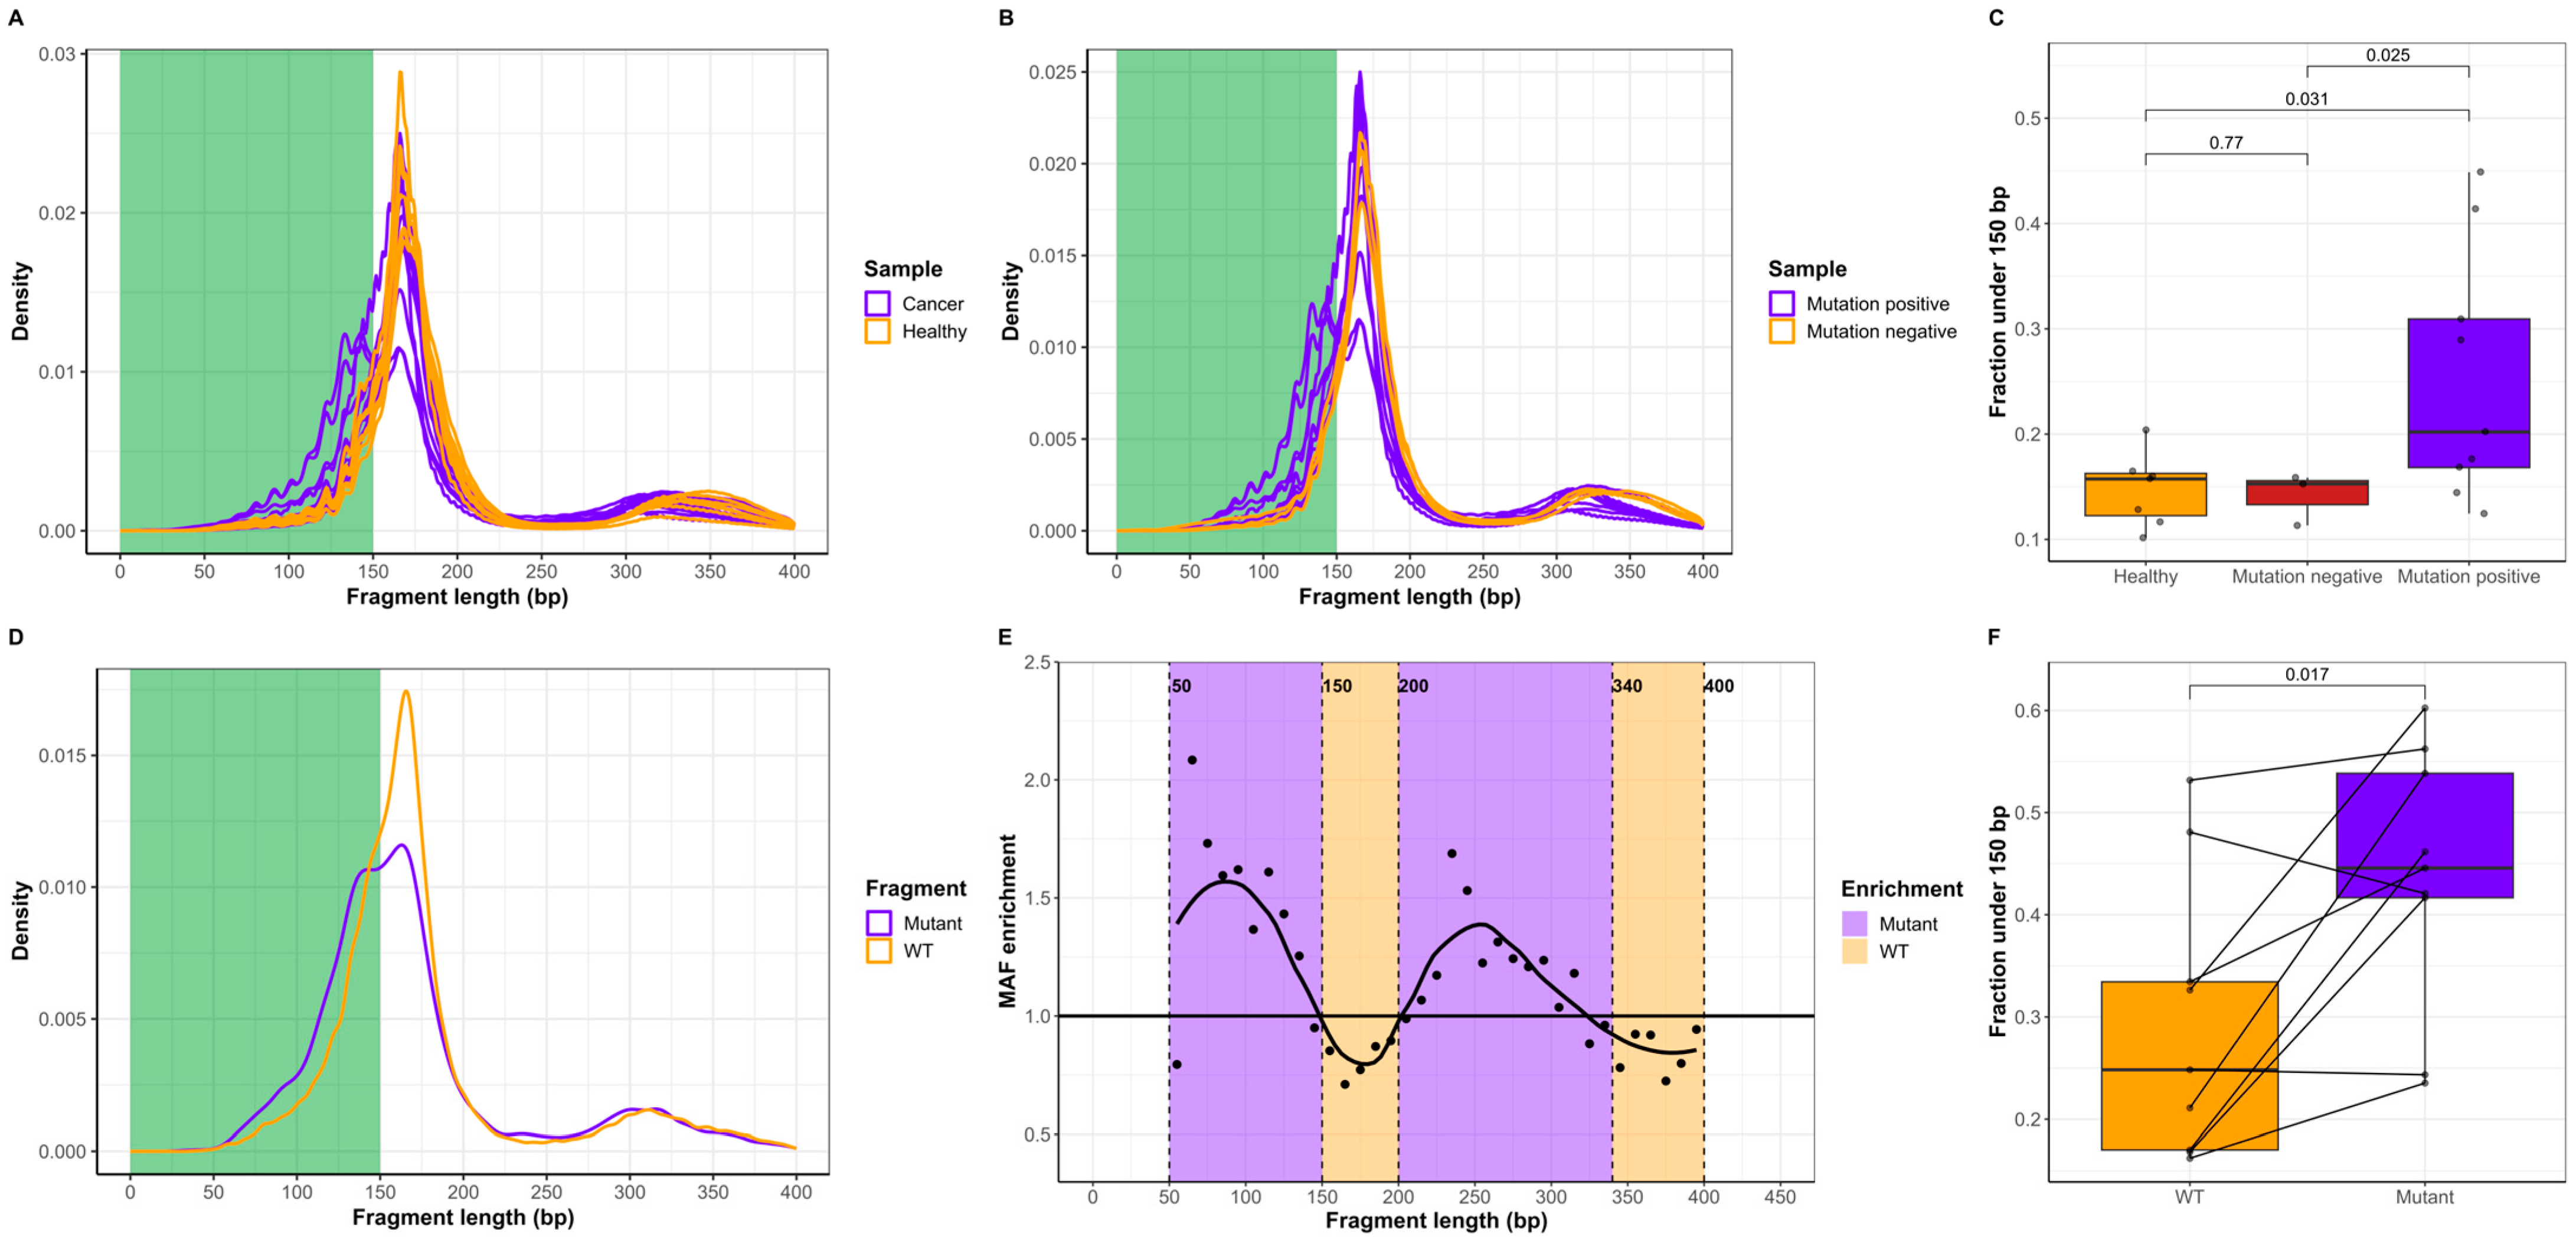
2.1. ctDNA Is Shorter Than cfDNA of Noncancer Origin
2.2. cfDNA Originating from Genes with High Expression Is Shorter Than cfDNA from Genes with Low Expression
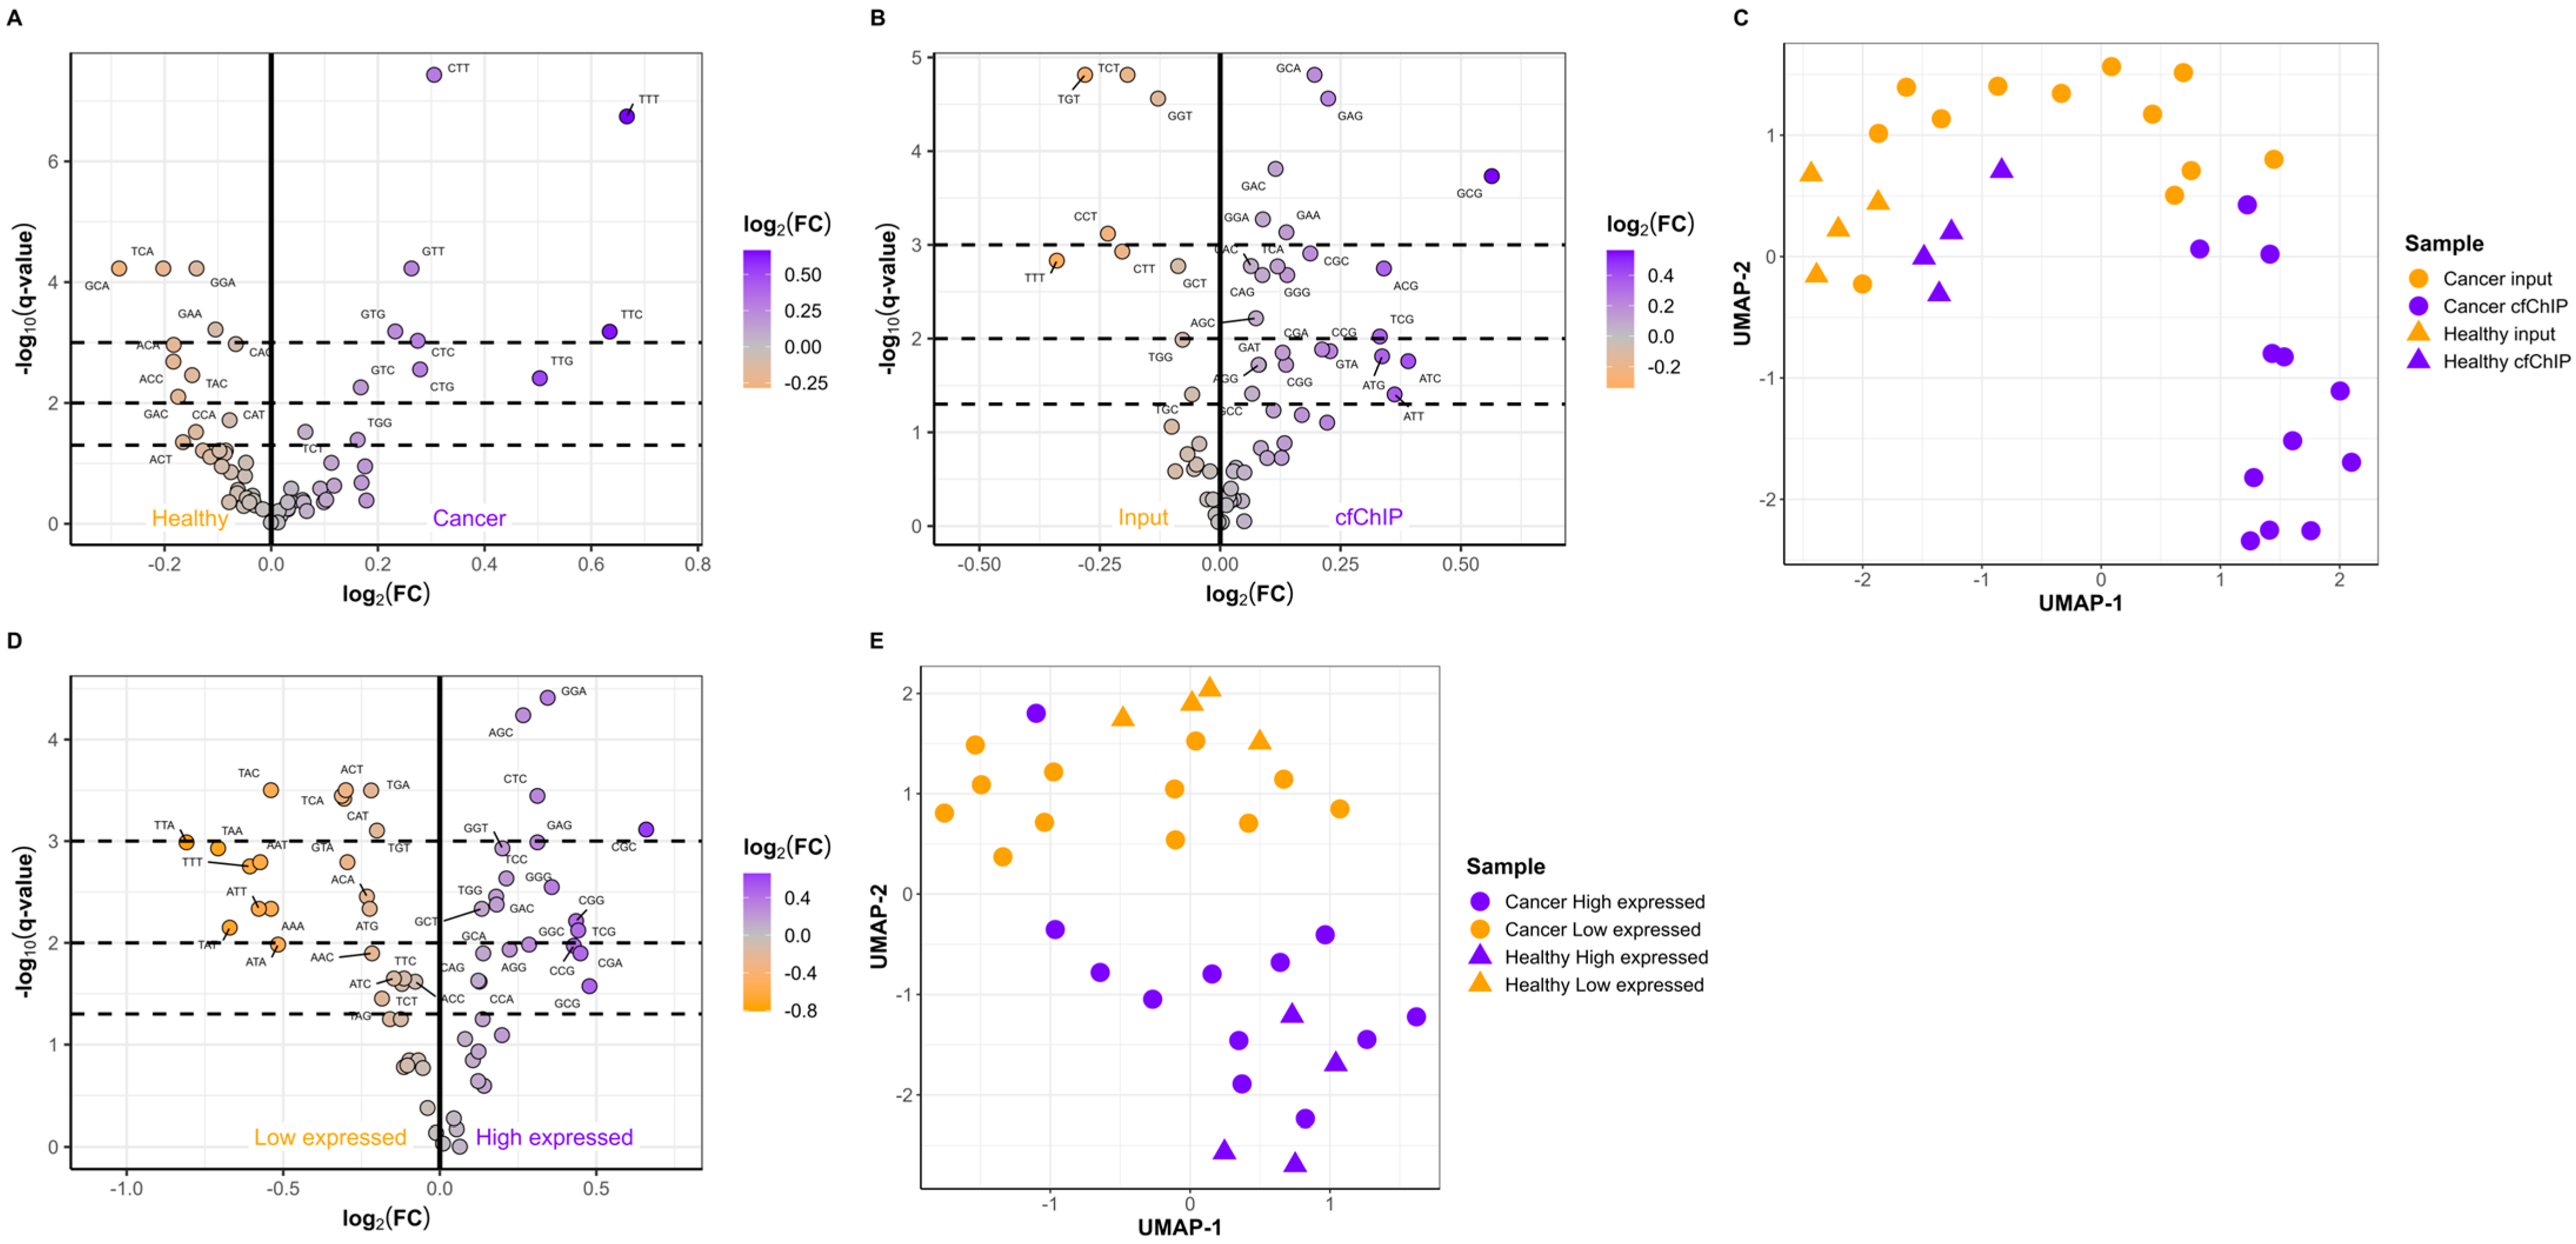
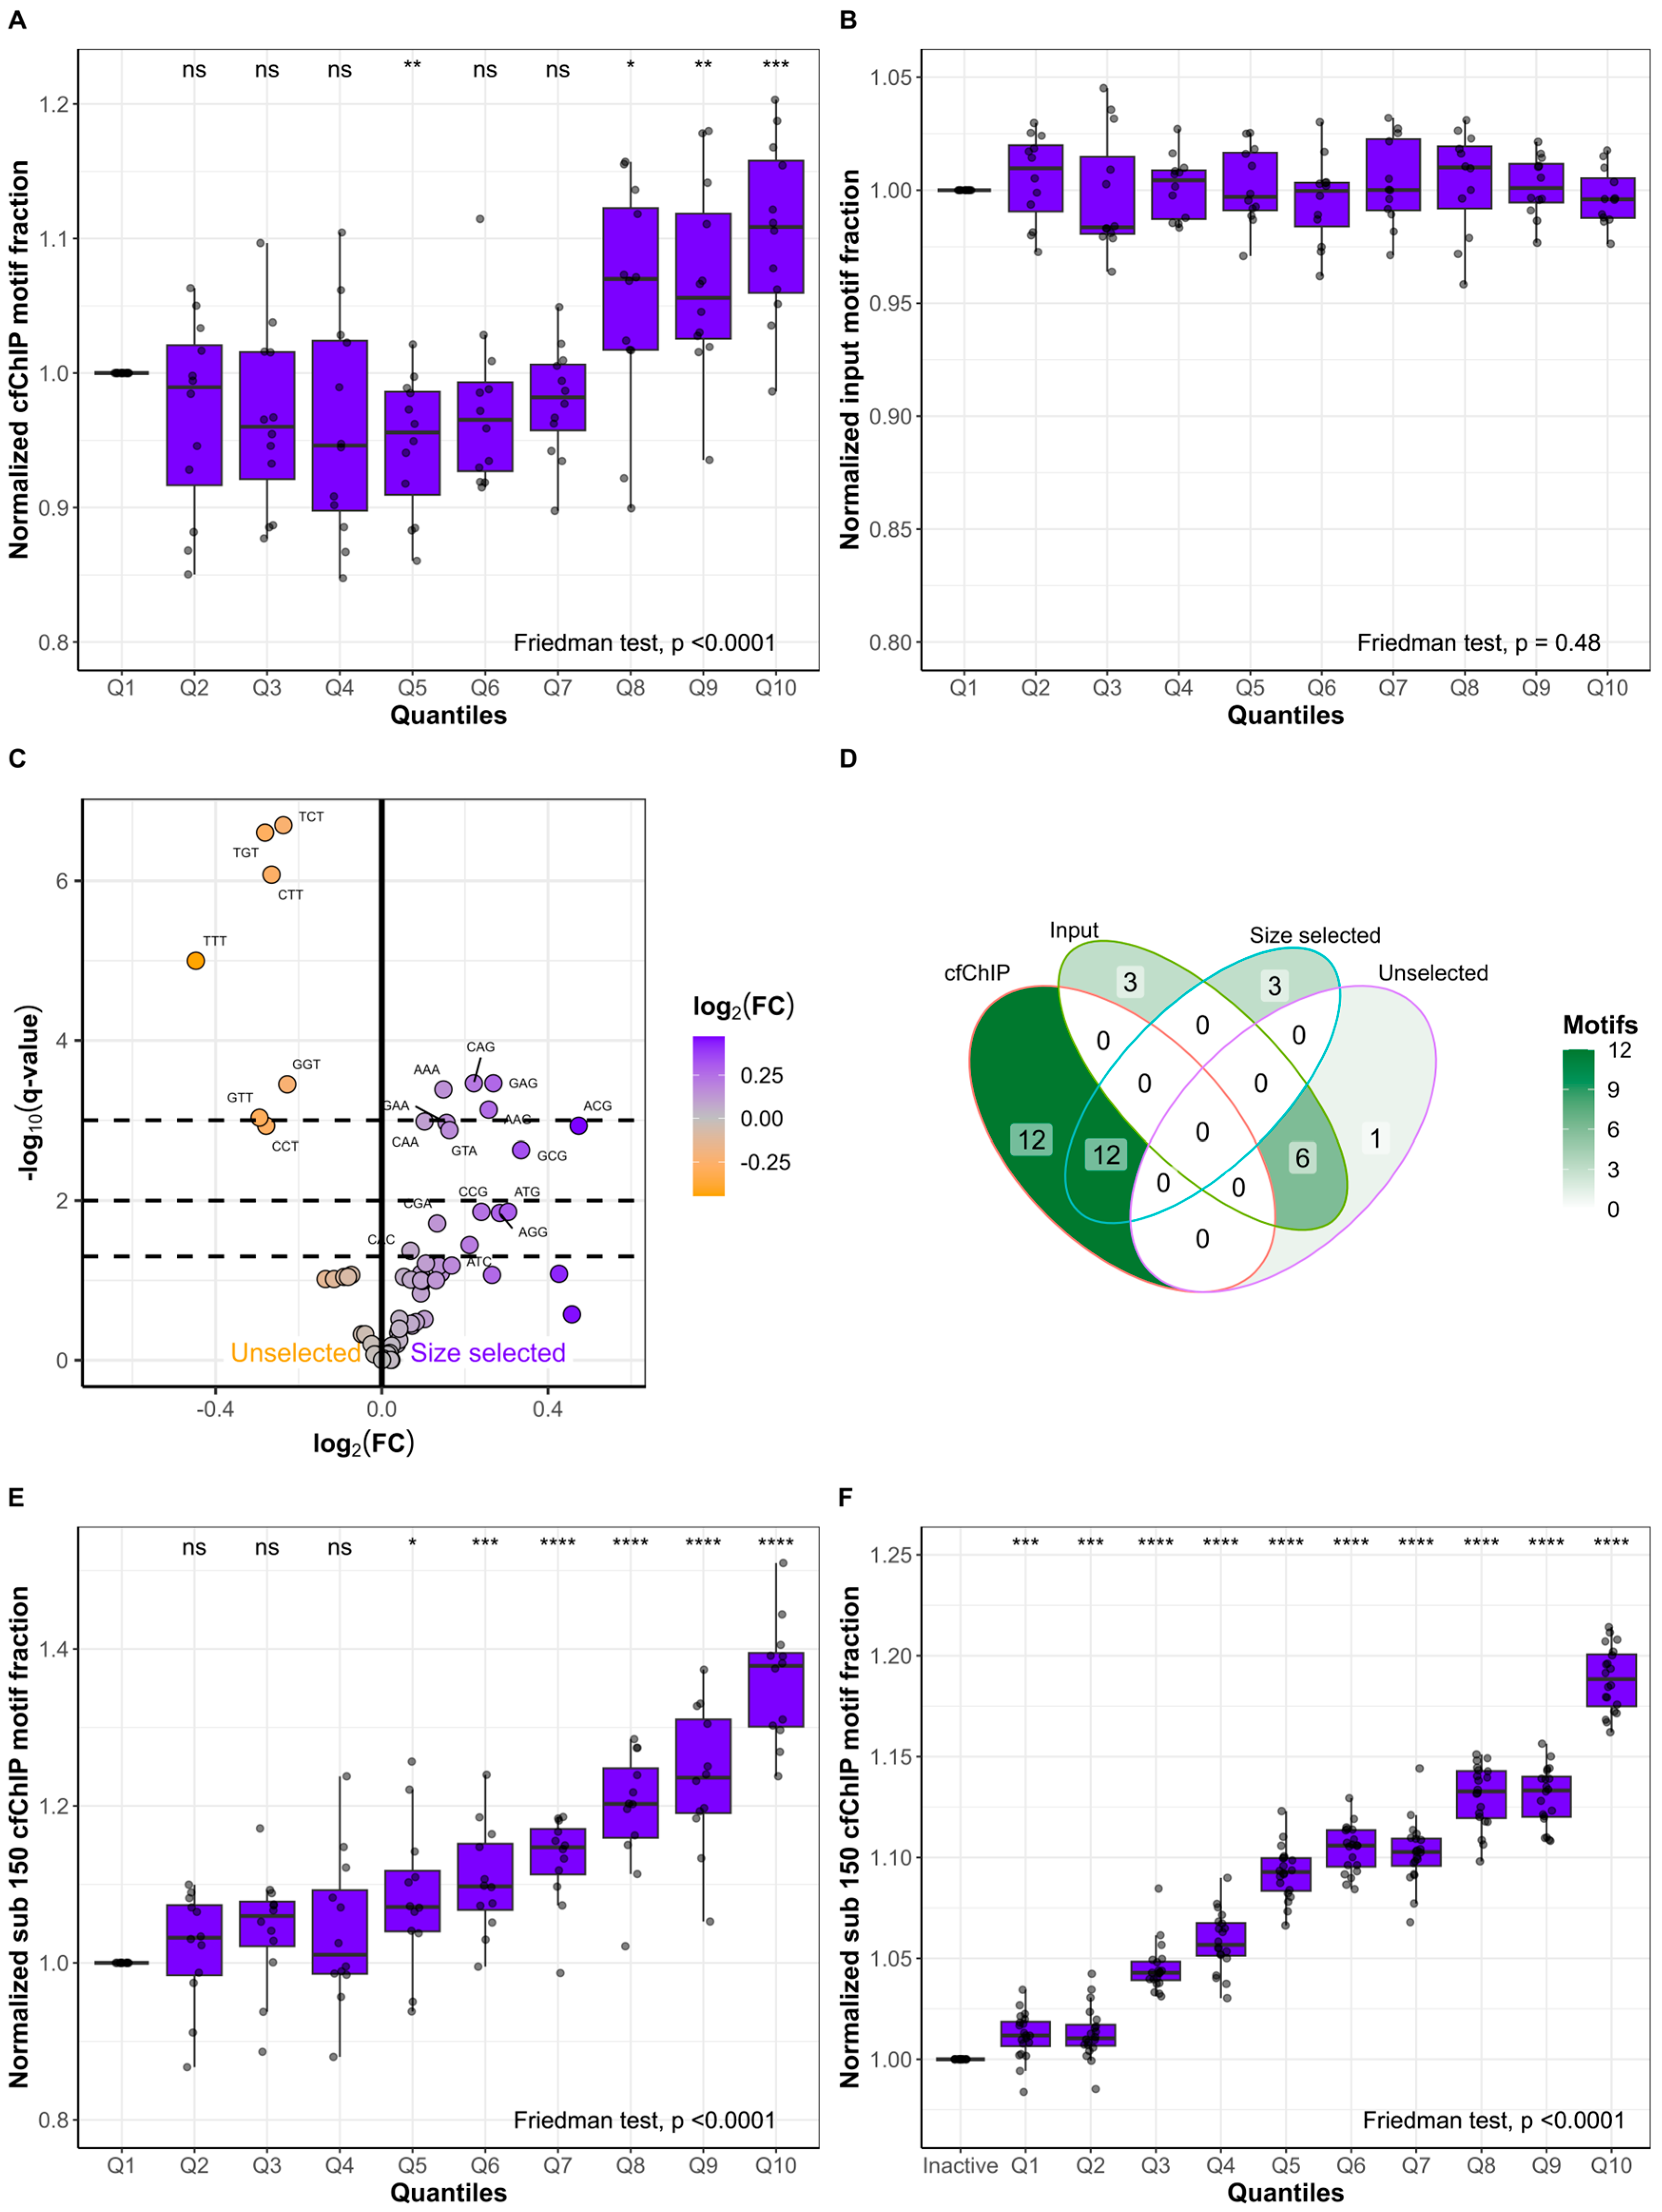
2.3. The Active Genes Have Distinct cfDNA FEMs
2.4. Short Fragments Have Distinct FEMs and Originate from Active Genes
3. Discussion
4. Materials and Methods
4.1. Plasma Samples
4.2. Cell-Free Chromatin Immunoprecipitaiton (cfChIP) Enrichment
4.3. In Vitro Size Selection
4.4. CAPP-Seq
4.5. ctDNA Detection
4.6. Fragment Length and FEM Analyses
4.7. High/Low-Expressed Genes and cfChIP Quantiles
4.8. Nucleosomal Positioning Analysis
4.9. Validation Data
4.10. Statistical Analysis
5. Conclusions
Supplementary Materials
Author Contributions
Funding
Institutional Review Board Statement
Informed Consent Statement
Data Availability Statement
Acknowledgments
Conflicts of Interest
References
- Diehl, F.; Schmidt, K.; Choti, M.A.; Romans, K.; Goodman, S.; Li, M.; Thornton, K.; Agrawal, N.; Sokoll, L.; Szabo, S.A.; et al. Circulating mutant DNA to assess tumor dynamics. Nat. Med. 2008, 14, 985–990. [Google Scholar] [CrossRef] [PubMed]
- Newman, A.M.; Bratman, S.V.; To, J.; Wynne, J.F.; Eclov, N.C.; Modlin, L.A.; Liu, C.L.; Neal, J.W.; Wakelee, H.A.; Merritt, R.E.; et al. An ultrasensitive method for quantitating circulating tumor DNA with broad patient coverage. Nat. Med. 2014, 20, 548–554. [Google Scholar] [CrossRef]
- Oxnard, G.R.; Paweletz, C.P.; Kuang, Y.; Mach, S.L.; O’Connell, A.; Messineo, M.M.; Luke, J.J.; Butaney, M.; Kirschmeier, P.; Jackman, D.M.; et al. Noninvasive detection of response and resistance in EGFR-mutant lung cancer using quantitative next-generation genotyping of cell-free plasma DNA. Clin. Cancer Res. 2014, 20, 1698–1705. [Google Scholar] [CrossRef]
- Mouliere, F.; Chandrananda, D.; Piskorz, A.M.; Moore, E.K.; Morris, J.; Ahlborn, L.B.; Mair, R.; Goranova, T.; Marass, F.; Heider, K.; et al. Enhanced detection of circulating tumor DNA by fragment size analysis. Sci. Transl. Med. 2018, 10, eaat4921. [Google Scholar] [CrossRef] [PubMed]
- Xi, L.; Pham, T.H.; Payabyab, E.C.; Sherry, R.M.; Rosenberg, S.A.; Raffeld, M. Circulating Tumor DNA as an Early Indicator of Response to T-cell Transfer Immunotherapy in Metastatic Melanoma. Clin. Cancer Res. 2016, 22, 5480–5486. [Google Scholar] [CrossRef] [PubMed]
- Weber, S.; van der Leest, P.; Donker, H.C.; Schlange, T.; Timens, W.; Tamminga, M.; Hasenleithner, S.O.; Graf, R.; Moser, T.; Spiegl, B.; et al. Dynamic Changes of Circulating Tumor DNA Predict Clinical Outcome in Patients With Advanced Non-Small-Cell Lung Cancer Treated With Immune Checkpoint Inhibitors. JCO Precis. Oncol. 2021, 5, 1540–1553. [Google Scholar] [CrossRef] [PubMed]
- Tie, J.; Kinde, I.; Wang, Y.; Wong, H.L.; Roebert, J.; Christie, M.; Tacey, M.; Wong, R.; Singh, M.; Karapetis, C.S.; et al. Circulating tumor DNA as an early marker of therapeutic response in patients with metastatic colorectal cancer. Ann. Oncol. 2015, 26, 1715–1722. [Google Scholar] [CrossRef]
- Gale, D.; Heider, K.; Ruiz-Valdepenas, A.; Hackinger, S.; Perry, M.; Marsico, G.; Rundell, V.; Wulff, J.; Sharma, G.; Knock, H.; et al. Residual ctDNA after treatment predicts early relapse in patients with early-stage non-small cell lung cancer. Ann. Oncol. 2022, 33, 500–510. [Google Scholar] [CrossRef]
- Budhraja, K.K.; McDonald, B.R.; Stephens, M.D.; Contente-Cuomo, T.; Markus, H.; Farooq, M.; Favaro, P.F.; Connor, S.; Byron, S.A.; Egan, J.B.; et al. Genome-wide analysis of aberrant position and sequence of plasma DNA fragment ends in patients with cancer. Sci. Transl. Med. 2023, 15, eabm6863. [Google Scholar] [CrossRef]
- Chabon, J.J.; Hamilton, E.G.; Kurtz, D.M.; Esfahani, M.S.; Moding, E.J.; Stehr, H.; Schroers-Martin, J.; Nabet, B.Y.; Chen, B.; Chaudhuri, A.A.; et al. Integrating genomic features for non-invasive early lung cancer detection. Nature 2020, 580, 245–251. [Google Scholar] [CrossRef]
- Kim, Y.J.; Jeon, H.; Jeon, S.; Lee, S.H.; Kim, C.; Ahn, J.H.; Um, H.; Woo, Y.J.; Jeong, S.H.; Kim, Y.; et al. A method for early diagnosis of lung cancer from tumor originated DNA fragments using plasma cfDNA methylome and fragmentome profiles. Mol. Cell. Probes 2022, 66, 101873. [Google Scholar] [CrossRef] [PubMed]
- Vessies, D.C.L.; Schuurbiers, M.M.F.; van der Noort, V.; Schouten, I.; Linders, T.C.; Lanfermeijer, M.; Ramkisoensing, K.L.; Hartemink, K.J.; Monkhorst, K.; van den Heuvel, M.M.; et al. Combining variant detection and fragment length analysis improves detection of minimal residual disease in postsurgery circulating tumour DNA of stage II-IIIA NSCLC patients. Mol. Oncol. 2022, 16, 2719–2732. [Google Scholar] [CrossRef] [PubMed]
- Mouliere, F.; Robert, B.; Arnau Peyrotte, E.; Del Rio, M.; Ychou, M.; Molina, F.; Gongora, C.; Thierry, A.R. High fragmentation characterizes tumour-derived circulating DNA. PLoS ONE 2011, 6, e23418. [Google Scholar] [CrossRef] [PubMed]
- Ishida, Y.; Takano, S.; Maekawa, S.; Yamaguchi, T.; Yoshida, T.; Kobayashi, S.; Iwamoto, F.; Kuno, T.; Hayakawa, H.; Matsuda, S.; et al. Fractionated small cell-free DNA increases possibility to detect cancer-related gene mutations in advanced colorectal cancer. JGH Open 2020, 4, 978–986. [Google Scholar] [CrossRef]
- Markus, H.; Chandrananda, D.; Moore, E.; Mouliere, F.; Morris, J.; Brenton, J.D.; Smith, C.G.; Rosenfeld, N. Refined characterization of circulating tumor DNA through biological feature integration. Sci. Rep. 2022, 12, 1928. [Google Scholar] [CrossRef]
- Jiang, P.; Chan, C.W.; Chan, K.C.; Cheng, S.H.; Wong, J.; Wong, V.W.; Wong, G.L.; Chan, S.L.; Mok, T.S.; Chan, H.L.; et al. Lengthening and shortening of plasma DNA in hepatocellular carcinoma patients. Proc. Natl. Acad. Sci. USA 2015, 112, E1317–E1325. [Google Scholar] [CrossRef] [PubMed]
- Sun, K.; Jiang, P.; Cheng, S.H.; Cheng, T.H.T.; Wong, J.; Wong, V.W.S.; Ng, S.S.M.; Ma, B.B.Y.; Leung, T.Y.; Chan, S.L.; et al. Orientation-aware plasma cell-free DNA fragmentation analysis in open chromatin regions informs tissue of origin. Genome Res. 2019, 29, 418–427. [Google Scholar] [CrossRef]
- Ulz, P.; Perakis, S.; Zhou, Q.; Moser, T.; Belic, J.; Lazzeri, I.; Wölfler, A.; Zebisch, A.; Gerger, A.; Pristauz, G.; et al. Inference of transcription factor binding from cell-free DNA enables tumor subtype prediction and early detection. Nat. Commun. 2019, 10, 4666. [Google Scholar] [CrossRef]
- Ulz, P.; Thallinger, G.G.; Auer, M.; Graf, R.; Kashofer, K.; Jahn, S.W.; Abete, L.; Pristauz, G.; Petru, E.; Geigl, J.B.; et al. Inferring expressed genes by whole-genome sequencing of plasma DNA. Nat. Genet. 2016, 48, 1273–1278. [Google Scholar] [CrossRef]
- Jiang, P.; Sun, K.; Peng, W.; Cheng, S.H.; Ni, M.; Yeung, P.C.; Heung, M.M.S.; Xie, T.; Shang, H.; Zhou, Z.; et al. Plasma DNA End-Motif Profiling as a Fragmentomic Marker in Cancer, Pregnancy, and Transplantation. Cancer Discov. 2020, 10, 664–673. [Google Scholar] [CrossRef]
- Guo, W.; Chen, X.; Liu, R.; Liang, N.; Ma, Q.; Bao, H.; Xu, X.; Wu, X.; Yang, S.; Shao, Y.; et al. Sensitive detection of stage I lung adenocarcinoma using plasma cell-free DNA breakpoint motif profiling. EBioMedicine 2022, 81, 104131. [Google Scholar] [CrossRef] [PubMed]
- Wang, Y.; Fan, X.; Bao, H.; Xia, F.; Wan, J.; Shen, L.; Wang, Y.; Zhang, H.; Wei, Y.; Wu, X.; et al. Utility of Circulating Free DNA Fragmentomics in the Prediction of Pathological Response after Neoadjuvant Chemoradiotherapy in Locally Advanced Rectal Cancer. Clin. Chem. 2023, 69, 88–99. [Google Scholar] [CrossRef] [PubMed]
- Esfahani, M.S.; Hamilton, E.G.; Mehrmohamadi, M.; Nabet, B.Y.; Alig, S.K.; King, D.A.; Steen, C.B.; Macaulay, C.W.; Schultz, A.; Nesselbush, M.C.; et al. Inferring gene expression from cell-free DNA fragmentation profiles. Nat. Biotechnol. 2022, 40, 585–597. [Google Scholar] [CrossRef]
- Snyder, M.W.; Kircher, M.; Hill, A.J.; Daza, R.M.; Shendure, J. Cell-free DNA Comprises an In Vivo Nucleosome Footprint that Informs Its Tissues-of-Origin. Cell 2016, 164, 57–68. [Google Scholar] [CrossRef]
- Månsson, C.T.; Vad-Nielsen, J.; Meldgaard, P.; Nielsen, A.L.; Sorensen, B.S. EGFR transcription in non-small-cell lung cancer tumours can be revealed in ctDNA by cell-free chromatin immunoprecipitation (cfChIP). Mol. Oncol. 2021, 15, 2868–2876. [Google Scholar] [CrossRef] [PubMed]
- Sadeh, R.; Sharkia, I.; Fialkoff, G.; Rahat, A.; Gutin, J.; Chappleboim, A.; Nitzan, M.; Fox-Fisher, I.; Neiman, D.; Meler, G.; et al. ChIP-seq of plasma cell-free nucleosomes identifies gene expression programs of the cells of origin. Nat. Biotechnol. 2021, 39, 586–598. [Google Scholar] [CrossRef] [PubMed]
- Vad-Nielsen, J.; Meldgaard, P.; Sorensen, B.S.; Nielsen, A.L. Cell-free Chromatin Immunoprecipitation (cfChIP) from blood plasma can determine gene-expression in tumors from non-small-cell lung cancer patients. Lung Cancer 2020, 147, 244–251. [Google Scholar] [CrossRef]
- Trier Maansson, C.; Meldgaard, P.; Stougaard, M.; Nielsen, A.L.; Sorensen, B.S. Cell-free chromatin immunoprecipitation can determine tumor gene expression in lung cancer patients. Mol. Oncol. 2023, 17, 722–736. [Google Scholar] [CrossRef]
- Huang, C.; Zhu, B. Roles of H3K36-specific histone methyltransferases in transcription: Antagonizing silencing and safeguarding transcription fidelity. Biophys. Rep. 2018, 4, 170–177. [Google Scholar] [CrossRef]
- Lerner, A.M.; Hepperla, A.J.; Keele, G.R.; Meriesh, H.A.; Yumerefendi, H.; Restrepo, D.; Zimmerman, S.; Bear, J.E.; Kuhlman, B.; Davis, I.J.; et al. An optogenetic switch for the Set2 methyltransferase provides evidence for transcription-dependent and -independent dynamics of H3K36 methylation. Genome Res. 2020, 30, 1605–1617. [Google Scholar] [CrossRef]
- Zhou, H.; Zhang, X.; Liu, Q.; Yang, J.; Bai, J.; Yin, M.; Cao, D.; Zhang, Q.; Zheng, L. Can circulating cell free DNA be a promising marker in ovarian cancer?—A genome-scale profiling study in a single institution. J. Ovarian Res. 2023, 16, 11. [Google Scholar] [CrossRef]
- Zhou, Q.; Kang, G.; Jiang, P.; Qiao, R.; Lam, W.K.J.; Yu, S.C.Y.; Ma, M.L.; Ji, L.; Cheng, S.H.; Gai, W.; et al. Epigenetic analysis of cell-free DNA by fragmentomic profiling. Proc. Natl. Acad. Sci. USA 2022, 119, e2209852119. [Google Scholar] [CrossRef] [PubMed]
- Mathios, D.; Johansen, J.S.; Cristiano, S.; Medina, J.E.; Phallen, J.; Larsen, K.R.; Bruhm, D.C.; Niknafs, N.; Ferreira, L.; Adleff, V.; et al. Detection and characterization of lung cancer using cell-free DNA fragmentomes. Nat. Commun. 2021, 12, 5060. [Google Scholar] [CrossRef] [PubMed]
- Serpas, L.; Chan, R.W.Y.; Jiang, P.; Ni, M.; Sun, K.; Rashidfarrokhi, A.; Soni, C.; Sisirak, V.; Lee, W.S.; Cheng, S.H.; et al. Dnase1l3 deletion causes aberrations in length and end-motif frequencies in plasma DNA. Proc. Natl. Acad. Sci. USA 2019, 116, 641–649. [Google Scholar] [CrossRef] [PubMed]
- Han, D.S.C.; Ni, M.; Chan, R.W.Y.; Chan, V.W.H.; Lui, K.O.; Chiu, R.W.K.; Lo, Y.M.D. The Biology of Cell-free DNA Fragmentation and the Roles of DNASE1, DNASE1L3, and DFFB. Am. J. Hum. Genet. 2020, 106, 202–214. [Google Scholar] [CrossRef]
- Lo, Y.M.D.; Han, D.S.C.; Jiang, P.; Chiu, R.W.K. Epigenetics, fragmentomics, and topology of cell-free DNA in liquid biopsies. Science 2021, 372, eaaw3616. [Google Scholar] [CrossRef] [PubMed]
- Marotta, V.; Cennamo, M.; La Civita, E.; Vitale, M.; Terracciano, D. Cell-Free DNA Analysis within the Challenges of Thyroid Cancer Management. Cancers 2022, 14, 5370. [Google Scholar] [CrossRef]
- Verma, S.; Moore, M.W.; Ringler, R.; Ghosal, A.; Horvath, K.; Naef, T.; Anvari, S.; Cotter, P.D.; Gunn, S. Analytical performance evaluation of a commercial next generation sequencing liquid biopsy platform using plasma ctDNA, reference standards, and synthetic serial dilution samples derived from normal plasma. BMC Cancer 2020, 20, 945. [Google Scholar] [CrossRef]
- Stensgaard, S.; Thomsen, A.; Helstrup, S.; Meldgaard, P.; Sorensen, B.S. Blood tumor mutational burden and dynamic changes in circulating tumor DNA predict response to pembrolizumab treatment in advanced non-small cell lung cancer. Transl. Lung Cancer Res. 2023, 12, 971–984. [Google Scholar] [CrossRef]
- Monaco, G.; Lee, B.; Xu, W.; Mustafah, S.; Hwang, Y.Y.; Carré, C.; Burdin, N.; Visan, L.; Ceccarelli, M.; Poidinger, M.; et al. RNA-Seq Signatures Normalized by mRNA Abundance Allow Absolute Deconvolution of Human Immune Cell Types. Cell Rep. 2019, 26, 1627–1640.e1627. [Google Scholar] [CrossRef]
- Taudt, A.; Nguyen, M.A.; Heinig, M.; Johannes, F.; Colomé-Tatché, M. chromstaR: Tracking combinatorial chromatin state dynamics in space and time. bioRxiv 2016, 038612. [Google Scholar] [CrossRef]
- Lawrence, M.; Huber, W.; Pagès, H.; Aboyoun, P.; Carlson, M.; Gentleman, R.; Morgan, M.T.; Carey, V.J. Software for computing and annotating genomic ranges. PLoS Comput. Biol. 2013, 9, e1003118. [Google Scholar] [CrossRef] [PubMed]
- Pagès, H.; Aboyoun, P.; Gentleman, R.; DebRoy, S. Biostrings: Efficient Manipulation of Biological Strings, R package version 2.68.1; Bioconductor: Boston, MA, USA, 2023. [Google Scholar]
- Morgan, M.; Pagès, H.; Obenchain, V.; Hayden, N. Rsamtools: Binary Alignment (BAM), FASTA, Variant Call (BCF), and Tabix File Import, R package version 2.16.0; Bioconductor: Boston, MA, USA, 2023. [Google Scholar]
- Wickham, H.; François, R.; Henry, L.; Müller, K.; Vaughan, D. dplyr: A Grammar of Data Manipulation, R package version 1.1.2; CRAN: Vienna, Austria, 2023. [Google Scholar]
- Kassambara, A. ggpubr: ‘ggplot2’ Based Publication Ready Plots, R package version 0.6.0; CRAN: Vienna, Austria, 2023. [Google Scholar]
- Wickham, H. ggplot2: Elegant Graphics for Data Analysis, R package version 3.4.2; CRAN: Vienna, Austria, 2023. [Google Scholar]
- Benjamini, Y.; Hochberg, Y. Controlling the False Discovery Rate: A Practical and Powerful Approach to Multiple Testing. J. R. Stat. Soc. Ser. B 1995, 57, 289–300. [Google Scholar] [CrossRef]


Disclaimer/Publisher’s Note: The statements, opinions and data contained in all publications are solely those of the individual author(s) and contributor(s) and not of MDPI and/or the editor(s). MDPI and/or the editor(s) disclaim responsibility for any injury to people or property resulting from any ideas, methods, instructions or products referred to in the content. |
© 2024 by the authors. Licensee MDPI, Basel, Switzerland. This article is an open access article distributed under the terms and conditions of the Creative Commons Attribution (CC BY) license (https://creativecommons.org/licenses/by/4.0/).
Share and Cite
Maansson, C.T.; Thomsen, L.S.; Meldgaard, P.; Nielsen, A.L.; Sorensen, B.S. Integration of Cell-Free DNA End Motifs and Fragment Lengths Can Identify Active Genes in Liquid Biopsies. Int. J. Mol. Sci. 2024, 25, 1243. https://doi.org/10.3390/ijms25021243
Maansson CT, Thomsen LS, Meldgaard P, Nielsen AL, Sorensen BS. Integration of Cell-Free DNA End Motifs and Fragment Lengths Can Identify Active Genes in Liquid Biopsies. International Journal of Molecular Sciences. 2024; 25(2):1243. https://doi.org/10.3390/ijms25021243
Chicago/Turabian StyleMaansson, Christoffer Trier, Louise Skov Thomsen, Peter Meldgaard, Anders Lade Nielsen, and Boe Sandahl Sorensen. 2024. "Integration of Cell-Free DNA End Motifs and Fragment Lengths Can Identify Active Genes in Liquid Biopsies" International Journal of Molecular Sciences 25, no. 2: 1243. https://doi.org/10.3390/ijms25021243
APA StyleMaansson, C. T., Thomsen, L. S., Meldgaard, P., Nielsen, A. L., & Sorensen, B. S. (2024). Integration of Cell-Free DNA End Motifs and Fragment Lengths Can Identify Active Genes in Liquid Biopsies. International Journal of Molecular Sciences, 25(2), 1243. https://doi.org/10.3390/ijms25021243