Article

Genome-Wide Analysis of R2R3-MYB Genes and Functional Characterization of SmMYB75 in Eggplant Fruit Implications for Crop Improvement and Nutritional Enhancement

School of Agriculture and Biology, Shanghai Jiao Tong University, Shanghai 200240, China
*
Authors to whom correspondence should be addressed.
Int. J. Mol. Sci. 2024, 25(2), 1163; https://doi.org/10.3390/ijms25021163
Submission received: 19 September 2023 / Revised: 13 December 2023 / Accepted: 28 December 2023 / Published: 18 January 2024
(This article belongs to the Section Molecular Plant Sciences)

Abstract

:
R2R3-MYB represents a substantial gene family that plays diverse roles in plant development. In this study, 102 SmR2R3-MYB genes were identified from eggplant fruit and classified into 31 subfamilies. Analysis indicated that segmental duplication events played a pivotal role in the expansion of the SmR2R3-MYB gene family. Furthermore, the prediction of miRNAs targeting SmR2R3-MYB genes revealed that 60 SmR2R3-MYBs are targeted by 57 miRNAs, with specific miRNAs displaying varying numbers of target genes, providing valuable insights into the regulatory functions of miRNAs in plant growth, development, and responses to stress conditions. Through expression profile analysis under various treatment conditions, including low temperature (4 °C), plant hormone (ABA, Abscisic acid), and drought stress (PEG, Polyethylene glycol), diverse and complex regulatory mechanisms governing SmR2R3-MYB gene expression were elucidated. Notably, EGP21875.1 and EGP21874.1 exhibited upregulation in expression under all treatment conditions. Transcriptome and metabolome analyses demonstrated that, apart from anthocyanins (delphinidin-3-O-glucoside, cyanidin-3-O-(6-O-p-coumaroyl)-glucoside, and malvidin-3-O-(6-O-p-coumaroyl)-glucoside), overexpression of SmMYB75 could also elevate the content of various beneficial compounds, such as flavonoids, phenolic acids, and terpenes, in eggplant pulp. This comprehensive study enhances our understanding of SmR2R3-MYB gene functions and provides a strong basis for further research on their roles in regulating anthocyanin synthesis and improving eggplant fruit quality.

1. Introduction

Transcription factors (TFs) play vital roles in the regulation of plant growth and development as well as metabolic processes by controlling the transcription levels of structural genes in various biological processes [1]. The MYB (V-myb avian myeloblastosis viral oncogene homolog) TFs represent one of the largest plant transcription factor families, containing highly conserved MYB DNA-binding domains widely distributed throughout eukaryotic organisms. The MYB gene family has been thoroughly identified and functionally studied in an increasing number of species over the past few decades [2,3,4]. The structural domains of the genes in the MYB family typically consist of one to four non-identical repeats called R repeats (R1, R2, R3, and R4), each approximately 50–55 amino acids in length [5]. The genes can be divided into four subfamilies based on the number of R repeats: 1R-MYB (MYB-related and R3-MYB), R2R3-MYB factors, 3R-MYB (R1R2R3-MYB), and 4R-MYB. The R2R3-MYB factors are the most abundant and most common in plants and regulate various aspects of plant growth and development [6], primary and secondary metabolism [7,8,9], biotic and abiotic stress responses [10,11,12,13], and cell morphology development [14].
The R2R3-MYB TFs play key roles in the regulation of flavonoid biosynthesis in various species. Anthocyanins, secondary metabolites of flavonoids, are the primary pigments responsible for the red, purple, and blue hues in plants, aid in biotic and abiotic stress resistance, and have also been used in cancer therapy [15]. The anthocyanin synthesis pathway is a branch of the flavonoid synthesis pathway and involves a variety of key gene-encoding enzymes. It involves the early biosynthetic genes (EBG; such as CHS, CHI, and F3H), late biosynthetic genes (LBG; such as DFR, ANS, and BZ1, which encode the UDP glucose-like flavonoid glycosyltransferase (UFGT)), and other components [16,17,18]. The R2R3-MYB proteins often form MYB-bHLH-WD40 complexes with bHLH and WD40 proteins to regulate anthocyanin biosynthesis. However, the R2R3-MYB proteins can also act independently as activators to control structural gene expression involved in anthocyanin biosynthesis [19,20].
The first plant-specific R2R3-MYB gene ZmMYBC1 identified in maize (Zea mays) encodes a regulatory protein involved in anthocyanin biosynthesis [21,22]. Furthermore, the R2R3-MYB-mediated anthocyanin synthesis pathway was discovered in the model Arabidopsis, where AtPAP1/AtMYB75 and AtPAP2/AtMYB90 were shown to be involved in the transcriptional regulation of anthocyanins in plant tissues [23,24]. In tomatoes, the overexpression of SlANT1, SlANT2/SlMYB75, and SlANT2-like R2R3-MYB genes increases fruit anthocyanin content [25]. Both MdMYB9 and MdMYB11 in apples bind to the promoters of the structural anthocyanin synthesis genes ANS, ANR, and LAR, activating their expression and resulting in increased anthocyanin accumulation [26].
Eggplant pericarp is rich in anthocyanins, which is a significant factor in the quality of eggplant fruits [27]. However, since only the eggplant peel is enriched in anthocyanins but not in the flesh, the overall nutritional value of eggplant is less valued. A previous study demonstrated that SlMYB75 overexpression was effective in improving various fruit quality characteristics, including a significant increase in total phenolics, flavonoids, soluble solids, and anthocyanins in SlMYB75-OE fruits. Flavonoids are a group of polyphenolic hydroxyl compounds widely distributed in the plant kingdom, most of which are yellow in color and have various biological functions such as anti-free radicals, antioxidants, immune enhancement, and anti-aging [28]. Therefore, fruit quality could be improved to some extent if significant positive regulators can be identified in eggplant fruit. Previous reports have shown that anthocyanin synthesis in eggplant pericarp is light-dependent with structural genes (such as SmCHS, SmCHI, SmF3H, SmDFR, and SmANS) cloned and their functions elucidated [29,30]. In recent years, several R2R3-MYB genes involved in anthocyanin biosynthesis have been identified in eggplant fruit. SmMYB was first cloned from the purple petals of eggplant fruit and the expression trend in the pericarp was shown to be positively correlated with changes in anthocyanin content [31]. Furthermore, SmMYB1 [32], SmMYB75 [33], and SmMYB35 [34] were shown to promote anthocyanin synthesis and SmMYB86 was shown to be a negative regulator of anthocyanin biosynthesis [35]. In recent years, with the development of genome sequencing, many genomes have been published and genome-wide identification of large gene families (i.e., R2R3-MYB) have been completed, including those in Arabidopsis [36], tomato [37], pepper [38], potato [39], and tobacco [40] plants, among others. However, the current reports on the R2R3-MYB gene family in eggplant fruit are relatively sparse with only a few genes being functionally verified.
In this study, a comprehensive study of the R2R3-MYB gene family in eggplant fruit was conducted using genomic sequence data reported by Guangxi University [41]. The analysis included gene structure, chromosomal location, phylogenetic relationships, pattern composition, duplication events, and predicted cis-acting elements. In addition, the differential expression levels of SmR2R3-MYBs in response to abiotic stresses were analyzed. Overexpression of the SmMYB75 gene produced eggplants with purple flesh and further revealed its regulatory role in eggplant fruit quality via transcriptomics and metabolomics. Completely purple eggplants can be commercially favored and are somehow considered better quality eggplants. These findings provide a putative strategy for anthocyanin-rich eggplant cultivar breeding.

2. Results

2.1. Identification and Physicochemical Property Analysis of the SmR2R3-MYB Genes

A BLAST query of Arabidopsis AtR2R3-MYBs was performed against the eggplant genome to identify the putative SmR2R3-MYBs in eggplant. A total of 102 candidate genes were identified using the SMART (http://smart.embl-heidelberg.de/, accessed on 18 September 2023) and Pfam databases (https://www.uniprot.org/database/DB-0073, accessed on 18 September 2023) to detect specific SmR2R3-MYB structural domains. These putative SmR2R3-MYB genes were classified based on the phylogenetic grouping of the Arabidopsis R2R3-MYB family. The ORF length of these genes ranged from 462 (EGP15965.1) to 3051 bp (EGP09531.1). The average size of the SmR2R3-MYB proteins was 324.6 aa, ranging from 153 to 1016 aa. The MW of the SmR2R3-MYB proteins ranged from 17.39 (EGP15965.1) to 114.3 kDa (EGP09531.1). The theoretical pI values ranged from 5 (EGP19222.1) to 9.95 (EGP20989.1). The predicted GRAVY scores for SmR2R3-MYB proteins ranged from −1.055 (EGP10787.1 and EGP17408.1) to −0.307 (EGP24348.1), suggesting that all SmR2R3-MYB proteins were hydrophilic. The amino acid sequences of all genes are presented in Table S1.

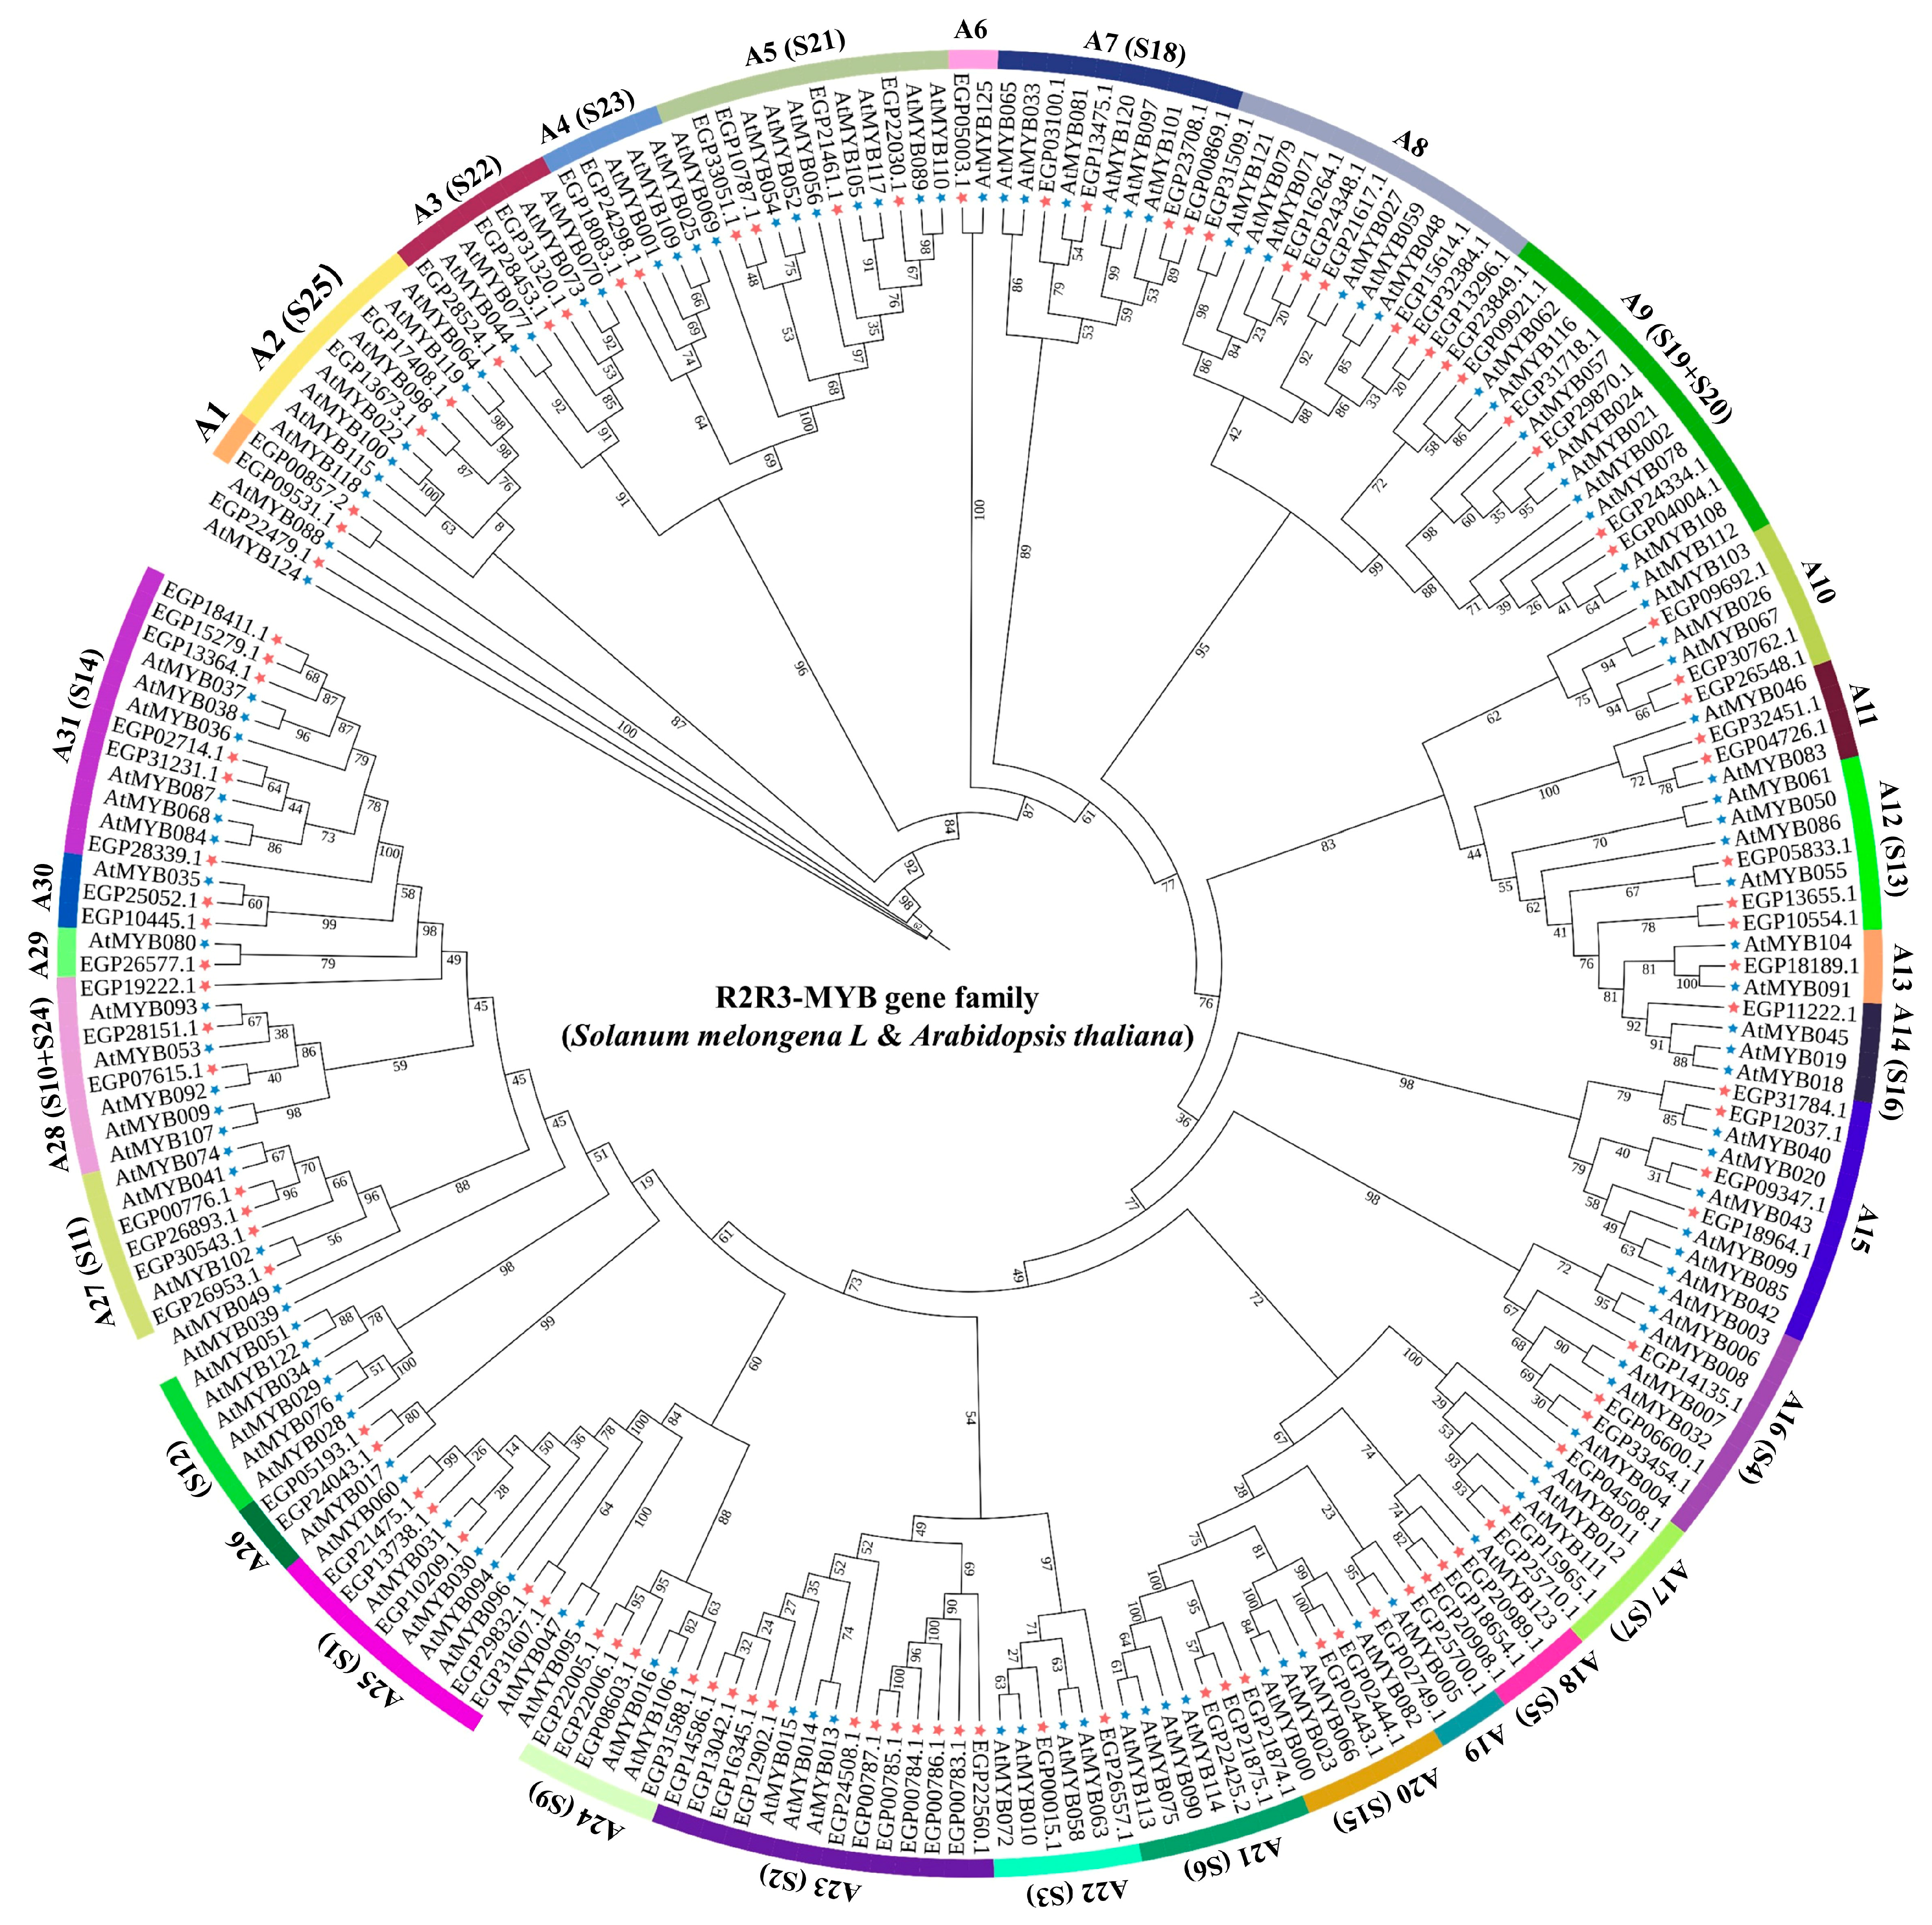
2.2. Phylogenetic Analysis and Classification of the SmR2R3-MYB Gene Family

All SmR2R3-MYB and 126 AtR2R3-MYB proteins were used to construct a phylogenetic tree in order to analyze the phylogenetic relationships and investigate the characteristics of the R2R3-MYBs. TBtools version 2.003 was used to construct the ML phylogenetic tree for the 228 genes, using the Arabidopsis R2R3-MYB proteins as a reference. Based on this tree, the SmR2R3-MYB genes were classified into 31 subgroups (designated A1 to A31), consistent with the previously reported classification of R2R3-MYBs in Arabidopsis [36] as indicated in the evolutionary tree (Figure 1). All eggplant R2R3-MYB genes were classified into different subgroups, except for EPG22479.1, which was not categorized into any of the groups. Notably, 30 subgroups included different numbers of R2R3-MYB proteins from both species, whereas one subgroup (A1) contained only eggplant members. Most of the eggplant genes belonged to the MYB subfamily of Arabidopsis but none were sorted into the Arabidopsis S12 subgroup.

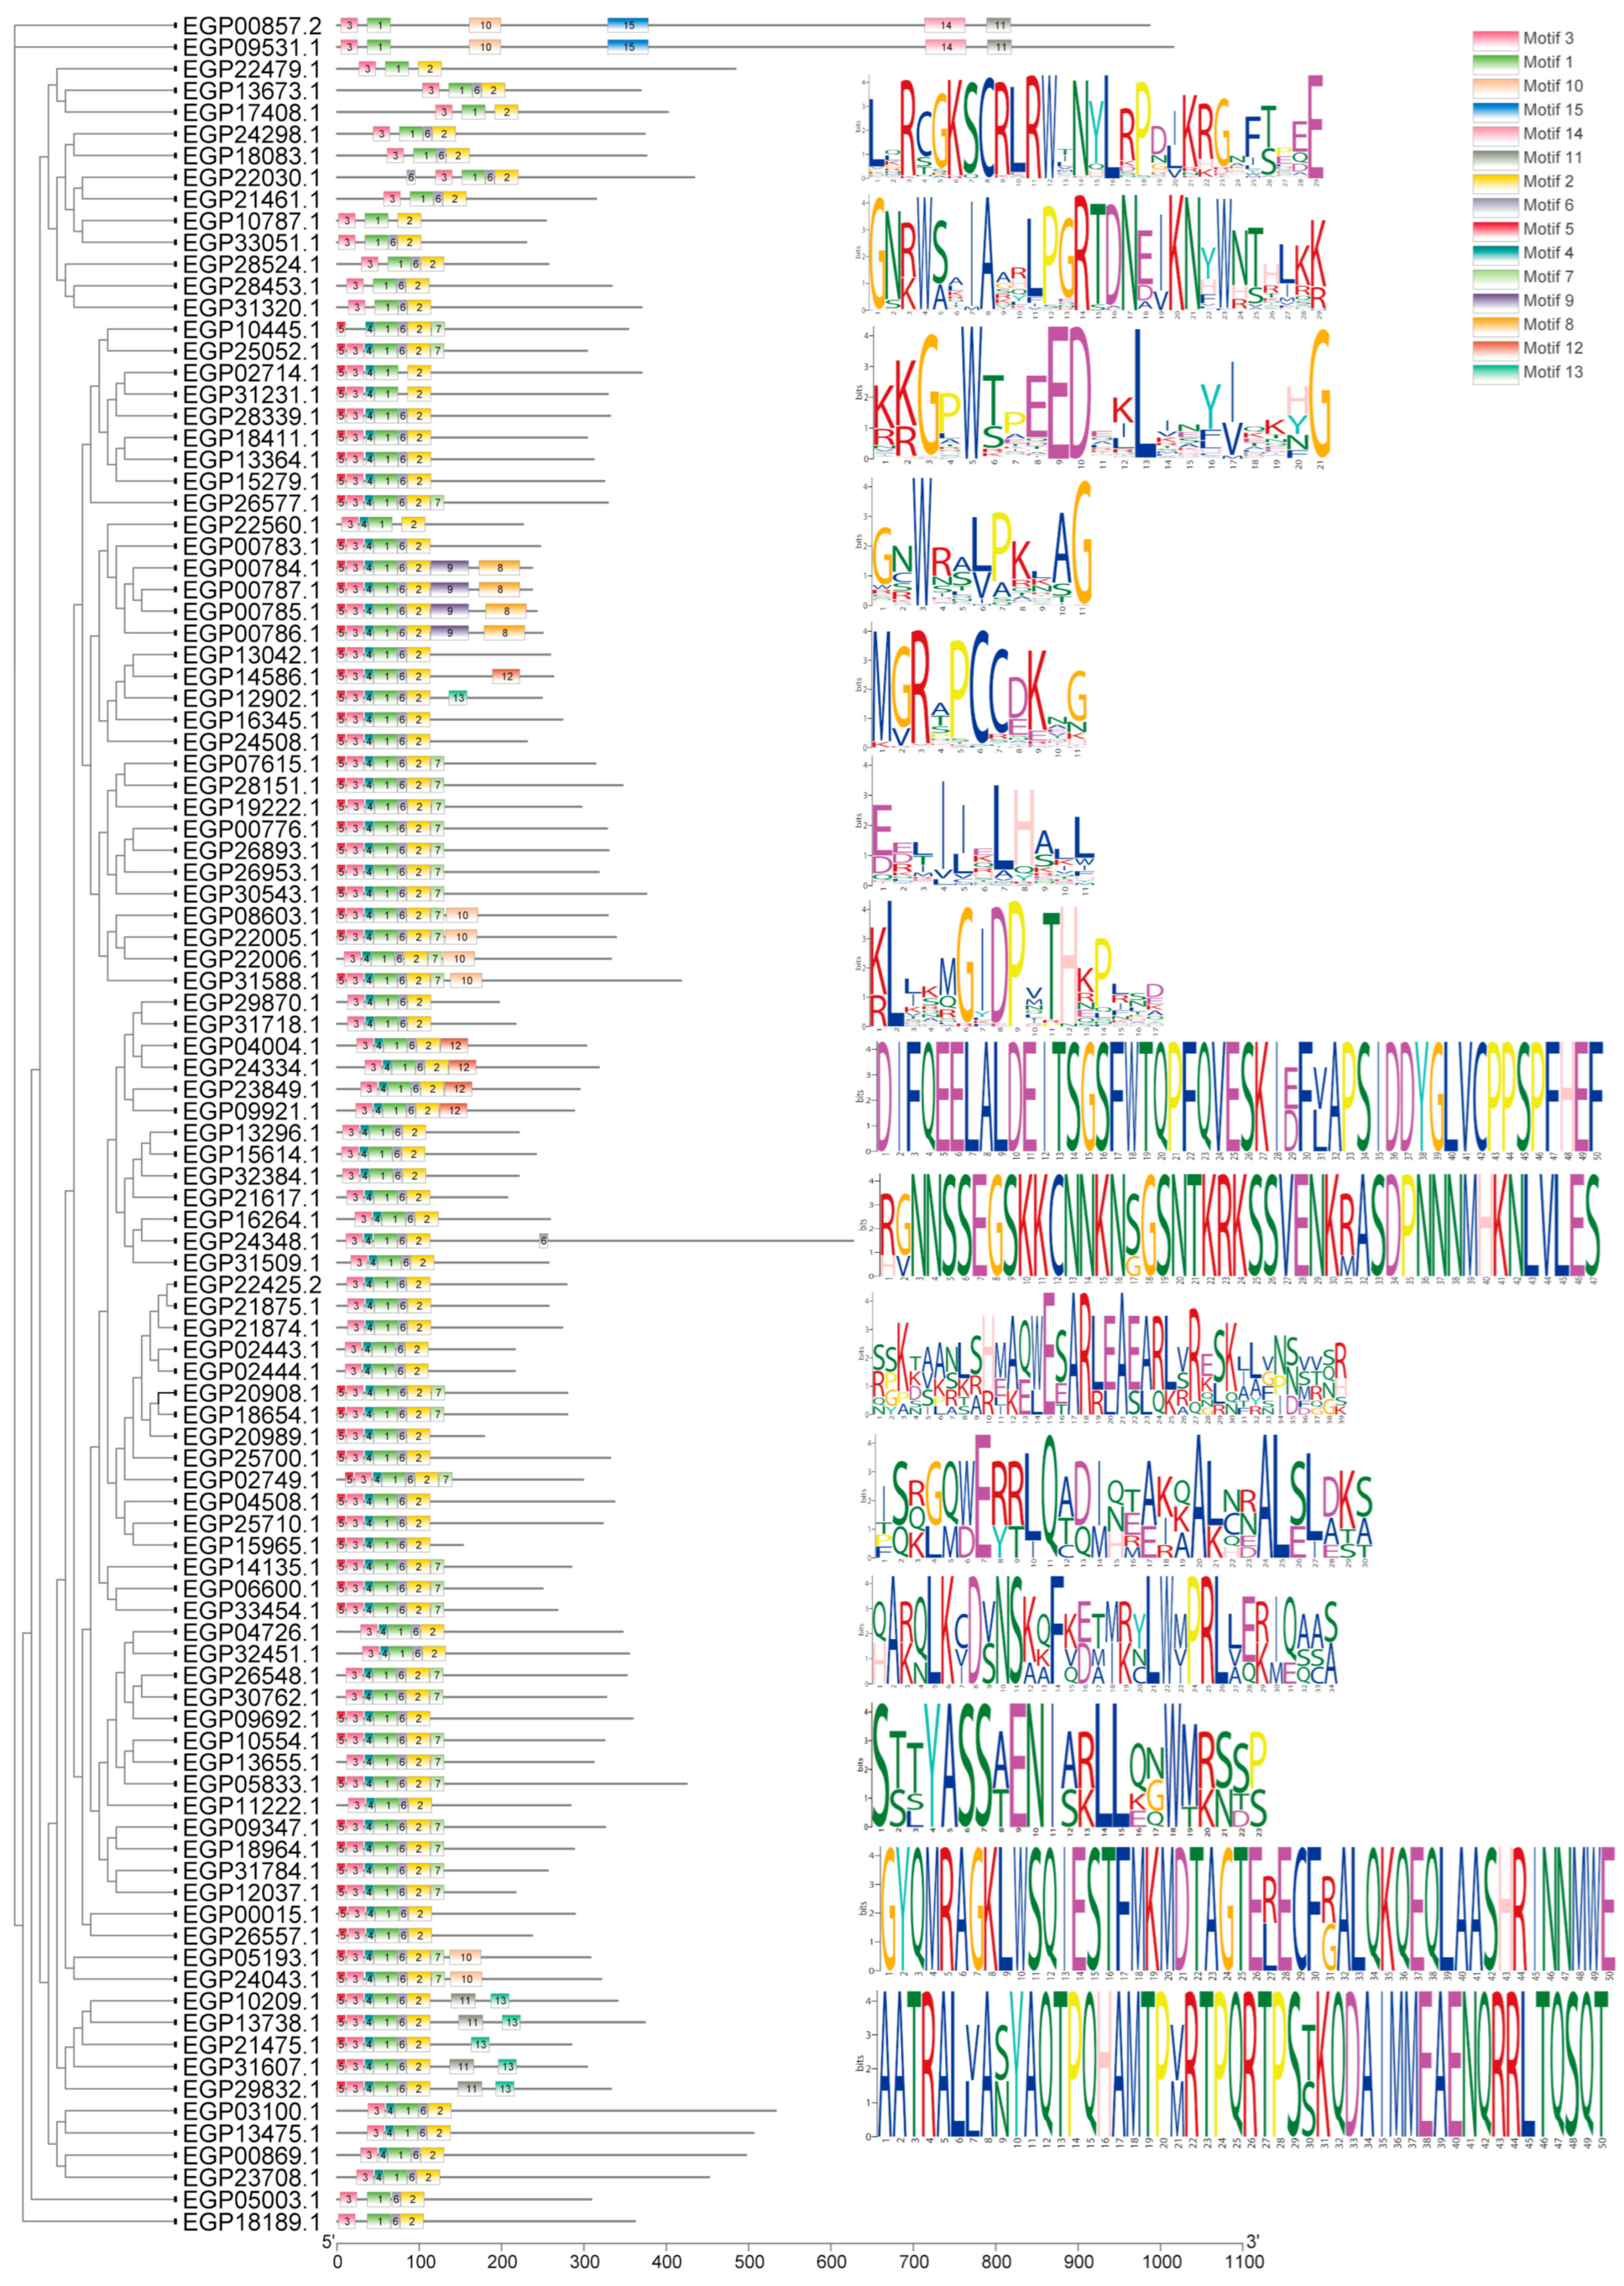
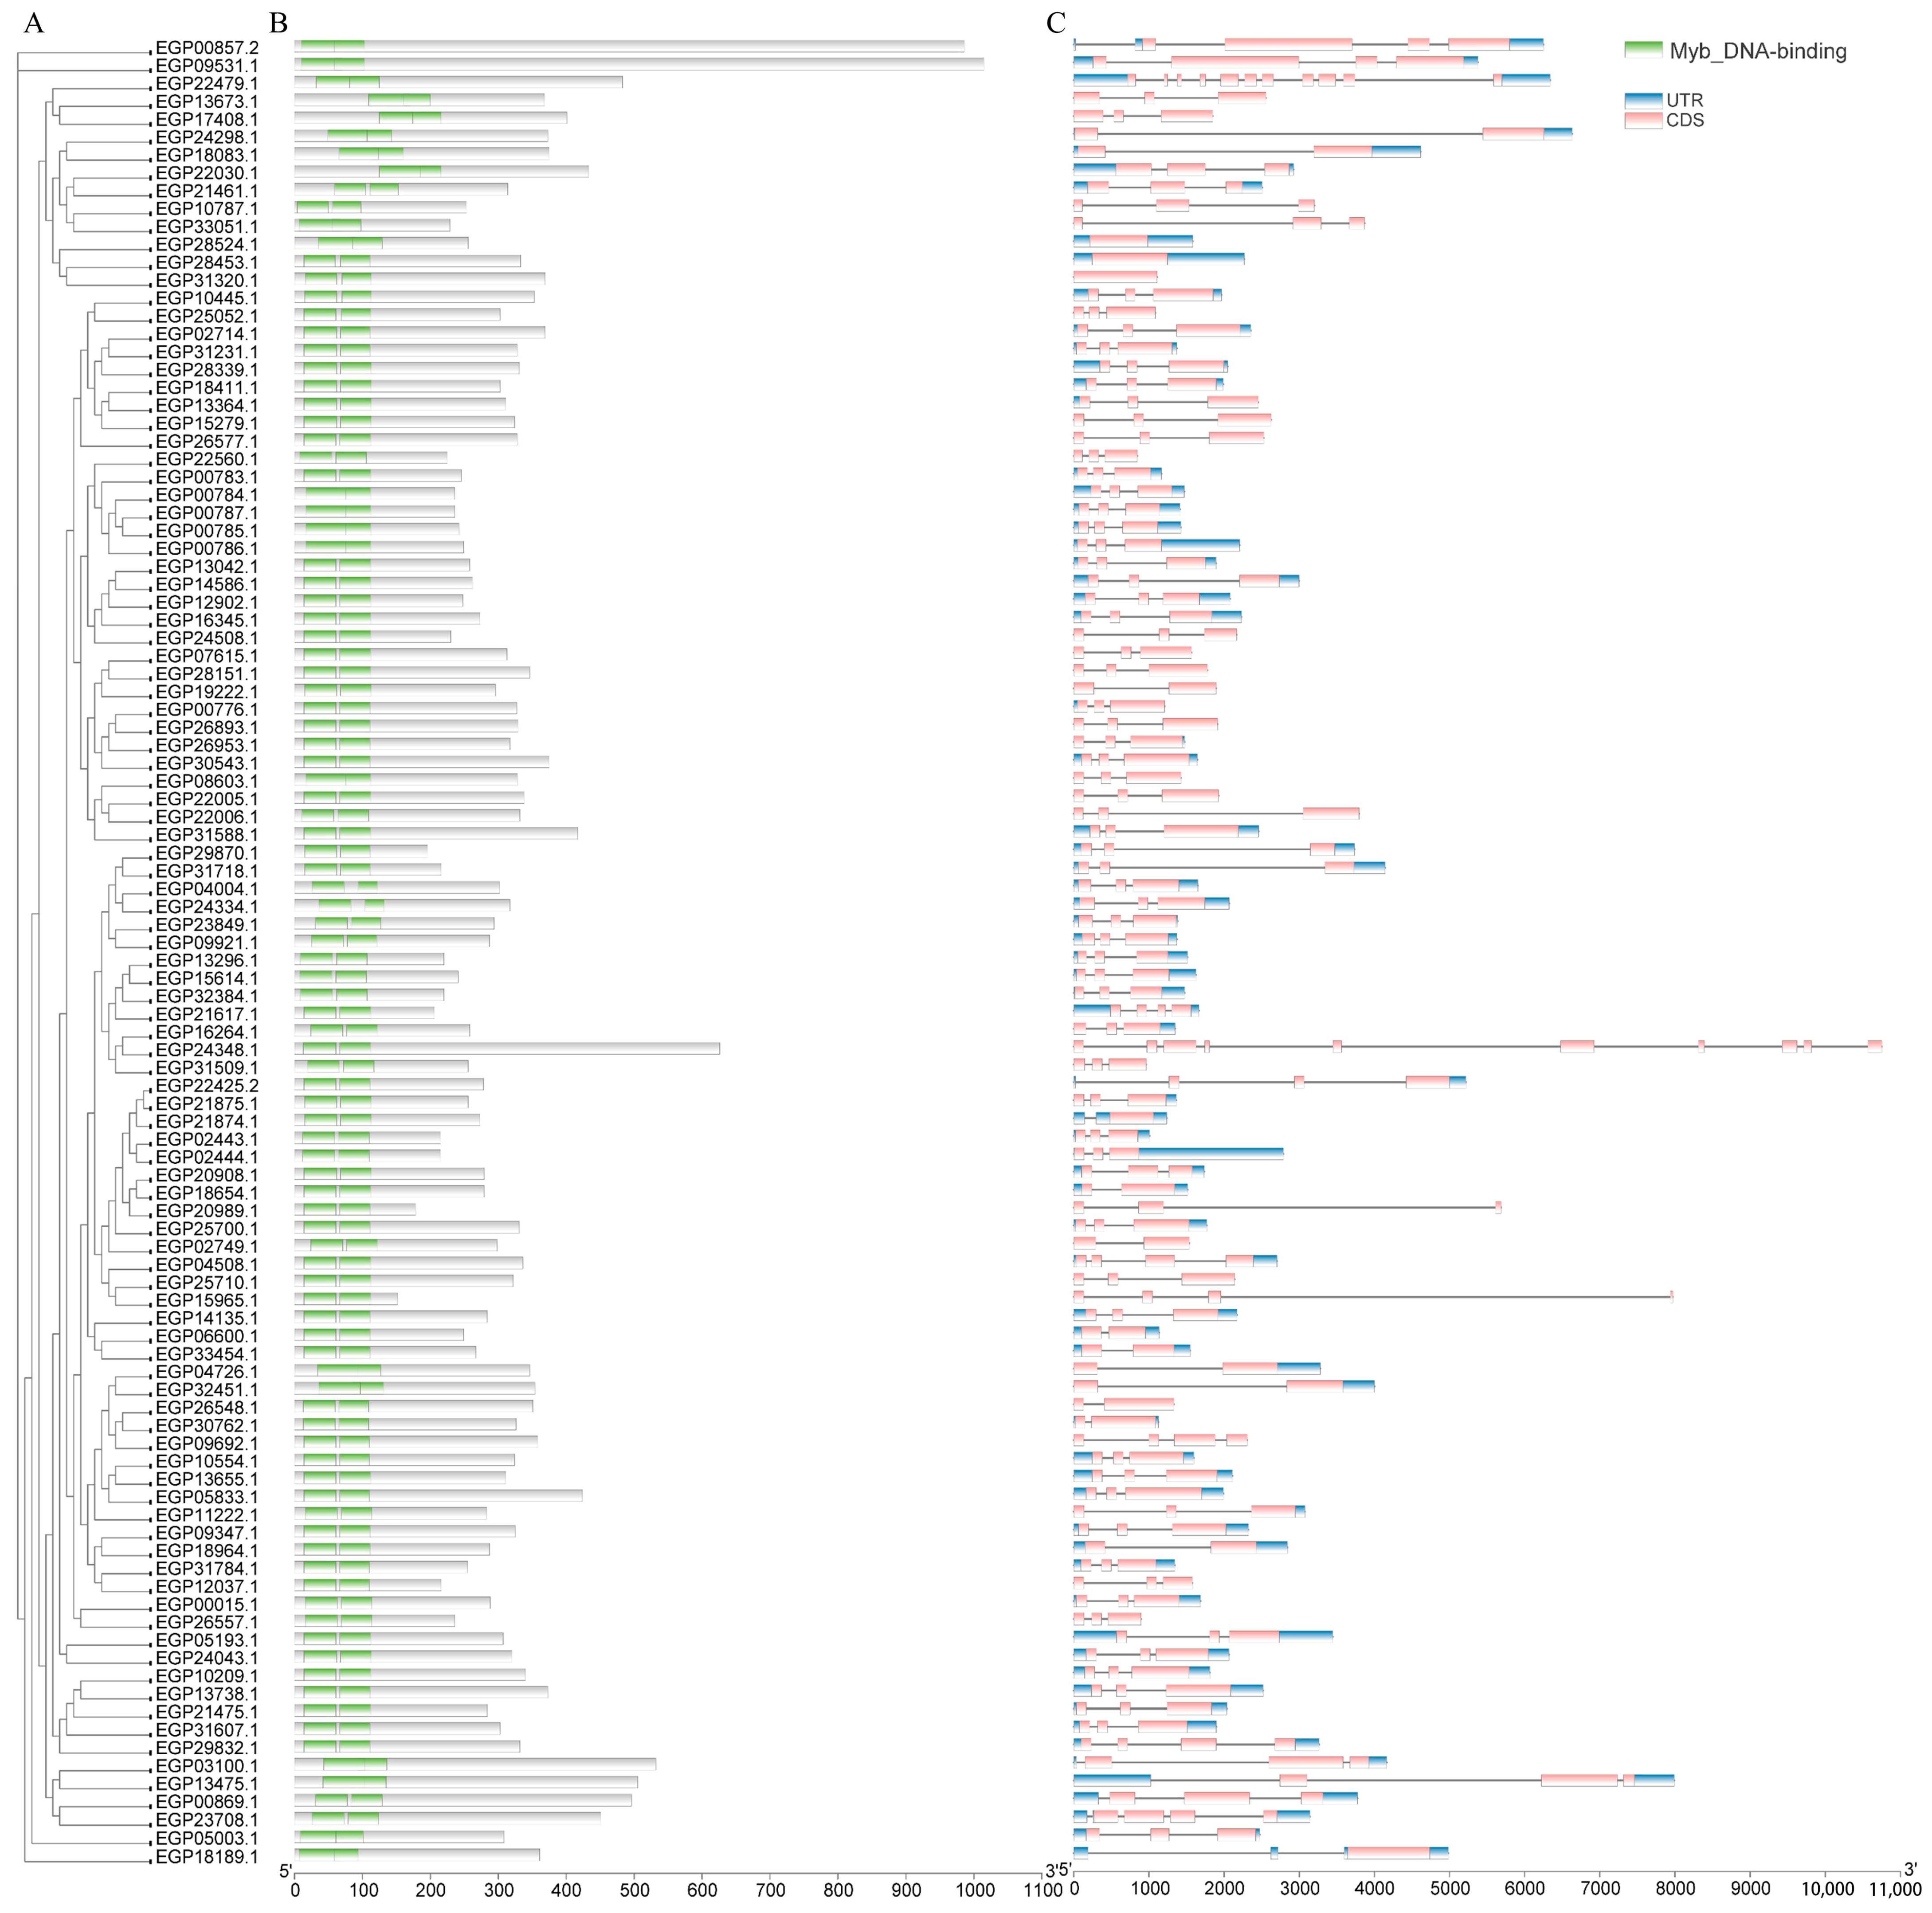
2.3. Motif, Conserved Domain, and Structure Analyses of SmR2R3-MYBs

We used the online MEME program to predict 15 conserved motifs from 102 SmR2R3-MYBs and then visualized the length and conserved sequences of each motif using TBtools software (Figure 2). We found that the composition and distribution of motifs among members within the same subfamily are relatively conserved. Motif 1 and motif 3 are located at the N-terminus of all SmR2R3-MYB protein sequences. The similarity in motif types and numbers within the same subfamily suggests that motif patterns may be related to the function of MYB proteins. Different subfamilies typically have specific motifs; for example, motif 14 and motif 15 are unique to the A1 subfamily, while motif 8 and motif 9 are only present in the A23 subfamily.
To further explore the conserved structural domains of SmR2R3-MYB proteins, multiple comparisons of the 102 SmR2R3-MYB protein sequences were conducted using DNAMAN version 6.0.3 The results showed that all SmR2R3-MYB members exhibit the typical features of the MYB-conserved domain (Figure 3B). Structural analysis of the 102 SmR2R3-MYB genes revealed that the vast majority of genes (98%, i.e., 100 genes) contain 1~4 coding regions, with 88 SmR2R3-MYB genes having 2~3 coding regions. EGP22479.1 has the highest number of coding regions (11), while three SmR2R3-MYB genes lack introns and have only one exon; these genes belong to the A3 subfamily. Most sequence lengths are within 10 kb, with only EGP24348.1 exceeding 10 kb due to its longer introns (Figure 3C). These findings suggest a high structural similarity within the same subfamily of SmR2R3-MYB genes. The conserved features identified through structural analysis may play crucial roles in the specific functions of SmR2R3-MYB genes in different subgroups. Although there are differences in the lengths of coding regions and introns, their distribution and quantity indicate a high degree of structural similarity within the same subfamily. Therefore, these conserved features may play key roles in the specific functions of SmR2R3-MYB genes in different subgroups.

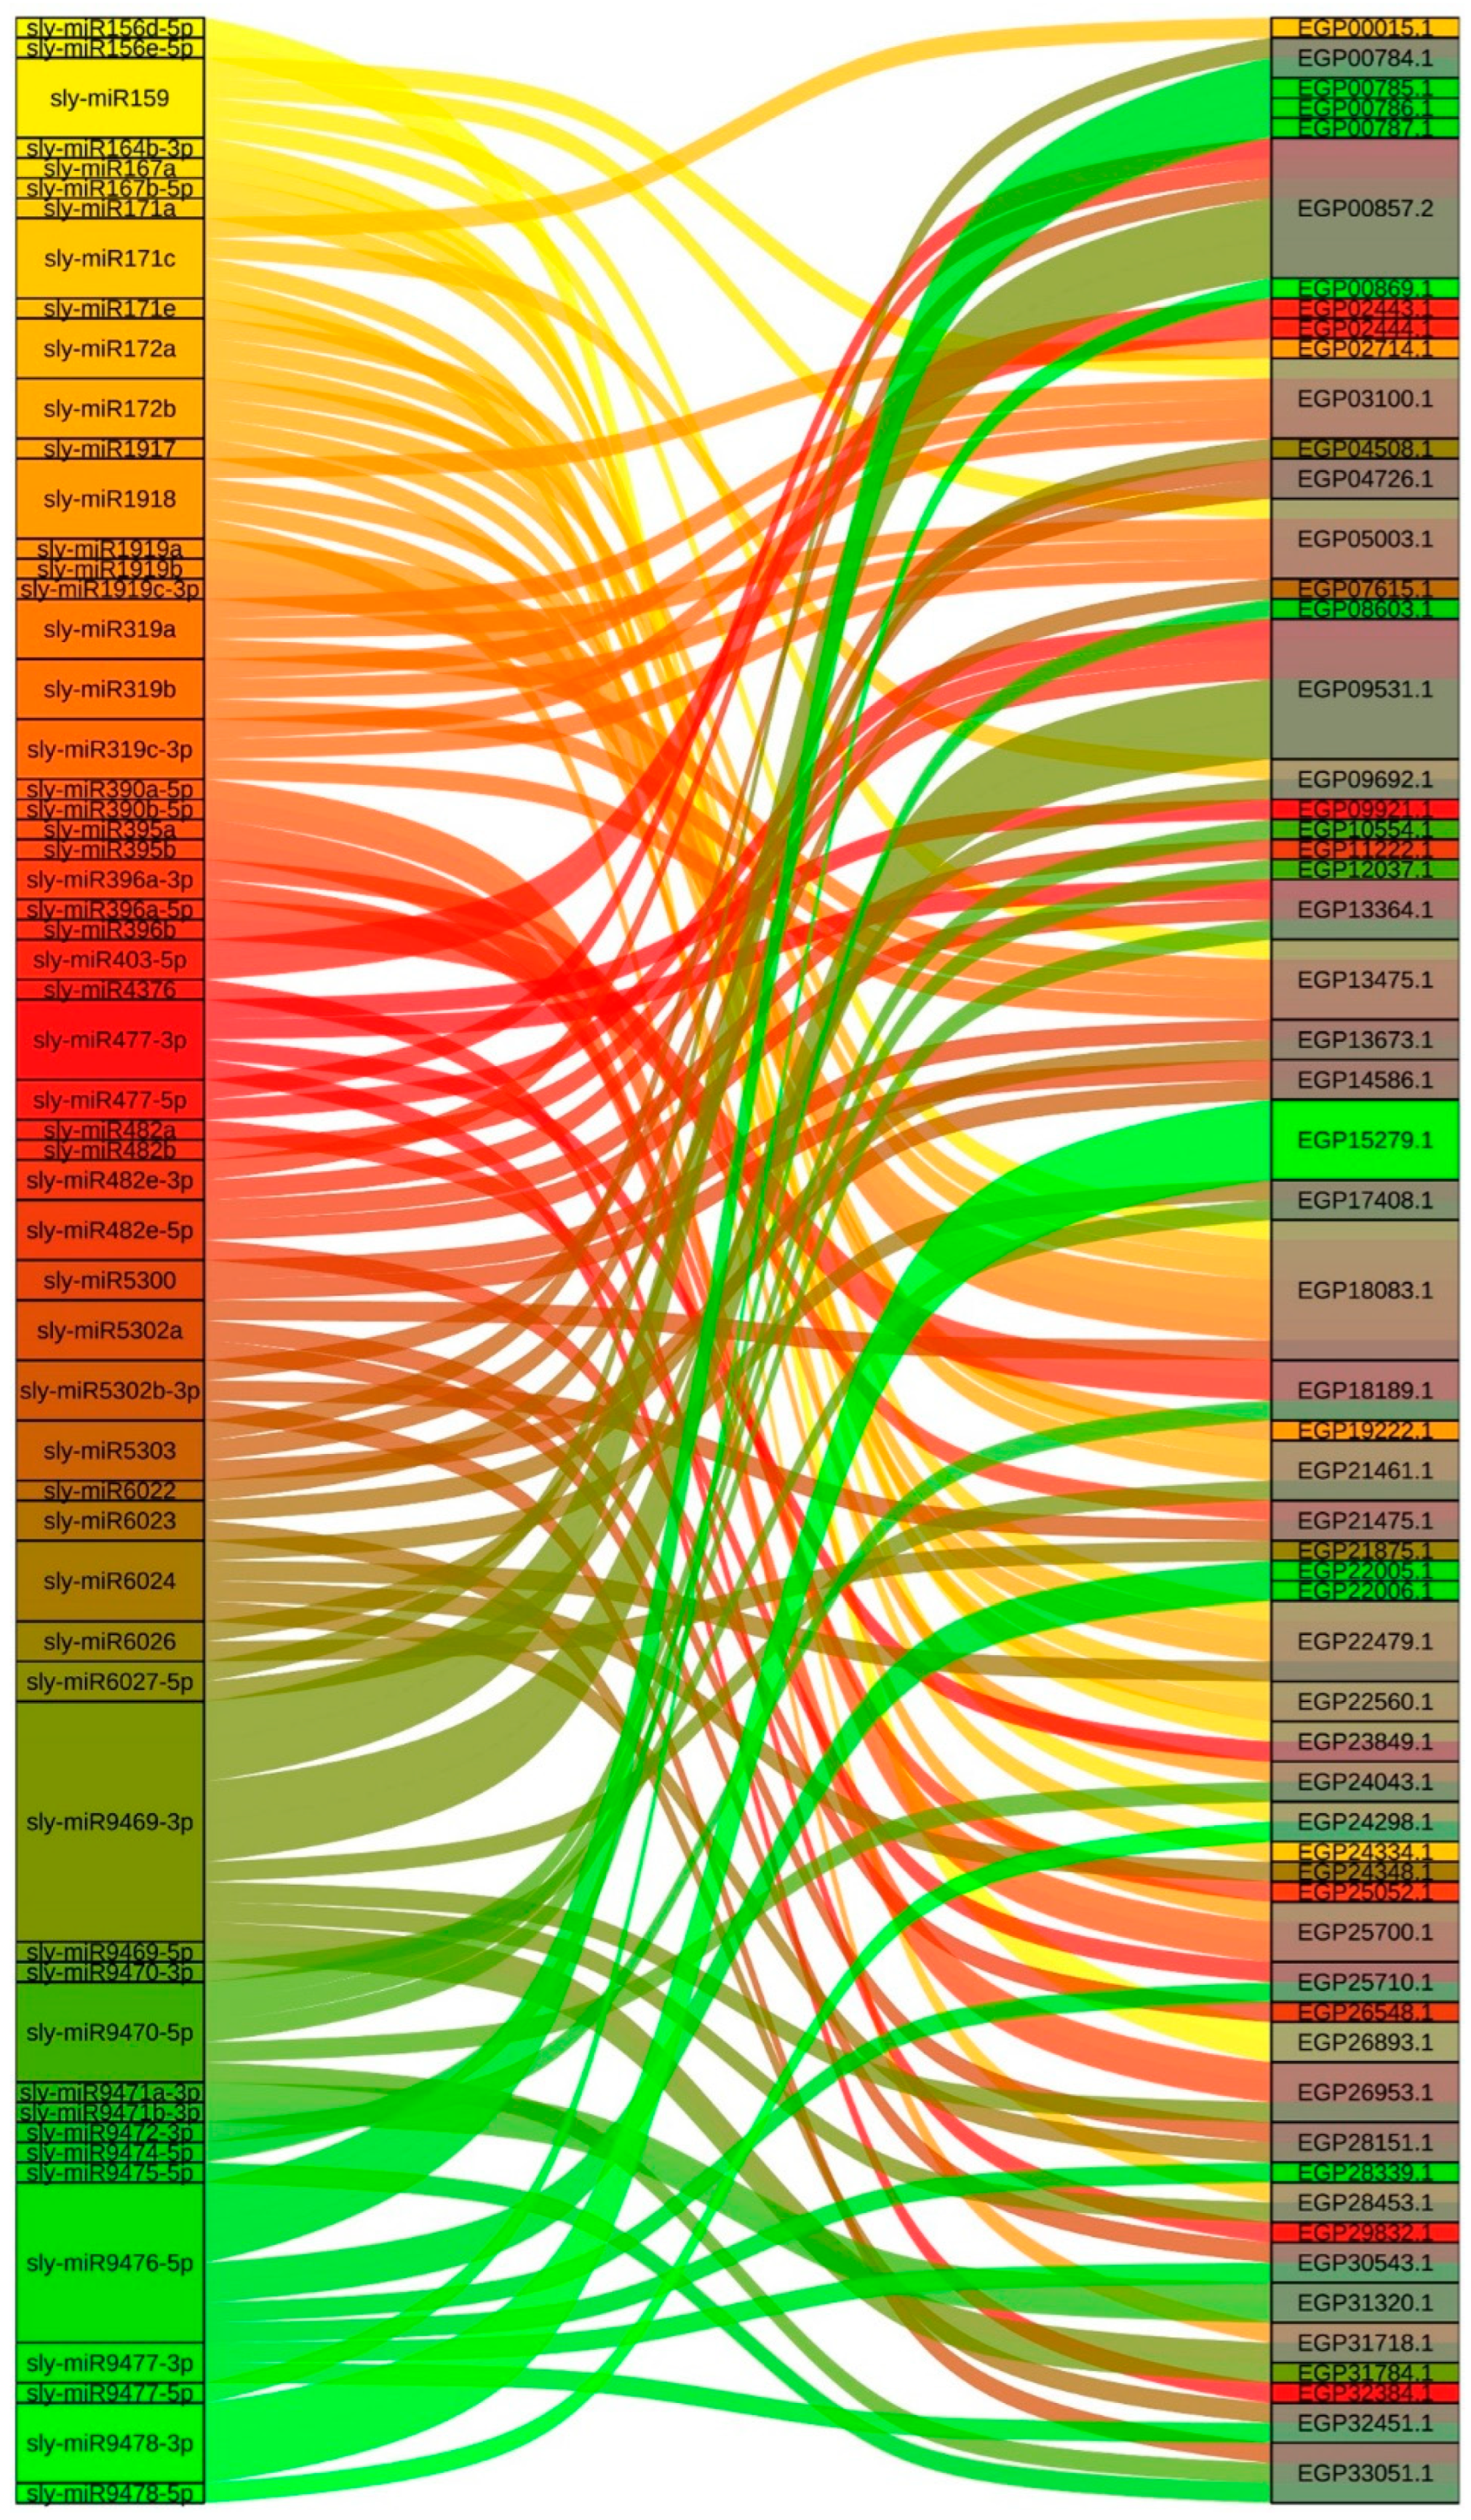
2.4. miRNAs That Target Regulate SmR2R3-MYB Genes

The prediction of miRNAs targeting SmR2R3-MYB genes contributes to the exploration of the relationship between plant growth, development, stress responses, and miRNA regulation. The results show that a total of 60 SmR2R3-MYBs are targeted by 57 miRNAs. Specifically, three SmR2R3-MYBs (EGP15279.1, EGP09531.1, and EGP00857.2) have dual-target sites for specific miRNAs. The miRNA with the highest number of target bindings to SmR2R3-MYB genes is sly-miR9476-5p, which has eight target genes, followed by sly-miR9469-3p with six target genes, and sly-miR9470-5p with five target genes. Most other miRNAs target between one and four genes. All other SmR2R3-MYB genes have between one and four target sites (Figure 4). These target sites may play crucial roles in the regulation of plant growth, development, and stress responses. The potential miRNA interaction networks of eggplant R2R3-MYB genes provide important references for studying their functions and help identify candidate genes for future research.

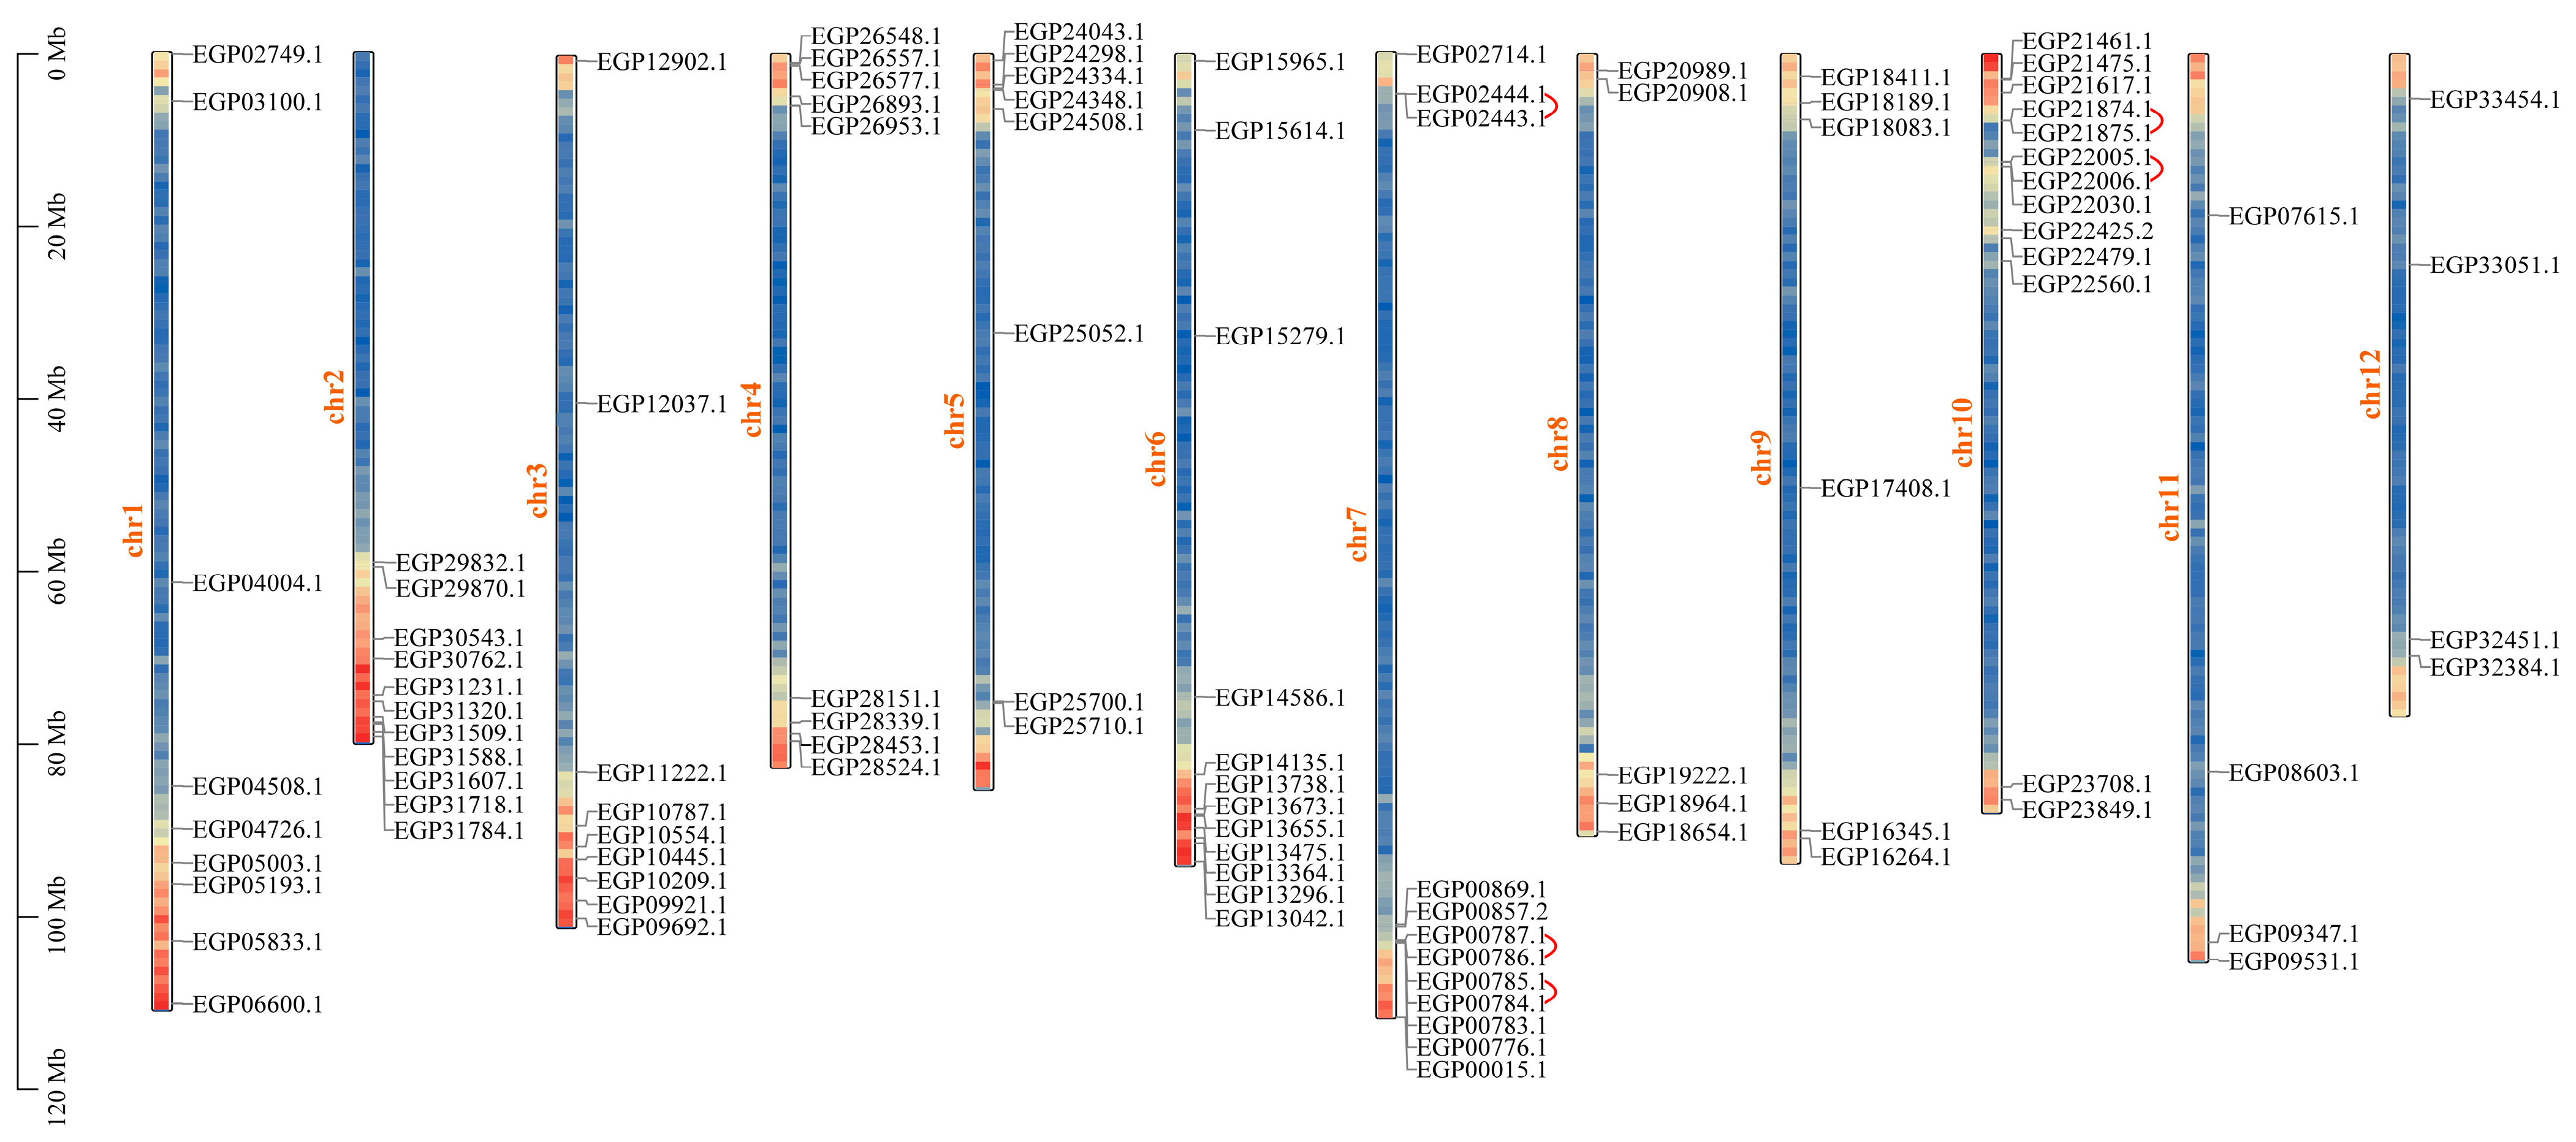
2.5. Chromosomal Distribution and Repeat Events of R2R3-MYB Genes in Eggplant Fruit

The chromosomal data were analyzed using the GFF annotation files to further investigate the chromosomal distribution of the R2R3-MYB genes in eggplant fruit. The analysis demonstrated that the 102 identified SmR2R3-MYB genes were unevenly distributed on the 12 chromosomes in eggplant fruit, with all chromosomes containing at least four SmR2R3-MYB genes (Figure 5). Chromosome 10 (Chr10) contained the largest number of genes (13), while Chr11 and Chr12 had the fewest (4). The remaining chromosomes contained 5 to 12 SmR2R3-MYB genes. Gene concatenation and fragment duplication generate gene families during biological evolution [42]. To investigate whether the SmR2R3-MYB gene family also underwent replication-based expansion, SmR2R3-MYB gene duplication events were investigated. The analysis identified five pairs (9.8%) of tandemly duplicated genes within the SmR2R3-MYB genes, distributed on Chr7 and 10 (Figure 5). Furthermore, 26 segmental (25.5%) duplicated pairs were identified among the SmR2R3-MYB genes (Figure S1). The largest number of segmental duplications was identified on Chr2 and 6, followed by Chr4. Chr8 contained the lowest number of segmental duplications. The Ka/Ks ratio was calculated for the five pairs of tandemly duplicated and 26 pairs of segmentally duplicated genes (Table S2). The results demonstrated that the Ka/Ks ratio for all gene pairs was less than 1, suggesting that most SmR2R3-MYB genes have undergone a negative selection pressure. These findings suggest that some SmR2R3-MYB genes may be the result of gene duplication with these duplication events as the most important driving factor in SmR2R3-MYB gene evolution.

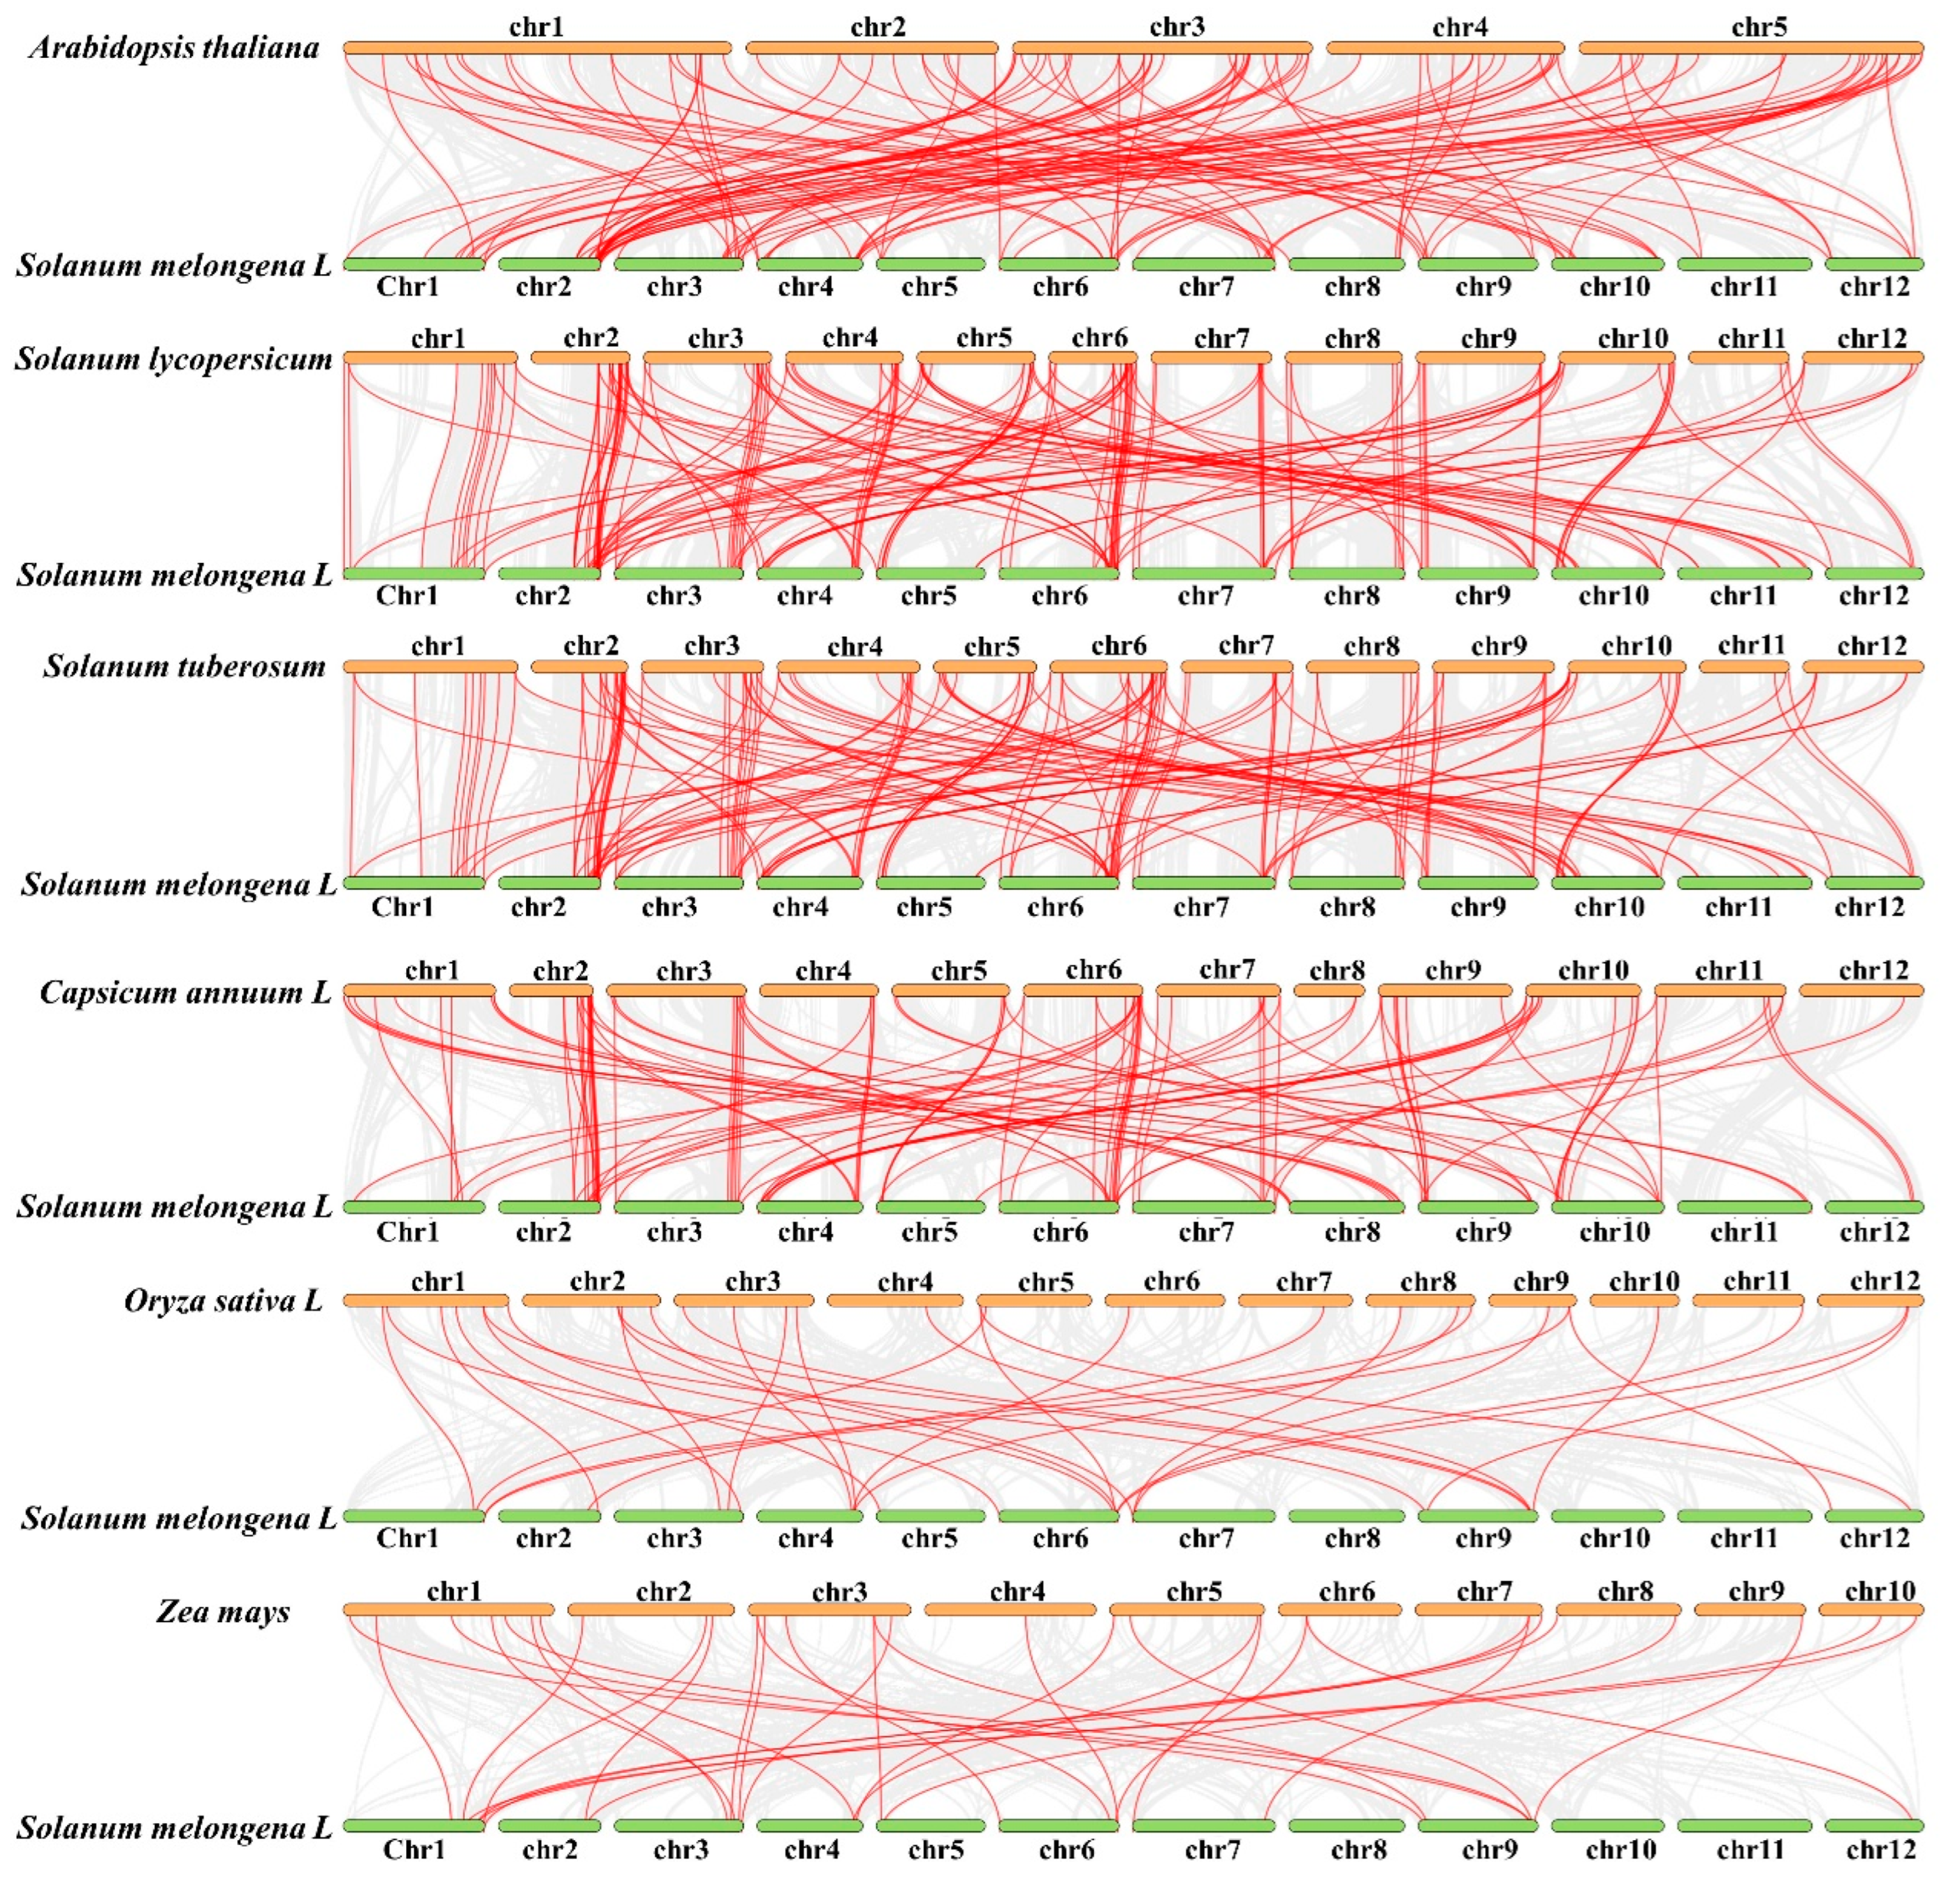
2.6. Comparative Synteny Analysis of R2R3-MYB Genes between Eggplants and Other Species

To investigate the potential evolutionary processes of SmR2R3-MYB genes, we conducted gene synteny analysis across multiple species to determine the evolutionary relationships between eggplant R2R3-MYB family members and other plant species. This analysis included dicotyledonous plants such as Arabidopsis, tomato, potato, and pepper, as well as monocotyledonous plants like rice and maize. The results revealed several syntenic relationships between the 102 SmR2R3-MYB genes and these different plant species. Specifically, there were 64 syntenic gene pairs with Arabidopsis, 89 with tomato, 86 with potato, 71 with pepper, 24 with maize, and 20 with rice (Figure 6). It is worth noting that 51 syntenic gene pairs were found between eggplants and Arabidopsis, tomato, and pepper, while none were found between eggplants and rice or maize (Table S3). These results suggest that the functions of R2R3-MYB members in eggplant fruit can be inferred from their homologous counterparts in Arabidopsis and other Solanaceae crops

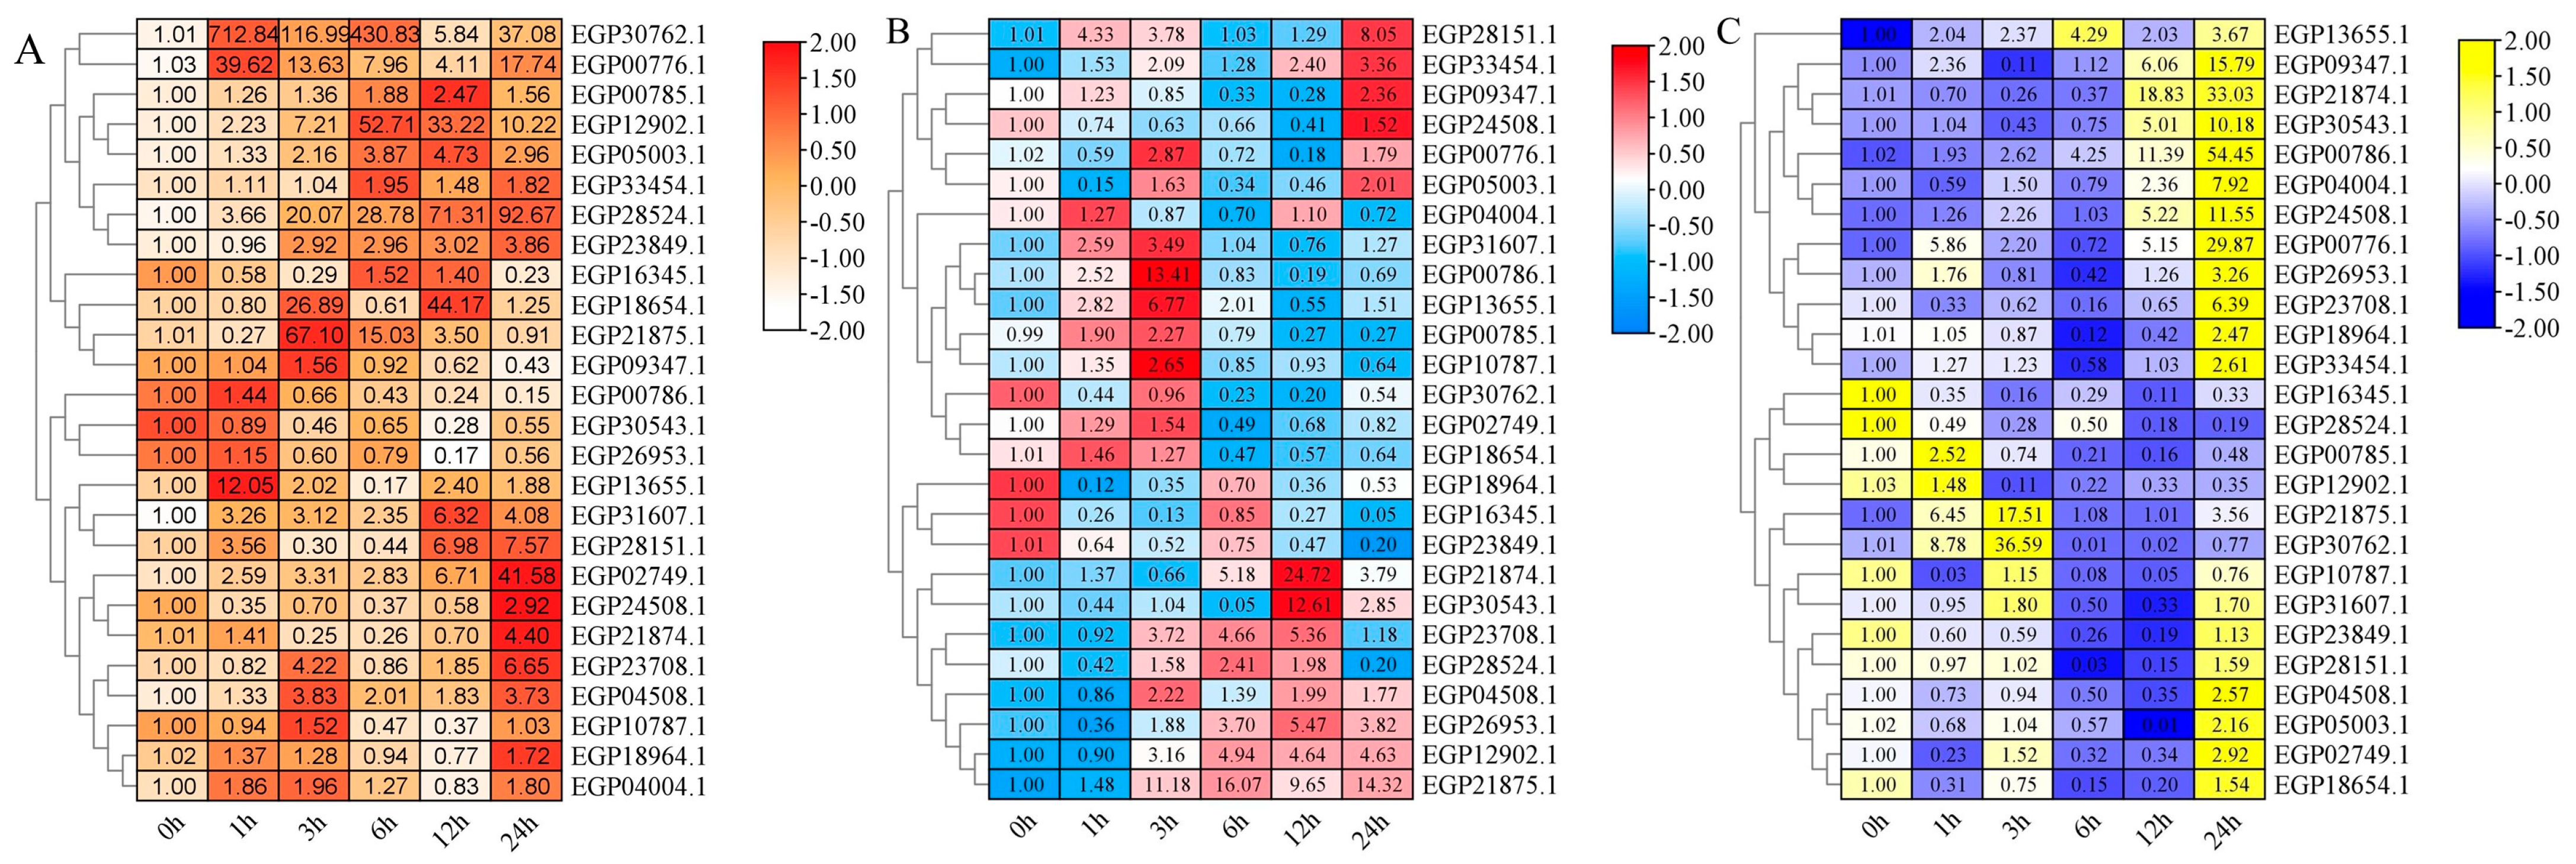
2.7. Expression Pattern of SmR2R3-MYBs under Diverse Treatments

To investigate the functions of SmR2R3-MYB genes in response to environmental stress and hormone treatments, we randomly selected 26 genes and analyzed their expression levels under 4 °C, PEG, and ABA treatments using qRT-PCR. A total of 24 SmR2R3-MYB genes exhibited responses to at least one of the treatments, while two (EGP04508.1 and EGP33454.1) did not show any response under all treatment conditions (|log2FC| ≥ 2) (Figure 7). Under the treatment of 4° C, a total of 13 genes (EGP00776.1, EGP02749.1, EGP05003.1, EGP12902.1, EGP13655.1, EGP18654.1, EGP21875.1, EGP23708.1, EGP28151.1, EGP28524.1, EGP21874.1, EGP30762.1, and EGP31607.1) were upregulated in their transcription levels and 3 genes (EGP26953.1, EGP00786.1 and EGP16345.1) showed a downregulation. The expression levels of the other 11 genes did not change significantly.
Among the 16 genes induced by ABA treatment, seven were upregulated (EGP26953.1, EGP12902.1, EGP28151.1, EGP23708.1, EGP13655.1, EGP21875.1, and EGP21874.1) and seven genes were downregulated (EGP16345.1, EGP05003.1, EGP28524.1, EGP00776.1, EGP30762.1, EGP18964.1, and EGP23849.1). Most of the upregulated genes were activated three hours following treatment, except for EGP28151.1, which was activated within one hour of treatment. EGP05003.1 and EGP18964.1, however, were significantly downregulated one hour post-treatment, while others were downregulated after three hours. Under PEG treatment, 24 genes were activated, of which 8 genes (EGP30543.1, EGP24508.1, EGP21875.1, EGP21874.1, EGP13655.1, EGP04004.1, EGP00786.1, and EGP00776.1) were significantly up-regulated and 11 genes (EGP28524.1, EGP28151.1, EGP23849.1, EGP18964.1, EGP18654.1, EGP16345.1, EGP12902.1, EGP10787.1, EGP05003.1, EGP02749.1, and EGP00785.1) were significantly down-regulated. Four genes (EGP33454.1, EGP31607.1, EGP26953.1, and EGP04508.1) did not respond to PEG treatment. Remarkably, eight genes (EGP21874.1, EGP16345.1, EGP05003.1, EGP28524.1, EGP00776.1, EGP12902.1, EGP28151.1, and EGP21875.1) exhibited a consistent response to all three treatments, while two genes (EGP21874.1 and EGP21875.1) demonstrated upregulation in expression across all three experimental conditions.

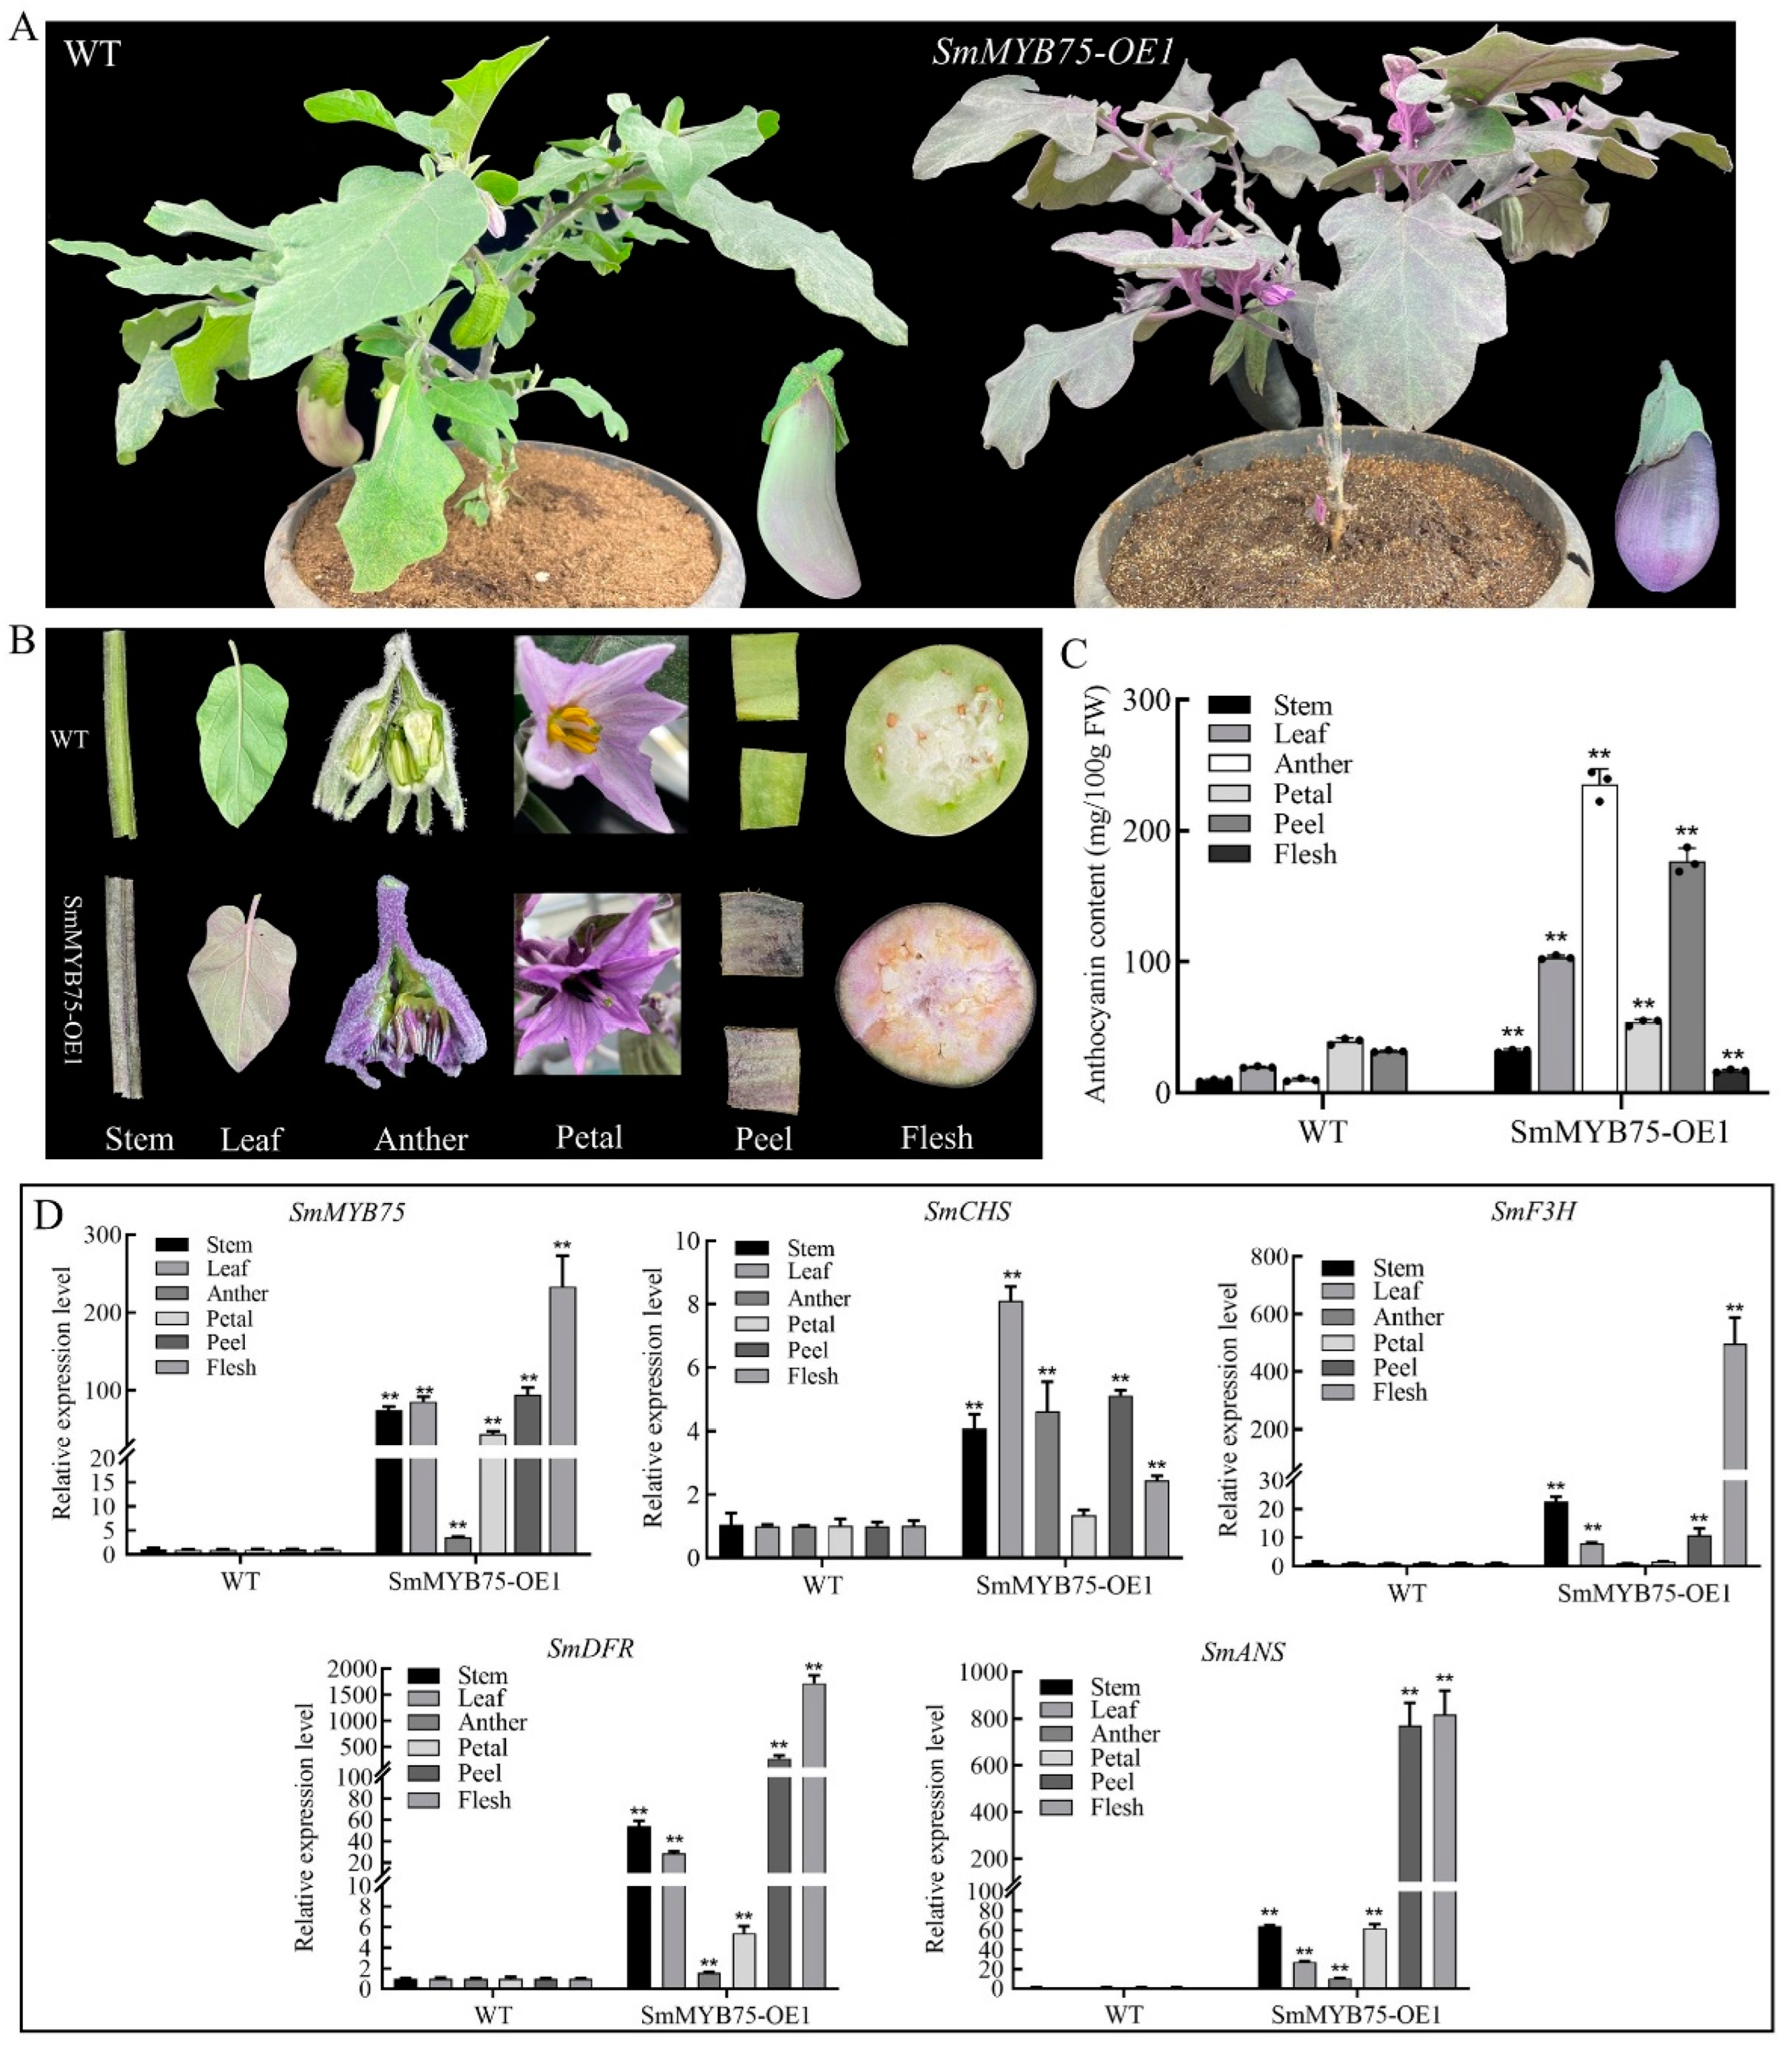
2.8. Generation and Characterization of SmMYB75-OE Transgenic Eggplant Fruit

Positive transgenic plants were obtained by overexpressing SmMYB75 in the eggplant variety ‘LSHX’. Compared with the wild type, the transgenic plants exhibited a distinct purple phenotype overall, with stems, leaves, petals, stamens, pericarp, and pulp turning purple (Figure 8A,B). The anthocyanin content was significantly increased in all tissues (Figure 8C) and the expression levels of SmMYB75 as well as the structural genes for anthocyanin biosynthesis (SmCHS, SmF3H, SmANS, and SmDFR) were significantly up-regulated in all of these tissues (Figure 8D), which further demonstrated the potent function of SmMYB75 in the biosynthesis of anthocyanins in eggplants.

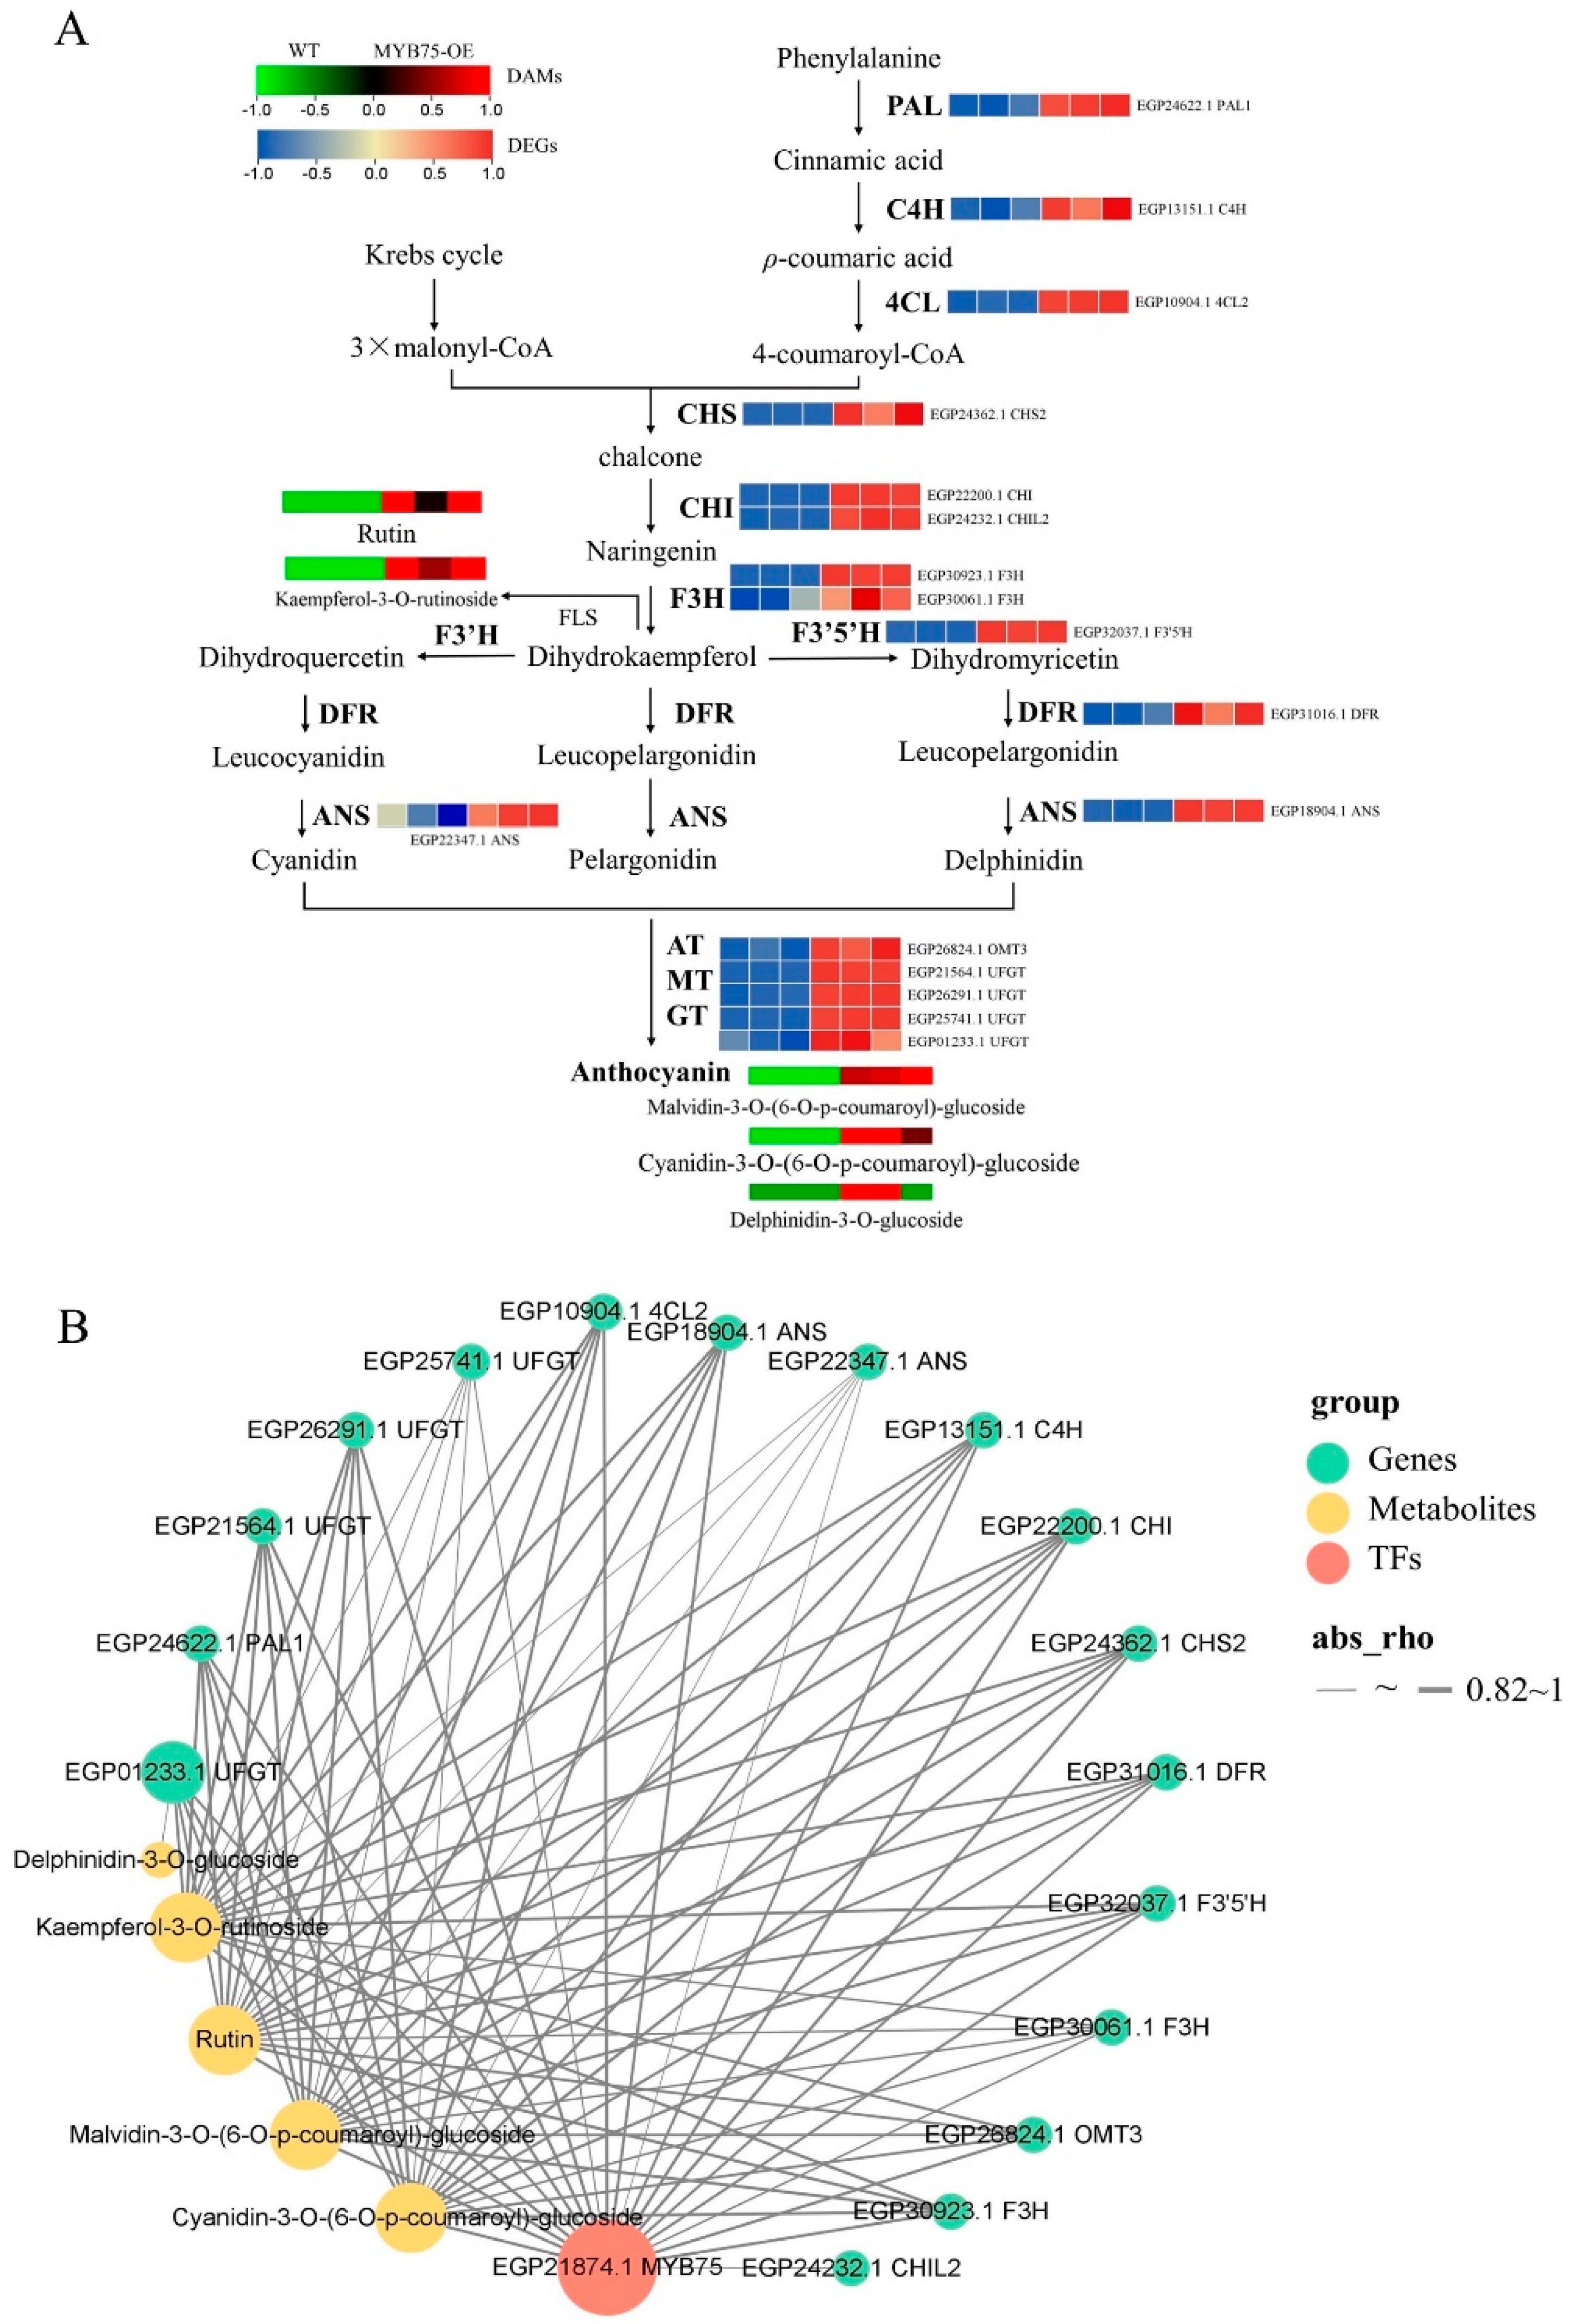
2.9. Anthocyanin-Targeted Metabolomic and Transcriptomic Analysis of Eggplant Flesh

Transcriptome and targeted metabolomic analyses were performed on flesh from SmMYB75-OE and WT plants in order to investigate the impact of SmMYB75 overexpression on anthocyanin synthesis. A total of eight classes of metabolites were detected, including cyanidin, delphinidin, malvidin, pelargonidin, peonidin, petunidin, flavonols, and flavones. Five of the metabolites were upregulated, specifically cyanidin-3-O-(6-O-p-coumaroyl)-glucoside, delphinidin-3-O-glucoside, malvidin-3-O-(6-O-p-coumaroyl)-glucoside, rutin, and kaempferol-3-O-rutinoside (Table S4). Based on the transcriptome data, 2193 DEGs (1404 upregulated and 789 downregulated) were detected between SmMYB75-OE and WT (Table S5). KEGG analysis demonstrated that these DEGs were mostly enriched in pathways related to secondary metabolism, flavonoid biosynthesis, and anthocyanin biosynthesis, demonstrating the involvement of SmMYB75 in anthocyanin biosynthesis (Figure S2A and Table S6). GO classification of these genes was also performed based on biological processes, cellular components, and molecular functions (Figure S2B and Table S7).
Based on the biological processes, 18 DEGs were involved in anthocyanin biosynthesis, flavonoid biosynthesis, or metabolic pathways. For example, the genes SmANS (EGP18904.1), SmCHI (EGP22200.1), SmF3H (EGP30923.1), SmF3′5′H (EGP32037.1), SmDFR (EGP31016.1), and Sm3GT (EGP21564.1) were involved in the anthocyanin biosynthetic pathway (ko00942) (Table S7). Furthermore, 12 other DEGs associated with flavonoid biosynthesis were significantly upregulated in SmMYB75-OE plants compared to WT (Figure 9A). These results suggest that SmMYB75 overexpression in eggplants may affect flavonoid (anthocyanin) biosynthesis via structural gene regulation.
The correlation analysis between gene expression and metabolite levels demonstrated a strong positive correlation (correlation coefficient > 0.82) between all DEGs and SmMYB75, except for the direct association between delphinidin-3-O-glucoside and EGP01233 (3GT). Furthermore, the other four differentially accumulated metabolites were also directly correlated with SmMYB75 and multiple other structural genes (Figure 9B). These findings suggest that SmMYB75 may indirectly affect metabolite accumulation in eggplant fruit flesh via direct regulation of structural genes.

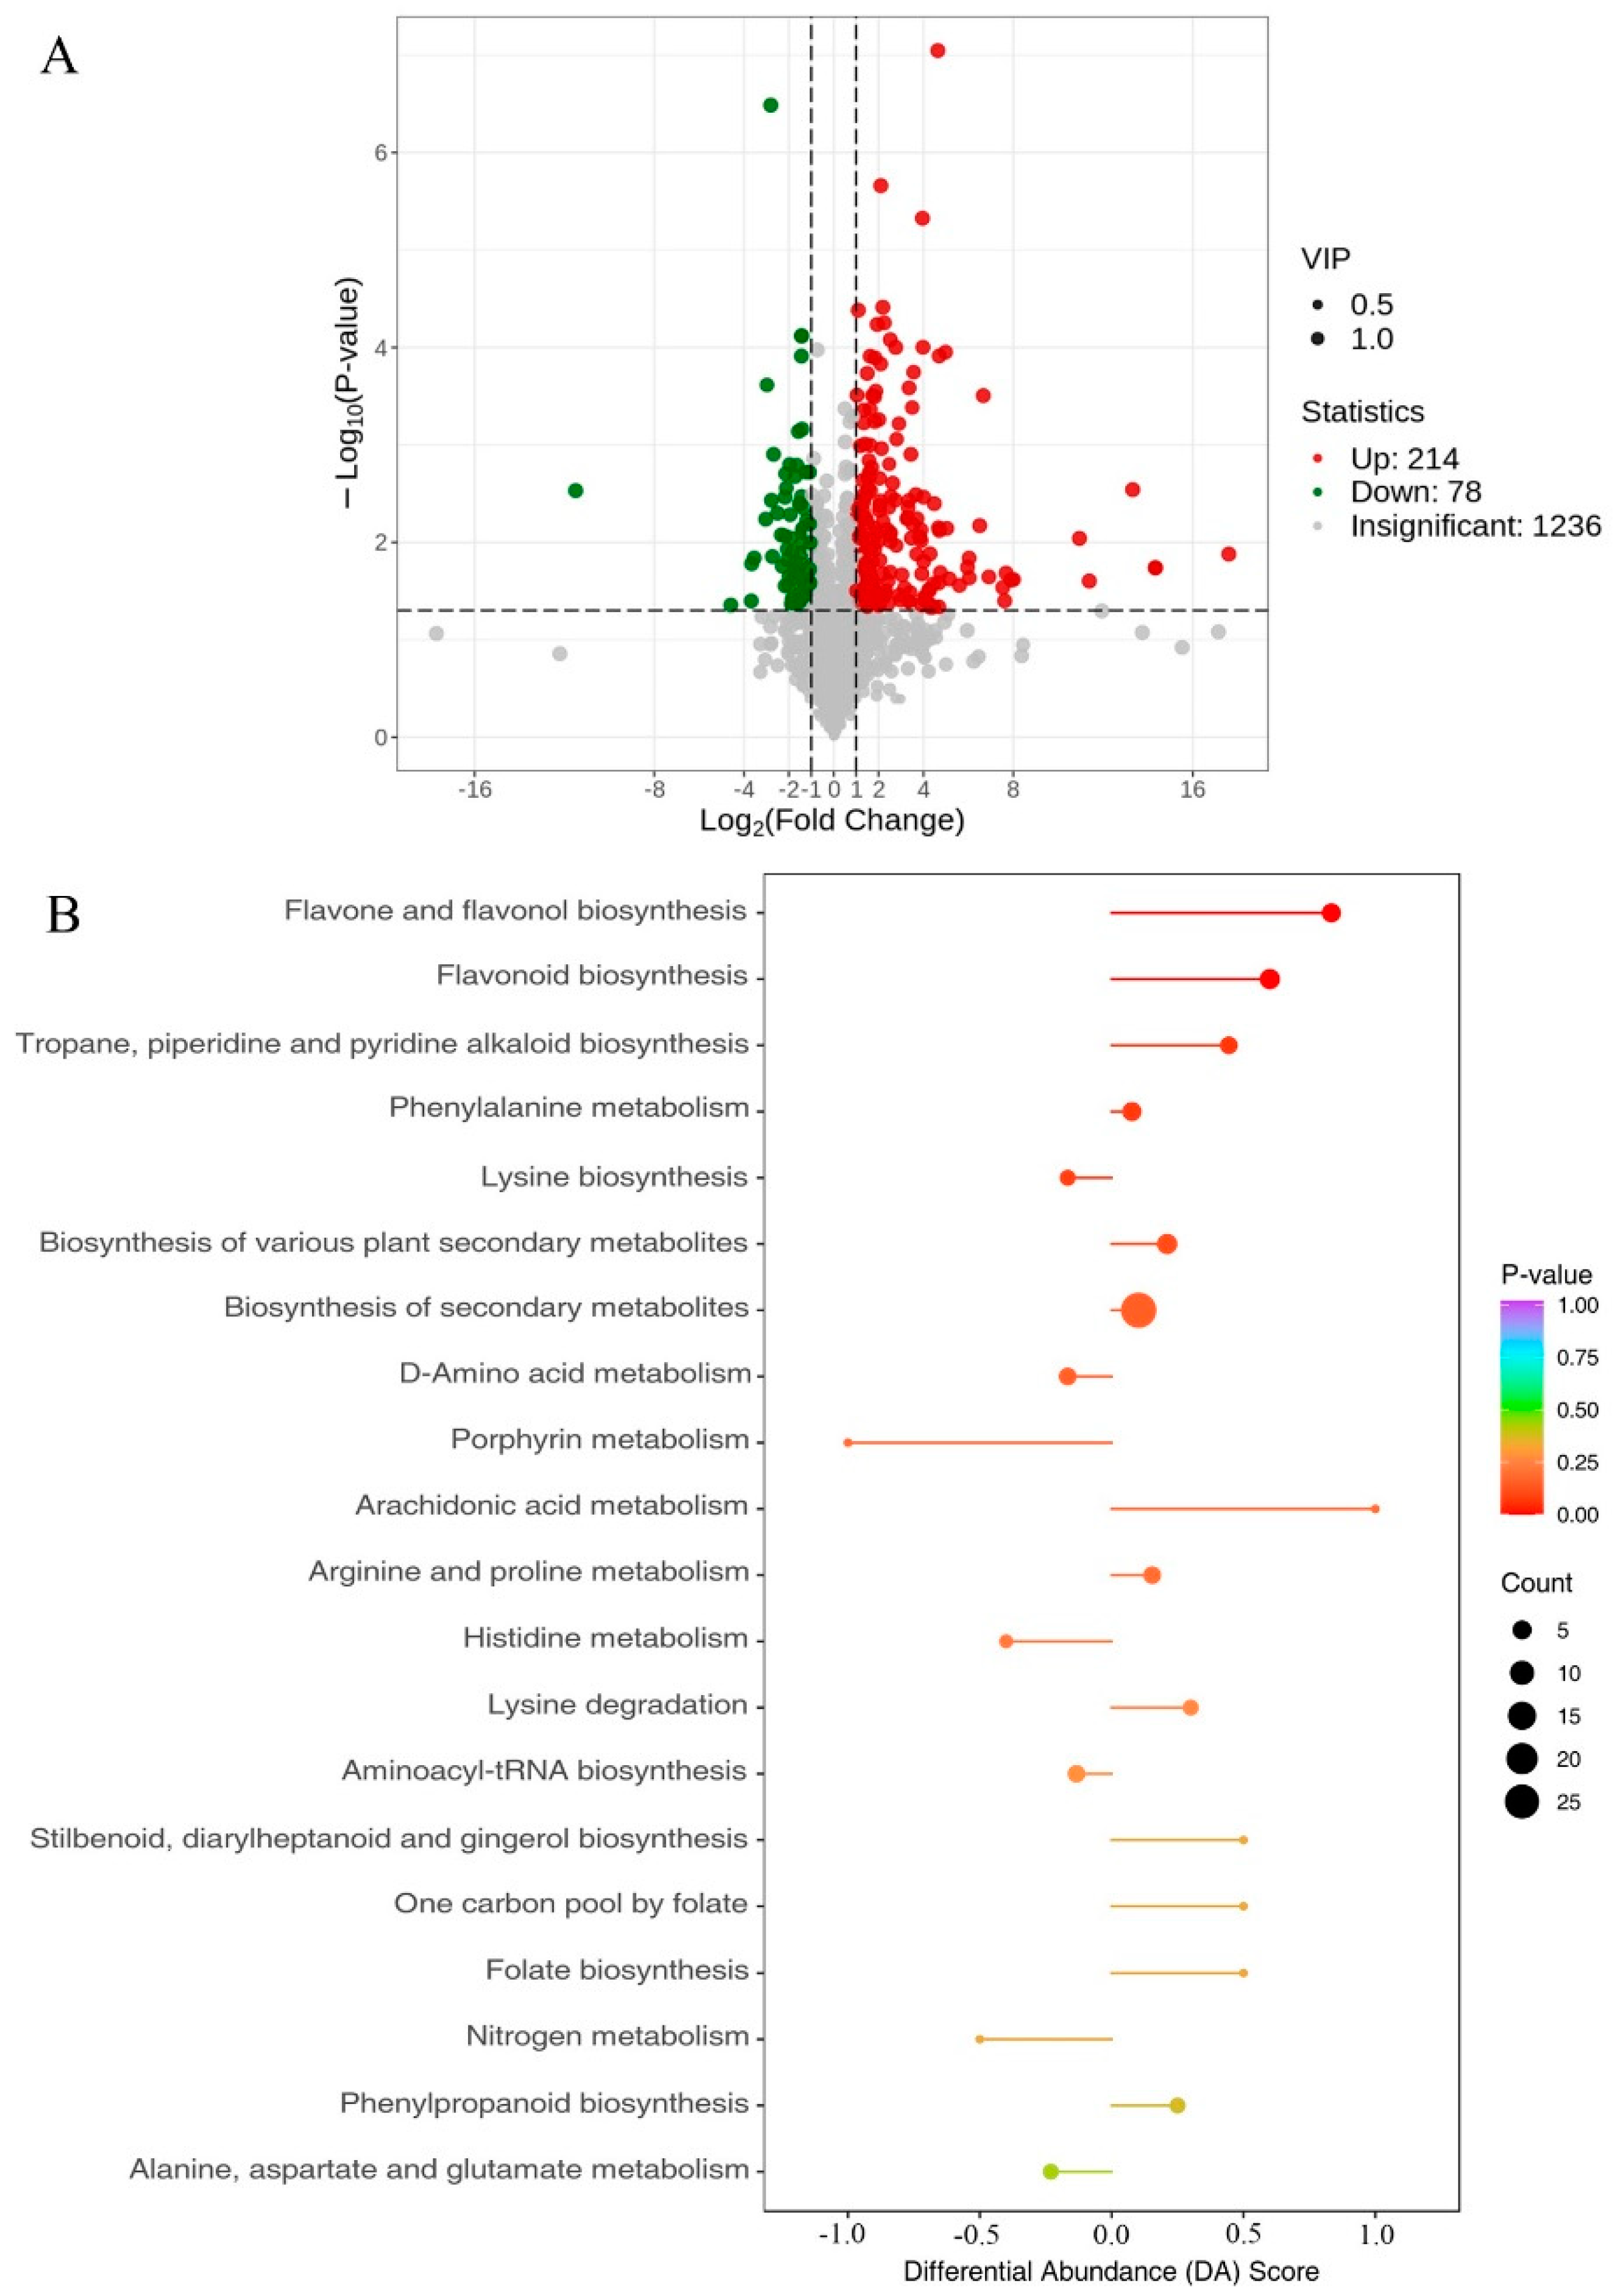
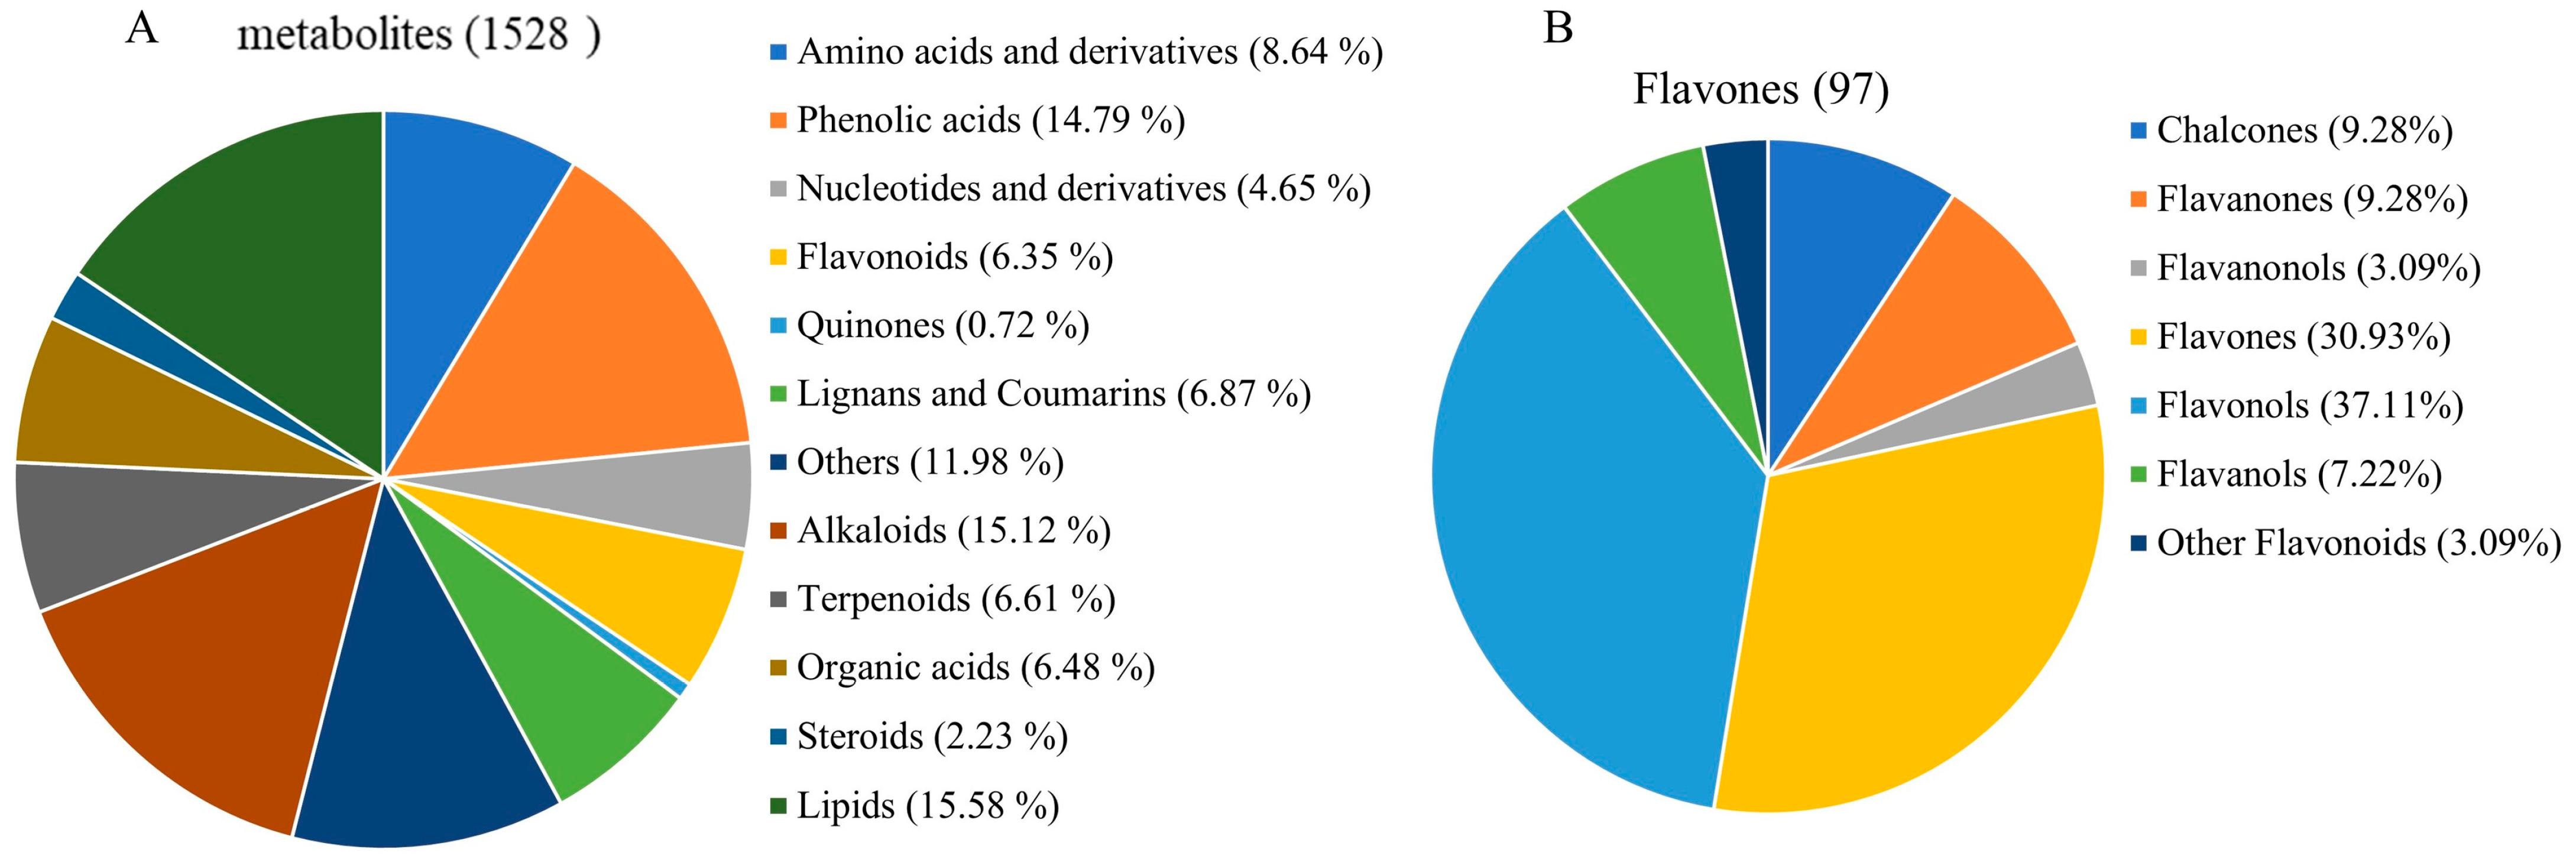
2.10. Comprehensive Targeted Metabolic Profiling

To investigate the impact of SmMYB75 overexpression on the metabolic profile of eggplant fruit pulp, a comprehensive targeted metabolomics analysis was conducted by the UPLC-MS platform extensively targeted metabolomic technique. A total of 1528 metabolites were monitored, including 132 amino acids and derivatives, 226 phenolic acids, 71 nucleotides and derivatives, 97 flavonoids, 105 lignans and coumarins, 231 alkaloids, 101 terpenoids, 99 organic acids, 238 lipids, 34 steroids, 11 quinones, and an additional 183 other metabolites (Figure 10A and Table S8). Since anthocyanins are downstream of flavonoid synthesis, we focused on flavonoid metabolites. The 97 flavonoid compounds included 30 flavones, 36 flavonols, 9 chalcones, 9 flavanones, 7 flavanols, 3 flavanonols, and 3 other flavonoids (Figure 10B). PCA analysis showed a significant separation between WT and SmMYB75-OE, suggesting that the samples overexpressing SmMYB75-OE resulted in significant changes in metabolites in the samples, consistent with the phenotypic changes. Differences in the accumulation patterns of metabolites in different samples could be analyzed by clustering heatmaps and the results showed that there were obvious differences between the two groups of substances and that different biological replicates also clustered together, indicating good homogeneity among the biological replicates and high reliability of the data. From both principal component analysis and cluster analysis, it can be shown that the metabolites produced significant differences between WT and SmMYB75-OE (Figure S3).
Fold change and VIP were further utilized to screen for differential metabolites and metabolites had to satisfy both FC > 2, VIP > 1. The results showed that there was a total of 292 differential metabolites in the pulp of wild-type and SmMYB75-OE eggplants, of which 214 metabolites were up-regulated and 78 metabolites were down-regulated (Figure 11A, Table S9). All the differential metabolites were matched against KEGG’s database to obtain information on the pathways involved in the metabolites and the annotated results were analyzed by enrichment to obtain the pathways with more differential metabolite enrichment. The results showed that the up-expressed differential metabolites were mainly annotated and enriched in the flavone and flavanol biosynthesis pathway and the flavonoid biosynthesis pathway. The down-regulated differential metabolites were mainly annotated and enriched in the lysine biosynthesis pathway and D-amino acid metabolism pathway (Figure 11B). The flavonoid biosynthesis pathway synthesizes the upstream substances of anthocyanins, which determines the basis of anthocyanin biosynthesis, suggesting that these metabolic pathways were relevant to our study.

3. Discussion

The R2R3-MYB gene family is one of the largest in plants, playing various crucial roles in plant physiology [5]. A genome-wide analysis of the R2R3-MYB gene family in eggplants was conducted in order to gain a comprehensive understanding of the gene functions.
A comprehensive query against the eggplant genome was conducted to identify genes encoding SmR2R3-MYB transcription factors. Similar to the number of R2R3-MYB genes previously found in other plant species such as tomato (133), wolfberry (137), pepper (108), potato (109), and Arabidopsis (126) [43], 102 genes were identified in eggplants. The phylogenetic relationships between eggplant fruit and Arabidopsis were investigated, aiming to understand the evolution and putative functions of the SmR2R3-MYBs. The identified eggplant genes were categorized into 31 subgroups (A1~A31) based on their phylogenetic relationships with the Arabidopsis genes. Notably, all SmR2R3-MYBs grouped with AtR2R3-MYBs, except for EGP22479.1 (Figure 1), suggesting that the functions of eggplant MYB genes can be inferred from their Arabidopsis homologs. For instance, EGP21874.1, EGP21875.1, and EGP22425.2 clustered with Arabidopsis AtMYB113, AtMYB114, AtMYB075, and AtMYB090 (S6), which are known to be involved in anthocyanin biosynthesis regulation [44]. Similarly, EGP04508.1, EGP15965.1, and EGP25710.1 clustered with AtMYB011, AtMYB012, and AtMYB111 (S7) associated with flavonoid accumulation control [45]. Conserved structural domains and gene structure analysis of the eggplant R2R3-MYB genes demonstrated that most contained one to six motifs and that genes in the same class contained similar structures (Figure 2). Most SmR2R3-MYBs (~80%) contained two or three exons, similar to reports in other plants [46]. Two genes, EGP22479.1 and EGP24348.1, contained more than six introns and multiple non-coding regions that may provide complex structure and function. However, most of the intron and exon sequences were conserved (Figure 3).
An increasing number of studies have shown that miRNAs play key roles in plant growth and development, hormone metabolism, and biotic and abiotic stresses by targeting specific genes. For example, miRNA828-SlMyb7-like inhibits anthocyanin biosynthesis in Arabidopsis [47], miRNA858-AtTCPs mediate leaf morphogenesis in Arabidopsis [48], and Mdm-miR858 targets MdMYB9 and MdMYBPA1 and is involved in anthocyanin biosynthesis in red flesh apple [49]. In the present study, putative miRNAs targeting SmR2R3-MYBs were predicted and 60 SmR2R3-MYBs were targeted and bound by 57 putative miRNAs. Among these interactions, sly-miR9476-5p exhibited the highest number of bound SmR2R3-MYB genes, with eight targets, followed by sly-miR9469-3p with six targets, and sly-miR9470-5p with five targets. Notably, EGP18083.1 was the SmR2R3-MYB gene with the most targets, being targeted by seven miRNAs (Figure 4). These miRNA-SmR2R3-MYB interactions hold the potential to further elucidate their putative roles in eggplant growth, development, and stress responses, contributing to a comprehensive understanding of these processes.
Gene duplication has greatly contributed to the expansion of MYB genes throughout the plant kingdom and is considered to be a major force in gene evolution [15]. Chromosome distribution and gene duplication events analysis identified 10 (9.8%) and 26 (25.5%) SmR2R3-MYB genes as tandem and fragmental replications, respectively, suggesting that fragmental replication events are the primary cause of SmR2R3-MYB gene amplification. Some evolved members may have lost their original functions or acquired new ones to improve plant adaptation [50]. Tandem and fragmental replication may contribute to the adaptation of eggplant fruit to its environment since the Ka/Ks ratios for five pairs of tandem genes and 26 pairs of fragmental replication genes were less than 1 (Table S2). These results suggest that purifying selection and functional differentiation may have occurred in these genes.
A plethora of studies have demonstrated that R2R3-MYB TFs play a regulatory role in plant-specific processes, including responses to various stresses [51] and secondary metabolic processes [52]. For example, AtMYB41 in Arabidopsis is induced when plants are exposed to high salt, abscisic acid (ABA), drought, and cold [53]. Twenty-six SmR2R3-MYB genes were randomly screened and used to analyze the expression under different treatments (PEG, ABA, and 4 °C). A total of 24 genes were responsive to at least one treatment (Figure 7). Among all the genes that were activated or repressed, 12 responded to all three treatment conditions concurrently. This may be because the promoter regulatory elements are stress-responsive. Exceptionally, two genes (EGP21874.1 and EGP21875.1) were up-regulated in expression in all three treatments, suggesting that these two genes may have a strong role in response to stress. Coincidentally, these two genes were also previously reported to promote anthocyanin biosynthesis in eggplant fruit [41,54]. The SmR2R3-MYBs exhibited various transcriptional profiles (i.e., activation or repression), suggesting that they have different physiological functions and, specifically, further functional evaluation of R2R3-MYBs in eggplant fruit is necessary.
Previous studies have demonstrated that the overexpression of SmMYB75 promotes anthocyanin synthesis in eggplant callus [41]. However, the detailed mechanism of action in eggplant fruit for SmMYB75 and its effects on other metabolites have not been investigated. This study examined the role of this gene in greater detail. Higher expression of SmMYB75 was correlated with a more pronounced purple color and a corresponding increase in anthocyanin content. The SmMYB75 gene had a significant impact on anthocyanin biosynthesis in all tissues, including the stem, leaf, petal, anther, pericarp, and flesh in mature eggplants (Figure 8). The flesh, being the edible part of the eggplant, holds substantial nutritional and sensory value. To explore the potential mechanisms of SmMYB75 in eggplant flesh, we conducted transcriptome and metabolome sequencing.
The anthocyanin synthesis pathway in plants is a branch of the flavonoid pathway that is synthesized on the endoplasmic reticulum and, following modification, is transported to the vesicles for storage [55]. Anthocyanin biosynthesis has been relatively well-studied in eggplants but the same cannot be said for the biosynthesis of non-anthocyanin flavonoids [34,56,57]. Transcriptomic data demonstrated significant upregulation of 17 structural genes involved in flavonoid biosynthesis, including PAL (EGP24622.1), C4H (EGP13151.1), and 4CL (EGP10904.1), which belong to the phenylalanine synthesis pathway (Figure 9). Anthocyanin-targeted metabolome results suggested that overexpression of SmMYB75 not only affects anthocyanin biosynthesis but also has a significant consequence on genes of the entire phenylalanine synthesis pathway. In this context, SmMYB75 overexpression led to differential accumulation of three anthocyanins (malvidin-3-O-(6-O-p-coumaroyl)-glucoside, delphinidin-3-O-glucoside, and cyanidin-3-O-(6-O-p-coumaroyl)-glucoside) and two flavonoids (kaempferol-3-O-rutinoside and rutin) in the flesh. Co-analysis revealed that these five metabolites and all differentially expressed genes were highly correlated with SmMYB75 expression levels (Figure 9).
The purple appearance of tea has been previously attributed to a variety of factors, including anthocyanin structure, the pH value surrounding the encapsulated anthocyanin vesicles, and the presence of flavonoids as co-pigments [58]. Therefore, the purple phenotype of eggplant flesh may depend primarily on the accumulation of delphinidin-3-O-glucoside and cyanidin-3-O-(6-O-p-coumaroyl)-glucoside, with two other flavonoids playing a supporting role. This result was similar to the eggplant pericarp, where delphinidin 3-O-glucoside and delphinidin 3-O-rutinoside are also considered key metabolites that determine the degree of the purple color of the eggplant pericarp [54]. However, the mechanism of the intrinsic interaction between the two metabolites requires further investigation. In order to further investigate the impact of the SmMYB75 gene on eggplant fruit quality, we conducted a comprehensive targeted metabolomic analysis of eggplant pulp to identify differential metabolites. Overexpressing SmMYB75 can increase the content of various beneficial compounds such as flavonoids, phenolic acids, and terpenes in eggplant pulp (Figure 10). These compounds have significant effects on plant growth, health, and human nutrition. Anthocyanins, flavonoids, phenolic acids, and terpenes are secondary metabolites found in plants and possess various biological activities, including antioxidant and anti-inflammatory properties. Previously, single overexpression of SlMYB75 has also been shown to increase the total phenolics, flavonoids, and soluble solids content in tomato fruits. Additionally, it can elevate the content of aroma compounds such as aldehydes, phenylpropanoid-derived substances, and terpene volatiles. These findings indicate that this gene can serve as a key regulatory factor for fruit quality attributes, opening up new avenues for engineering foods with enhanced sensory and nutritional qualities [28]. Therefore, by regulating the SmMYB75 gene, it is possible to enhance the levels of these compounds in eggplants, improving their nutritional value and antioxidant capacity, which is beneficial for human health. This genetic improvement approach can be applied in agriculture to enhance the quality and nutritional value of eggplants.

4. Materials and Methods

4.1. Identification and Classification of R2R3-MYB Genes in Eggplants

The genome sequences of Arabidopsis thaliana and eggplants (Solanum melongena L.) were downloaded from The Arabidopsis Information Resource (TAIR; https://www.Arabidopsis.org/, accessed on 6 May 2023) and the Eggplant Genome Database (https://db.cngb.org/search/project/CNP0000734/, accessed on 6 May 2023) [59], respectively, to identify R2R3-MYB family members. The previously reported AtMYB protein sequence was used as a query to retrieve the putative eggplant R2R3-MYB gene using a two-blast method with TBtools software [60]. The SMART (http://smart.embl-heidelberg.de/, accessed on 7 May 2023) [61] and CDD (https://www.ncbi.nlm.nih.gov/Structure/cdd/cdd.shtml, accessed on 7 May 2023) databases [62] were used for R2R3-MYB structural domain validation of candidate-specific proteins. Finally, 102 eggplant R2R3-MYB genes were identified from the eggplant genome. Physicochemical properties of SmR2R3-MYB proteins including isoelectric point (pI), molecular weight (MW), amino acid number (aa), and open reading frame (ORF) were predicted using ExPASy (https://www.expasy.org/, accessed on 7 May 2023).

4.2. Phylogenetic Tree Analysis and Classification of R2R3-MYB Genes in Eggplants

An unrooted phylogenetic tree including eggplant and Arabidopsis R2R3-MYB proteins was constructed using TBtools software in order to determine the evolutionary relationships between the R2R3-MYB genes. First, the ML method was utilized to compare all protein sequences with default parameters with 1000 bootstrap reiterations. The resulting phylogenetic tree of the SmMYB genes was then further refined using the interactive tree of life website(iTOL, https://itol.embl.de/, accessed on 10 May 2023). Based on the phylogenetic relationships between eggplant SmMYB and Arabidopsis AtMYB members, the SmMYB gene family has been classified accordingly [63].

4.3. Gene Structure, Conserved Domain, and Motif Analysis

The structure and composition of eggplant R2R3-MYB genes were examined using the TBtools software. The conserved domains of the proteins were obtained via the Batch CD-Search Tool online. The Multiple Expectation Maximization for Motif Elicitation (MEME) software version 5.0.5 (http://meme-suite.org/tools/meme, accessed on 12 May 2023) was used to identify conserved motifs within the eggplant R2R3-MYB genes.

4.4. miRNA-R2R3-MYBs Prediction

To forecast the putative miRNA target sites in SmR2R3-MYB genes, we employed all CDS sequences of SmR2R3-MYBs as candidate targets for predicting putative miRNAs. Subsequently, we queried against the candidate targets using the available Solanaceae miRNA mature sequences acquired from the miRbase database (http://www.mirbase.org/, accessed on 13 May 2023) via the psRNATarget server with default parameters [64]. The Sankey plot was employed to present the associations of the putative miRNAs and the corresponding target genes through the Tutools platform (https://www.genedenovo.com, accessed on 13 May 2023).

4.5. Chromosomal Localization, Gene Duplication, and Syntenic Analysis

The chromosomal locations and visualization of all SmR2R3-MYB genes were performed using TBtools software. Gene duplication events in eggplants were manually analyzed and represented on the physical map using Multiple Collinear Scanning toolkits (MCScanX) [65]. Genome sequences and gff3 files for Solanum lycopersicum, Solanum tuberosum, Capsicum annuum, Oryza sativa, and Zea mays were downloaded from Ensembl Plants (http://plants.ensembl.org/index.html, accessed on 13 May 2023). The syntenic relationships between the SmR2R3-MYB genes and these five species were determined using TBtools [60]. Circos was used to visualize segmented replicated gene pairs [66]. Finally, Ka/Ks ratios were calculated using TBtools.

4.6. Expression Profiles of Abiotic Stress-Responsive Results and qRT-PCR

The eggplant cultivar ‘LSHX’ was used to characterize the expression patterns of SmR2R3-MYB genes in response to phytohormonal and environmental stress conditions. Plants were cultured in a growth chamber with diurnal temperatures ranging from 22 to 25 °C and a 16 h light/8 h dark photoperiod. At the fourth true leaf stage, eggplant seedlings were treated with 100 g/L PEG6000, 100 μM ABA, and low temperature (4 °C). Leaves of three different plants were collected at 0, 0.5, 1, 3, 6, 12, and 24 h post-treatment. Each experiment was performed at least in triplicate. All samples were frozen in liquid nitrogen and stored at −80 °C for future use. Total RNA was isolated using the SteadyPure Plant RNA Extraction Kit (Accurate, Changsha, China) according to the manufacturer’s instructions. First-strand complementary DNA was produced using the Evo M-MLV RT Kit with clean gDNA (Accurate, Changsha, China). The SmActin (GU984779.1) gene was used as the internal reference. qRT-PCR-specific primers were designed based on the SmR2R3-MYB sequences using the Primer 5 software (Table S1). qRT-PCR was performed using the SYBR® Green Premix Pro Taq HS qPCR kit (Accurate, Changsha, China). Relative mRNA expression was calculated using the 2−ΔΔCt method [67].

4.7. Vector Construction and Plant Transformation

The full-length SmMYB75 CDS without a stop codon was fused to a modified PHB plant expression vector driven by a CaMV35S promoter containing a yellow fluorescent protein (YFP) reporter gene to produce the fusion vector PHB-SmMYB75-YFP. The fusion vector was then transferred into Agrobacterium tumefaciens GV3101 using the heat shock method. Eggplant (Solanum melongena L.) ‘LSHX’ cultivar was used to generate transgenic plants via Agrobacterium-mediated transformation according to a previously reported protocol [68].

4.8. RNA-Seq Analysis

Three biological replicates from the eggplant flesh of wild type (WT) ‘LSHX’ cultivar and SmMYB75-OE (over-expression) line were collected. The total RNA of the samples was extracted using the RNAprep Pure Plant Kit (DP441, Tianen, China). RNA sequencing (RNA-seq) was performed on the Illumina machine by Metware Biotechnology Co. (Wuhan, China). Clean data were obtained following filtering. The clean reads were then mapped to the reference eggplant genome using HISAT2. The FPKM (fragments per kilobase of transcript per million fragments mapped) method was used to determine the levels of gene expression [69]. Differentially expressed genes (DEGs) between two-sample comparisons were analyzed using the DESeq2 package (version 1.20.0) by applying a significance threshold of p-value < 0.05 and |log2 foldchange| ≥ 1. The GO and KEGG analyses were performed following the methodology previously described by Liu et al. [70].

4.9. Extraction and Measurement of Total Anthocyanins

The total anthocyanin content in 0.5 g of eggplant samples was measured by pH difference spectrophotometry as previously described [71]. The anthocyanin content was calculated as follows: TA = A × MW × 5 × 100 × V/e; where TA represented the total anthocyanin content (mg/100 g), V was the final volume (mL), and A = [A510 nm (pH 1.0) − A700 nm (pH 1.0)] − [A510 nm (pH 4.5) − A700 nm (pH 4.5)]. The molar absorptivity (e) was 26,900 and the molecular weight (MW) was 449.2. Each sample was performed in triplicate.

4.10. Metabolite Analysis

The identification and quantification of anthocyanin metabolites in eggplant pulp samples were determined by a liquid chromatography-electrospray ionization-tandem mass spectrometry (LC-ESI-MS/MS) system from MetWare (Wuhan, China), with detailed descriptions referring to previous studies [72]. Metabolite data analysis was performed with Analyst 1.6.1 software (AB SCIEX, Ottawa, ON, Canada). Supervised multivariate methods, namely partial least squares-discriminant analysis (PLS-DA), were used to maximize metabolome differences between pairs of samples. The relative importance of each metabolite to the PLS-DA model was examined using a parameter called variable importance in projection (VIP). Metabolites with VIP ≥ 1 and fold change ≥ 2 or fold change ≤ 0.5 were considered differential metabolites for population identification [73].

4.11. Statistical Analysis

All experiments were repeated at least in triplicate and one-way analysis of variance (ANOVA) was performed using IBM SPSS statistical software 20.0 (SPSS Inc., New York, NY, USA) for statistical significance analysis. Differential expression analysis of the RNA-seq data was performed for both WT and OE samples using the DEGseq R package. A p-value < 0.05 and |log2(foldchange)| ≥ 1 were set as the threshold for significant differential expression.

Supplementary Materials

The following supporting information can be downloaded at https://www.mdpi.com/article/10.3390/ijms25021163/s1.

Author Contributions

H.C. and Y.L. conceived and designed the research. S.S., D.L., S.L., J.L., N.Z. and H.G. performed the experiments and analyzed the data. S.S. wrote the paper. All authors have read and agreed to the published version of the manuscript.

Funding

This research was funded by the Shanghai Agriculture Applied Technology Development Program, China (202202080012F01109), and the National Natural Science Foundation of China (32172563 and 32272721).

Data Availability Statement

Data is contained within the article and Supplementary Material.

Acknowledgments

We thank Zhengyu Cao of Shanghai Pudong New District Agricultural Technology Extension Center for analyzing the experimental data during the course of this study.

Conflicts of Interest

The authors declare no conflict of interest.

References

  1. Allan, A.C.; Hellens, R.P.; Laing, W.A. MYB transcription factors that colour our fruit. Trends Plant Sci. 2008, 13, 99–102. [Google Scholar] [CrossRef] [PubMed]
  2. Lloyd, A.; Brockman, A.; Aguirre, L.; Campbell, A.; Bean, A.; Cantero, A.; Gonzalez, A. Advances in the MYB-bHLH-WD Repeat (MBW) Pigment Regulatory Model. Addition of a WRKY Factor and Co-option of an Anthocyanin MYB for Betalain Regulation. Plant Cell Physiol. 2017, 58, 1431–1441. [Google Scholar] [CrossRef] [PubMed]
  3. Li, J.; Han, G.; Sun, C.; Sui, N. Research advances of MYB transcription factors in plant stress resistance and breeding. Plant Signal. Behav. 2019, 14, 1613131. [Google Scholar] [CrossRef] [PubMed]
  4. Liu, J.; Osbourn, A.; Ma, P. MYB Transcription Factors as Regulators of Phenylpropanoid Metabolism in Plants. Mol. Plant 2015, 8, 689–708. [Google Scholar] [CrossRef] [PubMed]
  5. Dubos, C.; Stracke, R.; Grotewold, E.; Weisshaar, B.; Martin, C.; Lepiniec, L. MYB transcription factors in Arabidopsis. Trends Plant Sci. 2010, 15, 573–581. [Google Scholar] [CrossRef] [PubMed]
  6. Zhang, Y.; Zhang, B.; Yang, T.; Zhang, J.; Liu, B.; Zhan, X.; Liang, Y. The GAMYB-like gene SlMYB33 mediates flowering and pollen development in tomato. Hortic. Res. 2020, 7, 133. [Google Scholar] [CrossRef] [PubMed]
  7. Anwar, M.; Yu, W.; Yao, H.; Zhou, P.; Allan, A.C.; Zeng, L. NtMYB3, an R2R3-MYB from Narcissus.; Regulates Flavonoid Biosynthesis. Int. J. Mol. Sci. 2019, 20, 5456. [Google Scholar] [CrossRef]
  8. Zhang, Y.; Xu, S.; Ma, H.; Duan, X.; Gao, S.; Zhou, X.; Cheng, Y. The R2R3-MYB gene PsMYB58 positively regulates anthocyanin biosynthesis in tree peony flowers. Plant Physiol. Biochem. 2021, 164, 279–288. [Google Scholar] [CrossRef]
  9. Yan, S.; Chen, N.; Huang, Z.; Li, D.; Zhi, J.; Yu, B.; Liu, X.; Cao, B.; Qiu, Z. Anthocyanin Fruit encodes an R2R3-MYB transcription factor, SlAN2-like, activating the transcription of SlMYBATV to fine-tune anthocyanin content in tomato fruit. New Phytol. 2020, 225, 2048–2063. [Google Scholar] [CrossRef]
  10. Fang, Q.; Jiang, T.; Xu, L.; Liu, H.; Mao, H.; Wang, X.; Jiao, B.; Duan, Y.; Wang, Q. A salt-stress-regulator from the Poplar R2R3 MYB family integrates the regulation of lateral root emergence and ABA signaling to mediate salt stress tolerance in Arabidopsis. Plant Physiol. Biochem. 2017, 114, 100–110. [Google Scholar] [CrossRef]
  11. Gao, F.; Zhou, J.; Deng, R.Y.; Zhao, H.X.; Li, C.L.; Chen, H.; Suzuki, T.; Park, S.U.; Wu, Q. Overexpression of a tartary buckwheat R2R3-MYB transcription factor gene, FtMYB9, enhances tolerance to drought and salt stresses in transgenic Arabidopsis. J. Plant Physiol. 2017, 214, 81–90. [Google Scholar] [CrossRef] [PubMed]
  12. Zhao, Y.; Yang, Z.; Ding, Y.; Liu, L.; Han, X.; Zhan, J.; Wei, X.; Diao, Y.; Qin, W. Over-expression of an R2R3 MYB Gene, GhMYB73, increases tolerance to salt stress in transgenic Arabidopsis. Plant Sci. 2019, 286, 28–36. [Google Scholar] [CrossRef]
  13. Song, Y.; Yang, W.; Fan, H.; Zhang, X.; Sui, N. TaMYB86B encodes a R2R3-type MYB transcription factor and enhances salt tolerance in wheat. Plant Sci. 2020, 300, 110624. [Google Scholar] [CrossRef]
  14. Fan, H.; Cui, M.; Li, N.; Li, X.; Liang, Y.; Liu, L.; Cai, Y.; Lin, Y. Genome-wide identification and expression analyses of R2R3-MYB transcription factor genes from two Orchid species. PeerJ 2020, 8, e9781. [Google Scholar] [CrossRef] [PubMed]
  15. Li, D.; He, Y.; Li, S.; Shi, S.; Li, L.; Liu, Y.; Chen, H. Genome-wide characterization and expression analysis of AP2/ERF genes in eggplant (Solanum melongena L.). Plant Physiol. Biochem. 2021, 167, 492–503. [Google Scholar] [CrossRef] [PubMed]
  16. Diao, Y.; Liu, J.Y.; Zhou, M.Q.; Li, H.Z. Chromosomal Localization of Anthocyanin Biosynthetic Genes bz1.; bz2 in Lotus. J. Wuhan Bot. Res. 2004, 22, 380–384. [Google Scholar]
  17. Yan, H.; Pei, X.; Zhang, H.; Li, X.; Zhao, X. MYB-Mediated Regulation of Anthocyanin Biosynthesis. Int. J. Mol. Sci. 2021, 22, 3103. [Google Scholar] [CrossRef]
  18. Zong, Y.; Li, S.; Xi, X.; Cao, D.; Liu, B. Comprehensive Influences of Overexpression of a MYB Transcriptor Regulating Anthocyanin Biosynthesis on Transcriptome and Metabolome of Tobacco Leaves. Int. J. Mol. Sci. 2019, 20, 5123. [Google Scholar] [CrossRef]
  19. Xu, H.; Zou, Q.; Yang, G.; Jiang, S.; Chen, X. MdMYB6 regulates anthocyanin formation in apple both through direct inhibition of the biosynthesis pathway and through substrate removal. Hortic. Res. 2020, 7, 17. [Google Scholar] [CrossRef]
  20. Xie, X.B.; Li, S.; Zhang, R.F.; Zhao, J.; Chen, Y.C.; Zhao, Q.; Yao, Y.X.; You, C.X.; Zhang, X.S.; Hao, Y.J. The bHLH transcription factor MdbHLH3 promotes anthocyanin accumulation and fruit colouration in response to low temperature in apples. Plant. Cell Environ. 2012, 35, 1884–1897. [Google Scholar] [CrossRef]
  21. Martin, C.; PazAres, J. MYB transcription factors in plants. Trends Genet. 1997, 13, 67–73. [Google Scholar] [CrossRef] [PubMed]
  22. Paz-Ares, J.; Ghosal, D.; Wienand, U.; Peterson, P.A.; Saedler, H. The regulatory c1 locus of Zea mays encodes a protein with homology to myb proto-oncogene products and with structural similarities to transcriptional activators. EMBO J. 1987, 6, 3553–3558. [Google Scholar] [CrossRef]
  23. Zhao, M. Regulation of Arabidopsis trichome Patterning and Anthocyanin Biosynthesis by the TTG1-bHLH-MYB Complex; The University of Texas at Austin: Austin, TX, USA, 2007. [Google Scholar]
  24. Panaud, O.; Jackson, S.A.; Wendel, J.F. Complexity and robustness of the flavonoid transcriptional regulatory network revealed by comprehensive analyses of MYB-bHLH-WDR complexes and their targets in Arabidopsis seed. New Phytol. 2014, 202, 32–144. [Google Scholar]
  25. Kiferle, C.; Fantini, E.; Bassolino, L.; Povero, G.; Spelt, C.; Buti, S.; Giuliano, G.; Quattrocchio, F.; Koes, R.; Perata, P. Tomato R2R3-MYB Proteins SlANT1 and SlAN2. Same Protein Activity.; Different Roles. PLoS ONE 2015, 10, e0136365. [Google Scholar] [CrossRef] [PubMed]
  26. An, X.H.; Tian, Y.; Chen, K.Q.; Liu, X.J.; Liu, D.D.; Xie, X.B.; Cheng, C.G.; Cong, P.H.; Hao, Y.J. MdMYB9 and MdMYB11 are involved in the regulation of the JA-induced biosynthesis of anthocyanin and proanthocyanidin in apples. Plant Cell Physiol. 2015, 56, 650–662. [Google Scholar] [CrossRef]
  27. Raigón, M.D.; Prohens, J.; Muñoz-Falcón, J.E.; Nuez, F. Comparison of eggplant landraces and commercial varieties for fruit content of phenolics, minerals, dry matter and protein. J. Food Compos. Anal. 2008, 21, 370–376. [Google Scholar] [CrossRef]
  28. Jian, W.; Cao, H.; Yuan, S.; Liu, Y.; Lu, J.; Lu, W.; Li, N.; Wang, J.; Zou, J. SlMYB75, an MYB-type transcription factor, promotes anthocyanin accumulation and enhances volatile aroma production in tomato fruits. Hortic. Res. 2019, 6, 22. [Google Scholar] [CrossRef]
  29. Jiang, M.; Liu, Y.; Ren, L.; Lian, H.; Chen, H. Molecular cloning and characterization of anthocyanin biosynthesis genes in eggplant (Solanum melongena L.). Acta Physiol. Plant. 2016, 38, 1–13. [Google Scholar] [CrossRef]
  30. Jiang, M.; Ren, L.; Lian, H.; Liu, Y.; Chen, H. Novel insight into the mechanism underlying light-controlled anthocyanin accumulation in eggplant (Solanum melongena L.). Plant Sci. 2016, 249, 46–58. [Google Scholar] [CrossRef]
  31. Shao, W.T.; Liu, Y.; Han, H.Q.; Chen, H.Y. Cloning and Expression Analysis of an Anthocyanin-related Transcription Factor Gene SmMYB in Eggplant. Acta Hortic. Sin. 2013, 40, 467–478. [Google Scholar]
  32. Zhang, Y.; Hu, Z.; Chu, G.; Huang, C.; Tian, S.; Zhao, Z.; Chen, G. Anthocyanin accumulation and molecular analysis of anthocyanin biosynthesis-associated genes in eggplant (Solanum melongena L.). J. Agric. Food Chem. 2014, 62, 2906–2912. [Google Scholar] [CrossRef] [PubMed]
  33. Shi, S.; Liu, Y.; He, Y.; Li, L.; Li, D.; Chen, H. R2R3-MYB transcription factor SmMYB75 promotes anthocyanin biosynthesis in eggplant (Solanum melongena L.). Sci. Hortic. 2021, 282, 110020. [Google Scholar] [CrossRef]
  34. Li, L.; Li, S.; Ge, H.; Shi, S.; Li, D.; Liu, Y.; Chen, H. A light-responsive transcription factor SmMYB35 enhances anthocyanin biosynthesis in eggplant (Solanum melongena L.). Planta 2021, 255, 12. [Google Scholar] [CrossRef] [PubMed]
  35. Li, L.; He, Y.; Ge, H.; Liu, Y.; Chen, H. Functional characterization of SmMYB86, a negative regulator of anthocyanin biosynthesis in eggplant (Solanum melongena L.). Plant Sci. 2021, 302, 110696. [Google Scholar] [CrossRef] [PubMed]
  36. Stracke, R.; Werber, M.; Weisshaar, B. The R2R3-MYB gene family in Arabidopsis thaliana. Curr. Opin. Plant Biol. 2001, 4, 447–456. [Google Scholar] [CrossRef]
  37. Zhao, P.; Li, Q.; Li, J.; Wang, L.; Ren, Z. Genome-wide identification and characterization of R2R3MYB family in Solanum lycopersicum. Mol. Genet. Genom. 2014, 289, 1183–1207. [Google Scholar] [CrossRef] [PubMed]
  38. Wang, J.; Liu, Y.; Tang, B.; Dai, X.; Zou, X. Genome-Wide Identification and Capsaicinoid Biosynthesis-Related Expression Analysis of the R2R3-MYB Gene Family in Capsicum annuum L. Front. Genet. 2020, 11, 598183. [Google Scholar] [CrossRef]
  39. Yl, A.; Lw, B.; Zhen, L.A.; Acab, C.; Sq, A.; Jz, A.; Yl, A. Genome-wide analysis and expression profiles of the StR2R3-MYB transcription factor superfamily in potato (Solanum tuberosum L.)—ScienceDirect. Int. J. Biol. Macromol. 2020, 148, 817–832. [Google Scholar]
  40. Yang, J.; Zhang, B.; Gu, G.; Yuan, J.; Shen, S.; Jin, L.; Lin, Z.; Lin, J.; Xie, X. Genome-wide identification and expression analysis of the R2R3-MYB gene family in tobacco (Nicotiana tabacum L.). BMC Genom. 2022, 23, 432. [Google Scholar] [CrossRef]
  41. Li, D.; Qian, J.; Li, W.; Jiang, Y.; Gan, G.; Li, W.; Chen, R.; Yu, N.; Li, Y.; Wu, Y.; et al. Genome sequence and analysis of the eggplant (Solanum melongena L.). bioRxiv 2019. [Google Scholar] [CrossRef]
  42. Mehan, M.R.; Freimer, N.B.; Ophoff, R.A. A genome-wide survey of segmental duplications that mediate common human genetic variation of chromosomal architecture. Hum. Genom. 2004, 1, 335–344. [Google Scholar] [CrossRef] [PubMed]
  43. Yin, Y.; Guo, C.; Shi, H.; Zhao, J.; Ma, F.; An, W.; He, X.; Luo, Q.; Cao, Y.; Zhan, X. Genome-Wide Comparative Analysis of the R2R3-MYB Gene Family in Five Solanaceae Species and Identification of Members Regulating Carotenoid Biosynthesis in Wolfberry. Int. J. Mol. Sci. 2022, 23, 2259. [Google Scholar] [CrossRef] [PubMed]
  44. Boter, M.; Golz, J.F.; Gimenez-Ibanez, S.; Fernandez-Barbero, G.; Franco-Zorrilla, J.M.; Solano, R. FILAMENTOUS FLOWER Is a Direct Target of JAZ3 and Modulates Responses to Jasmonate. Plant Cell 2015, 27, 3160–3174. [Google Scholar] [CrossRef]
  45. Pandey, A.; Misra, P.; Bhambhani, S.; Bhatia, C.; Trivedi, P.K. Expression of Arabidopsis MYB transcription factor, AtMYB111, in tobacco requires light to modulate flavonol content. Sci. Rep. 2014, 4, 5018. [Google Scholar] [CrossRef] [PubMed]
  46. Ke, Y.J.; Zheng, Q.D.; Yao, Y.H.; Ou, Y.; Chen, J.Y.; Wang, M.J.; Lai, H.P.; Yan, L.; Liu, Z.J.; Ai, Y. Genome-Wide Identification of the MYB Gene Family in Cymbidiumensifolium and Its Expression Analysis in Different Flower Colors. Int. J. Mol. Sci. 2021, 22, 13245. [Google Scholar] [CrossRef]
  47. Gou, J.Y.; Felippes, F.F.; Liu, C.J.; Weigel, D.; Wang, J.W. Negative regulation of anthocyanin biosynthesis in Arabidopsis by a miR156-targeted SPL transcription factor. Plant Cell 2011, 23, 1512–1522. [Google Scholar] [CrossRef]
  48. Li, D.; Tang, X.; Dong, Y.; Wang, Y.; Shi, S.; Li, S.; Liu, Y.; Ge, H.; Chen, H. Comparative genomic investigation of TCP gene family in eggplant (Solanum melongena L.) and expression analysis under divergent treatments. Plant Cell Rep. 2022, 41, 2213–2228. [Google Scholar] [CrossRef]
  49. Li, Z.; Liu, W.; Chen, Q.; Zhang, S.; Mei, Z.; Yu, L.; Wang, C.; Mao, Z.; Chen, Z. Mdm-miR858 targets MdMYB9 and MdMYBPA1 to participate anthocyanin biosynthesis in red-fleshed apple. Plant J. 2023, 113, 1295–1309. [Google Scholar] [CrossRef]
  50. Dias, A.P.; Braun, E.L.; McMullen, M.D.; Grotewold, E. Recently duplicated maize R2R3 Myb genes provide evidence for distinct mechanisms of evolutionary divergence after duplication. Plant Physiol. 2003, 131, 610–620. [Google Scholar] [CrossRef]
  51. Yang, A.; Dai, X.; Zhang, W.-H. A R2R3-type MYB gene, OsMYB2, is involved in salt, cold, and dehydration tolerance in rice. J. Exp. Bot. 2012, 63, 2541–2556. [Google Scholar] [CrossRef]
  52. Stracke, R.; Ishihara, H.; Huep, G.; Barsch, A.; Mehrtens, F.; Niehaus, K.; Weisshaar, B. Differential regulation of closely related R2R3-MYB transcription factors controls flavonol accumulation in different parts of the Arabidopsis thaliana seedling. Plant J. 2007, 50, 660–677. [Google Scholar] [PubMed]
  53. Lippold, F.; Sanchez, D.H.; Musialak, M.; Schlereth, A.; Scheible, W.-R.; Hincha, D.K.; Udvardi, M.K. AtMyb41 Regulates Transcriptional and Metabolic Responses to Osmotic Stress in Arabidopsis. Plant Physiol. 2009, 149, 1761–1772. [Google Scholar] [CrossRef] [PubMed]
  54. Yang, G.; Li, L.; Wei, M.; Li, J.; Yang, F. SmMYB113 Is a Key Transcription Factor Responsible for Compositional Variation of Anthocyanin and Color Diversity Among Eggplant Peels. Front. Plant Sci. 2022, 13, 843996. [Google Scholar] [PubMed]
  55. Ku, Y.S.; Ng, M.S.; Cheng, S.S.; Lo, A.W.; Xiao, Z.; Shin, T.S.; Chung, G.; Lam, H.M. Understanding the Composition, Biosynthesis, Accumulation and Transport of Flavonoids in Crops for the Promotion of Crops as Healthy Sources of Flavonoids for Human Consumption. Nutrients 2020, 12, 1717. [Google Scholar] [CrossRef] [PubMed]
  56. Li, S.; He, Y.; Li, L.; Li, D.; Chen, H. New insights on the regulation of anthocyanin biosynthesis in purple Solanaceous fruit vegetables. Sci. Hortic. 2022, 297, 110917. [Google Scholar]
  57. He, Y.; Li, D.; Li, S.; Liu, Y.; Chen, H. SmBICs Inhibit Anthocyanin Biosynthesis in Eggplant (Solanum melongena L.). Plant Cell Physiol. 2021, 62, 1001–1011. [Google Scholar] [CrossRef]
  58. Shi, J.; Simal-Gandara, J.; Mei, J.; Ma, W.; Peng, Q.; Shi, Y.; Xu, Q.; Lin, Z.; Lv, H. Insight into the pigmented anthocyanins and the major potential co-pigmented flavonoids in purple-coloured leaf teas. Food Chem. 2021, 363, 130278. [Google Scholar]
  59. Li, D.; Qian, J.; Li, W.; Yu, N.; Gan, G.; Jiang, Y.; Li, W.; Liang, X.; Chen, R. A high-quality genome assembly of the eggplant provides insights into the molecular basis of disease resistance and chlorogenic acid synthesis. Mol. Ecol. Resour. 2021, 21, 1274–1286. [Google Scholar] [CrossRef]
  60. Chen, C.; Chen, H.; Zhang, Y.; Thomas, H.R.; Frank, M.H.; He, Y.; Xia, R. TBtools. An Integrative Toolkit Developed for Interactive Analyses of Big Biological Data. Mol. Plant 2020, 13, 1194–1202. [Google Scholar]
  61. Letunic, I.; Bork, P. 20 years of the SMART protein domain annotation resource. Nucleic Acids Res. 2018, 46, 493–496. [Google Scholar]
  62. Lu, S.; Wang, J.; Farideh, C.; Derbyshire, M.K.; Geer, R.C.; Gonzales, N.R.; Marc, G.; Hurwitz, D.I.; Marchler, G.H.; Song, J.S. CDD/SPARCLE: The conserved domain database in 2020. Nucleic Acids Res. 2020, 48, 265–268. [Google Scholar] [CrossRef] [PubMed]
  63. Letunic, I.; Bork, P. Interactive Tree of Life (iTOL) v5: An online tool for phylogenetic tree display and annotation. Nucleic Acids Res. 2021, 49, W293–W296. [Google Scholar] [CrossRef] [PubMed]
  64. Dai, X.; Zhao, P.X. psRNATarget, a plant small RNA target analysis server. Nucleic Acids Res. 2011, 39, W155–W159. [Google Scholar] [CrossRef]
  65. Wang, Y.; Tang, H.; Debarry, J.D.; Tan, X.; Li, J.; Wang, X.; Lee, T.H.; Jin, H.; Marler, B. MCScanX: A toolkit for detection and evolutionary analysis of gene synteny and collinearity. Nucleic Acids Res. 2012, 40, e49. [Google Scholar] [CrossRef]
  66. Chen, C.; Wu, Y.; Xia, R. A painless way to customize Circos plot: From data preparation to visualization using TBtools. iMeta 2022, 1, e35. [Google Scholar] [CrossRef]
  67. Livak, K.J.; Schmittgen, T.D. Analysis of relative gene expression data using real-time quantitative PCR and the 2−ΔΔCT Method. Methods A Companion Methods Enzymol. 2001, 25, 402–408. [Google Scholar] [CrossRef] [PubMed]
  68. Li, X.; Li, H.; Ma, W.; Guo, Z.; Li, X.; Li, X.; Zhang, Q. Determination of patulin in apple juice by single-drop liquid-liquid-liquid microextraction coupled with liquid chromatography-mass spectrometry. Food Chem. 2018, 257, 1–6. [Google Scholar] [CrossRef]
  69. Chen, W.; Zhang, J.; Zheng, S.; Wang, Z.; Xu, C.; Zhang, Q.; Wu, J.; Lou, H. Metabolite profiling and transcriptome analyses reveal novel regulatory mechanisms of melatonin biosynthesis in hickory. Hortic. Res. 2021, 8, 1–13. [Google Scholar] [CrossRef]
  70. Liu, C.; Chen, S.; Wang, S.; Zhao, X.; Li, K.; Chen, S.; Qu, G.Z. A genome wide transcriptional study of Populus alba × P. tremula var. glandulosa in response to nitrogen deficiency stress. Physiol. Mol. Biol. Plants 2021, 27, 1277–1293. [Google Scholar] [CrossRef]
  71. Liu, Y.; Tikunov, Y.; Schouten, R.E.; Marcelis, L.F.M.; Visser, R.G.F.; Bovy, A. Anthocyanin Biosynthesis and Degradation Mechanisms in Solanaceous Vegetables. A Review. Front. Chem. 2018, 6, 52. [Google Scholar] [CrossRef]
  72. Zhang, S.; Ying, H.; Pingcuo, G.; Wang, S.; Zeng, X. Identification of Potential Metabolites Mediating Bird’s Selective Feeding on Prunus mira Flowers. BioMed Res. Int. 2019, 2019, 1–8. [Google Scholar] [CrossRef] [PubMed]
  73. Yuan, H.; Zeng, X.; Shi, J.; Xu, Q.; Wang, Y.; Jabu, D.; Sang, Z.; Nyima, T. Time-Course Comparative Metabolite Profiling under Osmotic Stress in Tolerant and Sensitive Tibetan Hulless Barley. Biomed Res. Int. 2018, 2018, 9415409. [Google Scholar] [CrossRef] [PubMed]
Figure 1. Phylogenetic relationships of eggplant and Arabidopsis R2R3-MYB proteins. The ML tree for the complete amino acid sequences of the 126 Arabidopsis and 102 eggplant R2R3-MYB were constructed using TBtools with 1000 bootstrap replicates. Blue pentagrams represent Arabidopsis; red pentagrams represent eggplants. All R2R3-MYB members were classified into 31 clades (A1~A31).
Ijms 25 01163 g001
Figure 2. Composition and distribution of conserved motifs of R2R3-MYBs proteins in eggplant fruit. The number of motifs shown in the legend represents the predicted motif groups, the colored boxes represent the different 15 motifs, and the bottom scale indicates the gene lengths.
Ijms 25 01163 g002
Figure 3. Conserved structural domains and gene structural of R2R3-MYBs in eggplant fruit. (A) Phylogenetic tree of 102 R2R3-MYBs proteins. (B) Conserved domains of the R2R3-MYBs genes in eggplant fruit. (C) Positions of the 3′ noncoding regions (UTR), coding regions (CDS), and intron are indicated by green squares, yellow squares and gray lines.
Ijms 25 01163 g003
Figure 4. Interaction analysis of potential regulatory network associations between the putative miRNAs and their target SmR2R3-MYB genes. The putative miRNAs are on the left and the target SmR2R3-MYB genes are on the right. The miRNAs and SmR2R3-MYBs connected by different colored lines show potential regulatory associations.
Ijms 25 01163 g004
Figure 5. The distribution of eggplant R2R3-MYB genes across the chromosomes. The scale bar on the left represents the lengths of the chromosomes (Mb). The red lines represent the duplicated R2R3-MYB gene pairs and the chromosome number is indicated in yellow on the left.
Ijms 25 01163 g005
Figure 6. Synteny analysis between eggplants and six representative species. The putative colinear genes between eggplants and six representative species are marked in gray, while the syntenic R2R3-MYB gene pairs are marked in red.
Ijms 25 01163 g006
Figure 7. Expression pattern analysis of 26 selected SmR2R3-MYB genes in response to treatments based on qRT-PCR results. (A) 4 °C. (B) ABA. (C) PEG. Each column in the heatmap represents a sample and each row represents a gene. Three biological replicates were performed for each sample, with the mean values presented in the heat map. The colors in the graph indicate the normalized expression value of the gene in each sample.
Ijms 25 01163 g007
Figure 8. Phenotypic characterization of wild-type and SmMYB75-OE1 transgenic eggplant plants in different tissues at maturity. (A) Overall plant phenotypes. (B) Phenotypic characterization of stems, leaves, anthers, petals, pericarp, and flesh in wild-type and SmMYB75-OE1 plants. (C) Comparison of anthocyanin content in six tissues of wild-type and transgenic plants. (D) Comparison of relative expression levels of SmMYB75, SmCHS, SmF3H, SmANS, and SmDFR genes in six tissues of wild-type and transgenic plants. Three biological replicates were used for each sample and the error bars indicate the standard deviation between biological replicates. Asterisks indicates significant differences between groups, ** p < 0.01 (t-test).
Ijms 25 01163 g008
Figure 9. Relationships between structural genes and corresponding metabolites of flavonoid synthesis in the flesh of SmMYB75 transgenic plants. (A) Heatmap of flavonoid synthesis pathways for the upregulated structural genes and DAMs in SmMYB75-OE flesh. The green and blue colors represent the downregulation of metabolite accumulation and gene expression, respectively. The dark red and magenta represent the accumulation and upregulation of gene expression, respectively. (B) Correlation analysis of SmMYB75 expression and all DEGs. The content of all DAMs in WT and SmMYB75-OE eggplant flesh with correlation coefficients > 0.82 and p-values < 0.05, respectively. The size of the plots represents the number of connecting lines.
Ijms 25 01163 g009
Figure 10. Types and amounts of metabolites detected from WT and SmMYB75-OE. (A) Classification and percentage of all metabolites. (B) Types and percentage of flavonoid metabolites.
Ijms 25 01163 g010
Figure 11. Volcano plot of differential metabolites and KEGG-enriched differential abundance scores. (A) Volcano plot. Each point represents a metabolite, where green points represent down-regulated differential metabolites, red points represent up-regulated differential metabolites, and gray points represent metabolites that were detected but did not significantly differ from the horizontal coordinate representative of the logarithm of the multiplicity of the difference in the relative abundance of a metabolite between the two groups of samples (log2FC). The larger the absolute value of the horizontal coordinate is, the larger the difference in the relative abundance of the substance between the two groups of samples is. (B) Differential abundance score plot. The vertical coordinate indicates the name of the differential pathway (sorted by p-value) and the horizontal coordinate indicates the differential abundance score (DA Score). The DA Score reflects the overall changes of all metabolites in the metabolic pathway and a score of 1 indicates that the expression of all identified metabolites in the pathway tends to be up-regulated, while a score of −1 indicates that the expression of all identified metabolites in the pathway tends to be down-regulated.
Ijms 25 01163 g011
Disclaimer/Publisher’s Note: The statements, opinions and data contained in all publications are solely those of the individual author(s) and contributor(s) and not of MDPI and/or the editor(s). MDPI and/or the editor(s) disclaim responsibility for any injury to people or property resulting from any ideas, methods, instructions or products referred to in the content.

