
Peak Scores Significantly Depend on the Relationships between Contextual Signals in ChIP-Seq Peaks


Abstract
1. Introduction
2. Results
2.1. Preparing Sets of ChIP-Seq Peak Sequences
2.2. Identification of Significant Oligonucleotide Motifs in the ChIP-Seq Sequences
2.3. Multiple Regression Model-Based Assessment of the Dependence of ChIP-Seq Peak Scores on the Presence of Significant IUPAC Motifs in Them
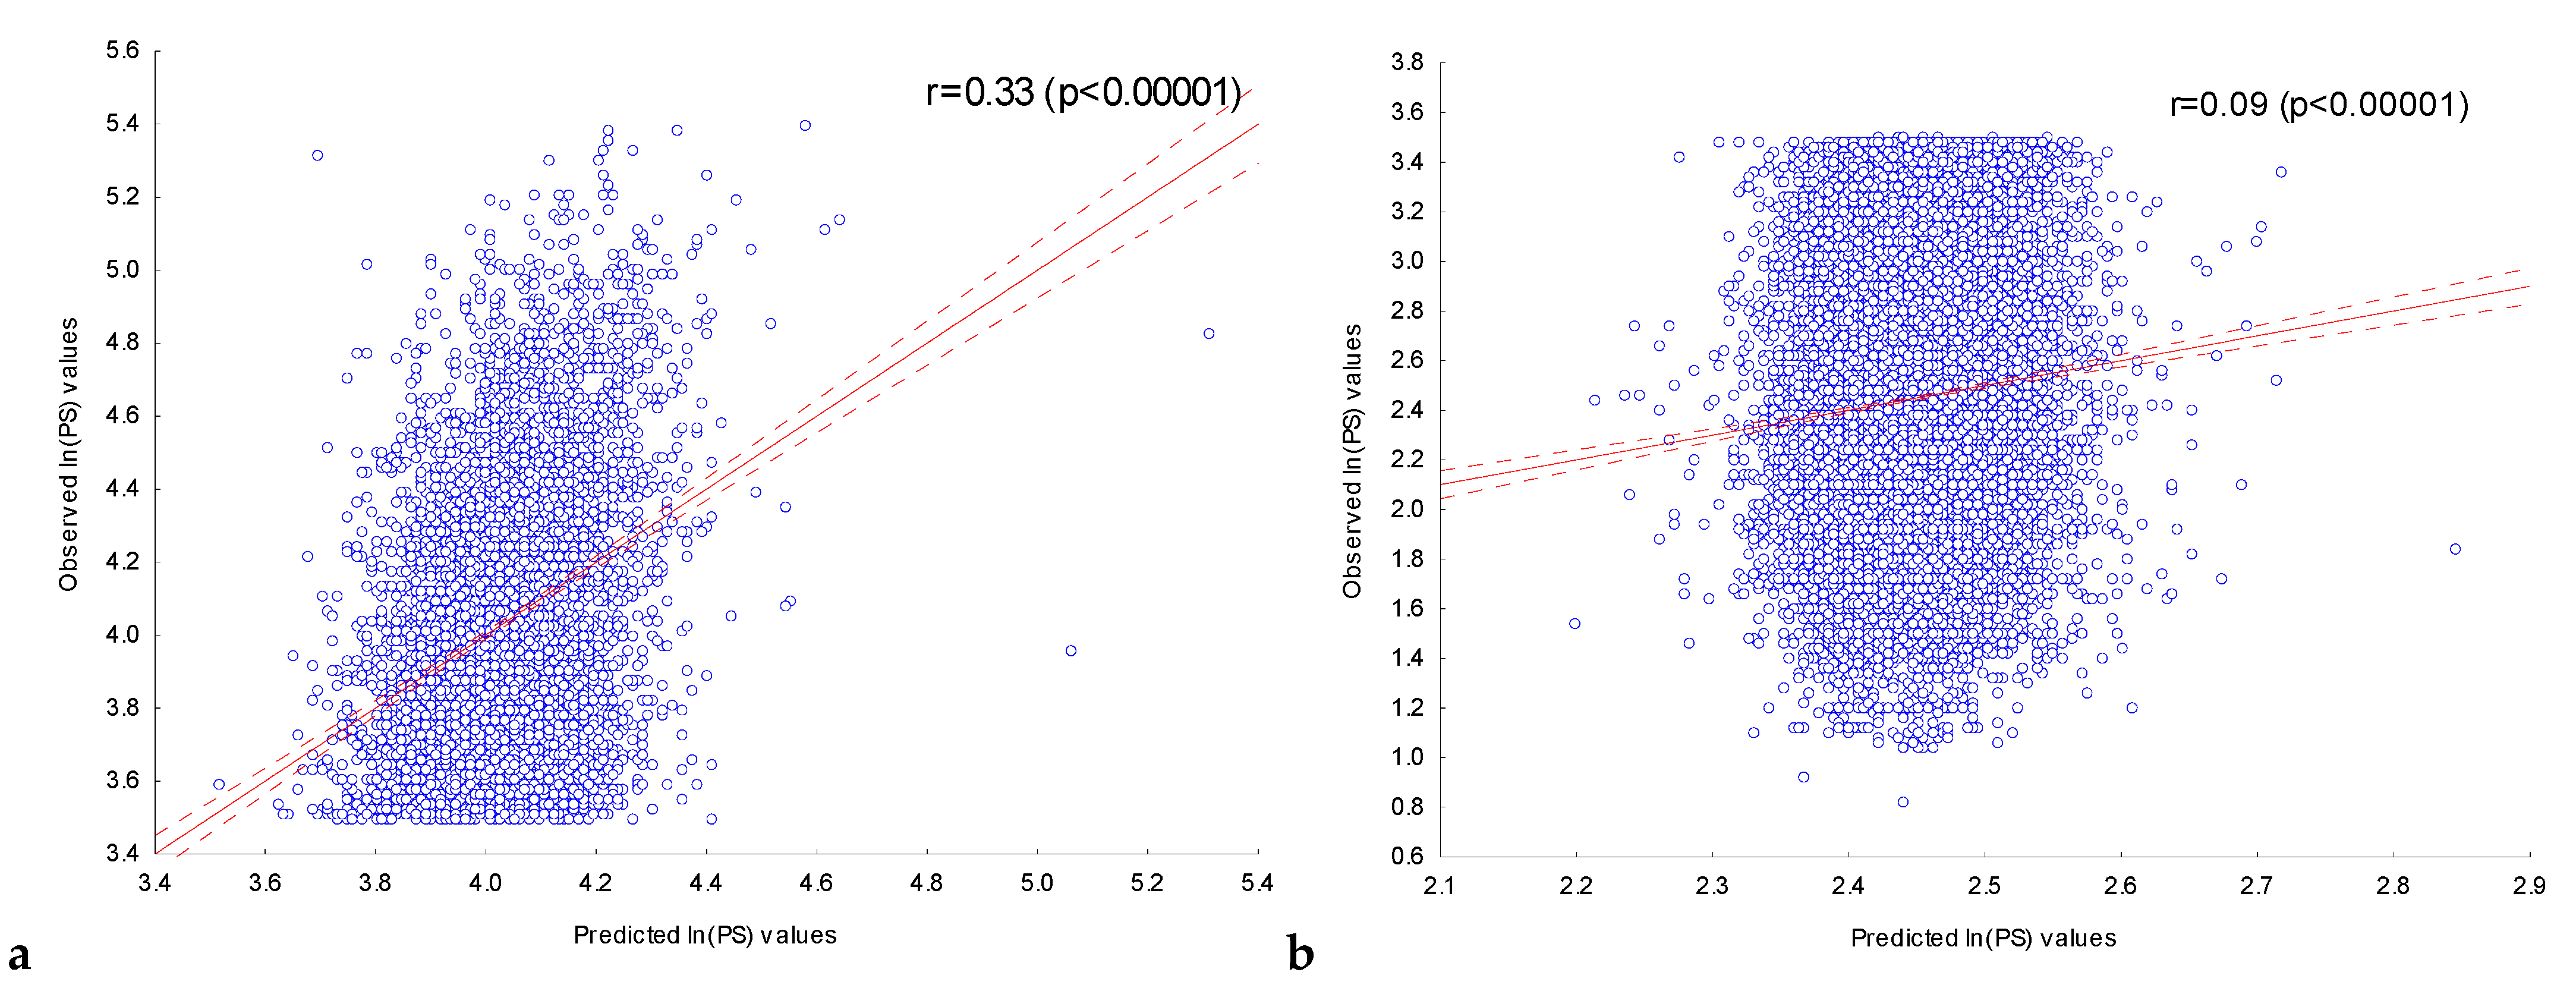
2.3.1. Assessment of the Dependence of Peak Scores on the Presence of Significant IUPAC Motifs in ChIP-Seq Peaks in the Experiment with the Transcription Factor FOXA2
2.3.2. Assessment of the Dependence of Peak Scores in Experiments with Nine Transcription Factors on the Presence of Significant IUPAC Motifs in Their ChIP-Seq Peaks
3. Discussion
3.1. Assessment of the Contribution of the Most Significant IUPAC Motifs to the Prediction of the Peak Scores
3.1.1. Assessment of the Dependence of the Peak Scores in the Experiment with the Transcription Factor FOXA2 on the Presence of Only the Most Significant IUPAC Motifs in the Peaks
3.1.2. Assessment of the Dependence of Peak Scores for Peak Sequences in the Experiment with the Transcription Factor SP1 on the Presence of Only the Most Significant IUPAC Motifs in Them
3.2. Assessment of the Correlations between the Presence of the Target IUPAC Motifs and Partner IUPAC Motifs in the Peak Sequences in the Experiment with Transcription Factor FOXA2
3.2.1. Assessment of the Correlations between the Co-Occurrences of the Most Significant (PBonf (n,N) < 10−30) IUPAC Motifs in the Peak Sequences
3.2.2. Assessment of the Dependence of the Peak Scores of Peak Sequences on the Presence of Only the Most Significant (PBonf (n,N) < 10−30) Target Motifs in Them
3.2.3. Analysis of the Correlations between the Presence of Target Motifs and the Motifs of the Partner Transcription Factors in the ChIP-Seq Peak Sequences
3.2.4. Experimental Data Confirming the Functional Relevance of the Associations Revealed between the Target and Partner Motifs
4. Methods and Materials
4.1. Brief Description of the De Novo Motif Discovery System Argo_CUDA
4.1.1. Description of the Criterion used for the Significance of IUPAC Motifs Detected by Argo_CUDA
4.1.2. Brief Description of the Argo_CUDA Algorithm
4.1.3. Parameter Values Used to Identify Significant IUPAC Motifs in ChIP-Seq Peak Sequences
- (1)
- It was located in at least f0 = 1% of the ChIP-seq peak sequences;
- (2)
- Its expected abundance for random reasons was not more than q0 = 30%. The expected abundance was calculated taking into account the 3rd order Markov level.
- (3)
- The Bonferroni-corrected binomial probability of observing the motif for random reasons was not more than p0 = 0.01.
4.2. Building a Multiple Regression Model
4.3. Construction of a Tree of Contextual Similarity of Motifs
4.4. Building a Heat Map for the Correlations of the Co-Occurrence of the Motifs
4.5. Functional Annotation of the Motifs
4.6. Shuffling in Assessing the Significance of the Correlation between the Motifs Corresponding to the Binding Sites of the Target Motifs and the Motifs Corresponding to the Binding Sites of the Partner Transcription Factors
5. Conclusions
Supplementary Materials
Author Contributions
Funding
Institutional Review Board Statement
Informed Consent Statement
Data Availability Statement
Conflicts of Interest
Abbreviations
| CE | Composite element |
| ChIP-seq | Chromatin immunoprecipitation followed by sequencing |
| CRM | Cis-regulatory module |
| DNA | Deoxyribonucleic acid |
| GPU | Graphics processing unit |
| HMM | Hidden Markov model |
| PS | Peak score |
| PWM | Position–weight matrix |
| TF | Transcription factor |
| TFBS | Transcription factor binding site |
| TFFM | Transcription factor flexible model |
References
- Weltzien, F.A.; Hildahl, J.; Hodne, K.; Okubo, K.; Haug, T.M. Embryonic development of gonadotrope cells and gonadotropic hormones—Lessons from model fish. Mol. Cell. Endocrinol. 2014, 385, 18–27. [Google Scholar] [CrossRef]
- Wallace, R.M.; Pohler, K.G.; Smith, M.F.; Green, J.A. Placental PAGs: Gene origins, expression patterns, and use as markers of pregnancy. Reproduction 2015, 149, R115–R126. [Google Scholar] [CrossRef]
- Voss, T.C.; Hager, G.L. Dynamic regulation of transcriptional states by chromatin and transcription factors. Nat. Rev. Genet. 2014, 15, 69–81. [Google Scholar] [CrossRef]
- Shen, W.K.; Chen, S.Y.; Gan, Z.Q.; Zhang, Y.Z.; Yue, T.; Chen, M.M.; Xue, Y.; Hu, H.; Guo, A.Y. AnimalTFDB 4.0: A comprehensive animal transcription factor database updated with variation and expression annotations. Nucleic Acids Res. 2023, 51, D39–D45. [Google Scholar] [CrossRef]
- Kadonaga, J.T. Eukaryotic transcription: An interlaced network of transcription factors and chromatin-modifying machines. Cell 1998, 92, 307–313. [Google Scholar] [CrossRef] [PubMed]
- Cheng, C.; Alexander, R.; Min, R.; Leng, J.; Yip, K.Y.; Rozowsky, J.; Yan, K.K.; Dong, X.; Djebali, S.; Ruan, Y.; et al. Understanding transcriptional regulation by integrative analysis of transcription factor binding data. Genome Res. 2012, 22, 1658–1667. [Google Scholar] [CrossRef]
- Bailey, T.; Krajewski, P.; Ladunga, I.; Lefebvre, C.; Li, Q.; Liu, T.; Madrigal, P.; Taslim, C.; Zhang, J. Practical guidelines for the comprehensive analysis of ChIP-seq data. PLoS Comput. Biol. 2013, 9, e1003326. [Google Scholar] [CrossRef] [PubMed]
- Collas, P. The current state of chromatin immunoprecipitation. Mol. Biotechnol. 2010, 45, 87–100. [Google Scholar] [CrossRef] [PubMed]
- Johnson, D.S.; Mortazavi, A.; Myers, R.M.; Wold, B. Genome-wide mapping of in vivo protein-DNA interactions. Science 2007, 316, 1497–1502. [Google Scholar] [CrossRef]
- Park, P.J. ChIP-seq: Advantages and challenges of a maturing technology. Nat. Rev. Genet. 2009, 10, 669–680. [Google Scholar] [CrossRef]
- Jakobsen, J.S.; Waage, J.; Rapin, N.; Bisgaard, H.C.; Larsen, F.S.; Porse, B.T. Temporal mapping of CEBPA and CEBPB binding during liver regeneration reveals dynamic occupancy and specific regulatory codes for homeostatic and cell cycle gene batteries. Genome Res. 2013, 23, 592–603. [Google Scholar] [CrossRef] [PubMed]
- Eichenfield, D.Z.; Troutman, T.D.; Link, V.M.; Lam, M.T.; Cho, H.; Gosselin, D.; Spann, N.J.; Lesch, H.P.; Tao, J.; Muto, J.; et al. Tissue damage drives co-localization of NF-κB, Smad3, and Nrf2 to direct Rev-erb sensitive wound repair in mouse macrophages. eLife 2016, 5, e13024. [Google Scholar] [CrossRef] [PubMed]
- Gilmour, J.; Assi, S.A.; Jaegle, U.; Kulu, D.; van de Werken, H.; Clarke, D.; Westhead, D.R.; Philipsen, S.; Bonifer, C. A crucial role for the ubiquitously expressed transcription factor Sp1 at early stages of hematopoietic specification. Development 2014, 141, 2391–2401. [Google Scholar] [CrossRef]
- Oldfield, A.J.; Yang, P.; Conway, A.E.; Cinghu, S.; Freudenberg, J.M.; Yellaboina, S.; Jothi, R. Histone-fold domain protein NF-Y promotes chromatin accessibility for cell type-specific master transcription factors. Mol. Cell 2014, 55, 708–722. [Google Scholar] [CrossRef]
- Sebastian, S.; Faralli, H.; Yao, Z.; Rakopoulos, P.; Palii, C.; Cao, Y.; Singh, K.; Liu, Q.C.; Chu, A.; Aziz, A.; et al. Tissue-specific splicing of a ubiquitously expressed transcription factor is essential for muscle differentiation. Genes Dev. 2013, 27, 1247–1259. [Google Scholar] [CrossRef]
- Wei, H.; Cheng, Y.; Sun, Y.; Zhang, X.; He, H.; Liu, J. Genome-Wide Identification of the ARF Gene Family and ARF3 Target Genes Regulating Ovary Initiation in Hazel via ChIP Sequencing. Front. Plant Sci. 2021, 12, 715820. [Google Scholar] [CrossRef]
- Barrett, T.; Wilhite, S.E.; Ledoux, P.; Evangelista, C.; Kim, I.F.; Tomashevsky, M.; Marshall, K.A.; Phillippy, K.H.; Sherman, P.M.; Holko, M.; et al. NCBI GEO: Archive for functional genomics data sets–update. Nucleic Acids Res. 2013, 41, D991–D995. [Google Scholar] [CrossRef]
- Parkinson, H.; Kapushesky, M.; Shojatalab, M.; Abeygunawardena, N.; Coulson, R.; Farne, A.; Holloway, E.; Kolesnykov, N.; Lilja, P.; Lukk, M.; et al. ArrayExpress—A public database of microarray experiments and gene expression profiles. Nucleic Acids Res. 2007, 35, D747–D750. [Google Scholar] [CrossRef]
- Burgin, J.; Ahamed, A.; Cummins, C.; Devraj, R.; Gueye, K.; Gupta, D.; Gupta, V.; Haseeb, M.; Ihsan, M.; Ivanov, E.; et al. The European Nucleotide Archive in 2022. Nucleic Acids Res. 2023, 51, D121–D125. [Google Scholar] [CrossRef] [PubMed]
- Kodama, Y.; Shumway, M.; Leinonen, R. International Nucleotide Sequence Database Collaboration The Sequence Read Archive: Explosive growth of sequencing data. Nucleic Acids Res. 2012, 40, D54–D56. [Google Scholar] [CrossRef]
- Nakato, R.; Shirahige, K. Recent advances in ChIP-seq analysis: From quality management to whole-genome annotation. Brief. Bioinform. 2017, 18, 279–290. [Google Scholar] [CrossRef] [PubMed]
- Suryatenggara, J.; Yong, K.J.; Tenen, D.E.; Tenen, D.G.; Bassal, M.A. ChIP-AP: An integrated analysis pipeline for unbiased ChIP-seq analysis. Brief. Bioinform. 2022, 23, bbab537. [Google Scholar] [CrossRef] [PubMed]
- Jeon, H.; Lee, H.; Kang, B.; Jang, I.; Roh, T.Y. Comparative analysis of commonly used peak calling programs for ChIP-Seq analysis. Genom. Inform. 2020, 18, e42. [Google Scholar] [CrossRef]
- Sánchez-Castillo, M.; Ruau, D.; Wilkinson, A.C.; Ng, F.S.; Hannah, R.; Diamanti, E.; Lombard, P.; Wilson, N.K.; Gottgens, B. CODEX: A next-generation sequencing experiment database for the haematopoietic and embryonic stem cell communities. Nucleic Acids Res. 2015, 43, D1117–D1123. [Google Scholar] [CrossRef]
- Chacon, D.; Beck, D.; Perera, D.; Wong, J.W.; Pimanda, J.E. BloodChIP: A database of comparative genome-wide transcription factor binding profiles in human blood cells. Nucleic Acids Res. 2014, 42, D172–D177. [Google Scholar] [CrossRef]
- Chen, L.; Wu, G.; Ji, H. hmChIP: A database and web server for exploring publicly available human and mouse ChIP-seq and ChIP-chip data. Bioinformatics 2011, 27, 1447–1448. [Google Scholar] [CrossRef]
- Zheng, R.; Wan, C.; Mei, S.; Qin, Q.; Wu, Q.; Sun, H.; Chen, C.H.; Brown, M.; Zhang, X.; Meyer, C.A.; et al. Cistrome Data Browser: Expanded datasets and new tools for gene regulatory analysis. Nucleic Acids Res. 2019, 47, D729–D735. [Google Scholar] [CrossRef]
- Kolmykov, S.; Yevshin, I.; Kulyashov, M.; Sharipov, R.; Kondrakhin, Y.; Makeev, V.J.; Kulakovskiy, I.V.; Kel, A.; Kolpakov, F. GTRD: An integrated view of transcription regulation. Nucleic Acids Res. 2021, 49, D104–D111. [Google Scholar] [CrossRef]
- Zou, Z.; Ohta, T.; Miura, F.; Oki, S. ChIP-Atlas 2021 update: A data-mining suite for exploring epigenomic landscapes by fully integrating ChIP-seq, ATAC-seq and Bisulfite-seq data. Nucleic Acids Res. 2022, 50, W175–W182. [Google Scholar] [CrossRef] [PubMed]
- Chen, D.; Jiang, S.; Ma, X.; Li, F. TFBSbank: A platform to dissect the big data of protein-DNA interaction in human and model species. Nucleic Acids Res. 2017, 45, D151–D157. [Google Scholar] [CrossRef]
- Pratt, H.E.; Andrews, G.R.; Phalke, N.; Purcaro, M.J.; van der Velde, A.; Moore, J.E.; Weng, Z. Factorbook: An updated catalog of transcription factor motifs and candidate regulatory motif sites. Nucleic Acids Res. 2022, 50, D141–D149. [Google Scholar] [CrossRef]
- Kaboord, B.; Perr, M. Isolation of proteins and protein complexes by immunoprecipitation. Methods Mol. Biol. 2008, 424, 349–364. [Google Scholar] [CrossRef]
- Kulakovskiy, I.V.; Vorontsov, I.E.; Yevshin, I.S.; Sharipov, R.N.; Fedorova, A.D.; Rumynskiy, E.I.; Medvedeva, Y.A.; Magana-Mora, A.; Bajic, V.B.; Papatsenko, D.A.; et al. HOCOMOCO: Towards a complete collection of transcription factor binding models for human and mouse via large-scale ChIP-Seq analysis. Nucleic Acids Res. 2018, 46, D252–D259. [Google Scholar] [CrossRef] [PubMed]
- Castro-Mondragon, J.A.; Riudavets-Puig, R.; Rauluseviciute, I.; Lemma, R.B.; Turchi, L.; Blanc-Mathieu, R.; Lucas, J.; Boddie, P.; Khan, A.; Manosalva Pérez, N.; et al. JASPAR 2022: The 9th release of the open-access database of transcription factor binding profiles. Nucleic Acids Res. 2022, 50, D165–D173. [Google Scholar] [CrossRef] [PubMed]
- Wingender, E. The TRANSFAC project as an example of framework technology that supports the analysis of genomic regulation. Brief. Bioinform. 2008, 9, 326–332. [Google Scholar] [CrossRef] [PubMed]
- Heinz, S.; Benner, C.; Spann, N.; Bertolino, E.; Lin, Y.C.; Laslo, P.; Cheng, J.X.; Murre, C.; Singh, H.; Glass, C.K. Simple combinations of lineage-determining transcription factors prime cis-regulatory elements required for macrophage and B cell identities. Mol. Cell 2010, 38, 576–589. [Google Scholar] [CrossRef] [PubMed]
- Kel, A.E.; Gössling, E.; Reuter, I.; Cheremushkin, E.; Kel-Margoulis, O.V.; Wingender, E. MATCH: A tool for searching transcription factor binding sites in DNA sequences. Nucleic Acids Res. 2003, 31, 3576–3579. [Google Scholar] [CrossRef]
- Bailey, T.L.; Boden, M.; Buske, F.A.; Frith, M.; Grant, C.E.; Clementi, L.; Ren, J.; Li, W.W.; Noble, W.S. MEME SUITE: Tools for motif discovery and searching. Nucleic Acids Res. 2009, 37, W202–W208. [Google Scholar] [CrossRef]
- Benos, P.V.; Bulyk, M.L.; Stormo, G.D. Additivity in protein-DNA interactions: How good an approximation is it? Nucleic Acids Res. 2002, 30, 4442–4451. [Google Scholar] [CrossRef]
- Keilwagen, J.; Grau, J. Varying levels of complexity in transcription factor binding motifs. Nucleic Acids Res. 2015, 43, e119. [Google Scholar] [CrossRef] [PubMed]
- Kulakovskiy, I.; Levitsky, V.; Oshchepkov, D.; Bryzgalov, L.; Vorontsov, I.; Makeev, V. From binding motifs in ChIP-Seq data to improved models of transcription factor binding sites. J. Bioinform. Comput. Biol. 2013, 11, 1340004. [Google Scholar] [CrossRef] [PubMed]
- Xu, D.; Liu, H.J.; Wang, Y.F. BSS-HMM3s: An improved HMM method for identifying transcription factor binding sites. DNA Seq. J. DNA Seq. Mapp. 2005, 16, 403–411. [Google Scholar] [CrossRef]
- Wu, J.; Xie, J. Hidden Markov model and its applications in motif findings. Methods Mol. Biol. 2010, 620, 405–416. [Google Scholar] [CrossRef]
- Mathelier, A.; Wasserman, W.W. The next generation of transcription factor binding site prediction. PLoS Comput. Biol. 2013, 9, e1003214. [Google Scholar] [CrossRef] [PubMed]
- Machanick, P.; Bailey, T.L. MEME-ChIP: Motif analysis of large DNA datasets. Bioinformatics 2011, 27, 1696–1697. [Google Scholar] [CrossRef]
- Bailey, T.L. DREME: Motif discovery in transcription factor ChIP-seq data. Bioinformatics 2011, 27, 1653–1659. [Google Scholar] [CrossRef]
- Jia, C.; Carson, M.B.; Wang, Y.; Lin, Y.; Lu, H. A new exhaustive method and strategy for finding motifs in ChIP-enriched regions. PLoS ONE 2014, 9, e86044. [Google Scholar] [CrossRef]
- Pavesi, G.; Mereghetti, P.; Mauri, G.; Pesole, G. Weeder Web: Discovery of transcription factor binding sites in a set of sequences from co-regulated genes. Nucleic Acids Res. 2004, 32, W199–W203. [Google Scholar] [CrossRef] [PubMed]
- Sharov, A.A.; Ko, M.S. Exhaustive search for over-represented DNA sequence motifs with CisFinder. DNA Res. 2009, 16, 261–273. [Google Scholar] [CrossRef]
- Zhang, Y.; Wang, P.; Yan, M. An Entropy-Based Position Projection Algorithm for Motif Discovery. BioMed Res. Int. 2016, 2016, 9127474. [Google Scholar] [CrossRef]
- Bailey, T.L.; Williams, N.; Misleh, C.; Li, W.W. MEME: Discovering and analyzing DNA and protein sequence motifs. Nucleic Acids Res. 2006, 34, W369–W373. [Google Scholar] [CrossRef] [PubMed]
- Ma, X.; Kulkarni, A.; Zhang, Z.; Xuan, Z.; Serfling, R.; Zhang, M.Q. A highly efficient and effective motif discovery method for ChIP-seq/ChIP-chip data using positional information. Nucleic Acids Res. 2012, 40, e50. [Google Scholar] [CrossRef]
- Pavesi, G.; Mauri, G.; Pesole, G. An algorithm for finding signals of unknown length in DNA sequences. Bioinformatics 2001, 17, S207–S214. [Google Scholar] [CrossRef] [PubMed]
- Sinha, S.; Tompa, M. YMF: A program for discovery of novel transcription factor binding sites by statistical overrepresentation. Nucleic Acids Res. 2003, 31, 3586–3588. [Google Scholar] [CrossRef] [PubMed]
- Thomas-Chollier, M.; Herrmann, C.; Defrance, M.; Sand, O.; Thieffry, D.; van Helden, J. RSAT peak-motifs: Motif analysis in full-size ChIP-seq datasets. Nucleic Acids Res. 2012, 40, e31. [Google Scholar] [CrossRef]
- van Helden, J.; André, B.; Collado-Vides, J. Extracting regulatory sites from the upstream region of yeast genes by computational analysis of oligonucleotide frequencies. J. Mol. Biol. 1998, 281, 827–842. [Google Scholar] [CrossRef] [PubMed]
- Huo, H.; Zhao, Z.; Stojkovic, V.; Liu, L. Optimizing genetic algorithm for motif discovery. Math. Comput. Model. 2010, 52, 2011–2020. [Google Scholar] [CrossRef]
- Karaboga, D.; Aslan, S. A discrete artificial bee colony algorithm for detecting transcription factor binding sites in DNA sequences. Genet. Mol. Res. GMR 2016, 15, 1–11. [Google Scholar] [CrossRef] [PubMed]
- Alipanahi, B.; Delong, A.; Weirauch, M.T.; Frey, B.J. Predicting the sequence specificities of DNA- and RNA-binding proteins by deep learning. Nat. Biotechnol. 2015, 33, 831–838. [Google Scholar] [CrossRef]
- Wederell, E.D.; Bilenky, M.; Cullum, R.; Thiessen, N.; Dagpinar, M.; Delaney, A.; Varhol, R.; Zhao, Y.; Zeng, T.; Bernier, B.; et al. Global analysis of in vivo Foxa2-binding sites in mouse adult liver using massively parallel sequencing. Nucleic Acids Res. 2008, 36, 4549–4564. [Google Scholar] [CrossRef]
- Worsley Hunt, R.; Mathelier, A.; Del Peso, L.; Wasserman, W.W. Improving analysis of transcription factor binding sites within ChIP-Seq data based on topological motif enrichment. BMC Genom. 2014, 15, 472. [Google Scholar] [CrossRef] [PubMed]
- Gheorghe, M.; Sandve, G.K.; Khan, A.; Chèneby, J.; Ballester, B.; Mathelier, A. A map of direct TF-DNA interactions in the human genome. Nucleic Acids Res. 2019, 47, e21. [Google Scholar] [CrossRef]
- Rasskazov, D.; Chadaeva, I.; Sharypova, E.; Zolotareva, K.; Khandaev, B.; Ponomarenko, P.; Podkolodnyy, N.; Tverdokhleb, N.; Vishnevsky, O.; Bogomolov, A.; et al. Plant_SNP_TATA_Z-Tester: A Web Service That Unequivocally Estimates the Impact of Proximal Promoter Mutations on Plant Gene Expression. Int. J. Mol. Sci. 2022, 23, 8684. [Google Scholar] [CrossRef] [PubMed]
- Abe, N.; Dror, I.; Yang, L.; Slattery, M.; Zhou, T.; Bussemaker, H.J.; Rohs, R.; Mann, R.S. Deconvolving the recognition of DNA shape from sequence. Cell 2015, 161, 307–318. [Google Scholar] [CrossRef] [PubMed]
- Yang, L.; Orenstein, Y.; Jolma, A.; Yin, Y.; Taipale, J.; Shamir, R.; Rohs, R. Transcription factor family-specific DNA shape readout revealed by quantitative specificity models. Mol. Syst. Biol. 2017, 13, 910. [Google Scholar] [CrossRef] [PubMed]
- Melikhova, A.V.; Anashkina, A.A.; Il’icheva, I.A. Evolutionary Invariant of the Structure of DNA Double Helix in RNAP II Core Promoters. Int. J. Mol. Sci. 2022, 23, 10873. [Google Scholar] [CrossRef]
- Azeem, M.; Jamil, M.K.; Shang, Y. Notes on the Localization of Generalized Hexagonal Cellular Networks. Mathematics 2023, 11, 844. [Google Scholar] [CrossRef]
- Raza, Z.; Akhter, S.; Shang, Y. Expected value of first Zagreb connection index in random cyclooctatetraene chain, random polyphenyls chain, and random chain network. Front. Chem. 2023, 10, 1067874. [Google Scholar] [CrossRef]
- Kim, J.B.; Spotts, G.D.; Halvorsen, Y.D.; Shih, H.M.; Ellenberger, T.; Towle, H.C.; Spiegelman, B.M. Dual DNA binding specificity of ADD1/SREBP1 controlled by a single amino acid in the basic helix-loop-helix domain. Mol. Cell Biol. 1995, 15, 2582–2588. [Google Scholar] [CrossRef] [PubMed]
- Kouzarides, T. Acetylation: A regulatory modification to rival phosphorylation? EMBO J. 2000, 19, 1176–1179. [Google Scholar] [CrossRef]
- Kemper, J.K.; Xiao, Z.; Ponugoti, B.; Miao, J.; Fang, S.; Kanamaluru, D.; Tsang, S.; Wu, S.Y.; Chiang, C.M.; Veenstra, T.D. FXR acetylation is normally dynamically regulated by p300 and SIRT1 but constitutively elevated in metabolic disease states. Cell Metab 2009, 10, 392–404. [Google Scholar] [CrossRef]
- Vuzman, D.; Hoffman, Y.; Levy, Y. Modulating protein-DNA interactions by post-translational modifications at disordered regions. Pac. Symp. Biocomput. 2012, 2012, 188–199. [Google Scholar]
- Ithuralde, R.E.; Turjanski, A.G. Phosphorylation Regulates the Bound Structure of an Intrinsically Disordered Protein: The p53-TAZ2 Case. PLoS ONE 2016, 11, e0144284. [Google Scholar] [CrossRef]
- Näär, A.M.; Beaurang, P.A.; Robinson, K.M.; Oliner, J.D.; Avizonis, D.; Scheek, S.; Zwicker, J.; Kadonaga, J.T.; Tjian, R. Chromatin, TAFs, and a novel multiprotein coactivator are required for synergistic activation by Sp1 and SREBP-1a in vitro. Genes Dev. 1998, 12, 3020–3031. [Google Scholar] [CrossRef] [PubMed]
- Karczewski, K.J.; Tatonetti, N.P.; Landt, S.G.; Yang, X.; Slifer, T.; Altman, R.B.; Snyder, M. Cooperative transcription factor associations discovered using regulatory variation. Proc. Natl. Acad. Sci. USA 2011, 108, 13353–13358. [Google Scholar] [CrossRef]
- Agalioti, T.; Lomvardas, S.; Parekh, B.; Yie, J.; Maniatis, T.; Thanos, D. Ordered Recruitment of Chromatin Modifying and General Transcription Factors to the IFN-b Promoter. Cell 2000, 103, 667–678. [Google Scholar] [CrossRef] [PubMed]
- Koli, S.; Mukherjee, A.; Reddy, K.V.R. Retinoic acid triggers c-kit gene expression in spermatogonial stem cells through an enhanceosome constituted between transcription factor binding sites for retinoic acid response element (RARE), spleen focus forming virus proviral integration oncogene (SPFI1) (PU.1) and E26 transformation-specific (ETS). Reprod. Fertil. Dev. 2017, 29, 521–543. [Google Scholar] [CrossRef] [PubMed]
- Dubois-Chevalier, J.; Mazrooei, P.; Lupien, M.; Staels, B.; Lefebvre, P.; Eeckhoute, J. Organizing combinatorial transcription factor recruitment at cis-regulatory modules. Transcription 2018, 9, 233–239. [Google Scholar] [CrossRef]
- Kel-Margoulis, O.V.; Romashchenko, A.G.; Kolchanov, N.A.; Wingender, E.; Kel, A.E. COMPEL: A database on composite regulatory elements providing combinatorial transcriptional regulation. Nucleic Acids Res. 2000, 28, 311–315. [Google Scholar] [CrossRef]
- Matys, V.; Kel-Margoulis, O.V.; Fricke, E.; Liebich, I.; Land, S.; Barre-Dirrie, A.; Reuter, I.; Chekmenev, D.; Krull, M.; Hornischer, K.; et al. TRANSFAC and its module TRANSCompel: Transcriptional gene regulation in eukaryotes. Nucleic Acids Res. 2006, 34, D108–D110. [Google Scholar] [CrossRef]
- Kel-Margoulis, O.V.; Kel, A.E.; Reuter, I.; Deineko, I.V.; Wingender, E. TRANSCompel: A database on composite regulatory elements in eukaryotic genes. Nucleic Acids Res. 2002, 30, 332–334. [Google Scholar] [CrossRef]
- Merika, M.; Orkin, S.H. Functional synergy and physical interactions of the erythroid transcription factor GATA-1 with the Krüppel family proteins Sp1 and EKLF. Mol. Cell Biol. 1995, 15, 2437–2447. [Google Scholar] [CrossRef] [PubMed]
- Agarwal, P.; Verzi, M.P.; Nguyen, T.; Hu, J.; Ehlers, M.L.; McCulley, D.J.; Xu, S.M.; Dodou, E.; Anderson, J.P.; Wei, M.L.; et al. The MADS box transcription factor MEF2C regulates melanocyte development and is a direct transcriptional target and partner of SOX10. Development 2011, 138, 2555–2565. [Google Scholar] [CrossRef][Green Version]
- Bieli, D.; Kanca, O.; Requena, D.; Hamaratoglu, F.; Gohl, D.; Schedl, P.; Affolter, M.; Slattery, M.; Müller, M.; Estella, C. Establishment of a Developmental Compartment Requires Interactions between Three Synergistic Cis-regulatory Modules. PLoS Genet. 2015, 11, e1005376. [Google Scholar] [CrossRef] [PubMed]
- Santolini, M.; Sakakibara, I.; Gauthier, M.; Ribas-Aulinas, F.; Takahashi, H.; Sawasaki, T.; Mouly, V.; Concordet, J.P.; Defossez, P.A.; Hakim, V.; et al. MyoD reprogramming requires Six1 and Six4 homeoproteins: Genome-wide cis-regulatory module analysis. Nucleic Acids Res. 2016, 44, 8621–8640. [Google Scholar] [CrossRef] [PubMed]
- Nicolás, M.; Noé, V.; Ciudad, C.J. Transcriptional regulation of the human Sp1 gene promoter by the specificity protein (Sp) family members nuclear factor Y (NF-Y) and E2F. Biochem. J. 2003, 371, 265–275. [Google Scholar] [CrossRef]
- Kerschner, J.L.; Gosalia, N.; Leir, S.H.; Harris, A. Chromatin remodeling mediated by the FOXA1/A2 transcription factors activates CFTR expression in intestinal epithelial cells. Epigenetics 2014, 9, 557–565. [Google Scholar] [CrossRef]
- Swift, M.L.; Beishline, K.; Azizkhan-Clifford, J. Sp1-dependent recruitment of the histone acetylase p300 to DSBs facilitates chromatin remodeling and recruitment of the NHEJ repair factor Ku70. DNA Repair 2021, 105, 103171. [Google Scholar] [CrossRef]
- Wang, L.; Wang, E.; Prado Balcazar, J.; Wu, Z.; Xiang, K.; Wang, Y.; Huang, Q.; Negrete, M.; Chen, K.Y.; Li, W.; et al. Chromatin Remodeling of Colorectal Cancer Liver Metastasis is Mediated by an HGF-PU.1-DPP4 Axis. Adv. Sci. 2021, 8, e2004673. [Google Scholar] [CrossRef]
- Lee, J.S.; Galvin, K.M.; Shi, Y. Evidence for physical interaction between the zinc-finger transcription factors YY1 and Sp1. Proc. Natl. Acad. Sci. USA 1993, 90, 6145–6149. [Google Scholar] [CrossRef]
- Millevoi, S.; Thion, L.; Joseph, G.; Vossen, C.; Ghisolfi-Nieto, L.; Erard, M. Atypical binding of the neuronal POU protein N-Oct3 to noncanonical DNA targets. Implications for heterodimerization with HNF-3 beta. Eur. J. Biochem. 2001, 268, 781–791. [Google Scholar] [CrossRef] [PubMed]
- Levitsky, V.; Oshchepkov, D.; Zemlyanskaya, E.; Merkulova, T. Asymmetric Conservation within Pairs of Co-Occurred Motifs Mediates Weak Direct Binding of Transcription Factors in ChIP-Seq Data. Int. J. Mol. Sci. 2020, 21, 6023. [Google Scholar] [CrossRef]
- Whitington, T.; Frith, M.C.; Johnson, J.; Bailey, T.L. Inferring transcription factor complexes from ChIP-seq data. Nucleic Acids Res. 2011, 39, e98. [Google Scholar] [CrossRef] [PubMed]
- Kazemian, M.; Pham, H.; Wolfe, S.A.; Brodsky, M.H.; Sinha, S. Widespread evidence of cooperative DNA binding by transcription factors in Drosophila development. Nucleic Acids Res. 2013, 41, 8237–8252. [Google Scholar] [CrossRef] [PubMed]
- Deyneko, I.V.; Kel, A.E.; Kel-Margoulis, O.V.; Deineko, E.V.; Wingender, E.; Weiss, S. MatrixCatch—A novel tool for the recognition of composite regulatory elements in promoters. BMC Bioinform. 2013, 14, 241. [Google Scholar] [CrossRef] [PubMed]
- Giannopoulou, E.; Elemento, O. Systematic Discovery of Chromatin-Bound Protein Complexes from ChIP-seq Datasets. Methods Mol. Biol. 2017, 1507, 43–58. [Google Scholar] [CrossRef]
- Guo, Y.; Mahony, S.; Gifford, D.K. High resolution genome wide binding event finding and motif discovery reveals transcription factor spatial binding constraints. PLoS Comput. Biol. 2012, 8, e1002638. [Google Scholar] [CrossRef] [PubMed]
- Jankowski, A.; Prabhakar, S.; Tiuryn, J. TACO: A general-purpose tool for predicting cell-type-specific transcription factor dimers. BMC Genom. 2014, 15, 208. [Google Scholar] [CrossRef]
- Wingender, E.; Schoeps, T.; Haubrock, M.; Krull, M.; Dönitz, J. TFClass: Expanding the classification of human transcription factors to their mammalian orthologs. Nucleic Acids Res. 2018, 46, D343–D347. [Google Scholar] [CrossRef]
- Vishnevsky, O.V.; Bocharnikov, A.V.; Kolchanov, N.A. Argo_CUDA: Exhaustive GPU based approach for motif discovery in large DNA datasets. J. Bioinform. Comput. Biol. 2018, 16, 1740012. [Google Scholar] [CrossRef]
- Cornish-Bowden, A. Nomenclature for incompletely specified bases in nucleic acid sequences: Recommendations 1984. Nucleic Acids Res. 1985, 13, 3021–3030. [Google Scholar] [CrossRef] [PubMed]
- Goldstein, I.; Baek, S.; Presman, D.M.; Paakinaho, V.; Swinstead, E.E.; Hager, G.L. Transcription factor assisted loading and enhancer dynamics dictate the hepatic fasting response. Genome Res. 2017, 27, 427–439. [Google Scholar] [CrossRef]
- Yue, F.; Cheng, Y.; Breschi, A.; Vierstra, J.; Wu, W.; Ryba, T.; Sandstrom, R.; Ma, Z.; Davis, C.; Pope, B.D.; et al. A comparative encyclopedia of DNA elements in the mouse genome. Nature 2014, 515, 355–364. [Google Scholar] [CrossRef] [PubMed]
- MacIsaac, K.D.; Lo, K.A.; Gordon, W.; Motola, S.; Mazor, T.; Fraenkel, E. A quantitative model of transcriptional regulation reveals the influence of binding location on expression. PLoS Comput. Biol. 2010, 6, e1000773. [Google Scholar] [CrossRef] [PubMed]
- Kalvisa, A.; Siersbæk, M.S.; Præstholm, S.M.; Christensen, L.J.L.; Nielsen, R.; Stohr, O.; Vettorazzi, S.; Tuckermann, J.; White, M.; Mandrup, S.; et al. Insulin signaling and reduced glucocorticoid receptor activity attenuate postprandial gene expression in liver. PLoS Biol. 2018, 16, e2006249. [Google Scholar] [CrossRef] [PubMed]
- Zhang, Y.; Laz, E.V.; Waxman, D.J. Dynamic, sex-differential STAT5 and BCL6 binding to sex-biased, growth hormone-regulated genes in adult mouse liver. Mol. Cell. Biol. 2012, 32, 880–896. [Google Scholar] [CrossRef] [PubMed]
- Tsukada, J.; Yoshida, Y.; Kominato, Y.; Auron, P.E. The CCAAT/enhancer (C/EBP) family of basic-leucine zipper (bZIP) transcription factors is a multifaceted highly-regulated system for gene regulation. Cytokine 2011, 54, 6–19. [Google Scholar] [CrossRef] [PubMed]
- Chen, B.; Lu, Y.; Chen, Y.; Cheng, J. The role of Nrf2 in oxidative stress-induced endothelial injuries. J. Endocrinol 2015, 225, R83–R99. [Google Scholar] [CrossRef]
- Kopacz, A.; Kloska, D.; Klimczyk, D.; Kopec, M.; Jozkowicz, A.; Piechota-Polanczyk, A. Nrf2 Transcriptional Activity Governs Intestine Development. Int. J. Mol. Sci. 2022, 23, 6175. [Google Scholar] [CrossRef]
- Barbarani, G.; Fugazza, C.; Strouboulis, J.; Ronchi, A.E. The Pleiotropic Effects of GATA1 and KLF1 in Physiological Erythropoiesis and in Dyserythropoietic Disorders. Front. Physiol. 2019, 10, 91. [Google Scholar] [CrossRef]
- Tachmatzidi, E.C.; Galanopoulou, O.; Talianidis, I. Transcription Control of Liver Development. Cells 2021, 10, 2026. [Google Scholar] [CrossRef]
- Ferdous, A.; Hill, J.A. FoxO1 in embryonic development. Transcription 2012, 3, 221–225. [Google Scholar] [CrossRef] [PubMed]
- Remadevi, V.; Muraleedharan, P.; Sreeja, S. FOXO1: A pivotal pioneer factor in oral squamous cell carcinoma. Am. J. Cancer Res. 2021, 11, 4700–4710. [Google Scholar] [PubMed]
- Basile, V.; Baruffaldi, F.; Dolfini, D.; Belluti, S.; Benatti, P.; Ricci, L.; Artusi, V.; Tagliafico, E.; Mantovani, R.; Molinari, S.; et al. NF-YA splice variants have different roles on muscle differentiation. Biochim. Biophys. Acta 2016, 1859, 627–638. [Google Scholar] [CrossRef] [PubMed]
- Darvin, P.; Joung, Y.H.; Yang, Y.M. JAK2-STAT5B pathway and osteoblast differentiation. JAKSTAT 2013, 2, e24931. [Google Scholar] [CrossRef]
- Gao, P.; Zhang, Y.; Liu, Y.; Chen, J.; Zong, C.; Yu, C.; Cui, S.; Gao, W.; Qin, D.; Sun, W.; et al. Signal transducer and activator of transcription 5B (STAT5B) modulates adipocyte differentiation via MOF. Cell Signal 2015, 27, 2434–2443. [Google Scholar] [CrossRef] [PubMed]
- Georganta, E.M.; Tsoutsi, L.; Gaitanou, M.; Georgoussi, Z. δ-opioid receptor activation leads to neurite outgrowth and neuronal differentiation via a STAT5B-Gαi/o pathway. J. Neurochem. 2013, 127, 329–341. [Google Scholar] [CrossRef]
- Baker, W.; van den Broek, A.; Camon, E.; Hingamp, P.; Sterk, P.; Stoesser, G.; Tuli, M.A. The EMBL nucleotide sequence database. Nucleic Acids Res. 2000, 28, 19–23. [Google Scholar] [CrossRef]
- Bonferroni, C.E. Teoria statistica delle classi e calcolo delle probabilità. Pubbl. R Ist. Super. Sci. Econ. Commer. Firenze 1936, 8, 1–62. [Google Scholar]
- Cramer, H. Mathematical Methods of Statistics; Princeton University Press: Princeton, NJ, USA, 1946; p. 282. [Google Scholar]
- Babicki, S.; Arndt, D.; Marcu, A.; Liang, Y.; Grant, J.R.; Maciejewski, A.; Wishart, D.S. Heatmapper: Web-enabled heat mapping for all. Nucleic Acids Res. 2016, 44, W147–W153. [Google Scholar] [CrossRef]
- Mahony, S.; Benos, P.V. STAMP: A web tool for exploring DNA-binding motif similarities. Nucleic Acids Res. 2007, 35, W253–W258. [Google Scholar] [CrossRef] [PubMed]
- Gupta, S.; Stamatoyannopoulos, J.A.; Bailey, T.L.; Noble, W.S. Quantifying similarity between motifs. Genome Biol. 2007, 8, R24. [Google Scholar] [CrossRef] [PubMed]
- Antes, T.J.; Levy-Wilson, B. HNF-3 beta, C/EBP beta, and HNF-4 act in synergy to enhance transcription of the human apolipoprotein B gene in intestinal cells. DNA Cell Biol. 2001, 20, 67–74. [Google Scholar] [CrossRef] [PubMed]
- Wallerman, O.; Motallebipour, M.; Enroth, S.; Patra, K.; Bysani, M.S.; Komorowski, J.; Wadelius, C. Molecular interactions between HNF4a, FOXA2 and GABP identified at regulatory DNA elements through ChIP-sequencing. Nucleic Acids Res. 2009, 37, 7498–7508. [Google Scholar] [CrossRef] [PubMed]
- Alder, O.; Cullum, R.; Lee, S.; Kan, A.C.; Wei, W.; Yi, Y.; Garside, V.C.; Bilenky, M.; Griffith, M.; Morrissy, A.S.; et al. Hippo signaling influences HNF4A and FOXA2 enhancer switching during hepatocyte differentiation. Cell Rep. 2014, 9, 261–271. [Google Scholar] [CrossRef] [PubMed]
- Ceelie, H.; Spaargaren-Van Riel, C.C.; De Jong, M.; Bertina, R.M.; Vos, H.L. Functional characterization of transcription factor binding sites for HNF1-alpha, HNF3-beta (FOXA2), HNF4-alpha, Sp1 and Sp3 in the human prothrombin gene enhancer. J. Thromb. Haemost. 2003, 1, 1688–1698. [Google Scholar] [CrossRef]
- Hoffman, B.G.; Robertson, G.; Zavaglia, B.; Beach, M.; Cullum, R.; Lee, S.; Soukhatcheva, G.; Li, L.; Wederell, E.D.; Thiessen, N.; et al. Locus co-occupancy, nucleosome positioning, and H3K4me1 regulate the functionality of FOXA2-, HNF4A-, and PDX1-bound loci in islets and liver. Genome Res. 2010, 20, 1037–1051. [Google Scholar] [CrossRef]
- Kumar, S.; Stecher, G.; Li, M.; Knyaz, C.; Tamura, K. MEGA X: Molecular Evolutionary Genetics Analysis across Computing Platforms. Mol. Biol. Evol. 2018, 35, 1547–1549. [Google Scholar] [CrossRef]
- Vishnevsky, O.V.; Kolchanov, N.A. ARGO: A web system for the detection of degenerate motifs and large-scale recognition of eukaryotic promoters. Nucleic Acids Res. 2005, 33 (Suppl. S2), W417–W422. [Google Scholar] [CrossRef]


| TF 1 | ID 2 | N 3 | NL 4 | NC 5 | TF Superclass 6 | TF Family 7 | Cells Type 8 | Ref. 9 |
|---|---|---|---|---|---|---|---|---|
| CEBPA | 39908 | 33,559 | 5000 | 28,559 | 1. Basic domains | 1.1.8. CEBP-related | Mouse liver cells | [11] |
| CEBPB | 72841 | 13,374 | 5000 | 8374 | 1. Basic domains | 1.1.8. CEBP-related | Mouse liver cells | [102] |
| NFE2L2 | 70563 | 27,065 | 5000 | 22,065 | 1. Basic domains | 1.1.1. Jun-related | Mouse bone marrow-derived macrophages | [12] |
| SP1 | 47755 | 24,404 | 5000 | 19,404 | 2. Zinc-coordinating DNA-binding domains | 2.3.1. Three-zinc finger Krüppel-related | Mouse embryonic stem cells | [13] |
| GATA1 | 46419 | 7534 | 5000 | 2534 | 2. Zinc-coordinating DNA-binding domains | 2.2.1. C4-GATA-related | Mouse erythroid cells of fetal liver | [103] |
| FOXA2 | 3266 | 25,191 | 5000 | 20,191 | 3. Helix-turn-helix domains | 3.3.1. FOX | Mouse liver cells | [104] |
| FOXO1 | 92461 | 11,433 | 5000 | 6433 | 3. Helix-turn-helix domains | 3.3.1. FOX | Mouse liver cells | [105] |
| NFYA | 48618 | 5975 | 5000 | 975 | 4. Other all-alpha-helical DNA-binding domains | 4.2.1. Heteromeric CCAAT-binding | Mouse embryonic stem cells | [14] |
| MEF2D | 38097 | 34,789 | 5000 | 29,789 | 5. Alpha-Helices exposed by beta-structures | 5.1.1. Regulators of differentiation | Mouse differentiating myoblasts C2C12 | [15] |
| STAT5B | 5839 | 18,510 | 5000 | 13,510 | 6. Immunoglobulin fold | 6.2.1. STAT | Mouse liver cells | [106] |
| Transcription Factor | Maximum Significance of the Motifs, −log10(PBonf (n,N)) | Number of Motifs Identified at PBonf (n,N) < p0 = 10−2 | Number of Motifs Identified at PBonf (n,N) < p0 = 10−30 |
|---|---|---|---|
| CEBPA | 1585 | 151 | 36 |
| CEBPB | 1028 | 164 | 39 |
| NFE2L2 | 880 | 239 | 71 |
| SP1 | 520 | 243 | 80 |
| GATA1 | 932 | 168 | 31 |
| FOXA2 | 1462 | 202 | 50 |
| FOXO1 | 447 | 220 | 51 |
| NFYA | 1134 | 270 | 81 |
| MEF2D | 749 | 219 | 57 |
| STAT5B | 744 | 181 | 44 |
| Motif | Actual Abundance 1, F | Expected Abundance 2, Q | Significance 3, −log10(PBonf (n,N)) |
|---|---|---|---|
| TRTWKACH | 0.67 | 0.15 | 1462 |
| RTTKACHY | 0.54 | 0.20 | 620 |
| TMAAYANS | 0.54 | 0.26 | 395 |
| TWKACHYW | 0.55 | 0.27 | 367 |
| TTKRTYTW | 0.30 | 0.14 | 172 |
| TKAHYTWK | 0.46 | 0.27 | 157 |
| TRTTKRTY | 0.30 | 0.15 | 139 |
| RAAYHAAY | 0.31 | 0.17 | 128 |
| TTRNGHAA | 0.29 | 0.16 | 116 |
| KACDTWGN | 0.30 | 0.17 | 103 |
| TAAHYABW | 0.32 | 0.19 | 91 |
| ARMYAAGV | 0.30 | 0.18 | 81 |
| TGYGTACH | 0.09 | 0.03 | 77 |
| TRTWTGCW | 0.15 | 0.07 | 69 |
| AAAMAAAR | 0.13 | 0.06 | 60 |
| ATMMAYAN | 0.28 | 0.18 | 55 |
| WTRTTTGY | 0.19 | 0.11 | 54 |
| TCRAYADW | 0.19 | 0.11 | 52 |
| GTACRCAH | 0.06 | 0.02 | 46 |
| TTYGCTYW | 0.12 | 0.06 | 45 |
| TNGCTHWG | 0.24 | 0.16 | 40 |
| TNACYMWG | 0.30 | 0.22 | 31 |
| Training Set | Control Set | ||||||
|---|---|---|---|---|---|---|---|
| Transcription Factor | Number of Significant Motifs | Number of Sequences in the Set, N | Correlation Coefficient, r | Max ln(PS) | Number of Sequences in the Set, N | Correlation Coefficient, r | Max ln(PS) |
| CEBPA | 151 | 5000 | 0.38 | 5.29 | 28,559 | 0.11 | 3.6 |
| CEBPB | 164 | 5000 | 0.37 | 5.53 | 8374 | 0.13 | 2.74 |
| NFE2L2 | 239 | 5000 | 0.33 | 5.54 | 22,065 | 0.01 * | 3.17 |
| SP1 | 243 | 5000 | 0.57 | 5.69 | 19,404 | 0.06 | 3.5 |
| GATA1 | 168 | 5000 | 0.3 | 5.45 | 2534 | −0.03 * | 2.42 |
| FOXA2 | 202 | 5000 | 0.33 | 5.4 | 20,191 | 0.09 | 3.49 |
| FOXO1 | 220 | 5000 | 0.32 | 5.68 | 6433 | 0.08 | 2.45 |
| NFYA | 270 | 5000 | 0.53 | 5.46 | 975 | 0.07 | 1.88 |
| MEF2D | 219 | 5000 | 0.36 | 5.41 | 29,789 | 0.07 | 2.93 |
| STAT5B | 181 | 5000 | 0.32 | 5.2 | 13,510 | 0.09 | 3.1 |
| Independent Variable | Regression Coefficient | p-Value |
|---|---|---|
| TRTWKACH | 0.064945 | 0.000003 |
| RTTKACHY | 0.027893 | 0.039629 |
| TMAAYANS | 0.057817 | 0.0000001 |
| TWKACHYW | 0.027454 | 0.006242 |
| TTRNGHAA | 0.024021 | 0.031108 |
| KACDTWGN | 0.028459 | 0.011256 |
| TAAHYABW | −0.027147 | 0.006997 |
| CCRCCCCB | −0.081117 | 0.000936 |
| CGBTCGVN | 0.118823 | 0.006146 |
| TTSGYWRN | 0.018182 | 0.040455 |
| AACAWGVV | 0.032637 | 0.004226 |
| TRATTRRY | 0.037430 | 0.032885 |
| TTNRTTCW | −0.035167 | 0.016293 |
| GGWGRVHG | 0.024464 | 0.008203 |
| WSCSTRKS | 0.018255 | 0.033926 |
| HCGBTCGV | −0.113689 | 0.043413 |
| GGCRGGAV | 0.046776 | 0.009803 |
| TTKACWRA | 0.033587 | 0.035103 |
| GGHNGAGH | 0.021662 | 0.040533 |
| KRAGCBAN | 0.026475 | 0.009812 |
| ACVCWRMS | 0.023771 | 0.010771 |
| WCCCCVVC | 0.04015 | 0.01686 |
| AMVCAYAG | 0.03683 | 0.00944 |
| CGNMYCGG | 0.08602 | 0.008174 |
| CKTCCGKN | 0.0739 | 0.044389 |
| CCTSGRMK | 0.036704 | 0.015545 |
| TGTGGACW | 0.103851 | 0.000909 |
| GSARHGGR | −0.023597 | 0.040487 |
| WGCGGYSG | 0.084659 | 0.021616 |
| TWWKTAAY | −0.053886 | 0.001453 |
| Independent Variable | Regression Coefficient | p-Value |
|---|---|---|
| TRTWKACH | 0.066537 | 0.000001 |
| TMAAYANS | 0.051297 | 0.0000001 |
| TWKACHYW | 0.021614 | 0.028887 |
| KACDTWGN | 0.025535 | 0.015482 |
| TAAHYABW | −0.033779 | 0.000422 |
| ARMYAAGV | 0.02232 | 0.020651 |
| CCRCCCCB | −0.056879 | 0.017154 |
| CGSCBBCG | 0.040932 | 0.014188 |
| GCGYKCGN | 0.115472 | 0.009763 |
| CGMRCGCV | −0.131678 | 0.009819 |
| ANCRAHGV | 0.018453 | 0.040805 |
| Independent Variable | Regression Coefficient | p-Value |
|---|---|---|
| ATTSGHYR | 0.06863 | 0.009941 |
| RRCSAATS | −0.074581 | 0.021391 |
| TGTAGTYY | 0.25583 | 0.0000001 |
| CSAATSRV | 0.141722 | 0.0000001 |
| TACAWNTC | −0.103949 | 0.031145 |
| ANWTGTAG | 0.155459 | 0.000388 |
| TBYBATTG | 0.05046 | 0.00207 |
| GGGANWTG | 0.147136 | 0.0000001 |
| WGGGYGGG | 0.042234 | 0.038834 |
| TKCYGGGW | 0.051412 | 0.00338 |
| CTTCCKGB | −0.046938 | 0.011891 |
| RGGCGGGH | 0.050394 | 0.001738 |
| ATTSGYYY | 0.076936 | 0.00512 |
| TATTGGHY | 0.172836 | 0.000022 |
| GGGHSGWG | −0.025723 | 0.047439 |
| CGGKRCBD | 0.029378 | 0.019498 |
| RABBGACR | 0.075836 | 0.0000001 |
| TTGGTCNR | 0.079731 | 0.000773 |
| TAGTYYWH | 0.050178 | 0.015284 |
| TTTRHWTW | −0.037338 | 0.037889 |
| WKCAAAKN | −0.043257 | 0.004714 |
| GTCAYGTG | −0.098339 | 0.001426 |
| TGANTGAC | 0.134395 | 0.000061 |
| AVHGAYAR | −0.043841 | 0.001981 |
| AYGATTSG | 0.242444 | 0.0000001 |
| GGATTSGH | 0.121602 | 0.000005 |
| ACGSAHGY | 0.053019 | 0.026689 |
| GVATKCTG | 0.058493 | 0.038876 |
| AGATAAGV | −0.129716 | 0.000021 |
| Independent Variable | Regression Coefficient | p-Value |
|---|---|---|
| TRTWKACH | 0.055717 | 0.000001 |
| RTTKACHY | 0.027913 | 0.02056 |
| TMAAYANS | 0.047318 | 0.000001 |
| TWKACHYW | 0.019684 | 0.04549 |
| TTKRTYTW | −0.02034 | 0.046044 |
| KACDTWGN | 0.020031 | 0.035274 |
| TAAHYABW | −0.036249 | 0.000121 |
| ARMYAAGV | 0.019283 | 0.037902 |
| AAAMAAAR | −0.009348 | 0.024866 |
| Partner TF 1 | Number of Motifs 2 | TF Family 3 | TF Subfamily 4 |
|---|---|---|---|
| HNF4G | 6 | 2.1.3. RXR-related receptors (NR2) | 2.1.3.2. HNF-4 (NR2A) |
| SP1 | 6 | 2.3.1. Three-zinc finger Krüppel-related factors | 2.3.1.1. SP1-like factors |
| FOXO3 | 2 | 3.3.1. Forkhead box (FOX) factors | 3.3.1.15. FOXO |
| POU5F1 | 2 | 3.1.10. POU domain factors | 3.1.10.5. POU5 (OCT-3/4-like factors) |
| NR2F1 | 1 | 2.1.3. RXR-related receptors (NR2) | 2.1.3.5. COUP-like receptors (NR2F) |
| ZNF148 | 1 | 2.3.3. More than 3 adjacent zinc finger factors | 2.3.3.13. ZNF148-like factors |
| EGR1 | 1 | 2.3.1. Three-zinc finger Krüppel-related factors | 2.3.1.3. EGR factors |
| NFYC | 1 | 4.2.1. Heteromeric CCAAT-binding factors | 4.2.1.0.3. NF-YC |
| SOX2 | 1 | 4.1.1. SOX-related factors | 4.1.1.2. Group B |
| ZBTB14 | 1 | 2.3.3. More than 3 adjacent zinc finger factors | 2.3.3.0. unclassified |
| MAFG | 1 | 1.1.3. MAF-related factors | 1.1.3.2. Small Maf factors |
| Partner TF | Correlation Coefficient, r |
|---|---|
| HNF4G | 0.116739 * |
| SP1 | −0.12075 |
| FOXO3 | 0.106967 |
| POU5F1 | 0.076699 |
| NR2F1 | −0.02758 |
| ZNF148 | −0.06076 |
| MAFG | 0.106967 * |
| Partner TF | Gene or Genomic Regions | Summary | Reference |
|---|---|---|---|
| HNF4 subfamily | Human APOB enhancer | Cooperative interaction between FOXA2 and HNF4 in mediating enhancer function | [124] |
| HNF4 subfamily (HNF4A) | DNA regions from HepG2 ChIP-seq for FOXA2 and HNF4A | ChIP-sequencing revealed that FOXA2 peaks were co-localizing with HNF4A peaks | [125] |
| HNF4 subfamily (HNF4A) | DNA regions from adult mouse liver or embryonic hepatoblasts ChIP-seq for FOXA2 and HNF4A | ChIP-sequencing revealed that FOXA2 peaks were co-localizing with HNF4A peaks | [126] |
| HNF4 subfamily (HNF4A) | Human F2 enhancer | FOXA2 and HNF4A were found to be bound to the enhancer of this gene | [127] |
| HNF4 subfamily (HNF4A) | DNA regions from adult mouse liver ChIP-seq for FOXA2 and HNF4A | ChIP-sequencing revealed that FOXA2 peaks were co-localizing with HNF4A peaks | [128] |
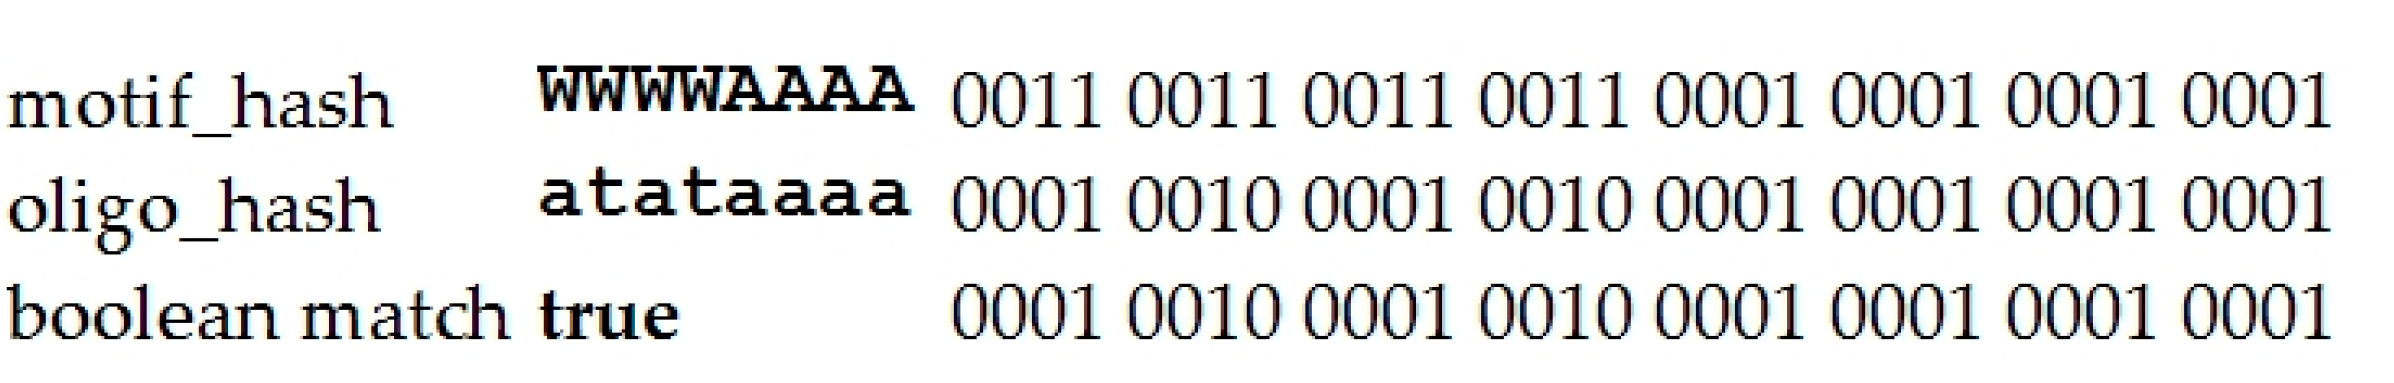
| IUPAC Letter | A | T | G | C | R | Y | M | K | W | S | B | H | V | D | N |
|---|---|---|---|---|---|---|---|---|---|---|---|---|---|---|---|
| Nucl. Variants | A | T | G | C | G/A | T/C | A/C | G/T | A/T | C/G | Not A | Not G | Not T | Not C | N |
| A | 1 | 0 | 0 | 0 | 1 | 0 | 1 | 0 | 1 | 0 | 0 | 1 | 1 | 1 | 1 |
| T | 0 | 1 | 0 | 0 | 0 | 1 | 0 | 1 | 1 | 0 | 1 | 1 | 0 | 1 | 1 |
| G | 0 | 0 | 1 | 0 | 1 | 0 | 0 | 1 | 0 | 1 | 1 | 0 | 1 | 1 | 1 |
| C | 0 | 0 | 0 | 1 | 0 | 1 | 1 | 0 | 0 | 1 | 1 | 1 | 1 | 0 | 1 |
| Hash | 0001 | 0010 | 0100 | 1000 | 0101 | 1010 | 1001 | 0110 | 0011 | 1100 | 1110 | 1011 | 1101 | 0111 | 1111 |
Disclaimer/Publisher’s Note: The statements, opinions and data contained in all publications are solely those of the individual author(s) and contributor(s) and not of MDPI and/or the editor(s). MDPI and/or the editor(s) disclaim responsibility for any injury to people or property resulting from any ideas, methods, instructions or products referred to in the content. |
© 2024 by the authors. Licensee MDPI, Basel, Switzerland. This article is an open access article distributed under the terms and conditions of the Creative Commons Attribution (CC BY) license (https://creativecommons.org/licenses/by/4.0/).
Share and Cite
Vishnevsky, O.V.; Bocharnikov, A.V.; Ignatieva, E.V. Peak Scores Significantly Depend on the Relationships between Contextual Signals in ChIP-Seq Peaks. Int. J. Mol. Sci. 2024, 25, 1011. https://doi.org/10.3390/ijms25021011
Vishnevsky OV, Bocharnikov AV, Ignatieva EV. Peak Scores Significantly Depend on the Relationships between Contextual Signals in ChIP-Seq Peaks. International Journal of Molecular Sciences. 2024; 25(2):1011. https://doi.org/10.3390/ijms25021011
Chicago/Turabian StyleVishnevsky, Oleg V., Andrey V. Bocharnikov, and Elena V. Ignatieva. 2024. "Peak Scores Significantly Depend on the Relationships between Contextual Signals in ChIP-Seq Peaks" International Journal of Molecular Sciences 25, no. 2: 1011. https://doi.org/10.3390/ijms25021011
APA StyleVishnevsky, O. V., Bocharnikov, A. V., & Ignatieva, E. V. (2024). Peak Scores Significantly Depend on the Relationships between Contextual Signals in ChIP-Seq Peaks. International Journal of Molecular Sciences, 25(2), 1011. https://doi.org/10.3390/ijms25021011