Article

Genetic Insights into Colorectal Cancer: Evaluating PI3K/AKT Signaling Pathway Genes Expression

1
Department of Pharmaceutical Biochemistry and Molecular Diagnostics, Medical University of Lodz, Muszynskiego 1, 90-151 Lodz, Poland
2
BRaIn Laboratories, Medical University of Lodz, Czechoslowacka 4, 92-216 Lodz, Poland
3
Department of General and Colorectal Surgery, Medical University of Lodz, ul. Zeromskiego 113, 90-549 Lodz, Poland
*
Author to whom correspondence should be addressed.
Int. J. Mol. Sci. 2024, 25(11), 5806; https://doi.org/10.3390/ijms25115806
Submission received: 10 April 2024 / Revised: 22 May 2024 / Accepted: 23 May 2024 / Published: 27 May 2024
(This article belongs to the Special Issue Molecular Mechanisms and Therapies of Colorectal Cancer 3.0)

Abstract

:
The PI3K/AKT pathway plays a pivotal role in cellular processes, and its dysregulation is implicated in various cancers, including colorectal cancer. The present study correlates the expression levels of critical genes (PIK3CA, PTEN, AKT1, FOXO1, and FRAP) in 60 tumor tissues with clinicopathological and demographic characteristics. The results indicate age-related variation in FOXO1 gene expression, with higher levels observed in patients aged 68 and above. In addition, tumors originating from the rectum exhibit higher FOXO1 expression compared to colon tumors, suggesting region-specific differences in expression. The results also identify the potential correlation between PTEN, PIK3CA gene expression, and parameters such as tumor grade and neuroinvasion. The bioinformatic comparative analysis found that PTEN and FOXO1 expressions were downregulated in colorectal cancer tissue compared to normal colon tissue. Relapse-free survival analysis based on gene expression identified significant correlations, highlighting PTEN and FRAP as potential indicators of favorable outcomes. Our findings provide a deeper understanding of the role of the PI3K/AKT pathway in colorectal cancer and the importance of understanding the molecular basis of colorectal cancer development and progression.

1. Introduction

Transforming growth factor β (TGF-β) is a pleiotropic cytokine that performs a range of principal functions in the body, including cell growth and differentiation [1]. TGF-β may act as a suppressor or promoter of carcinogenesis, depending on the stage and type of cancer. Regardless of the canonical pathway involving SMAD proteins, the TGF-β cytokine can interact with the PI3K/AKT pathway [2], also known as the phosphoinositide 3-kinase/protein kinase B pathway, which is a critical cellular signaling cascade that plays a crucial role in regulating cell growth, survival, apoptosis, migration, and metabolism [3]. Although the pathway is essential for normal cell function, it can also contribute to the development of diseases, notably cancer, when dysregulated.
The key components of the pathway are phosphatidylinositol 3-kinase (PI3K), receptor tyrosine kinases (RTKs), phosphatase and tensin homolog deleted on chromosome ten (PTEN), protein kinase B (AKT), mammalian target of rapamycin (mTOR), and FOXO transcription factors [2,4]. Upon activation by RTKs or other cell surface receptors, PI3K phosphorylates phosphatidylinositol 4,5-bisphosphate (PIP2) to generate phosphatidylinositol 3,4,5-trisphosphate (PIP3). PIP3 serves as a second messenger in the pathway. PIP3 can be dephosphorylated back to PIP2 by PTEN which acts as a tumor suppressor by limiting PI3K/AKT signaling [5]. When PIP3 levels increase due to PI3K activation, AKT is recruited to the plasma membrane.
While AKT kinase activation is not sufficient to start oncogenesis, it can influence cancer progression. AKT regulates the activity of subsequent proteins responsible for the main functions of the PI3K/AKT signaling pathway. It phosphorylates mTOR kinase, which is part of the TORC1 protein complex that regulates anabolic processes such as protein synthesis and ribosome biogenesis, and TORC2, which is responsible for cell proliferation and organization of the cytoskeleton [6]. AKT kinase also regulates the expression of proteins from the FOXO family, which are some of the most important effectors of the PI3K/AKT pathway; these regulate the expression of genes involved in apoptosis, cell cycle, and DNA repair. Their function is negated by phosphorylation [6,7].
The increased activity of the PI3K/AKT pathway is associated with inter alia colorectal cancer (CRC) [8]. According to data from GLOBOCAN 2020, CRC is one of the most widely-diagnosed cancers worldwide: in 2020, it was estimated to be the third most common cancer in men and the second in women. Its incidence is highest in developed countries [9]. However, survival rates for CRC have been improving, particularly in countries with well-established screening programs and advanced treatment options, and the chances of survival are significantly improved by early-stage diagnosis and timely treatment. The five-year survival rate has now exceeded 60% in numerous European countries; however, this is strongly dependent on the stage at which the disease is diagnosed. For instance, patients diagnosed at stage I have a survival rate of approximately 90%, but this rate falls to around 10% at stage IV [9,10]. Nevertheless, the newest report from GLOBOCAN showed that over 930,000 deaths were caused by CRC worldwide in 2020, which constituted about 10% of all cancer-related deaths [11]. These data underline the need to continue searching for new treatment schemes and inventing new markers that will play a crucial role in prevention programs and in selecting the appropriate type of pharmacological treatment.
The aim of the study was to evaluate the expression of five key genes encoding the proteins included in the PI3K/AKT signaling pathway, namely PIK3CA (encoding the catalytic subunit of PI3K), PTEN, AKT1 (encoding AKT kinase), FOXO1, and FRAP (encoding mTOR kinase), in relation to two reference genes: GAPDH and ACTB in patients with CRC. The obtained results were correlated with the following clinicopathological and demographic characteristics: age, sex, tumor location, histological grade, disease advancement according to TNM classification (The American Joint Committee on Cancer; AJCC), number of affected lymph nodes, presence of tumor angiogenesis and neuroinvasion. In the next step, a bioinformatics analysis was carried out, which took into account the molecular subtype of the CRC and the presence of PIK3CA and PTEN gene mutation. Using the data contained in the databases, the expression levels of the analyzed genes were compared between tumor tissue and normal tissue, and survival curves were created in regard to the gene expression level.

2. Results

2.1. The Association between Gene Expression and the Sex and Age of Patients

No significant differences were noted in the expressions of PIK3CA, PTEN, AKT1, FOXO1, or FRAP genes with regard to sex. In addition, no statistically significant correlation based on correlation matrices was found between patient age and gene expression. The patients were divided into two groups based on the median age (68 years); FOXO1 gene expression was found to be significantly higher in the group of patients aged 68 and above (p = 0.0268) compared to the younger group (Figure 1).

2.2. The Association between Gene Expression and the Cancer Stage According to the TNM Scale (AJCC)

In the first analysis, no statistically significant differences in gene expression were observed with regard to tumor size (T). In addition, no statistically significant differences in expression were noted with regard to the number of involved lymph nodes (N) when divided into three groups (N0, N1, and N2) (classification according to the TNM) or when divided into two groups (N0 vs. N1, N2). Furthermore, no differences in gene expression were observed based on the presence of distant metastases (M0 vs. M1). Finally, the patients were classified into a 4-stage scale of disease progression according to AJCC (I–IV stage); again, no significant differences in gene expressions were observed with regard to the cancer stage.

2.3. The Association between Gene Expression and Tumor Localization, Tumor Grading, Presence of Angioinvasion, and Neuroinvasion

Firstly, the patients were divided into two groups with regard to tumor location: those with tumors located in the colon and those with tumors located in the rectum. No significant differences in expression were found between the locations, apart from the FOXO1 gene, which was more strongly expressed in the rectum than the colon (p = 0.0223) (Figure 1).
In addition, high-grade tumors demonstrated higher PTEN expression than low-grade tumors (p = 0.0308) (Figure 1). However, no statistically significant relationship was found for the remaining analyzed genes regarding tumor grade. The only exception was the PIK3CA gene, where higher expression was confirmed in women with low-grade tumors compared to high-grade tumors (p = 0.0401). However, after considering the Benjamini-Hochbergcorrection, these two dependencies lost statistical significance.
No significant differences in gene expression were observed with regard to angioinvasion. However, significantly higher PTEN expression was observed in cases with neuroinvasion (p = 0.0008) (Figure 1), both in the male group (p = 0.0080) and the female group (p = 0.0484).

2.4. Comparison of PIK3CA, PTEN, AKT1, FRAP, FOXO1 Gene Expression and Protein Levels between Tumor Tissue from Patients with Colorectal Cancer and Normal Tissue

The expression of the analyzed genes was compared between normal colon and rectal tissue and tumor tissue based on the data available on the UALCAN platform. Firstly, an analysis was performed for colon adenocarcinoma. Significantly higher expression of PTEN (p < 0.0001) and FOXO1 (p < 0.0001) were observed in normal tissue compared to tumor tissue (Figure 2). No significant differences were found for the rest of the analyzed genes. In the rectum, the PTEN gene (p < 0.0001) and FOXO1 gene (p = 0.0099) also demonstrated higher expression in normal tissue compared to tumors. Additionally, higher PIK3CA gene expression (p = 0.0109) was noted in normal tissue compared to rectal tumors (Figure 3).
Additionally, after assessing the mRNA levels of selected genes, we compared the PIK3CA, PTEN, and FOXO1 protein expression between cancer and normal tissue using images from the Human Protein Atlas. We found that PTEN protein was not observed or the expression was low in colorectal cancer tissue, whereas medium expression was detected in both rectal and colon normal tissue. FOXO1 protein was found to be low/medium expressed in cancer tissue, while medium expression was noticed in normal colon and rectal tissue. Higher PIK3CA protein expression was observed in normal rectal tissue than in colorectal cancer tissue (Figure 4).

2.5. The Association between PIK3CA, PTEN, AKT1, FRAP, FOXO1 Gene Expressions and Presence of PIK3CA, PTEN Gene Mutation

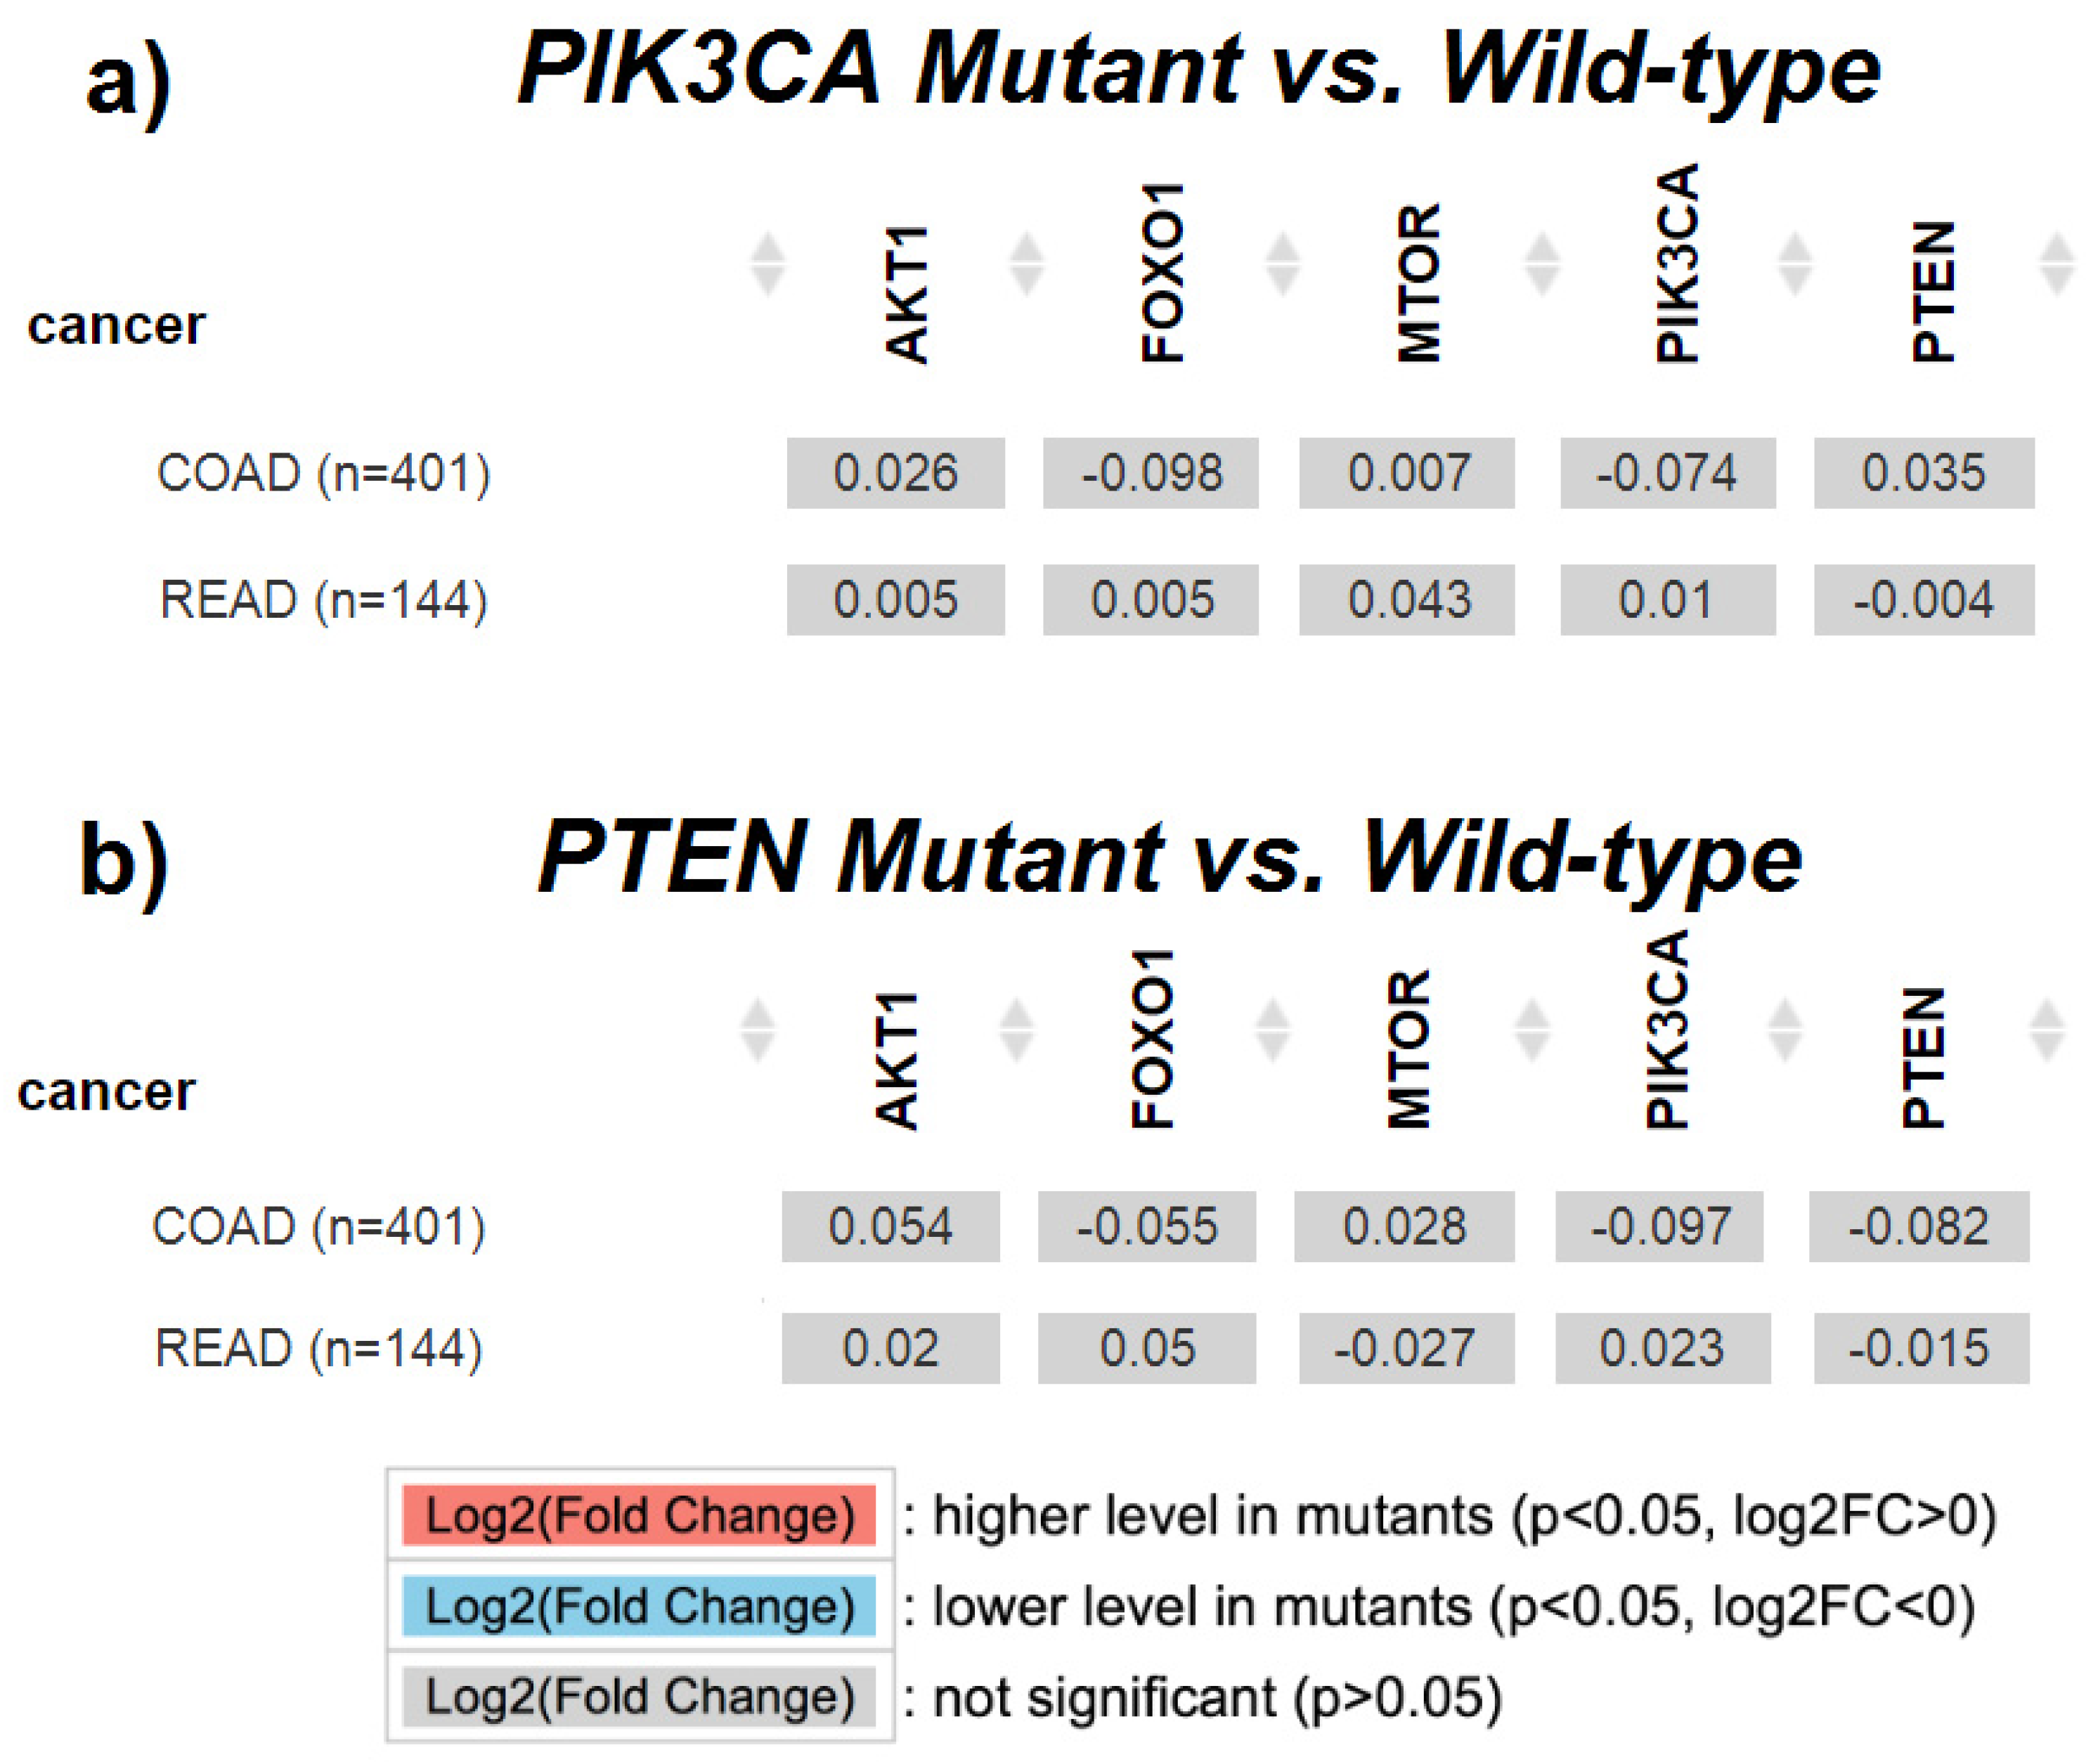
For the analysis conducted using the TIMER 2.0 platform, the data from 401 colon adenocarcinoma (COAD) samples and 144 rectal adenocarcinoma (READ) samples were utilized. Mutations in the PIK3CA gene were present in 31.5% of COAD samples and 17.7% of READ samples. Mutations in the PTEN gene were much less frequent (5.9% in COAD and 5.3% in READ). The conducted statistical analysis did not show significant differences in the expression of PIK3CA, PTEN, AKT1, FOXO1, and mTOR (FRAP) genes with regard to the presence or absence of PIK3CA and PTEN gene mutations. The detailed results are presented in Figure 5.

2.6. The Association between PIK3CA, PTEN, AKT1, FRAP, FOXO1 Gene Expressions and Consensus Molecular Subtype (CMS)

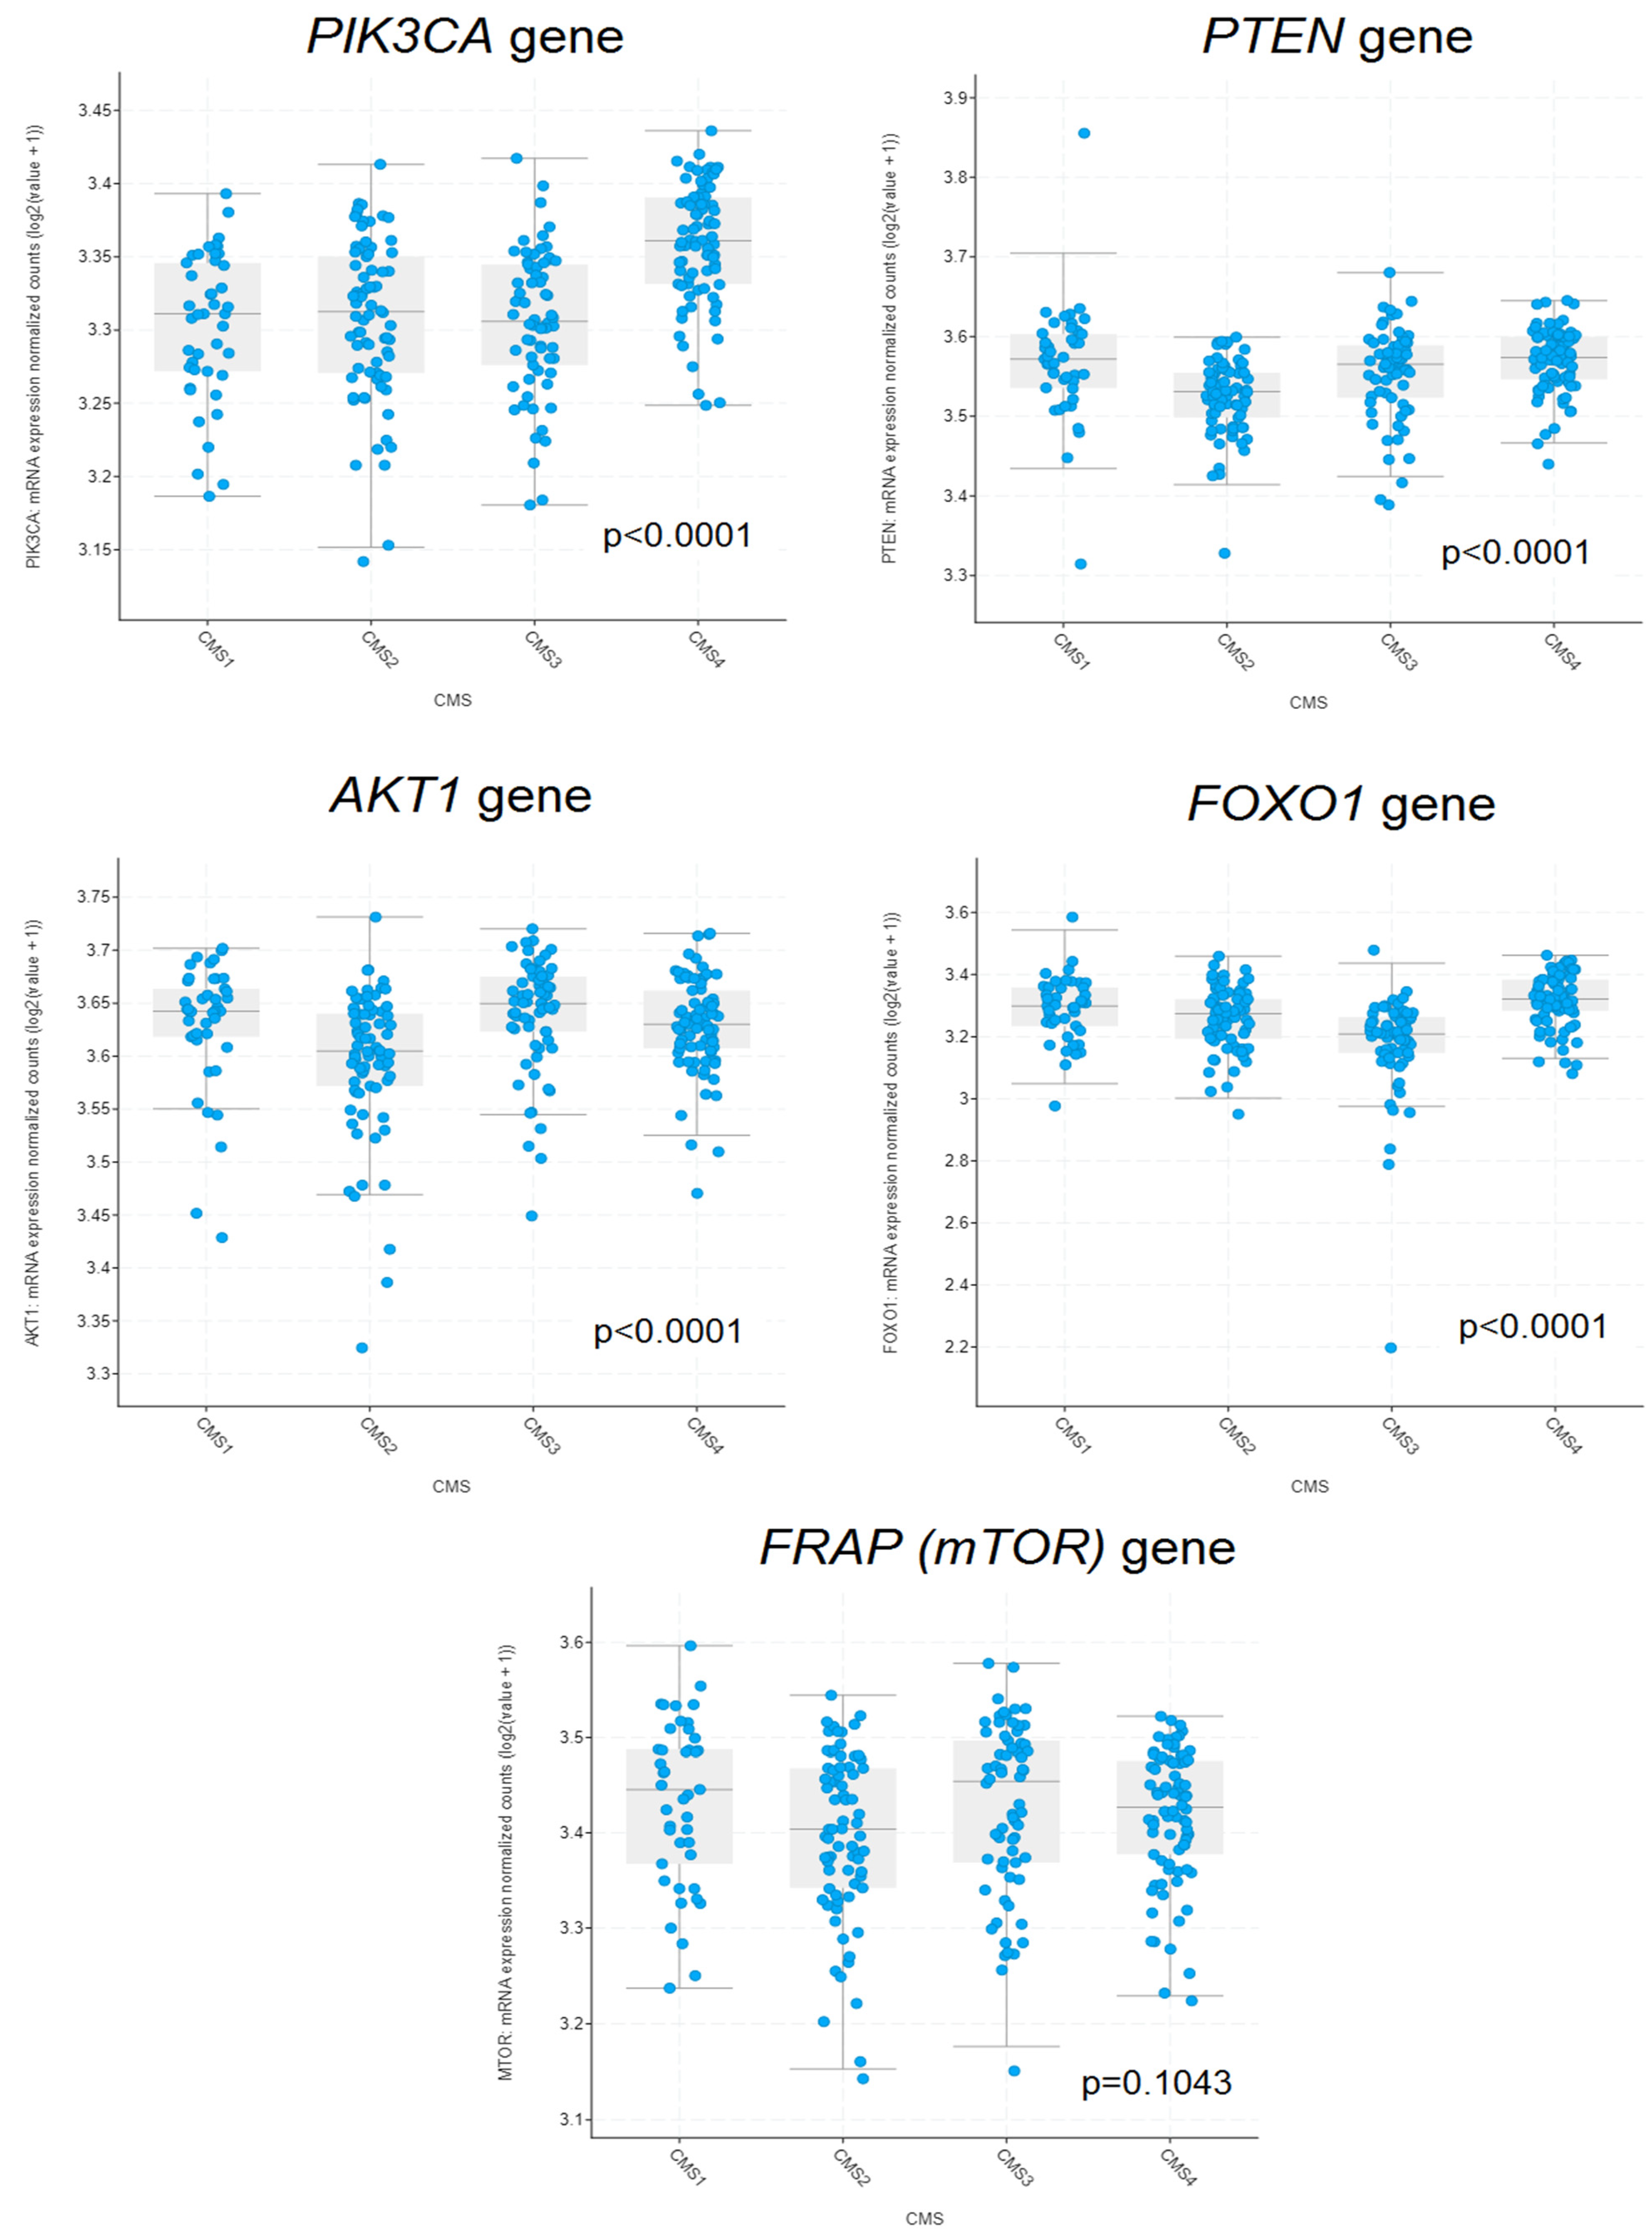
Data from 267 CRC patients were used for the analysis. Within this group, 43 samples were classified as the MSI Immune subtype (CMS 1), 76 as the Canonical subtype (CMS 2), 66 as the Metabolic subtype (CMS 3), and 82 as the Mesenchymal subtype (CMS 4). A statistically significant relationship was demonstrated between CMS and the expression levels of the PIK3CA gene (p < 0.0001), PTEN (p < 0.0001), AKT1 (p < 0.0001), and FOXO1 (p < 0.0001). The expression level of the FRAP (mTOR) gene did not significantly differ depending on CMS (p = 0.1043) (Figure 6). The highest average expression values of the PIK3CA gene were observed in CMS 4. In the same subtype, the highest average values of the FOXO1 gene were noted. Both PTEN and AKT1 exhibited the lowest expression in the CMS 2 subtype (Figure 6).

2.7. Survival Analysis Based on the PIKCA, PTEN, AKT1, FRAP, and FOXO1 Gene Expressions in Patients with Colon Cancer

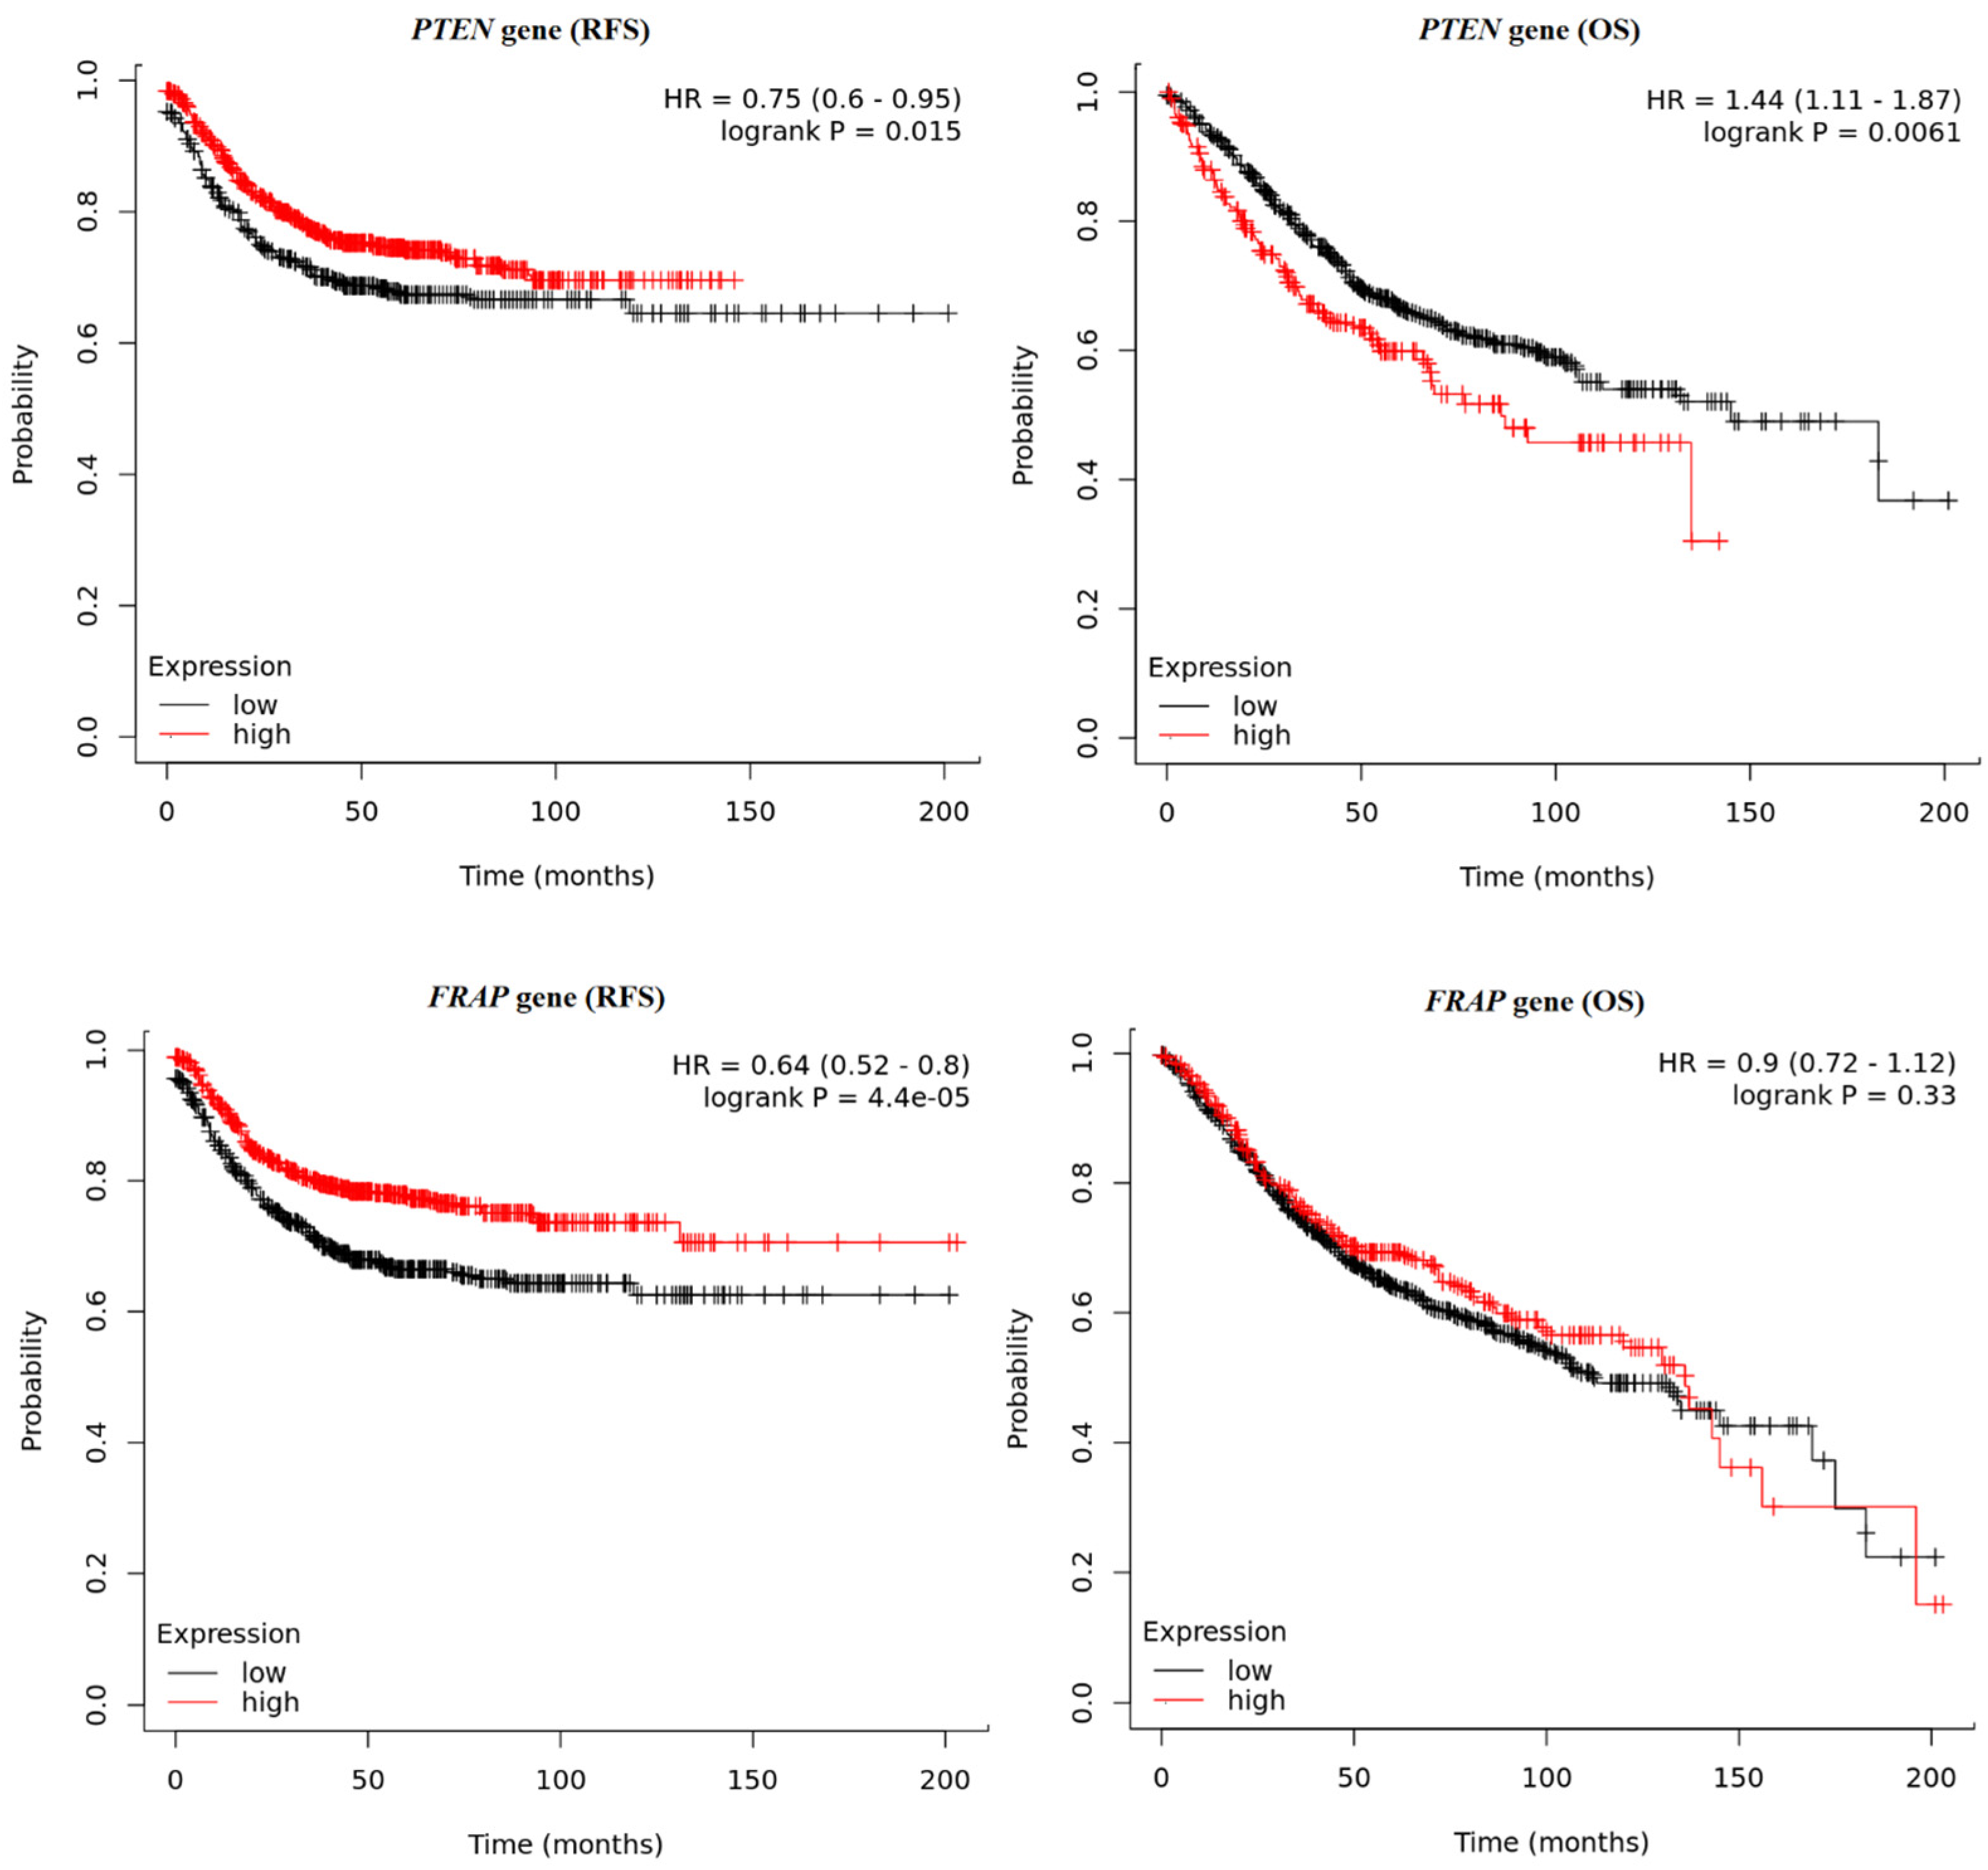
Briefly, the survival times of the colon cancer patients were compared with their gene expression pattern based on data obtained from the Kaplan–Meier plotter database. Significantly longer relapse-free survival (RFS) was observed among patients with higher PTEN (p = 0.0154) and FRAP expression (p < 0.0001). The detailed results are presented in Figure 7. The reverse results were observed for PIK3CA and AKT1; significantly longer RFS were noted for patients with lower PIK3CA (p = 0.0182) and AKT1 (p < 0.0001). In the case of RFS analysis for the FOXO1 gene, the obtained p-value (0.0391) was not statistically significant after performing multiple testing corrections (Figure 8). Overall survival (OS) analysis showed similar relationships for PIK3CA (p = 0.0016), AKT1 (p = 0.0026), and FOXO1 (p = 0.0027), where longer survival times were observed in the group of patients with higher expression of these genes (Figure 8). OS was not correlated with FRAP gene expression (p = 0.3326). However, for the PTEN gene, the analyses showed longer (OS) times for the group of patients with lower PTEN gene expression (p = 0.0061) (Figure 7).

3. Discussion

The PI3K/Akt pathway is frequently dysregulated in colorectal cancer (CRC), and CRC patients commonly demonstrate mutations in the PIK3CA gene, encoding the catalytic subunit of PI3K [12]. Such genetic alterations result in sustained activation of Akt, promoting cell survival and proliferation. Furthermore, the PI3K/Akt pathway can crosstalk with other signaling cascades, such as the Wnt/β-catenin pathway, further contributing to the malignant transformation of cells [13]. The activated PI3K/Akt pathway has been linked to several aspects of cancer progression, including increased resistance to apoptosis, enhanced angiogenesis, and promotion of metastasis [14]. It also participates in the regulation of the tumor microenvironment and the immune response, influencing the interaction that occurs between cancer cells and the surrounding tissues [15].
The mammalian target of rapamycin (mTOR) and Forkhead box protein O1 (FOXO1) are critical components of the cellular signaling pathway and appear to play a significant role in the process of carcinogenesis. mTOR is a central regulator of cell growth and protein synthesis. The protein is also involved in the regulation of angiogenesis. Increased angiogenesis is a hallmark of cancer, and mTOR over-activation can drive the initiation and progression of CRC [16,17]. FOXO1 is a transcription factor that plays a role in regulating cellular growth and apoptosis; its inactivation or loss of function in CRC can allow the evasion of such processes, allowing cancer cells to escape programmed cell death and continue proliferating [18].
The aim of the study was to determine the expression of key genes involved in the PI3K/AKT signaling pathway, including PIK3CA, PTEN, AKT1, FOXO1, and FRAP, in patients with CRC. The results were correlated with various clinicopathological and demographic characteristics: age, sex, tumor location, histological grade, disease stage, lymph node involvement, and the presence of angiogenesis and neuroinvasion.
It was found that changes in FOXO1 gene expression depended on patient age, with higher expressions observed in the tumor tissue of patients above the median age of the studied group (68 years) compared to the younger group. Comparable results were obtained by Khan et al., who demonstrated higher FOXO1 expression in breast cancer tissue of patients aged above 50 years compared to those under 50 years [19].
Higher FOXO1 expression was also noted in tumor tissue originating from the rectum compared to tumors located within the colon. This may indicate that the expression of the analyzed gene varies depending on the specific part of the large intestine. Similarly, Ko et al. report significantly more frequent FOXO1 protein expression in tumor specimens originating from the rectum and the left side of the colon compared to the right side of the colon [20]. However, it is also possible that the genetic mechanisms underlying the process of carcinogenesis may vary between different parts of the large intestine.
Loss of PTEN function or downregulation of PTEN gene expression is significantly correlated with cancer incidence but also with a higher grade of malignancy and poorer prognosis in the case of various cancers, including colorectal cancer [21,22]. A team led by Yazdani et al. demonstrated that negative protein expression was associated with larger tumor size and higher cancer stage, and they identified a significant positive correlation between the mRNA level of the PTEN gene and PTEN protein expression [22]. In our study, no correlations were found between PTEN gene expression and features such as tumor size or cancer stage; however, higher PTEN gene expression was associated with a higher histological malignancy grade and a more frequent occurrence of neuroinvasion. These results differ from those noted in some previous studies [22,23]. Nevertheless, the relationship between the level of PTEN gene expression and parameters indicating the advancement of cancer may be more complex and depend on many additional factors. The level of PTEN gene expression may be independently influenced by the occurrence of genetic mutations or the overlap of epigenetic changes. Moreover, the simultaneous occurrence of other disorders in different signaling pathways in the course of carcinogenesis or the tumor microenvironment may influence changes in the expression of the PTEN gene. An additional individual factor is the therapeutic regimen used in patient treatments. Some targeted therapies in advanced colorectal cancer may indirectly influence the expression of the PTEN gene significantly through various mechanisms [24]. The complexity of processes influencing the level of gene expression may lead to ambiguous and different observations and relationships. In addition, it is also important to consider whether the changes involve mRNA or protein expression.
The bioinformatic analysis also compared the expression of the analyzed genes between normal and tumor tissues based on data from the UALCAN database. The analysis identified significantly higher PTEN and FOXO1 expressions in normal tissue compared to tumor tissue in both the colon and rectum. Analysis of tissue images from HPA also confirmed higher levels of these proteins in normal colon and rectal tissue compared to tumor tissue. These results suggest that these genes may have a potential role in maintaining normal cellular function and suppressing carcinogenesis. This aligns with the existing data implicating PTEN and FOXO1 in tumor suppression, and that their loss may contribute to cancer initiation and progression [21,22,23,25].
CRC is a very heterogeneous disease with diverse molecular backgrounds and various responses to treatment. Based on gene expression profiles, genomic and epigenetic changes, as well as clinical characteristics of patients, scientists have created a new molecular classification called Consensus Molecular Subtypes (CMS) [26]. In the conducted bioinformatics analysis, the gene expression levels of the PI3K/AKT pathway in CRC patients with defined CMS were used. The highest values of PIK3CA expression were observed in the mesenchymal subtype (CMS 4) which is associated with aggressive cancer development and poor prognosis [27]. Conversely, both PTEN and AKT1 showed the lowest expression in the canonical molecular subtype (CMS 2). This is the most common molecular subtype among CRC patients and it is associated with good prognosis [28]. The obtained results indicate the presence of characteristic expression profiles of the PI3K/AKT pathway in different molecular subtypes of CRC, which can be utilized for molecular profiling.
Using the Kaplan–Meier plotter platform, the RFS and OS of the colon cancer patients were also analyzed based on the expression of the investigated genes. It was found that the high expression levels of PTEN and FRAP were correlated with better RFS rates. When the OS rate was assessed, no significant correlation was found with regard to the expression level of the FRAP gene, while for the PTEN gene, an inverse relationship was observed, where higher expression values correlated with worse survival outcomes. It has also been shown that both RFS and OS rates were lower for patients with higher expression values of the PIK3CA and AKT1 genes. Da Costa et al. found low levels of PTEN protein expression to be associated with lower overall survival rates in head and neck squamous cell carcinoma patients treated with chemotherapy [29]. The opposite was noted in the case of advanced breast cancer, where high levels of PTEN gene expression were an unfavorable prognostic factor in the presence of functional TP53 protein [30]. The observed differences may have several causes. The studies being compared were conducted on different molecular levels in the groups of patients with different types of cancers. The most important potential factor is the use of various survival indicators, namely RFS, OS, and PFS (progression-free survival), which can provide different observations within the same group of patients. It can be seen that our findings, together with those in previous studies, indicate the need for further analysis in this area. It is also very important to clearly specify which indicator was used to assess survival time.
The conducted research also aimed to explore the diagnostic and clinical application of the obtained results in CRC patients. One of the possible applications of changes in the PI3K/Akt/mTOR pathway is to use them as prognostic markers. An increase in the activity of this pathway may be associated with a more aggressive form of CRC, which may have clinical application at the level of predicting the course of the disease and assessing the risk of recurrence [31,32]. Understanding changes in the activation of the PI3K/Akt pathway may enable the selection of personalized therapy for a specific group of patients. Patients with excessive activity of the PI3K/Akt/mTOR may be candidates for therapy with mTOR, Akt, and PI3K inhibitors to achieve greater treatment effectiveness. However, patients with low or missing PI3K/Akt/mTOR pathway activity may be resistant to treatment with those kinds of inhibitors [33]. In the bioinformatic analysis, we demonstrated correlations between the expression levels of genes associated with the PI3K/Akt pathway and the survival time of patients. This indicates the potential utility of such data as prognostic markers for CRC patients. However, further research is needed to confirm the clinical usefulness of the PI3K/Akt/mTOR pathway gene expression profile and the possibility of implementing them as markers in routine clinical practice.
We are aware that the above study has certain limitations. Firstly, we did not have access to normal tissue adjacent to the tumor; therefore, we could not perform a comparative analysis of the expression levels of selected genes between tumor tissue and histologically normal tissue. To compensate for this limitation, we conducted a bioinformatic analysis using publicly available data from online databases. Another limitation is the lack of data concerning the status of the PIK3CA and PTEN genes. In different types of cancer, PIK3CA gene mutations are often observed, which may influence both the activity level of the PI3K/Akt pathway and the expression profile of the analyzed genes.

4. Materials and Methods

4.1. Patients and Material

All patients enrolled in the study had received a diagnosis of colorectal cancer and were hospitalized in the Department of General and Colorectal Surgery (Medical University of Lodz, Poland) between January 2020 and June 2023. Among the 60 patients who qualified for the study, 31 were male and 29 were female. The median age of the patients was 68 years old (ranging from 34 to 90). The clinicopathological and demographic characteristics describing the study group are presented in Table 1. The samples of tumor tissue were collected intraoperatively during tumor removal surgery or colonoscopy. CRC tissues were immediately immersed in StayRNA™ (A&A Biotechnology, Gdańsk, Poland) preservation solution and frozen at −80 °C until isolation. A diagnosis of CRC was confirmed by pathologists based on histological examination. All colorectal cancer samples used in this study were classified as adenocarcinoma. The study was conducted in accordance with the principles of the Declaration of Helsinki and was approved by the Ethical Committee of the Medical University of Lodz (approval no. RNN/84/20/KE with amendments numbered KE/95/22 and KE/92/24). All research participants gave their signed, informed consent to take part.

4.2. RNA Extraction, Quantity, and Quality

RNA was extracted from neoplastic tissue using an RNeasy Mini Kit (Qiagen, Hilden, Germany) in accordance with the manufacturer’s protocol. The purity and concentration of the isolated RNA were assessed spectrophotometrically with a NanoPhotometer (Implen, Munich, Germany). RNA samples whose A260/A280 absorbance ratio was in the range of 1.8–2.0 were used for further steps. All samples were stored at −80 °C until further analysis.

4.3. Reverse Transcription Reaction

cDNA was obtained by reverse transcription (RT) using a High-Capacity cDNA Reverse Transcription Kit (Applied Biosystems, Waltham, MA, USA). Before performing RT, the RNA concentration in each sample was adjusted to 0.03 µg/µL, resulting in a final yield of 0.6 µg of RNA per sample. The reaction was carried out according to the manufacturer’s protocol. The obtained cDNA fragments were stored at −20 °C until further steps. To assess the correctness of this step, the GAPDH housekeeping gene was amplified using the REDTaq® ReadyMix™ kit (Merck, Darmstadt, Germany). The following primers were used in the reaction: forward 5′-TGGTATCGTGGAAGGACTCATGAC-3′; reverse 5′-ATGCCAGTGAGCTTCCCGTTCAGC-3. The presence of a 96 base-pair product was checked using 2% agarose gel electrophoresis.

4.4. qPCR with Taqman Probes

The relative expressions of the PIK3CA, PTEN, AKT1, FOXO1, and FRAP genes were assessed in relation to two reference genes, GAPDH and ACTB, using the TaqMan™ Fast Advanced Master Mix kit (Thermofisher, Waltham, MA, USA). All reactions were performed on QuantStudio 5 Dx platform (Thermofisher, USA) under the following thermal conditions: initial denaturation at 95 °C for 10 min, followed by 40 cycles of denaturation at 95 °C for 15 s, and annealing/elongation at 60 °C for 60 s. The single reaction consisted of 10 µL of MasterMix, 2 µL of TaqMan probes and primers (1 µL of FAM-labeled probe and 1 µL of VIC-labeled probe), 7 µL of pure water, and 1 µL of previously obtained cDNA. Each sample was evaluated in duplicate. A negative control was performed for each series. The Taqman probes (Thermofisher, USA) used in the experiment are presented in Table 2. The means of the Ct values obtained from technical replicates were calculated for two reference and five investigated genes in each analyzed sample. The relative levels of the selected gene expression and the R values were determined by the ΔΔCt method due to the similar amplification efficiency for each gene [34]. The calibrator was calculated as the difference between the average Ct value of the target gene and the average Ct value of both reference genes, which were calculated from the entire study population.

4.5. Bioinformatics Analysis

The differences in the expression of the chosen genes between tumor tissue (colon adenocarcinoma and rectal adenocarcinoma) and normal tissue were determined based on data from The Cancer Genome Atlas (TCGA) RNA-seq available on the UALCAN website (http://ualcan.path.uab.edu/index.html, accessed on 20 November 2023) [35,36]. TIMER 2.0 (http://timer.cistrome.org/, accessed on 11 May 2024) was used to analyze the relationship between gene expression level and the occurrence of PIK3CA and PTEN gene mutations. Differential expression of each study gene is presented as log2 fold changes [37]. The assessment of the relationship between the molecular subtype of colorectal cancer and the expression levels of the genes analyzed in the study was conducted via the cBioPortal (http://cbioportal.org, accessed on 15 May 2024) based on data from the (Sidra-LUMC AC-ICAM dataset, Nat Med 2023) [38]. p-values were derived from one-way ANOVA. To compare the expression of the selected proteins of the PI3K/AKT pathway between tumor tissue and normal tissue, images of immunohistochemically stained specimens available in the Human Protein Atlas (HPA) (https://www.proteinatlas.org/, accessed on 9 May 2024) were used [39]. The Kaplan–Meier plotter (https://kmplot.com/analysis/, accessed on 24 November 2023) was used to compare RFS and OS between two groups of patients divided according to the expression of the analyzed genes. The option of automatic selection of the best cut-off was utilized to divide patients into a low-expression cohort and a high-expression cohort. The log-rank test was used to identify significant differences between the two groups [40].

4.6. Statistical Analysis of Experimental Data

Statistical analysis was conducted using the Statistica 13.1 software (TIBCO, Palo Alto, CA, USA). R-values were calculated after BOX-COX transformation. The normality of the distribution of any continuous variables was confirmed using the Shapiro–Wilk test. Any significant relationships between gene expression and the clinicopathological and demographic features among the CRC patients were determined using Student’s t-test, Kruskal–Wallis, Mann–Whitney U-test, correlation matrices, and ANOVA test, as appropriate. Benjamini-Hochberg method for multiple testing with an FDR of 0.1 was used where necessary. Results with a p-value below 0.05 were considered statistically significant. In the study, nominal p-values were provided; however, annotations were added if, after Benjamini-Hochberg correction, the dependencies lost statistical significance.

5. Conclusions

Our findings provide valuable insight into the complex role played by the genes of the PI3K/AKT pathway in CRC and are in line with those of previous studies indicating that the pathway components may act as biomarkers and therapeutic targets for the disease. Gene expression was found to correlate with clinicopathological parameters and survival outcomes; however, further investigation is needed to determine the functional implications of altered gene expression in CRC to improve our understanding of its pathogenesis and to improve patient management. Understanding the molecular intricacies of the PI3K/AKT pathway in CRC, especially their relationships with patient characteristics, may contribute to the development of enhanced personalized treatment strategies.

Author Contributions

Conceptualization, R.Ś., J.P. and E.B.; methodology, R.Ś.; software, A.W.; validation, J.P.; formal analysis, J.P.; investigation, R.Ś., J.P. and A.W.; resources, M.M.; data curation, R.Ś.; writing—original draft preparation, R.Ś. and J.P.; writing—review and editing, R.Ś., A.W. and E.B.; visualization, A.W.; supervision, E.B. and M.M.; project administration, R.Ś. and E.B.; funding acquisition, R.Ś. All authors have read and agreed to the published version of the manuscript.

Funding

This work was supported by funds from the National Science Centre, Poland (no. 2022/06/X/NZ5/00740), and the Department of Pharmaceutical Biochemistry and Molecular Diagnostics, Medical University of Lodz (no. 503/3-015-02/503-31-001).

Institutional Review Board Statement

The study was conducted in accordance with the principles of the Declaration of Helsinki and was approved by the Ethical Committee of the Medical University of Lodz (approval no. RNN/84/20/KE with amendments numbered KE/95/22 and KE/92/24).

Informed Consent Statement

Informed consent was obtained from all subjects involved in the study.

Data Availability Statement

The raw data and the analytic methods will be available upon request. To access protocols or datasets, contact [email protected].

Conflicts of Interest

The authors declare no conflicts of interest.

References

  1. Dahmani, A.; Delisle, J.-S. TGF-β in T Cell Biology: Implications for Cancer Immunotherapy. Cancers 2018, 10, 194. [Google Scholar] [CrossRef] [PubMed]
  2. Massagué, J. TGFβ signalling in context. Nat. Rev. Mol. Cell Biol. 2012, 13, 616–630. [Google Scholar] [CrossRef] [PubMed]
  3. Arcaro, A.; Guerreiro, A.S. The phosphoinositide 3-kinase pathway in human cancer: Genetic alterations and therapeutic implications. Curr. Genomics 2007, 8, 271–306. [Google Scholar] [CrossRef] [PubMed]
  4. He, Y.; Sun, M.M.; Zhang, G.G.; Yang, J.; Chen, K.S.; Xu, W.W.; Li, B. Targeting PI3K/Akt signal transduction for cancer therapy. Signal Transduct. Target. Ther. 2021, 6, 425. [Google Scholar] [CrossRef] [PubMed]
  5. Papa, A.; Pandolfi, P.P. The PTEN–PI3K Axis in Cancer. Biomolecules 2019, 9, 153. [Google Scholar] [CrossRef] [PubMed]
  6. Hoxhaj, G.; Manning, B.D. The PI3K-AKT network at the interface of oncogenic signalling and cancer metabolism. Nat. Rev. Cancer 2020, 20, 74–88. [Google Scholar] [CrossRef] [PubMed]
  7. Brown, A.K.; Webb, A.E. Regulation of FOXO Factors in Mammalian Cells. Curr. Top. Dev. Biol. 2018, 127, 165–192. [Google Scholar] [CrossRef] [PubMed]
  8. Papadatos-Pastos, D.; Rabbie, R.; Ross, P.; Sarker, D. The role of the PI3K pathway in colorectal cancer. Crit. Rev. Oncol. Hematol. 2015, 94, 18–30. [Google Scholar] [CrossRef]
  9. Sung, H.; Ferlay, J.; Siegel, R.L.; Laversanne, M.; Soerjomataram, I.; Jemal, A.; Bray, F. Global Cancer Statistics 2020: GLOBOCAN Estimates of Incidence and Mortality Worldwide for 36 Cancers in 185 Countries. CA A Cancer J. Clin. 2021, 71, 209–249. [Google Scholar] [CrossRef]
  10. Cardoso, R.; Guo, F.; Heisser, T.; De Schutter, H.; Van Damme, N.; Nilbert, M.C.; Christensen, J.; Bouvier, A.-M.; Bouvier, V.; Launoy, G.; et al. Overall and stage-specific survival of patients with screen-detected colorectal cancer in European countries: A population-based study in 9 countries. Lancet Reg. Health Eur. 2022, 21, 100458. [Google Scholar] [CrossRef]
  11. US researchers unveil FR that differentiates facial occlusion. Biom. Technol. Today 2017, 2017, 11. [CrossRef]
  12. Voutsadakis, I.A. The Landscape of PIK3CA Mutations in Colorectal Cancer. Clin. Color. Cancer 2021, 20, 201–215. [Google Scholar] [CrossRef] [PubMed]
  13. Fleming-de-Moraes, C.D.; Rocha, M.R.; Tessmann, J.W.; de Araujo, W.M.; Morgado-Diaz, J.A. Crosstalk between PI3K/Akt and Wnt/β-catenin pathways promote colorectal cancer progression regardless of mutational status. Cancer Biol. Ther. 2022, 23, 1–13. [Google Scholar] [CrossRef] [PubMed]
  14. Rascio, F.; Spadaccino, F.; Rocchetti, M.T.; Castellano, G.; Stallone, G.; Netti, G.S.; Ranieri, E. The Pathogenic Role of PI3K/AKT Pathway in Cancer Onset and Drug Resistance: An Updated Review. Cancers 2021, 13, 3949. [Google Scholar] [CrossRef]
  15. Wang, Q.; Shao, X.; Zhang, Y.; Zhu, M.; Wang, F.X.C.; Mu, J.; Li, J.; Yao, H.; Chen, K. Role of tumor microenvironment in cancer progression and therapeutic strategy. Cancer Med. 2023, 12, 11149–11165. [Google Scholar] [CrossRef] [PubMed]
  16. Zhong, J.; Ding, S.; Zhang, X.; Di, W.; Wang, X.; Zhang, H.; Chen, Y.; Zhang, Y.; Hu, Y. To Investigate the Occurrence and Development of Colorectal Cancer Based on the PI3K/AKT/mTOR Signaling Pathway. Front. Biosci. Landmark 2023, 28, 37. [Google Scholar] [CrossRef] [PubMed]
  17. Zou, Z.; Tao, T.; Li, H.; Zhu, X. mTOR signaling pathway and mTOR inhibitors in cancer: Progress and challenges. Cell Biosci. 2020, 10, 31. [Google Scholar] [CrossRef] [PubMed]
  18. Jiramongkol, Y.; Lam, E.W.F. FOXO transcription factor family in cancer and metastasis. Cancer Metastasis Rev. 2020, 39, 681–709. [Google Scholar] [CrossRef]
  19. Khan, M.A.; Massey, S.; Ahmad, I.; Sadaf; Akhter, N.; Habib, M.; Mustafa, S.; Deo, S.V.S.; Husain, S.A. FOXO1 Gene Downregulation and Promoter Methylation Exhibits Significant Correlation With Clinical Parameters in Indian Breast Cancer Patients. Front. Genet. 2022, 13, 842943. [Google Scholar] [CrossRef]
  20. Ko, Y.S.; Kim, N.Y.; Pyo, J.-S. Clinicopathological significance and angiogenic role of the constitutive phosphorylation of the FOXO1 transcription factor in colorectal cancer. Pathol. Res. Pract. 2020, 216, 153150. [Google Scholar] [CrossRef]
  21. Beg, S.; Siraj, A.K.; Prabhakaran, S.; Jehan, Z.; Ajarim, D.; Al-Dayel, F.; Tulbah, A.; Al-Kuraya, K.S. Loss of PTEN expression is associated with aggressive behavior and poor prognosis in Middle Eastern triple-negative breast cancer. Breast Cancer Res. Treat. 2015, 151, 541–553. [Google Scholar] [CrossRef] [PubMed]
  22. Yazdani, Y.; Farazmandfar, T.; Azadeh, H.; Zekavatian, Z. The prognostic effect of PTEN expression status in colorectal cancer development and evaluation of factors affecting it: miR-21 and promoter methylation. J. Biomed. Sci. 2016, 23, 9. [Google Scholar] [CrossRef] [PubMed]
  23. Li, X.H.; Zheng, H.C.; Takahashi, H.; Masuda, S.; Yang, X.H.; Takano, Y. PTEN expression and mutation in colorectal carcinomas. Oncol. Rep. 2009, 22, 757–764. [Google Scholar] [CrossRef]
  24. Salvatore, L.; Calegari, M.A.; Loupakis, F.; Fassan, M.; Di Stefano, B.; Bensi, M.; Bria, E.; Tortora, G. PTEN in Colorectal Cancer: Shedding Light on Its Role as Predictor and Target. Cancers 2019, 11, 1765. [Google Scholar] [CrossRef] [PubMed]
  25. Jiang, S.; Li, T.; Yang, Z.; Hu, W.; Yang, Y. Deciphering the roles of FOXO1 in human neoplasms. Int. J. Cancer 2018, 143, 1560–1568. [Google Scholar] [CrossRef] [PubMed]
  26. Guinney, J.; Dienstmann, R.; Wang, X.; de Reyniès, A.; Schlicker, A.; Soneson, C.; Marisa, L.; Roepman, P.; Nyamundanda, G.; Angelino, P.; et al. The consensus molecular subtypes of colorectal cancer. Nat. Med. 2015, 21, 1350–1356. [Google Scholar] [CrossRef]
  27. Rejali, L.; Seifollahi Asl, R.; Sanjabi, F.; Fatemi, N.; Asadzadeh Aghdaei, H.; Saeedi Niasar, M.; Ketabi Moghadam, P.; Nazemalhosseini Mojarad, E.; Mini, E.; Nobili, S. Principles of Molecular Utility for CMS Classification in Colorectal Cancer Management. Cancers 2023, 15, 2746. [Google Scholar] [CrossRef] [PubMed]
  28. Frąckowiak, M.; Lewandowski, T.; Stelmasiak, P. Molecular subtypes of colorectal cancer as a potential prognostic and predictive factor in the selection of the optimal treatment strategy. Oncol. Clin. Pract. 2019, 15, 320–325. [Google Scholar] [CrossRef]
  29. da Costa, A.A.B.A.; D’Almeida Costa, F.; Ribeiro, A.R.; Guimarães, A.P.; Chinen, L.T.; Lopes, C.A.P.; de Lima, V.C.C. Low PTEN expression is associated with worse overall survival in head and neck squamous cell carcinoma patients treated with chemotherapy and cetuximab. Int. J. Clin. Oncol. 2014, 20, 282–289. [Google Scholar] [CrossRef]
  30. Yndestad, S.; Austreid, E.; Knappskog, S.; Chrisanthar, R.; Lilleng, P.K.; Lønning, P.E.; Eikesdal, H.P. High PTEN gene expression is a negative prognostic marker in human primary breast cancers with preserved p53 function. Breast Cancer Res. Treat. 2017, 163, 177–190. [Google Scholar] [CrossRef]
  31. Johnson, S.M.; Gulhati, P.; Rampy, B.A.; Han, Y.; Rychahou, P.G.; Doan, H.Q.; Weiss, H.L.; Evers, B.M. Novel expression patterns of PI3K/Akt/mTOR signaling pathway components in colorectal cancer. J. Am. Coll. Surg. 2010, 210, 767–776. [Google Scholar] [CrossRef] [PubMed]
  32. Malinowsky, K.; Nitsche, U.; Janssen, K.P.; Bader, F.G.; Späth, C.; Drecoll, E.; Keller, G.; Höfler, H.; Slotta-Huspenina, J.; Becker, K.F. Activation of the PI3K/AKT pathway correlates with prognosis in stage II colon cancer. Br. J. Cancer 2014, 110, 2081–2089. [Google Scholar] [CrossRef] [PubMed]
  33. Leiphrakpam, P.D.; Are, C. PI3K/Akt/mTOR Signaling Pathway as a Target for Colorectal Cancer Treatment. Int. J. Mol. Sci. 2024, 25, 3178. [Google Scholar] [CrossRef] [PubMed]
  34. Livak, K.J.; Schmittgen, T.D. Analysis of Relative Gene Expression Data Using Real-Time Quantitative PCR and the 2−ΔΔCT Method. Methods 2001, 25, 402–408. [Google Scholar] [CrossRef] [PubMed]
  35. Chandrashekar, D.S.; Bashel, B.; Balasubramanya, S.A.H.; Creighton, C.J.; Ponce-Rodriguez, I.; Chakravarthi, B.V.S.K.; Varambally, S. UALCAN: A Portal for Facilitating Tumor Subgroup Gene Expression and Survival Analyses. Neoplasia 2017, 19, 649–658. [Google Scholar] [CrossRef] [PubMed]
  36. Chandrashekar, D.S.; Karthikeyan, S.K.; Korla, P.K.; Patel, H.; Shovon, A.R.; Athar, M.; Netto, G.J.; Qin, Z.S.; Kumar, S.; Manne, U.; et al. UALCAN: An update to the integrated cancer data analysis platform. Neoplasia 2022, 25, 18–27. [Google Scholar] [CrossRef] [PubMed]
  37. Li, T.; Fu, J.; Zeng, Z.; Cohen, D.; Li, J.; Chen, Q.; Li, B.; Liu, X.S. TIMER2.0 for analysis of tumor-infiltrating immune cells. Nucleic Acids Res. 2020, 48, W509–W514. [Google Scholar] [CrossRef] [PubMed]
  38. Cerami, E.; Gao, J.; Dogrusoz, U.; Gross, B.E.; Sumer, S.O.; Aksoy, B.A.; Jacobsen, A.; Byrne, C.J.; Heuer, M.L.; Larsson, E.; et al. The cBio cancer genomics portal: An open platform for exploring multidimensional cancer genomics data. Cancer Discov. 2012, 2, 401–404. [Google Scholar] [CrossRef] [PubMed]
  39. Uhlen, M.; Zhang, C.; Lee, S.; Sjöstedt, E.; Fagerberg, L.; Bidkhori, G.; Benfeitas, R.; Arif, M.; Liu, Z.; Edfors, F.; et al. A pathology atlas of the human cancer transcriptome. Science 2017, 357, eaan2507. [Google Scholar] [CrossRef]
  40. Győrffy, B. Discovery and ranking of the most robust prognostic biomarkers in serous ovarian cancer. Geroscience 2023, 45, 1889–1898. [Google Scholar] [CrossRef]
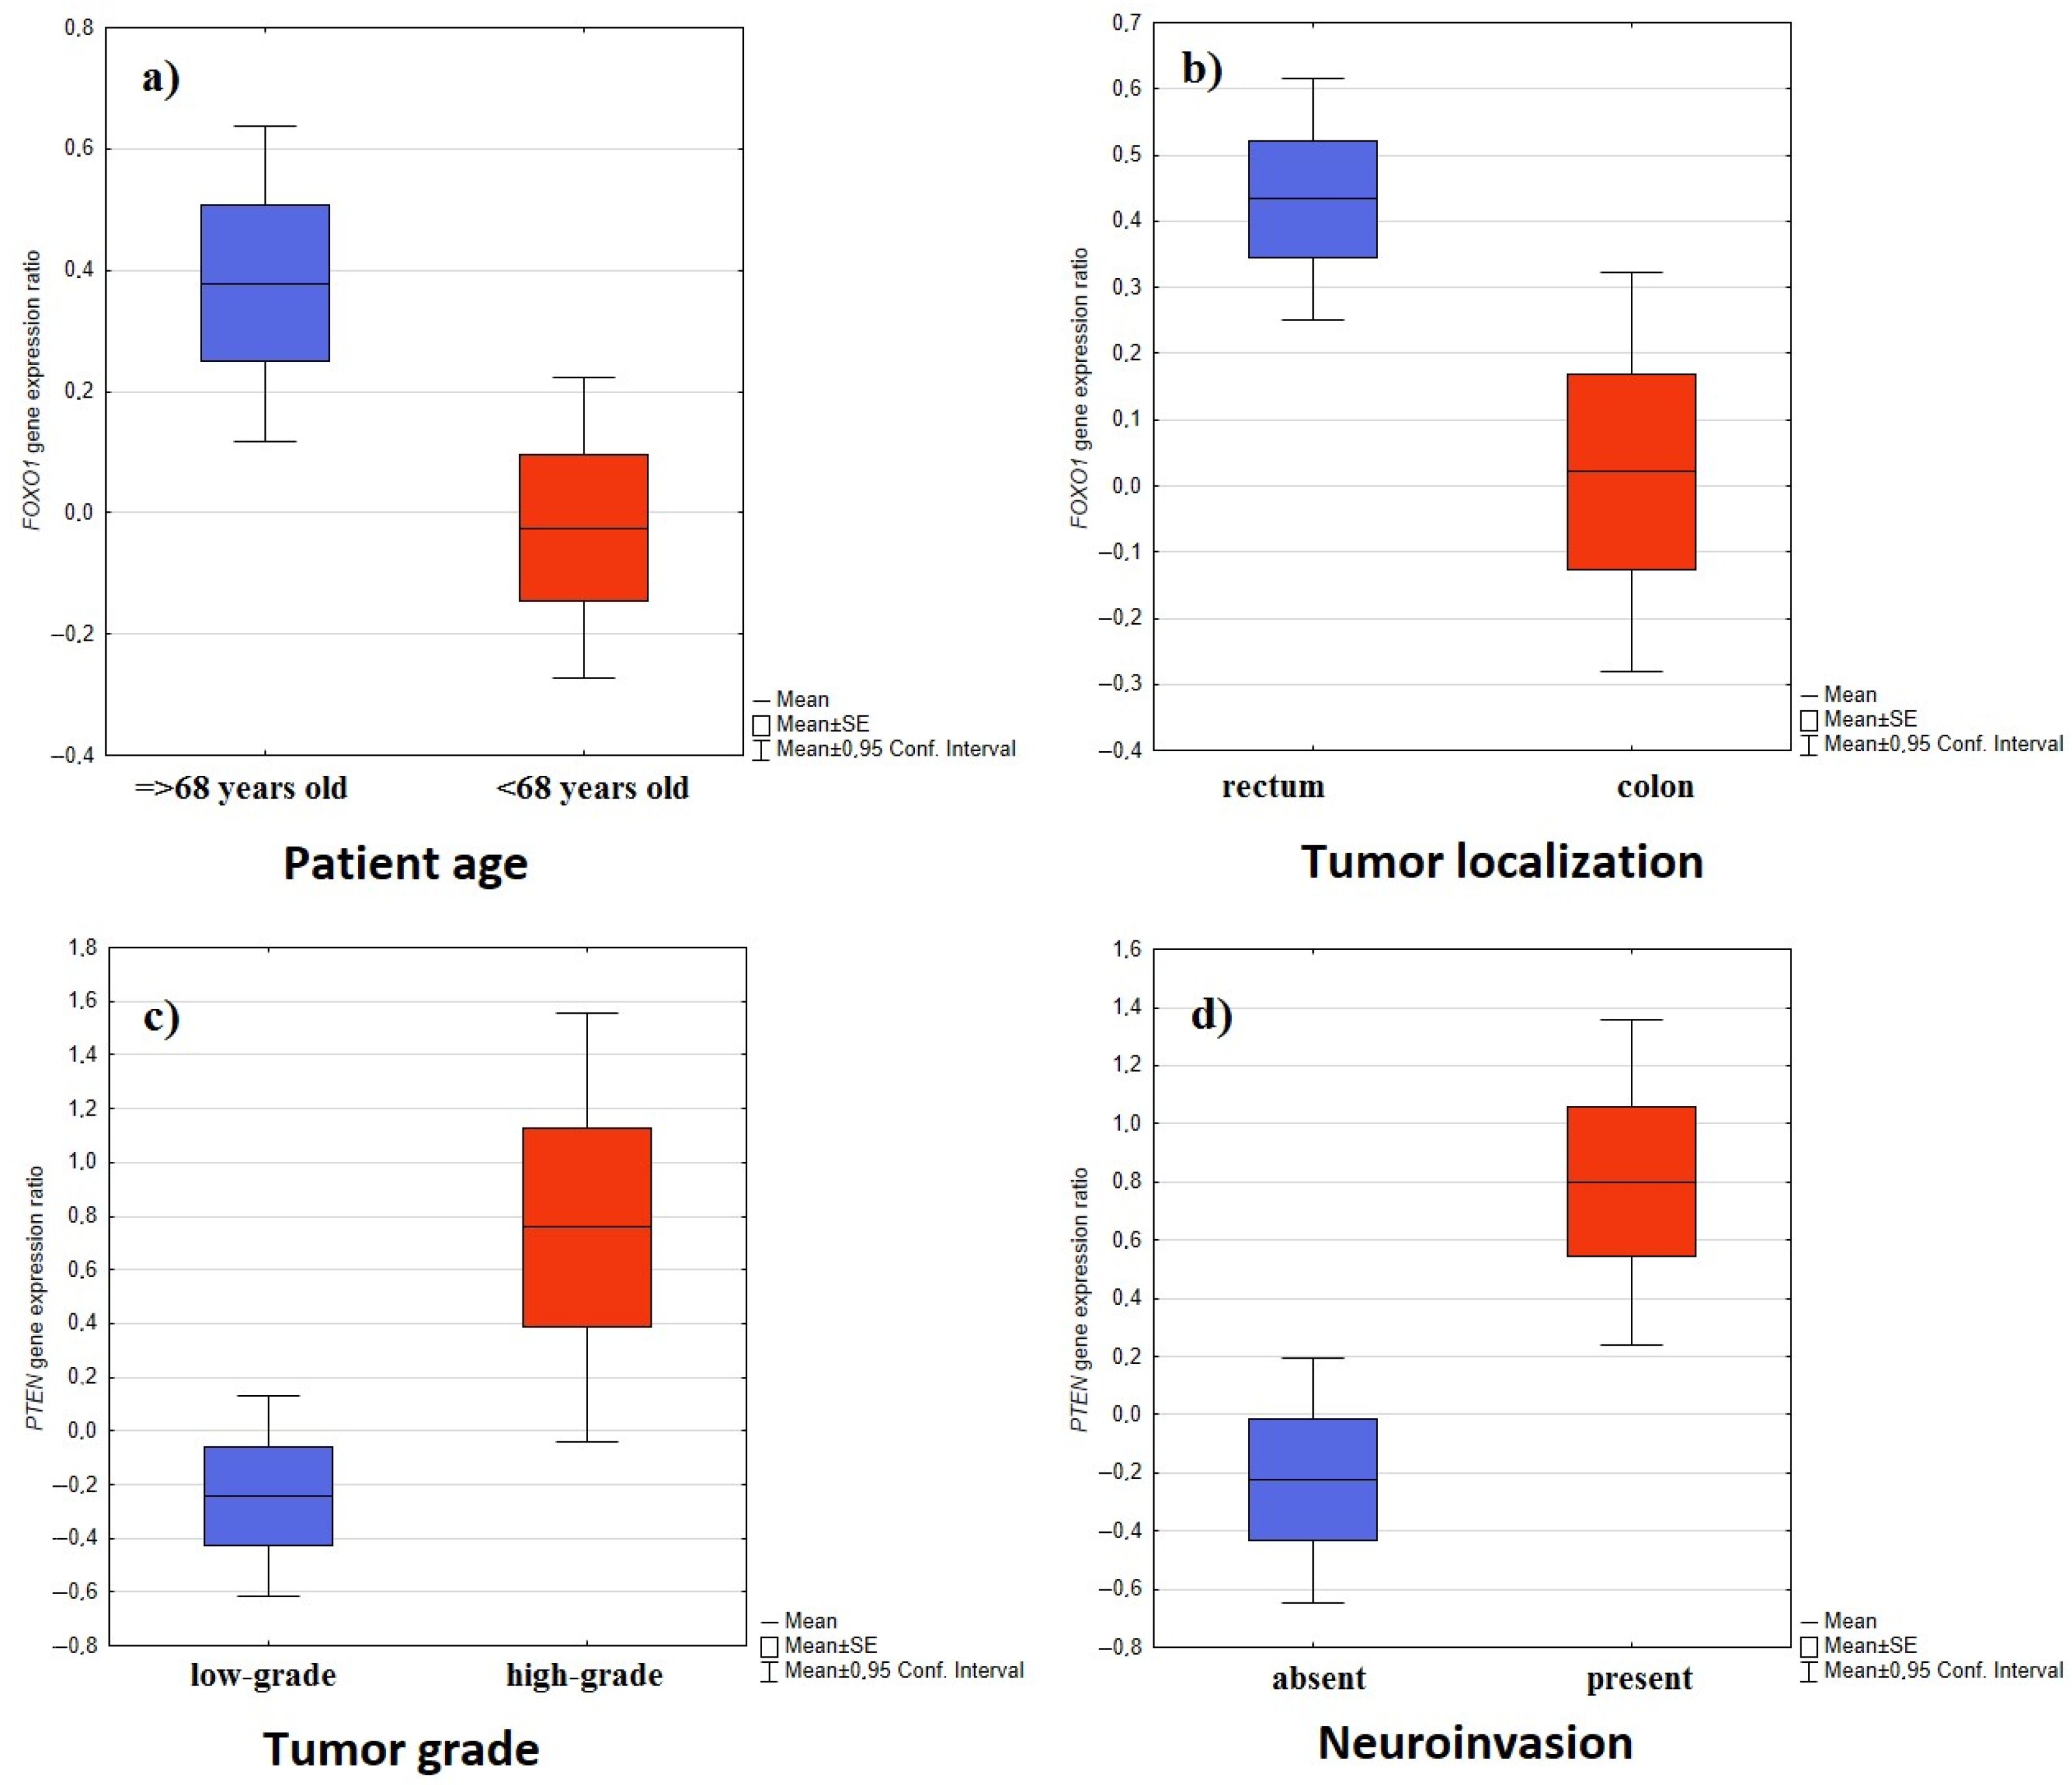
Figure 1. FOXO1 and PTEN gene expression values after BOX-COX transformation with regard to various clinicopathological and demographic features; (a) FOXO1 gene expression with regard to patient age; (b) FOXO1 gene expression with regard to tumor localization; (c) PTEN gene expression with regard to tumor grade; (d) PTEN gene expression with regard to the presence of neuroinvasion.
Ijms 25 05806 g001
Figure 2. Comparison of gene expression between colon tumor tissue and normal tissue; (a) FOXO1 gene expression in colon cancer tissue and normal tissue; (b) PTEN gene expression in colon cancer tissue and normal tissue.
Ijms 25 05806 g002
Figure 3. Comparison of gene expression between rectal tumor tissue and normal tissue; (a) FOXO1 gene expression in rectal cancer tissue and normal tissue; (b) PIK3CA gene expression in rectal cancer tissue and normal tissue; (c) PTEN gene expression in rectal cancer tissue and normal tissue.
Ijms 25 05806 g003
Figure 4. Comparison of protein expression level between tumor tissue and normal tissue; (a) PTEN, FOXO1, and PIK3CA protein expression in rectal adenocarcinoma and normal rectal tissue (Human Protein Atlas); (b) PTEN and FOXO1 protein expression in colon adenocarcinoma and normal colon tissue (Human Protein Atlas).
Ijms 25 05806 g004
Figure 5. Comparison of gene expression with regard to the presence or absence of mutations. p-values were calculated using the Wilcoxon test; (a) AKT1, FOXO1, mTOR (FRAP), PIK3CA, and PTEN expressions with regard to PIK3CA gene mutation (Mutant vs. Wild-type); (b) AKT1, FOXO1, mTOR (FRAP), PIK3CA, and PTEN expressions with regard to PTEN gene mutation (Mutant vs. Wild-type).
Ijms 25 05806 g005
Figure 6. Differences in the expression of PIK3CA, PTEN, AKT1, FOXO1, and FRAP (mTOR) genes in colorectal cancer tissue according to CMS. p-values were calculated using one-way ANOVA.
Ijms 25 05806 g006
Figure 7. Kaplan–Meier curves representing the relapse-free survival (RFS) and overall survival (OS) of colon cancer patients based on the expression of the PTEN and FRAP genes.
Ijms 25 05806 g007
Figure 8. Kaplan–Meier curves representing the relapse-free survival (RFS) and overall survival (OS) of colon cancer patients based on the expression of the PIK3CA, AKT1, and FOXO1 genes.
Ijms 25 05806 g008
Table 1. Characteristics of the study group.
CharacteristicCategoriesn (%)
SexMale31 (51.6)
Female29 (48.4)
Tumor localizationRectum29 (48.4)
Sigmoid colon13 (21.7)
Ascending colon5 (8.3)
Rectosigmoid junction4 (6.7)
Splenic flexure4 (6.7)
Hepatic flexure4 (6.7)
Tumor size (TNM)Tis1 (1.7)
T216 (26.7)
T330 (50.0)
T49 (15.0)
Missing4 (6.7)
Lymph node status (TNM)N033 (55.0)
N111 (18.3)
N212 (20.0)
Missing4 (6.7)
Distant Metastasis (TNM)M050 (83.3)
M16 (10.0)
Missing4 (6.7)
AJCC stageI16 (26.7)
II17 (28.3)
III17 (28.3)
IV6 (10.0)
Missing4 (6.7)
Tumor gradingLow-Grade44 (73.3)
High-Grade14 (23.4)
Missing2 (3.3)
Angioinvasion32 (53.3)
+24 (40.0)
Missing4 (6.7)
Neuroinvasion43 (71.7)
+13 (21.6)
Missing4 (6.7)
Table 2. TaqMan probes and primers used in qPCR.
Gene SymbolAssay IDDye
GAPDHHs02758991_g1FAM
ACTBHs01060665_g1VIC
PIK3CAHs00907957_m1FAM
PTENHs02621230_s1FAM
FOXO1Hs00231106_m1VIC
FRAPHs00234508_m1VIC
Disclaimer/Publisher’s Note: The statements, opinions and data contained in all publications are solely those of the individual author(s) and contributor(s) and not of MDPI and/or the editor(s). MDPI and/or the editor(s) disclaim responsibility for any injury to people or property resulting from any ideas, methods, instructions or products referred to in the content.