Article

Genome-Wide Analysis of BBX Gene Family in Three Medicago Species Provides Insights into Expression Patterns under Hormonal and Salt Stresses

1
Key Laboratory of Xinjiang Phytomedicine Resource and Utilization of Ministry of Education, Xinjiang Production and Construction Corps Key Laboratory of Oasis Town and Mountain-Basin System Ecology, College of Life Sciences, Shihezi University, Shihezi 832003, China
2
School of Natural Sciences, Massey University, Tennent Drive, Palmerston North 4474, New Zealand
*
Authors to whom correspondence should be addressed.
These authors contributed equally to this work.
Int. J. Mol. Sci. 2024, 25(11), 5778; https://doi.org/10.3390/ijms25115778
Submission received: 10 May 2024 / Revised: 23 May 2024 / Accepted: 24 May 2024 / Published: 26 May 2024
(This article belongs to the Section Molecular Plant Sciences)

Abstract

:
BBX protein is a class of zinc finger transcription factors that have B-box domains at the N-terminus, and some of these proteins contain a CCT domain at the C-terminus. It plays an important role in plant growth, development, and metabolism. However, the expression pattern of BBX genes in alfalfa under hormonal and salt stresses is still unclear. In this study, we identified a total of 125 BBX gene family members by the available Medicago reference genome in diploid alfalfa (Medicago sativa spp. Caerulea), a model plant (M. truncatula), and tetraploid alfalfa (M. sativa), and divided these members into five subfamilies. We found that the conserved motifs of BBXs of the same subfamily reveal similarities. We analyzed the collinearity relationship and duplication mode of these BBX genes and found that the expression pattern of BBX genes is specific in different tissues. Analysis of the available transcriptome data suggests that some members of the BBX gene family are involved in multiple abiotic stress responses, and the highly expressed genes are often clustered together. Furthermore, we identified different expression patterns of some BBX genes under salt, ethylene, salt and ethylene, salicylic acid, and salt and salicylic acid treatments, verified by qRT-PCR, and analyzed the subcellular localization of MsBBX2, MsBBX17, and MsBBX32 using transient expression in tobacco. The results showed that BBX genes were localized in the nucleus. This study systematically analyzed the BBX gene family in Medicago plants, which provides a basis for the study of BBX gene family tolerance to abiotic stresses.

1. Introduction

Eukaryotic organisms always combine with multiple protein factors to co-regulate the transcription process. Zinc finger transcription factor is one of the largest families of transcription factors in eukaryotes, which can be divided into several subfamilies according to the structure and function of its members. B-box (BBX) is one of the subfamilies, and it is an important factor in the regulation of plant growth and development. BBX proteins have one or two B-box domains at the N-terminus of the protein, with the domain containing a zinc-binding motif [1], and the C-terminus is often accompanied by a CCT domain (for CONSTANS, CO-LIKE, TOC1 domain) [2,3]. During evolution, segmental duplication and gene deletion have led to variability among the BBX gene family [4,5,6]; this enriches the family’s genetic function.
In recent years, the BBX gene family has attracted much attention due to its diverse functions. Studies have been carried out on the model plants Arabidopsis [7], tomato [8], rice [9], cotton [10], grape [11], and other species. BBX is involved in plant photomorphogenesis [12], stomatal opening movement [13], floral development [14], and various abiotic stress responses such as drought, heat, and salt [8,15,16]. The B-box conserved domain in BBX proteins interacts with other proteins to perform photomorphogenic building functions [7]. In Arabidopsis, AtBBX25 regulates photomorphogenesis in seedlings by interacting with ELONGATED HYPOCOTYL5 (HY5), and co-regulates the plant de-etiolation process and shade avoidance response with its homologue gene AtBBX24 [17,18]. The AtBBX24 gene not only can play a negative regulatory role in the blue light signaling pathway, but also binds to an H-protein promoter binding factor (HPPBF-1), which contains sequences encoding Myb DNA-binding motifs that are involved in plant defense stress responses [16,19,20,21]. In apple, MdBBX37 inhibits HY5 expression and relieves growth inhibition of hypocotyls [22].
Abiotic stress is a major obstacle that inhibits plant growth and development, limits crop yield enhancement, and impairs plant photosynthesis [23]. Plants have developed various strategies to adapt to such stresses [24]. In Arabidopsis, the AtBBX5 gene is regulated by ABA, mannitol, and salt induction. Overexpression of AtBBX5 regulates ABA biosynthesis and metabolism-related gene transcript levels, which is a positive modulation of abiotic stress tolerance in plants through the ABA metabolic regulatory pathway [2]. The expression level of the MdBBX10 gene was significantly increased by salt induction. Overexpression of the MdBBX10 gene significantly enhanced tolerance to abiotic stress in A. thaliana [25,26]. MdBBX37 enhanced cold tolerance in plants by mediating the jasmonic acid metabolic pathway [27]. In grapes, VvBBX15a, VvBBX15b, and VvBBX22b expression levels were dramatically up-regulated by ethylene (ETH), methyl jasmonate (MeJA), and salicylic acid (SA) [11]. In tomatoes, SlBBXs are induced and regulated by hormones such as auxin (IAA), gibberellin (GA), ETH, SA, and 6-BA [8]. Several studies have shown that the application of ethylene or salicylic acid can resist the damage caused by abiotic stresses to the plant itself. Ethylene participates in plant secondary metabolism, regulates photosynthesis and stomatal opening and closing, promotes chlorophyll degradation [28,29], and relieves the inhibition of seed germination by salt stress [30]. Salicylic acid can affect plant growth and development by participating in water metabolism, nutrient absorption, and the promotion of photosynthesis [31] to improve plant tolerance to abiotic stresses. However, BBX in Medicago plants in response to phytohormones and stress tolerance has rarely been reported.
Alfalfa (Medicago sativa L.) is one of the most widely grown perennial legume plants, abundant in vitamins, proteins, and minerals, low in calories, and high in productivity, and has excellent grass quality. It is an economic crop that can potentially improve global food security [32]. Improving its resistance is extremely critical to global ecosystems and sustainable agriculture. Perennial herbaceous autotetraploid alfalfa (M. sativa, 2n = 4x = 32) has a complex genome that is difficult to assemble [33]. However, genomic data on diploid alfalfa (Medicago sativa spp. Caerulea, 2n = 2x = 16) have been released in recent years. Diploid alfalfa, the progenitor of autotetraploid alfalfa, is more complete and could be an essential addition to the tetraploid alfalfa genome. Diploid alfalfa diverged from M. truncatula (2n = 16) about 5.2 million years ago, and chromosomal mutations have occurred during the process of differentiation [34].
In order to explore the function of the BBX gene family in Medicago plants more systematically and adequately, the genomic data of diploid alfalfa [34], M. truncatula [35], and M. sativa [33] were selected as the database of this study. We performed a genome-wide characterization of the BBX family in Medicago plants. Further, we analyzed the evolutionary relationship, gene structure, chromosomal localization and collinearity of the family members. Based on the published transcriptome data, the gene expression patterns in different tissues and under various abiotic stress treatments in alfalfa were also analyzed. Some BBX genes were selected for qRT-PCR expression analysis and subcellular localization identification to clarify the specific location of the family member exercising functions in the alfalfa. The results of this study provide clues for further exploring the specific functions of BBX in Medicago plants and provide candidate genes and the theoretical basis for molecular breeding efforts in highly stress-resistant alfalfa.

2. Results

2.1. Identification of BBX Genes

To deeply investigate the function of BBX genes, we downloaded the genome data files of three types of Medicago plants (M. sativa spp. Caerulea, M. truncatula, and M. sativa) from public databases. We identified a total of 125 members of the BBX family including 21 MaBBX genes, 25 MtBBX genes, and 79 MsBBX genes. All of these members have typical B-box conserved domains in the BBX family, which were named according to the order of chromosomal localization. We counted the detailed information of the 125 BBX genes (Table S1), including gene ID, gene name, chromosomal distribution, isoelectric point (pI), molecular weight (MW), number of amino acids (aa), instability index (II), aliphatic index (AI), grand average of hydrophobicity (GRAVY), and predicted position of subcellular localization.
The results showed that the number of amino acid sequences and MW of these BBX proteins spanned a wide range (Table S1). It ranged from a minimum of 79 aa and 9.04 kDa (MsBBX63) to a maximum of 521 aa and 57.572 kDa (MtBBX7). Only MsBBX63 and MtBBX10 protein-coding sequences were below 100 aa, while the only member above 500 aa was MtBBX7. Subsequently, the isoelectric points (pIs) of these BBXs were studied (Table S1). There are 100 BBX members with a pI lower than 7, ranging from 4.28 (MaBBX18) to 6.93 (MsBBX73). It is considered to be an acidic protein. The other 25 BBXs have pIs higher than 7, ranging from 7.02 to 9.74 (MsBBX63, MsBBX40, MsBBX53, MsBBX29, MsBBX30, MsBBX36, MaBBX10, MtBBX12, MsBBX43, MsBBX47, MaBBX14, MsBBX55, MsBBX57, MsBBX59, MsBBX61, MtBBX20, MsBBX42, MsBBX45, MsBBX49, MsBBX50, MsBBX51, MtBBX15, MaBBX16, MtBBX16, and MsBBX7), and are essentially basic proteins. Finally, the BBX protein members were analyzed by the instability index (Table S1). The results showed that only MsBBX63 and MtBBX10 were judged as stable proteins with instability index values less than 40. The other 123 BBXs were unstable proteins. The aliphatic index was distributed between 51.36 (MsBBX27) and 87.72 (MsBBX63), indicating that the thermal stability of these proteins was varied. All these BBX proteins had negative GRAVY values, showing that these proteins are hydrophilic. Based on Cell-PLoc server prediction, 125 BBX proteins were localized in the nucleus (Table S1).

2.2. Phylogenetic Analysis of BBX Proteins

To determine the evolutionary relationship of BBX family genes, we integrated a total of 125 full-length amino acid sequences of BBX proteins and constructed a phylogenetic tree based on 1000 bootstrap replications with the neighbor-joining method in the MEGA 10.2.6 software (Figure 1). According to our results, BBX members were clustered into five subfamilies based on evolutionary relationships. Among them, subfamily I contained 44 BBXs, forming the largest cluster. Subclade IV comprised the lowest number of BBXs, only 11. The remaining subclades II, III, and V contain 20, 26, and 24 members of BBX, respectively. The amino acid sequences of each subfamily share similarities and each BBX contains a B-box domain. Among them, most members of subfamilies I, III and V contain two B-box domains. Almost all subclade III, IV, and V members possess CCT domains. In particular, both clades II and IV contain only two MaBBXs, which are more clustered in the other subclades. Subclades II, III, and V contained five MtBBXs, suggesting a more average evolutionary distribution of MtBBXs. According to the evolutionary clustering relationship, it can be seen that diploid alfalfa MaBBXs evolved closely with tetraploid alfalfa MsBBXs.

2.3. Conserved Motif, Domains, and Gene Structure Analysis of BBX Genes

We analyzed the motif, domain, and exon–intron structural composition of 125 BBX sequences (Figure S1). Based on phylogenetic relationships, the 125 BBX family members were grouped into five subfamilies (Figure S1A). A total of 10 motifs were identified by the MEME algorithm (Figure S1B). The motif composition of each subfamily was different, and most members of the same subfamily showed similar motif structures. The complete B-box 1 domain usually consists of motif 1 and motif 5, the B-box 2 domain consists of motif 3, and the CCT domain consists of motif 2. In subclade I, BBX genes mostly contain B-box 1 and B-box 2 domains. Most members of clade II contain only the B-box 1 domain. Subclade III basically contains B-box 1, B-box 2, and CCT domains. Subclade IV contains B-box 1 and CCT domains. Clade V contains two B-box and CCT domains (Figure S1C). All BBXs contained the B-box 1 domain, and 84 BBX members contained the B-box 2 domain, accounting for 67.2% of all BBX proteins; 57 BBXs contained CCT structural domains, accounting for 45.6%. In particular, in clade V, five members (MsBBX65, MsBBX68, MsBBX69, MsBBX72, MtBBX22) contained two identical B-box 1 structural domains. The large number of duplications of this domain during evolution suggests that this domain has special significance in the regulation of certain physiological functions.
Based on the exon analysis, the number of exons in the BBX genes was more diverse (Figure S1D), ranging from one to seven. Among the BBX genes that clustered more similarly, their exon–intron structures were similar. Among these genes, 9, 37, 49, 23, and 5 BBX members contained 1–5 exon structures, accounting for 7.2%, 29.6%, 39.2%, 18.4%, and 4% of all BBXs, respectively. Only MaBBX16 contained six exons, accounting for 0.8%. MtBBX7 contained seven exons, which was the gene with the most exons in the BBX gene family, accounting for 0.8%. Overall, BBX members in the same subfamily show similar evolutionary patterns, and BBX genes are usually conserved in evolution.

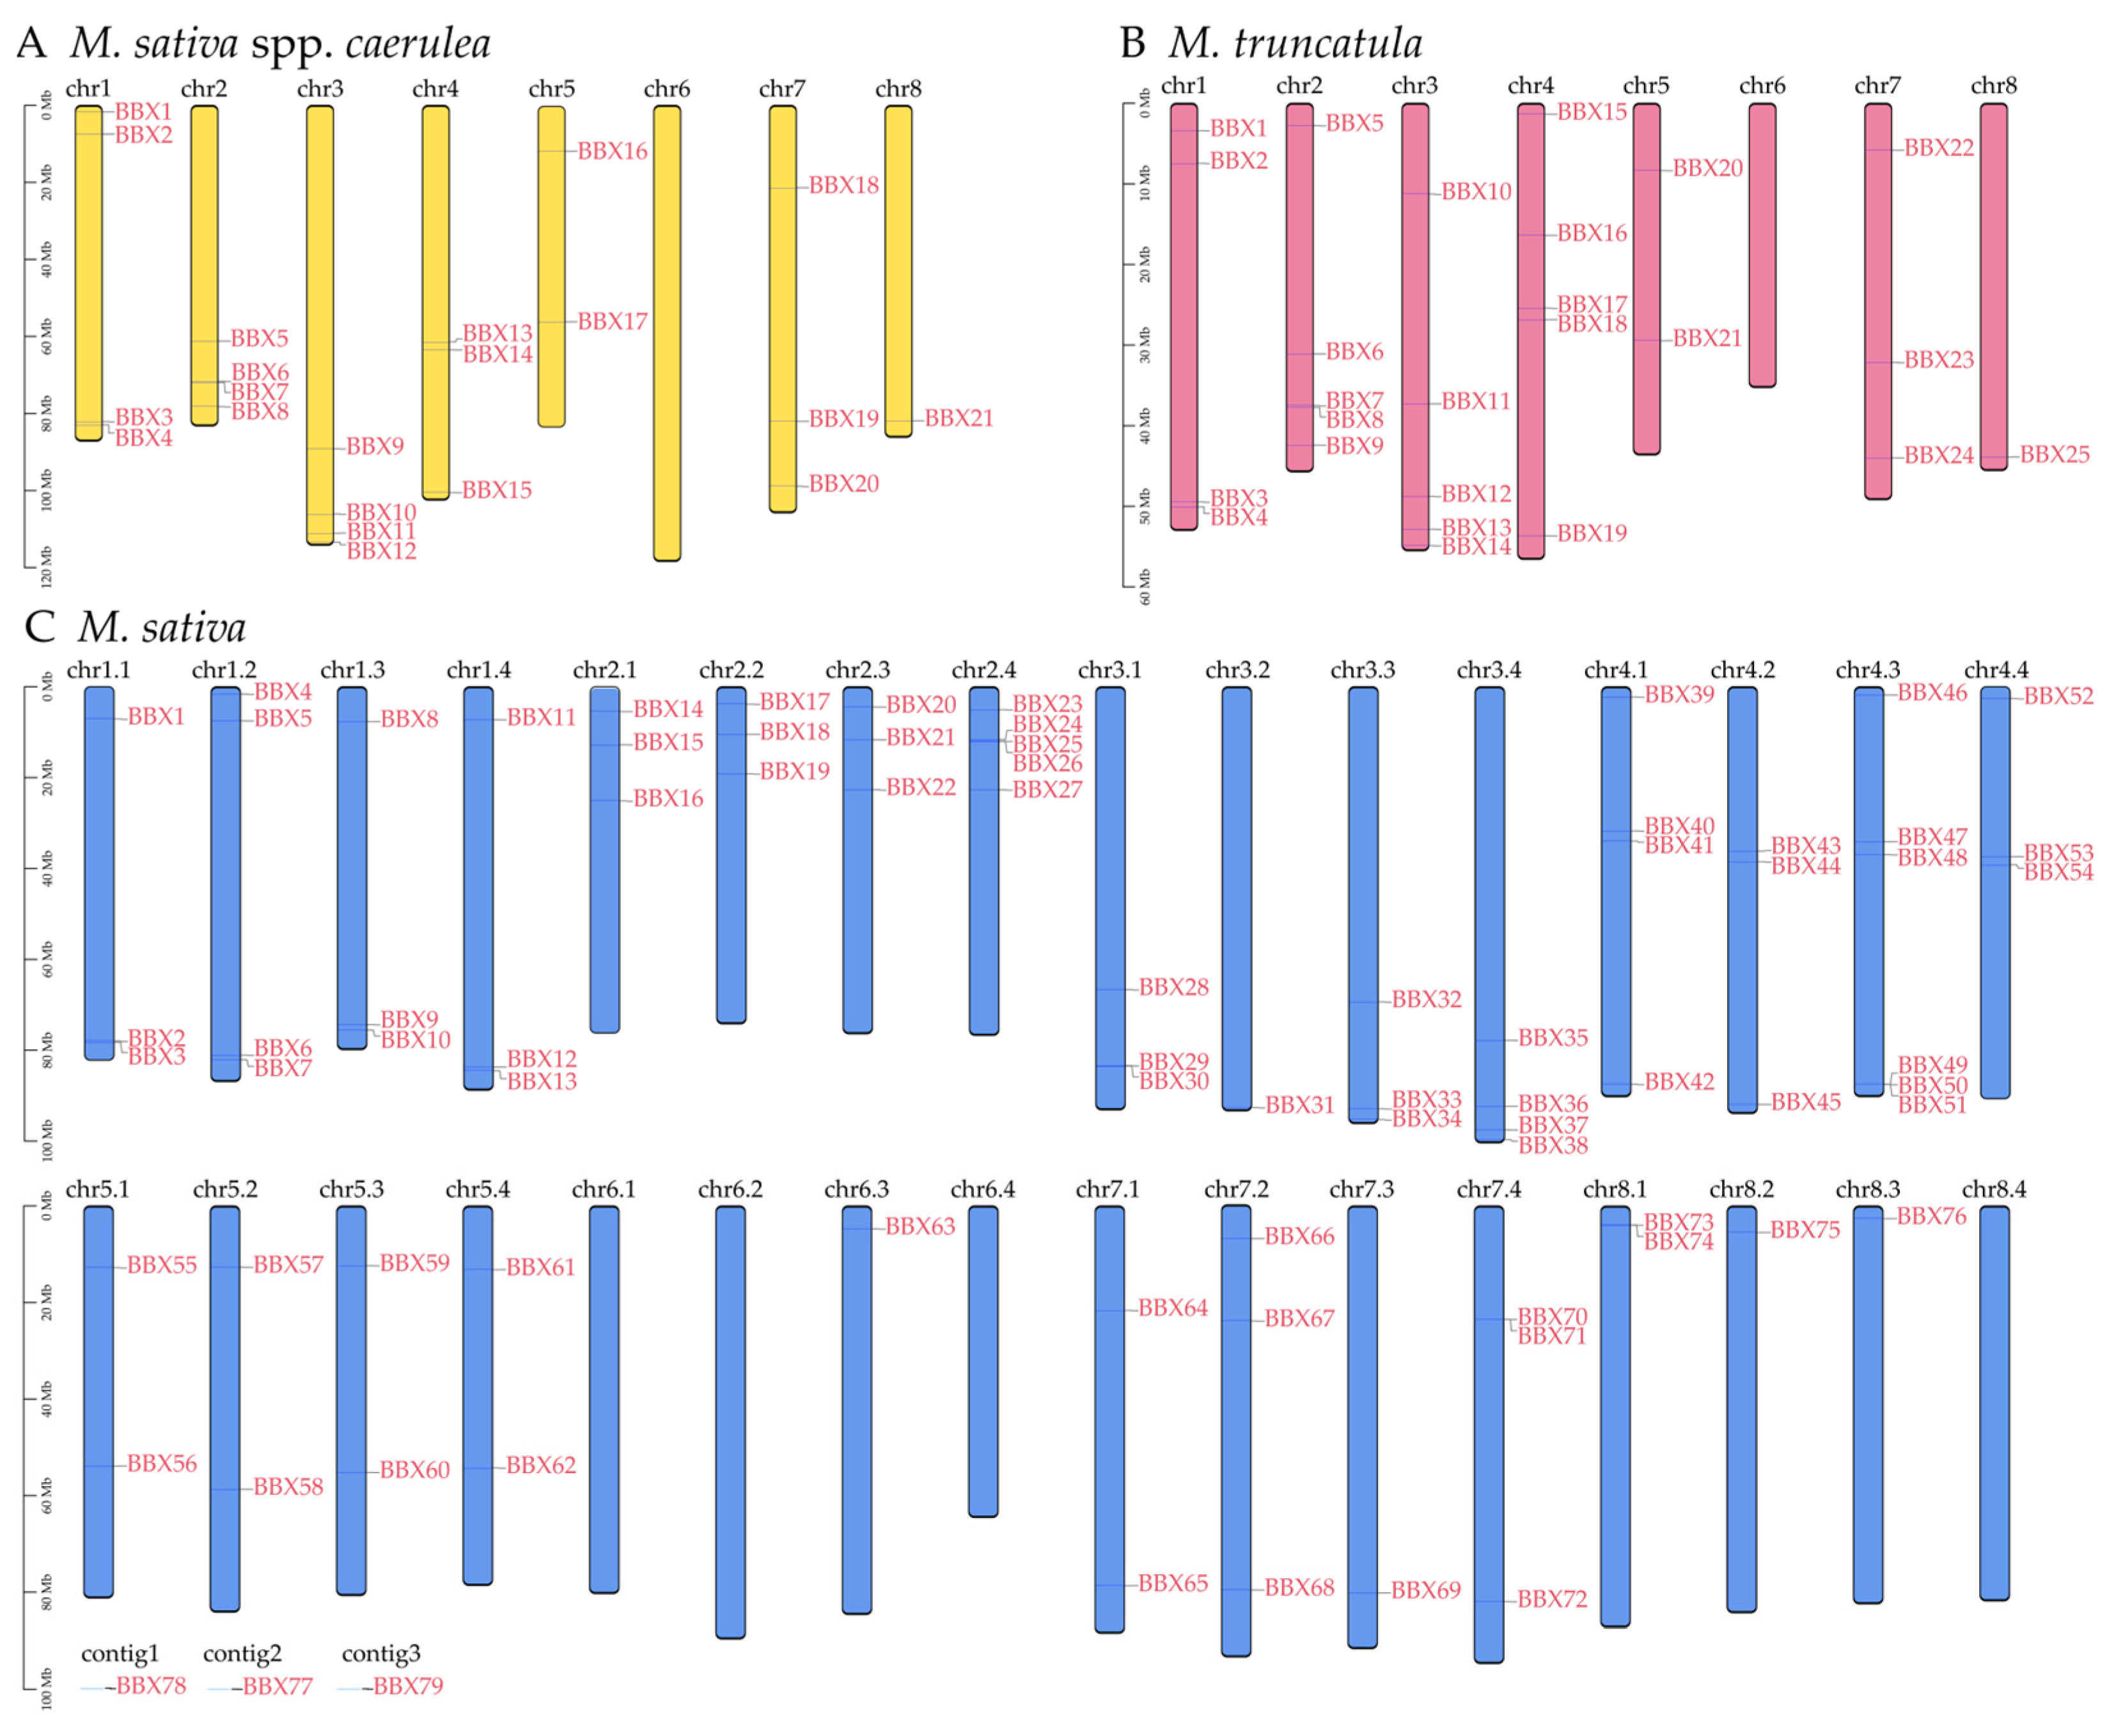
2.4. Chromosomal Localization Analysis of BBX

To understand the position of BBX genes, we analyzed the chromosomal localization of the BBX genes (Figure 2). The BBX genes were unevenly scattered on each chromosome, and the number of BBX distributions across each chromosome was not directly related to the length of the chromosome. In diploid alfalfa (M. sativa spp. Caerulea), MaBBXs were distributed over all chromosomes except chr6 (Figure 2A). Chr1, chr2, and chr3 all had four MaBBX genes. Chr4 and chr7 each had three MaBBX genes distributed. Chr5 had two MaBBX genes distributed. Chr8 had only MaBBX21 distribution. Similarly, within the genome of M. truncatula, 25 MtBBXs were unevenly distributed over the other seven chromosomes, except on chromosome 6 (Figure 2B). Among them, five MtBBX genes were found on chr2, chr3, and chr4. Four, two, three, and one MtBBX genes were found on chr1, chr5, chr7, and chr8, respectively.
In M. sativa, 76 MsBBX genes were distributed over chromosomes, and three genes, MsBBX77, MsBBX78, and MsBBX79, were present in contig1, contig2, and contig3 (Figure 2C). Six genes (MsBBX46-51) were distributed over chr4.3, which is the chromosome with the highest distribution of MsBBXs. Five genes (MsBBX23–27) were localized on chr2.4. Four MsBBXs were localized on chr1.2, chr3.4, and chr4.1. There were 12 chromosomes that had three MsBBXs localized; they were chr1.1, chr1.3, chr1.4, chr2.1, chr2.2, chr2.3, chr3.1, chr3.3, chr4.2, chr4.4, chr7.2, and chr7.4. Two MsBBX genes were localized on chr5.1–5.4, chr7.1, and chr8.1, while on five chromosomes, only one MsBBX was localized; they were chr3.2 (MsBBX31), chr6.3 (MsBBX63), chr7.3 (MsBBX69), chr8.2 (MsBBX75), and chr8.3 (MsBBX76). Four of the chromosomes also had no MsBBX distribution: chr6.1, chr6.2, chr6.4, and chr8.4. In particular, on chr6.1 to 6.4, only MsBBX63 was present, which may be an independently evolved gene that has undergone unique selective pressure compared to the other MsBBXs.

2.5. Analysis of the Synteny and Gene Duplication Event of the BBXs

We calculated the collinearity, GC content, and gene density within the genomes of the three Medicago plants and mapped the Circos plots (Figure 3). A total of 116 pairs of BBX genes were found to have a collinear relationship from the genome database (Table S2). Among them, there were five homologous gene pairs in M. sativa spp. Caerulea and M. truncatula. Next, we calculated the non-synonymous (Ka) and synonymous substitution (Ks) and the ratio of Ka/Ks for all gene pairs to analyze the selective pressure on the evolution of the family. The results showed that Ka/Ks values ranged from 0.023 to 1.172, indicating that most members of the BBX family experienced strong purifying selection and had different evolutionary rates. Only two gene pairs in M. sativa (MsBBX31 and MsBBX38, MsBBX39 and MsBBX52) had Ka/Ks ratios greater than one, meaning that these two pairs of homologous genes have experienced strong positive selection and they were rapidly evolving genes. The evolution of these two pairs of genes has extremely significant biological implications in this gene family.
We analyzed these 125 BBX family genes for duplication events (Table S3). The results showed that there were no tandem duplication events of M. sativa spp. Caerulea and M. truncatula, whereas eight members of each were duplicated by WGD or segmental duplications to expand the family members; 13 and 16 genes, respectively, were duplicated by dispersed duplications. In particular, only MtBBX15 is a singleton gene. Dispersed duplications are the main evolutionary pattern for MaBBX and MtBBX genes. However, analysis of BBX family genes of M. sativa revealed a more diverse pattern of gene amplification. Two genes (MsBBX63, MsBBX78) were dispersed duplications (2.53%). Three genes (MsBBX50, MsBBX51, MsBBX71) were tandem duplication events (3.80%). Four genes (MsBBX25, MsBBX26, MsBBX30, MsBBX74) were proximal distributions (5.06%). The remaining 70 genes were WGD or segmental duplications, accounting for 88.61%. These findings show that the main cause of gene expansion in alfalfa is WGD or segmental duplications. In addition, we also performed collinearity analysis on BBX members among three Medicago plants separately (Figure 4). There were 29 collinearity gene pairs calculated between MaBBX and MtBBX genes; 101 gene pairs between MaBBX and MsBBX genes; and 105 gene pairs between MtBBXs and MsBBXs. We found that diploid alfalfa and M. truncatula genes can be mapped to 1–4 tetraploid alfalfa genes, suggesting that Medicago plant’s evolution may be a fourfold replication process.

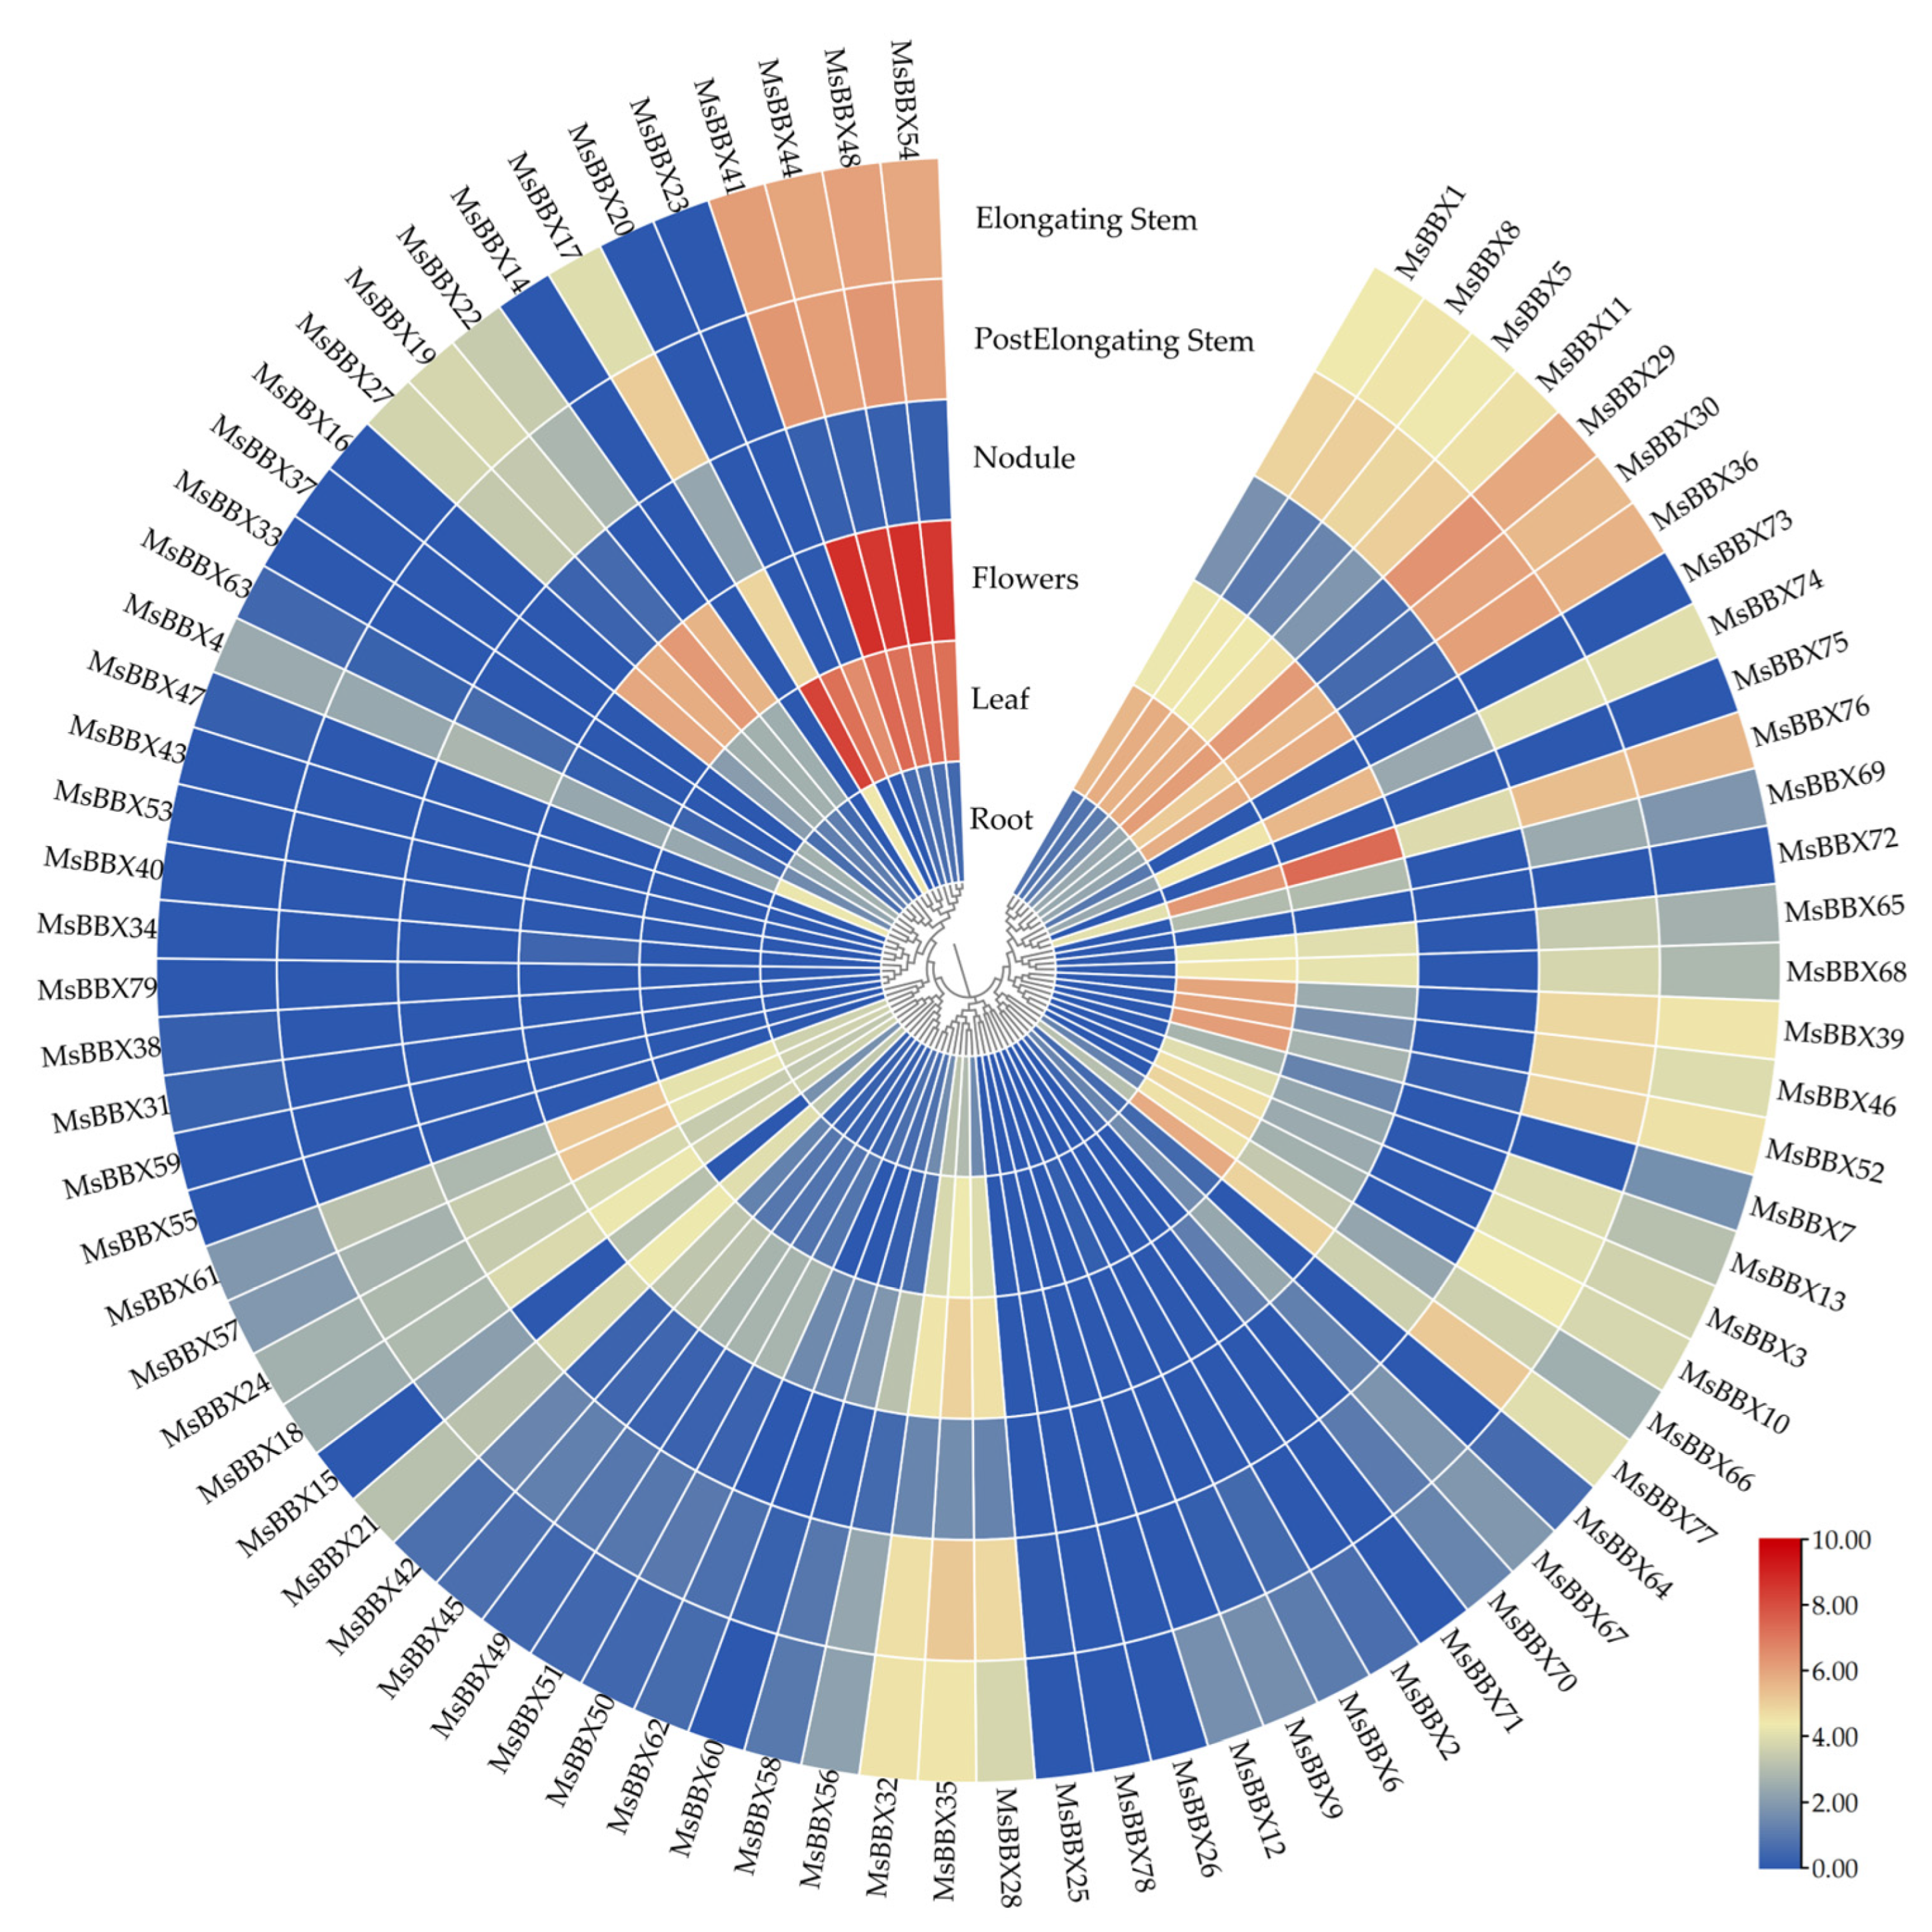
2.6. Expression Patterns of BBX Genes in Different Tissues

A heat map was constructed (Figure 5) using the public database of M. sativa in six different developmental tissues (roots, leaves, flowers, nitrogen-fixing root nodules, elongating stem internodes, and post-elongation stem internodes). The data results showed that the spatiotemporal expression patterns of these MsBBX genes were different in the various tissues.
In the flowering organs, most of the BBXs were expressed at a high level, especially MsBBX41, MsBBX44, MsBBX48, and MsBBX54. These BBXs may be involved in the developmental and metabolic regulatory processes of plant floral organs and play important roles. The levels of expression for MsBBX41, MsBBX44, and MsBBX48 were also significantly higher than other BBX genes in leaves, elongating stem internodes, and post-elongating stem internodes. They clustered in the same evolutionary branch (Figure 1), which may possess similar functions in regulating plant development. In contrast, the gene expression was maintained at a lower threshold in roots and nitrogen-fixing root nodules. MsBBX17, the most highly expressed gene in roots, was approximately 1/21 of the most highly expressed gene in floral organs. The highest expressed gene in nodules, MsBBX76, was expressed lower than MsBBX17 in roots. In addition, 11 genes (MsBBX14, MsBBX26, MsBBX43, MsBBX53, MsBBX55, MsBBX59, MsBBX71, MsBBX72, MsBBX75, MsBBX78, MsBBX79) were not expressed in any of these tissues. Significant gene expression differences in different tissues demonstrated that these family genes have a strong tissue-specific expression pattern, and they are involved in different alfalfa growth and developmental stages.

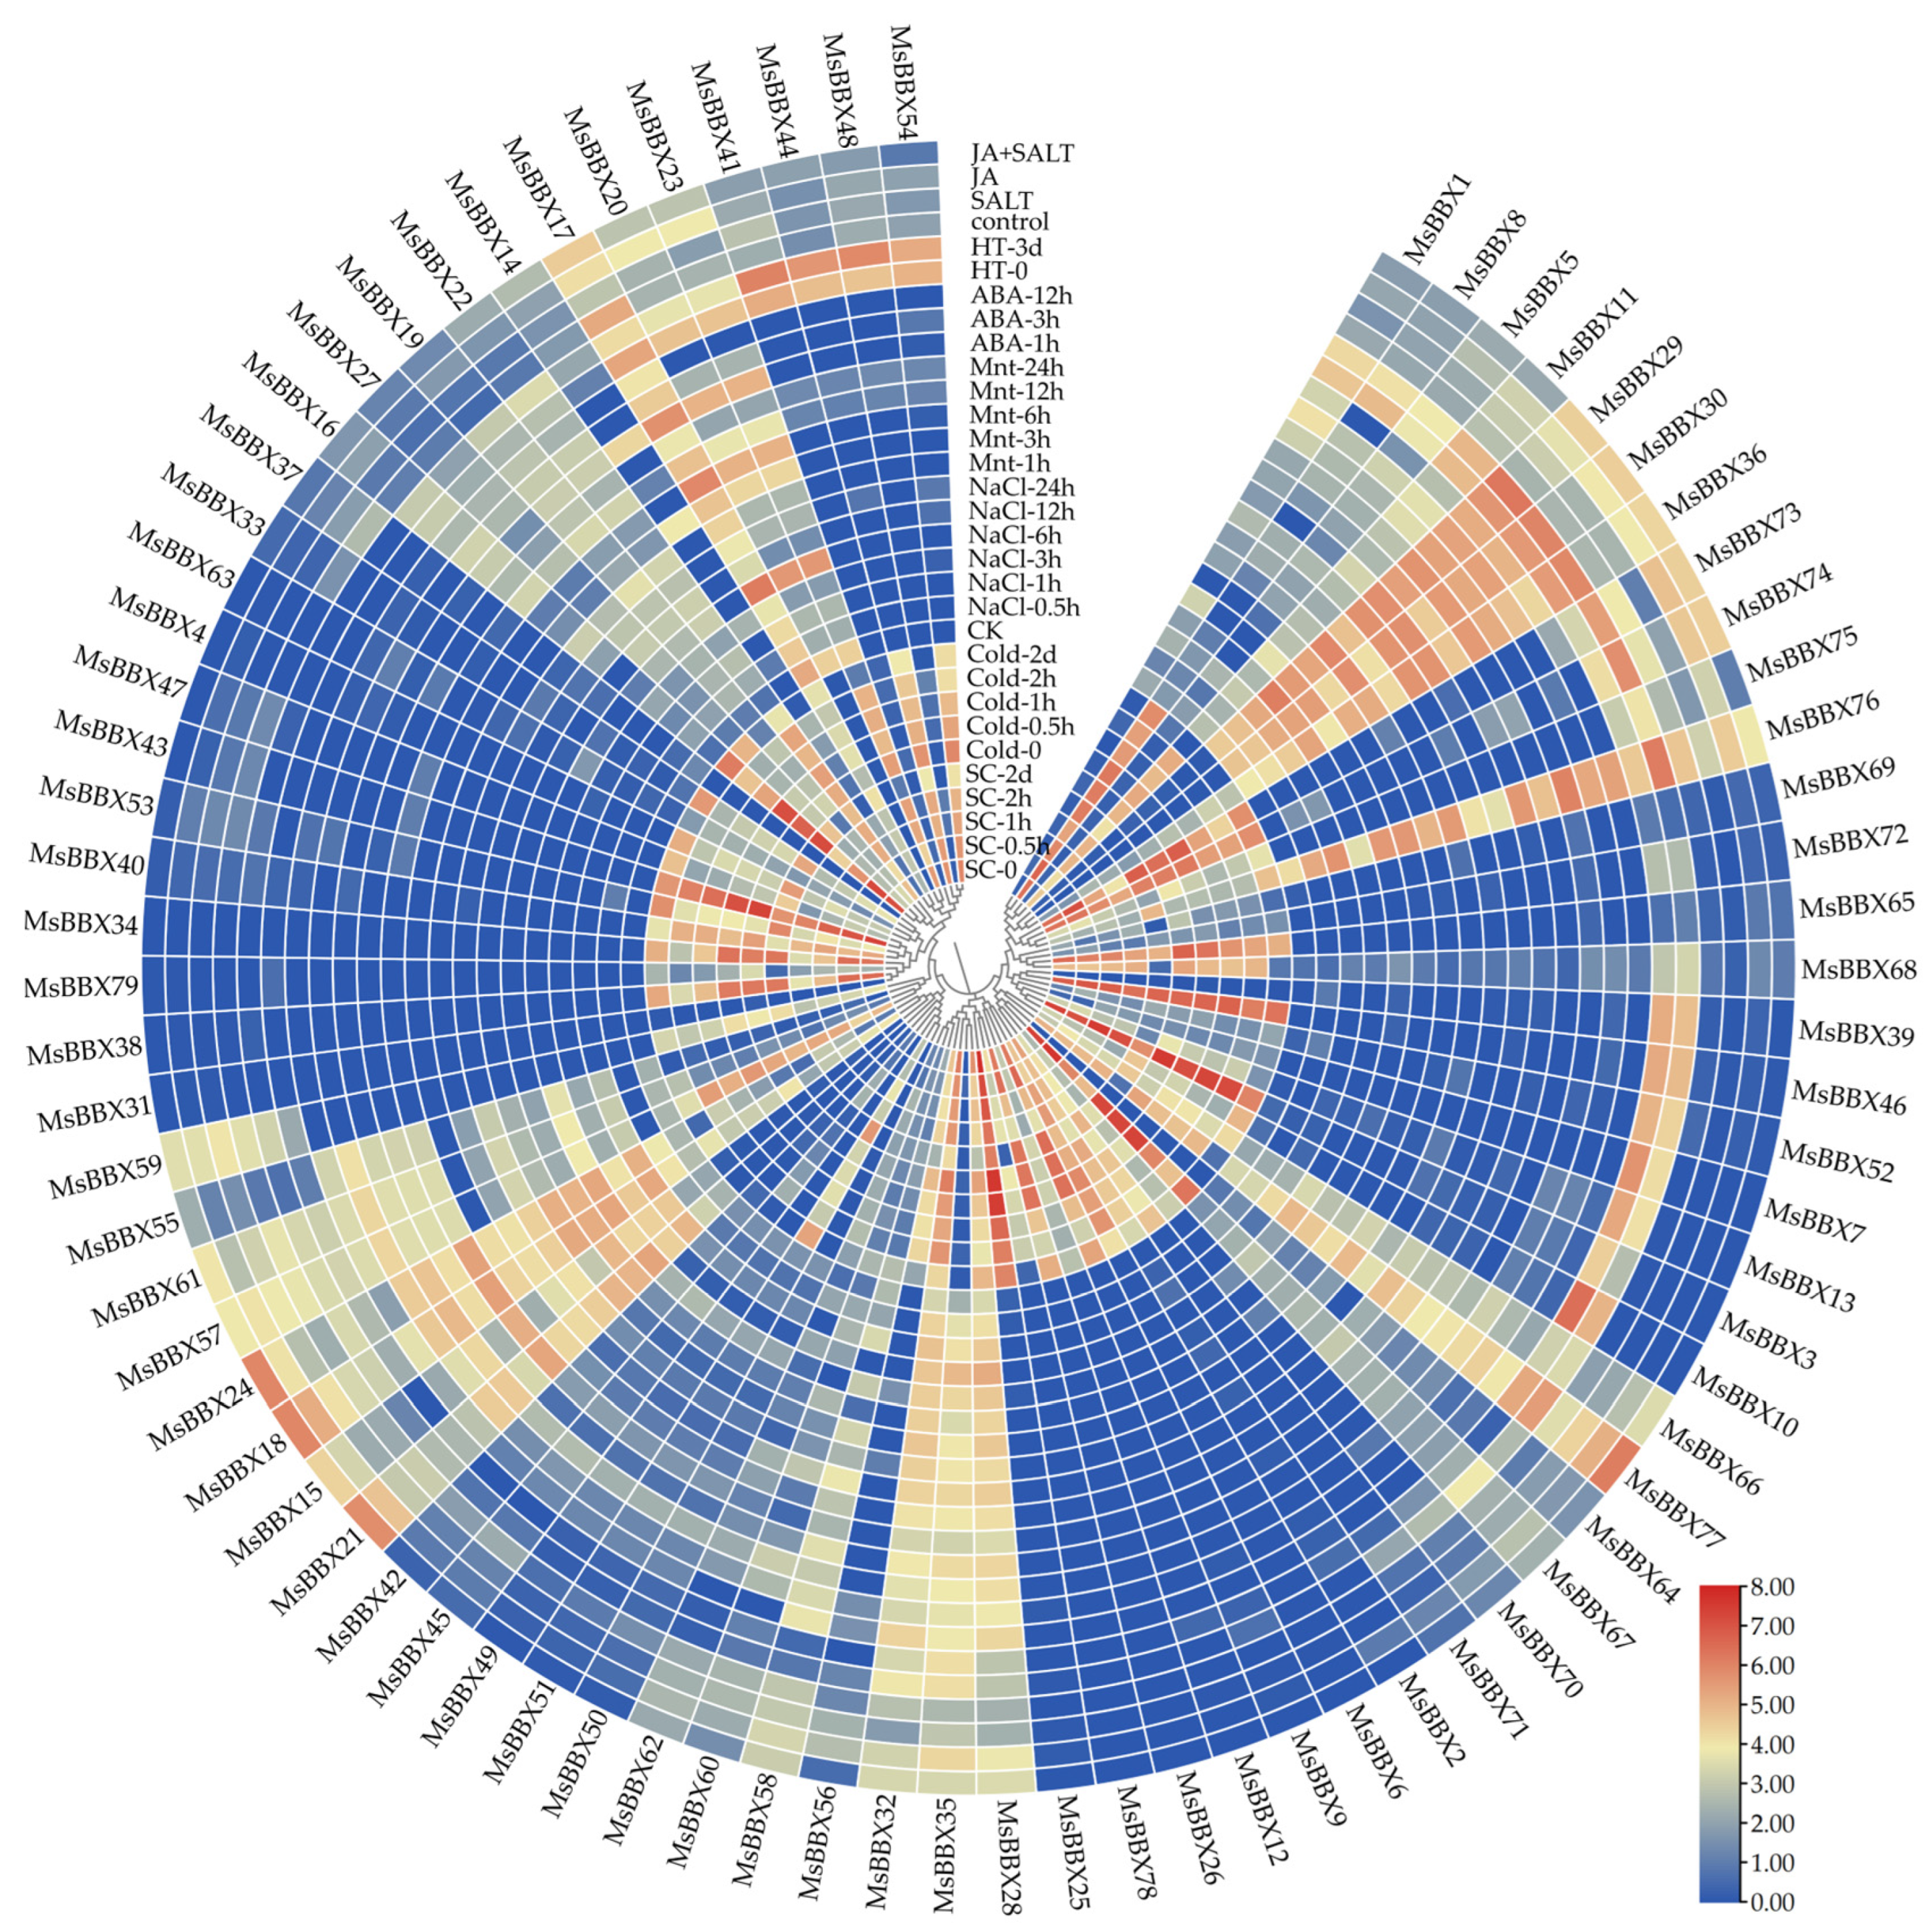
2.7. Expression Patterns of BBX Genes under Abiotic Stresses

The expression profiles of MsBBXs under various abiotic stresses were investigated using RNA-seq data. We summarized the heatmap analysis of the expression levels of 79 MsBBX genes under a variety of adversity stress conditions (cold, cold with salicylic acid, salt, drought, heat, abscisic acid, salt with jasmonic acid) using RNA-seq data that are publicly available online (Figure 6).
When alfalfa was subjected to low-temperature treatment, the expression levels of genes like MsBBX35, MsBBX41, and MsBBX44 showed a tendency to decrease as the time increased. Most genes were also up-regulated at different times. For example, after 0.5 h of cold stress, the expression of MsBBX3, MsBBX10, and MsBBX13 increased significantly compared with the control. Interestingly, alfalfa was watered using SA solution and then cold-treated (Figure 6). The expression of some BBX genes was higher than those that underwent cold treatment alone; it is possible that SA activated the expression of these genes. When the treatment was completed, alfalfa was placed in a culture chamber. After two days, the difference in gene expression was more significant in the cold-treated group with salicylic acid applied compared to the cold treatment alone. As in the case of MsBBX46, the expression content in cold treatment gradually decreased with time. After applying salicylic acid, the expression content of this gene was elevated. Removing all the stress factors for two days, its expression level far exceeded that of the cold-treated group at the same time. The results of these data indicate that salicylic acid can play an important role as a signaling molecule to activate plant resistance and defense mechanisms in the process of adversity stress in plants.
When treating alfalfa with salt, drought, and high-temperature conditions, different BBX genes showed differential expression patterns (Figure 6). Stimulation of alfalfa using NaCl significantly up-regulated some genes. For example, the expression of MsBBX29 first gradually increased and then slowly decreased. However, after 24 h, the expression increased again. Some genes like MsBBX17 and MsBBX20 showed suppression in the initial stage and increased again with the extension of the treatment period. The expression modes of genes like MsBBX24, MsBBX30, and MsBBX36 were increased by the induction of drought. At 6h, the expression of MsBBX36 was about 3.6 times higher than the control. The level of expression of MsBBX64 increased dramatically after high-temperature stress, which was as much as 24 times the original expression level. This gene responded positively to heat stress. Other genes, such as MsBBX71, MsBBX73 and MsBBX74, also responded positively to high-temperature induction, and they were maintained at high levels.
Application of exogenous abscisic acid to alfalfa resulted in a significant increase in some genes like MsBBX76 (Figure 6). After 1h of treatment, its expression level reached about 3.7 times that of ck, showing a high response pattern to exogenous ABA. Other BBX genes induced by ABA also showed different expression patterns, and these BBXs were involved in the ABA signaling pathway to regulate plant growth and metabolic processes. When alfalfa was treated with salt and jasmonic acid (Figure 6), most of the gene expression levels were increased compared with salt or jasmonic acid stimulation alone. For example, the expression level of MsBBX18 under salt-induced conditions was half that under jasmonic acid-induced conditions but increased to 4-fold after synergistic induction. MsBBX18 may be involved in the signaling pathways of salt and jasmonic acid. Meanwhile, this gene may also play an important role in the cross-regulatory pathway of these two abiotic stresses.

2.8. qRT-PCR Analysis of BBX Genes under Hormone and Salt Stresses

To confirm the regulation of salt tolerance among MsBBX gene family members by different hormones, alfalfa was used as the material; 150 mmol/L NaCl, 0.5 mmol/L ETH, and 150 mmol/L NaCl with 0.5 mmol/L ETH interaction treatments were set to analyze the relative expression of MsBBX genes. We selected 15 BBX genes that were responsive under a diverse range of abiotic stresses based on the results of transcriptome analysis (Figure 6). The expression was examined by quantitative real-time PCR (qRT-PCR) under NaCl, ETH, and NaCl with ETH treatments.
The results showed that MsBBX genes exhibited different expression patterns under varied treatment conditions as well as treatment times (Figure 7). In the NaCl treatment, the results showed that all gene expressions exhibited different degrees of up-regulation trends. In particular, MsBBX19 and MsBBX27 were most significantly up-regulated, followed by MsBBX2, MsBBX13, MsBBX24 and MsBBX35; the expression of these four genes was also significantly increased after salt induction, indicating that these genes are involved in the process of the plant’s response to adversity. Under ETH treatment, MsBBX genes also showed different expression patterns; most of these genes were markedly increased after induction, suggesting that these genes are involved in the ethylene-regulated pathway. Under cross-stress treatment with NaCl and ETH, MsBBX17, MsBBX18, MsBBX19, MsBBX32, and MsBBX42 showed higher relative expression levels at a certain time than when induced by NaCl or ETH alone. MsBBX genes synergistically regulate the adversity and hormone-induced pathways.
We used NaCl, SA, and the mutual treatment of both of them to detect the expression of MsBBX genes in alfalfa (Figure 8). Under the 0.5 mmol/L SA condition, the results showed that all BBX genes were up-regulated. MsBBX2, MsBBX27, and MsBBX77 were the most notable genes. Some gene expression increased significantly with time, indicating that MsBBX genes were involved in the salicylic acid metabolic pathway. When alfalfa was treated cooperatively with 150 mmol/L of NaCl and 0.5 mmol/L of SA, most of the BBX genes showed higher levels of expression compared with those in the single stress treatments. For example, for MsBBX19 and MsBBX44 at 12 h, the expression was increased markedly higher than in single stress treatments. Some genes, such as MsBBX2 and MsBBX77, had lower expression when they were subjected to cross-treatments. Induction of alfalfa using different approaches resulted in significant changes in gene expression levels for BBX members. MsBBX is involved in abiotic response processes in plants.

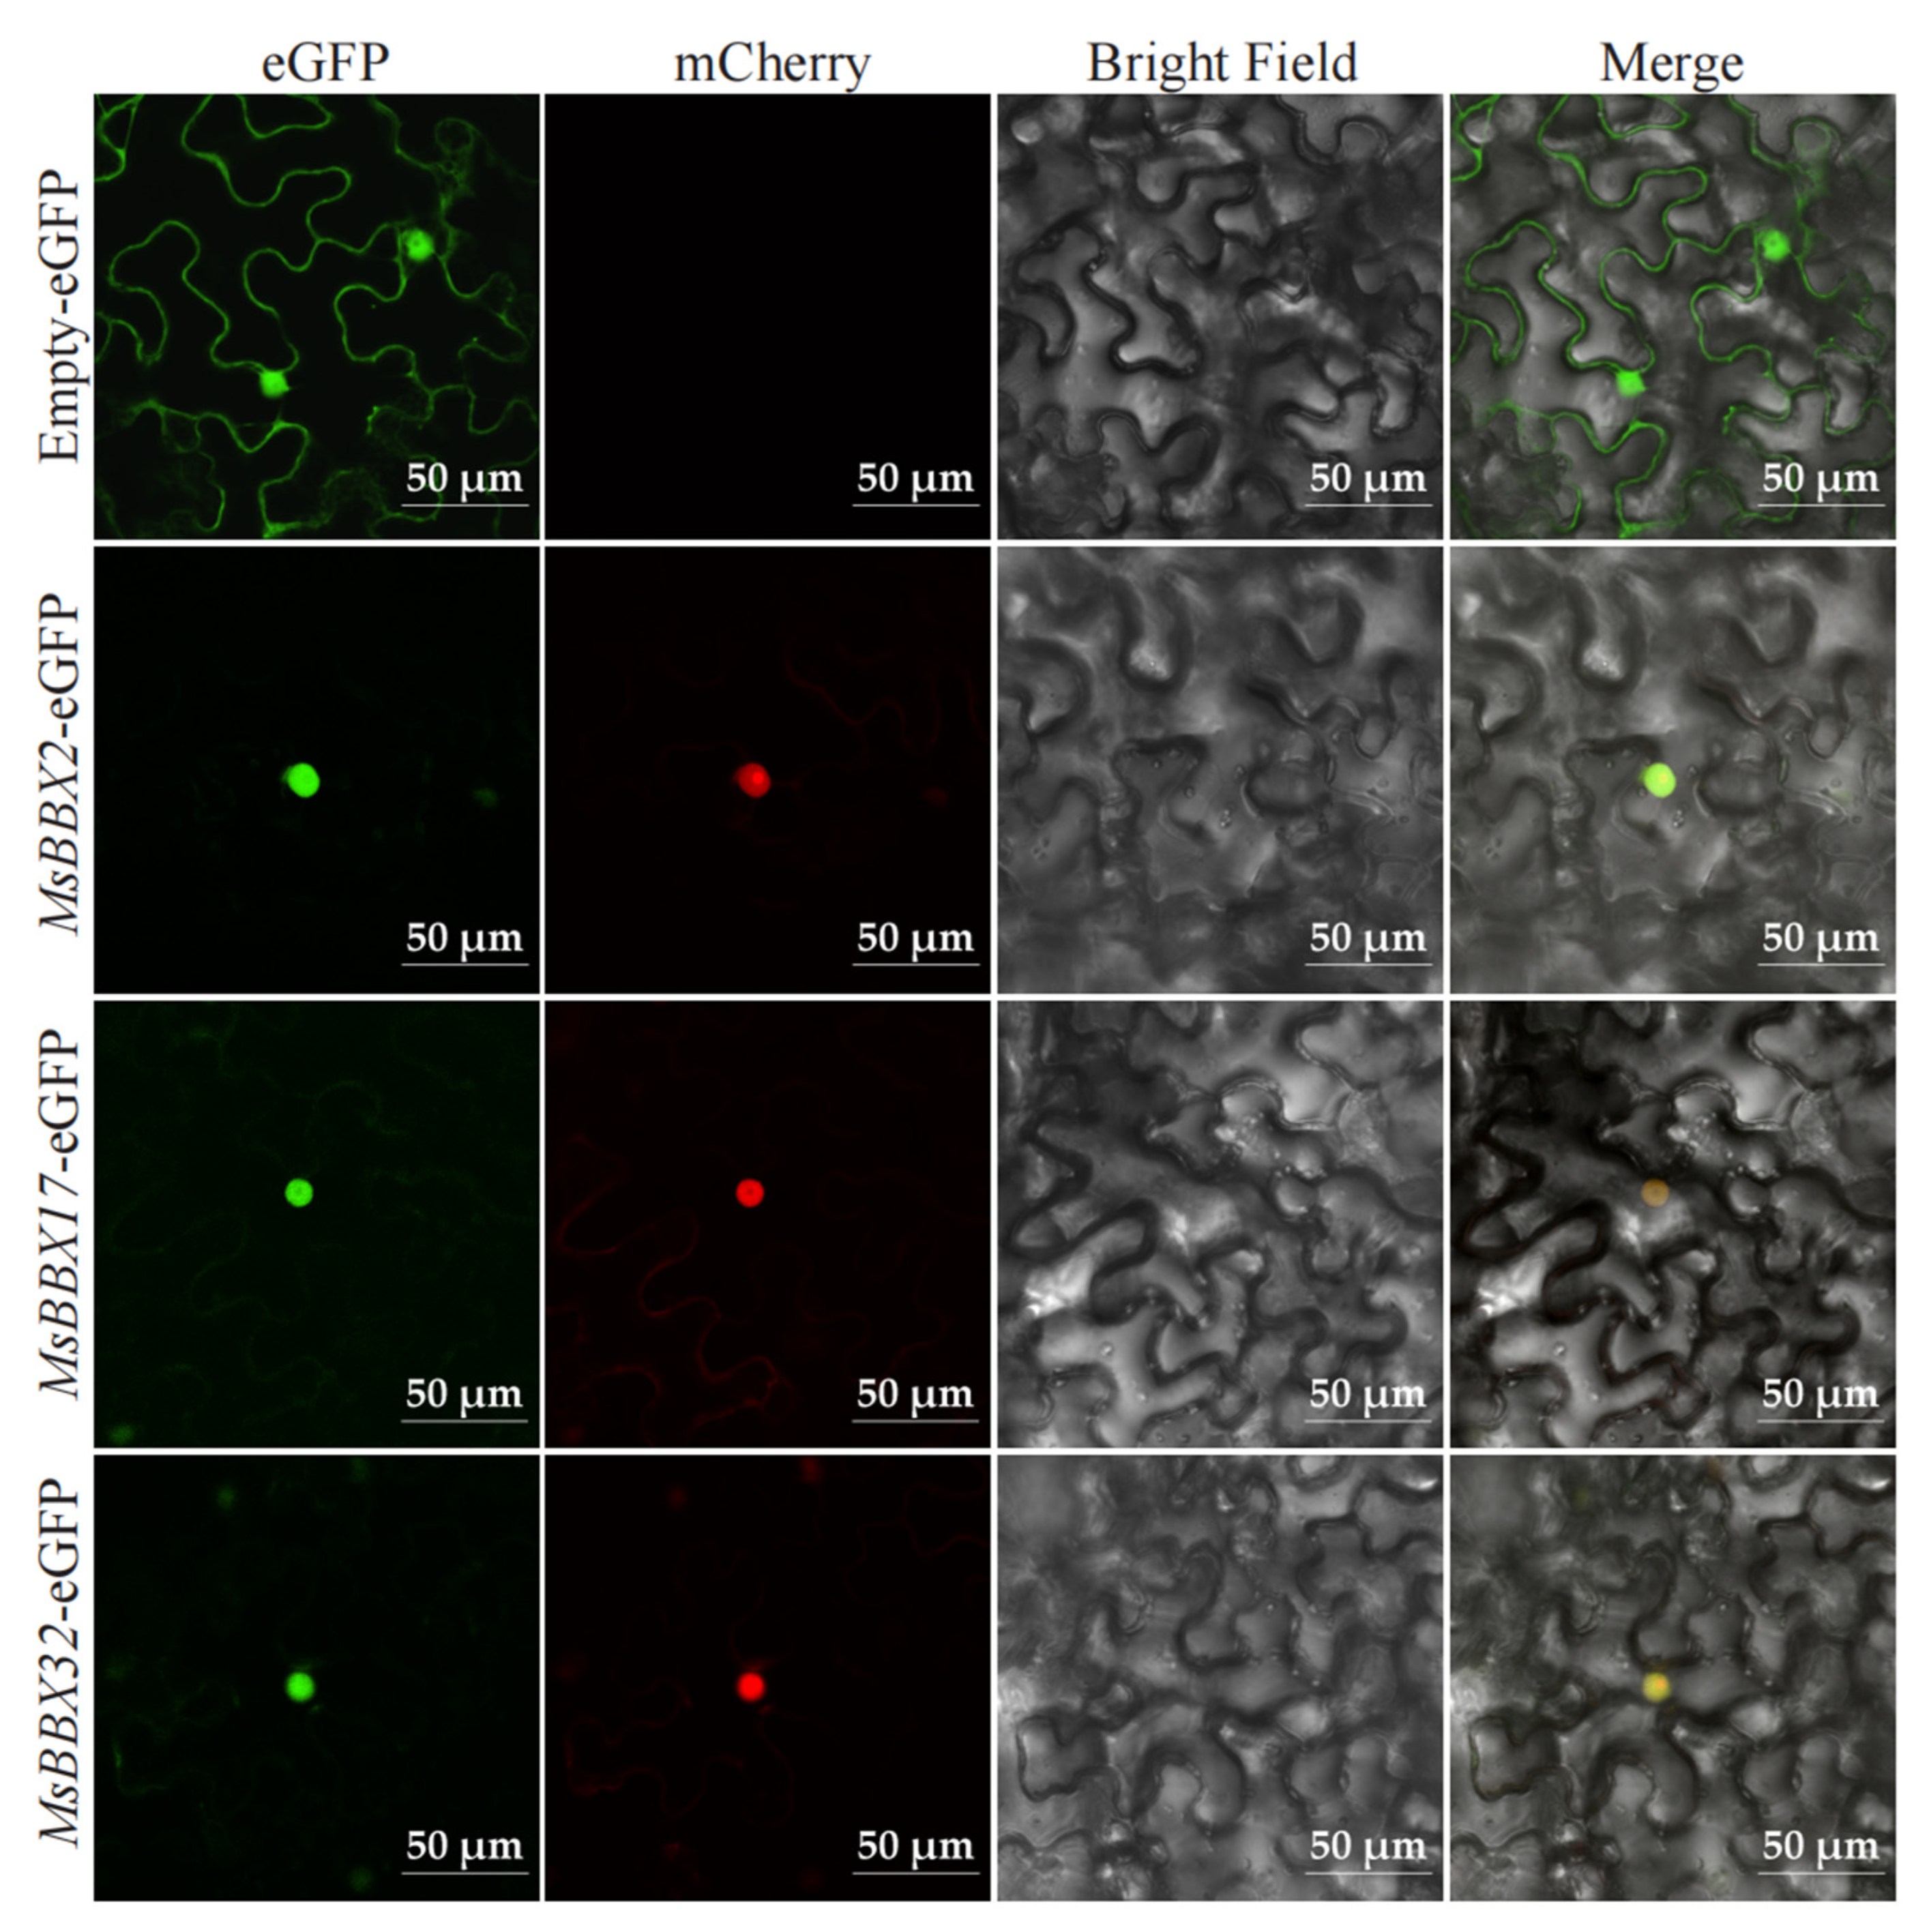
2.9. Subcellular Localization of BBX Genes

We predicted the subcellular localization of BBX on the Cell-PLoc website (Table S1). To further confirm the specific location where BBX exerts its function in the cells, we constructed recombinant vectors of 35S::eGFP fused with MsBBX2, MsBBX17, and MsBBX32. The empty-eGFP was the control. Fluorescence microscopy revealed that the GFP signals of all three fusion proteins were detected in the nucleus, consistent with Marker-mCherry (Figure 9).

3. Discussion

Transcription factors play key roles in plant life history, regulating plant growth, development, and responsiveness to abiotic stresses [36,37]. BBX is a branch of the zinc finger protein family of transcription factors involved in the regulation of plant flowering pathways [38], circadian rhythms [39], photomorphogenesis [40], and abiotic stress responses [6]. We systematically identified 21, 25, and 79 BBX members from M. sativa spp. Caerulea, M. truncatula, and M. sativa genomes, respectively (Table S1). Differences in the number of family members may be directly related to the chromosome number and genome complexity of different varieties [41], or interspecific differences may have occurred during evolution as a result of specific duplications or segmental deletions [11]. We listed some basic information about these BBXs, including gene ID, chromosomal localization, molecular weight, isoelectric point, and aliphatic index. These BBXs were divided into five branches (Clade I–V) based on the evolutionary pattern of the proteins, and it was found that MaBBXs and MsBBXs tended to cluster more closely (Figure 1).
We also analyzed the gene structure and conserved motifs of BBX (Figure S1). A total of 10 conserved motifs were identified, and the motif structures of each group member were relatively similar. Motif 1 was present in all BBXs. The BBX gene structures were rich and diverse (Figure S1D), with the number of exons ranging from one to seven. Nine of the BBX genes (MsBBX42, MsBBX45, MsBBX49, MsBBX50, MsBBX51, MsBBX63, MsBBX5, MsBBX15, MsBBX16) were without intronic structures, and they were almost all clustered together (Figure 1). The loss or gain of introns is an essential feature of species evolution [42,43].
The localization of these BBX genes on the chromosomes is very similar (Figure 2). For example, on chr1, the BBX genes are distributed at both ends of the chromosome; on chr5, two BBXs are distributed. Particularly, except for MsBBX63, the other 124 BBXs are scattered on chromosomes other than chr6, and the independent evolution of this gene may have enriched the function of the BBX gene family. Combined with the results of collinearity analysis (Figure 4), we found that one MaBBX or MtBBX gene could map to 1-4 genes in the tetraploid alfalfa genome, suggesting that there is a tetraploid duplication process in alfalfa. In M. sativa spp. Caerulea and M. truncatula (Table S3), dispersed duplications and WGD or segmental duplications were the main evolutionary modes. WGD or segmental duplications in M. sativa played a dominant role in the evolution of the BBX family (Table S3). It has been shown that WGD or segmental duplications are more favorable for the maintenance of gene function during amplification [41,44]. Exceptionally, only MtBBX15 is a singleton gene, and may have some unique functions. In the process of evolution, gene duplication often undergoes some selective pressure as organisms adapt to the external environment [11]. Here, we calculated the homologous gene pairs present in the BBX genes of the three Medicago plants separately, and 106 pairs of collinear genes were calculated in MsBBXs, with five pairs of collinear genes in each of the other two plants (Table S2). By calculating the Ka/Ks ratio, it was found that only two gene pairs (MsBBX31 and MsBBX38, and MsBBX39 and MsBBX52) had Ka/Ks > 1, and the rest of the gene pairs had Ka/Ks values less than 1, suggesting that these BBX genes underwent purifying selection and that the proteins were relatively conserved [45,46]. Furthermore, M. truncatula diverged from M. sativa spp. Caerulea 5.2 million years ago, and tetraploid alfalfa evolved from diploid alfalfa [34]. It is likely that some chromosome splitting and fusion also occurred during the evolutionary process. The gene family identification in this paper shows that these species converged to the same trend in the family analysis, such as similar protein structure, chromosomal localization, and collinearity. And there are many different trends in the analysis results as well. For example, tetraploid alfalfa has a very large number of family members, almost four times as many as the other two species of alfalfa. Tetraploid alfalfa also has more complex and diverse collinear gene pairs, and so on. This is correlated with the complexity of the publicly available genomic data.
MsBBX genes showed specific expression patterns in different tissues (Figure 5), suggesting that these genes are involved in the developmental processes of multiple plant organs (Figure 5); 86.1% of MsBBX genes functioned in multiple processes of plant growth and development. Among them, most genes were expressed in elongating stem internodes, with the least in nodules. The expression patterns of these BBXs are high in flowering organs and leaves, and these high-level genes are often clustered together; for example, MsBBX41, MsBBX44, MsBBX48, and MsBBX54 clustered in the same evolutionary branch. There are few studies on the pattern of MsBBX gene expression in alfalfa under a variety of adversity environments and hormones, whereas it has been studied in Arabidopsis [2], apple [27], grape [11], chrysanthemum [15], and other plants. Therefore, we downloaded the transcriptome data on alfalfa adversity stress and hormone treatment from the public data platform for analysis (Figure 6). The results showed that some of these BBX genes responded to multiple abiotic stresses under different treatments of cold, cold with salicylic acid, salt, drought, heat, abscisic acid, and salt with jasmonic acid. Among these highly expressed genes, some of them were located on the same chromosome (Figure 2), for example, MsBBX28, MsBBX29, and MsBBX30; the close gene distance may lead to similar gene functions. In particular, these genes showed significant differences in expression levels after being induced by two abiotic stress conditions simultaneously (Figure 6). The use of SA solution for watering alfalfa followed by cold treatment showed a different trend of increasing the expression levels of most of the BBXs compared with no application of SA, and these genes were synergistically regulated in the phytohormone and adversity stress pathways. By studying the expression mode of BBX genes, we found that some genes responded positively to various stress responses. For instance, MsBBX18, MsBBX35, and MsBBX76 showed up-regulated tendencies when induced by salt, drought, heat, and hormones. These genes may be involved in multiple adversity and hormone-responsive metabolic regulatory pathways, which jointly regulate the growth and development process of alfalfa from multiple pathways.
We analyzed the expression of 15 MsBBX genes under different hormone and salt treatments by qRT-PCR (Figure 7 and Figure 8). All of these genes showed a tendency to be significantly induced by salt stress. If the exogenous hormones ethylene or salicylic acid were applied to alfalfa alone, similarly, these genes showed a differential tendency to be up-regulated, and these results are in agreement with the studies in other species [8,10,11]. However, when salt and ETH were used together to stress alfalfa, MsBBX17, MsBBX18, MsBBX19, MsBBX32, and MsBBX42 showed higher expression levels than the treatments alone (Figure 7), while the expression levels of other BBXs were reduced compared to the control. These results suggest that BBX may be involved in the ethylene signaling pathway and may regulate its expression via the pathway under adverse environments. MsBBX13, MsBBX17, MsBBX18, MsBBX19, MsBBX27, MsBBX32, MsBBX42, MsBBX44, and MsBBX76 showed up-regulated expression patterns when both salt and salicylic acid stress conditions were simultaneously applied to alfalfa (Figure 8). They were actively involved in salt and SA induction, and it is likely that these genes synergistically regulate the salt and SA signaling pathway. Finally, by subcellular localization experiments (Figure 9), we verified that BBX genes were located in the nucleus. This shows that BBX genes may function as transcription factors in the nucleus [8]. The increased expression level of BBX under abiotic conditions shows that they are likely to be extensively involved as transcription factors in the regulation of abiotic stress tolerance in plants, and are involved in the signaling pathways of a variety of phytohormones.

4. Materials and Methods

4.1. Genome-Wide Identification of MaBBXs, MtBBXs, and MsBBXs

For the identification of MsBBX genes, the M. sativa reference genome data were downloaded (https://figshare.com/, accessed on 6 August 2023) and the latest M. truncatula and M. sativa spp. Caerulea reference genome data were downloaded from the MODMS database (https://modms.lzu.edu.cn/, accessed on 6 August 2023) [47]. The AtBBX gene was retrieved as a query sequence. The 35 AtBBX protein sequences were used as query sequences to retrieve BBX protein sequences in M. sativa, M. sativa spp. Caerulea, and M. truncatula reference genomes, respectively, with e-values < 1 × 10⁻⁵. Duplicate sequences were removed and submitted to NCBI CD-Search (https://www.ncbi.nlm.nih.gov/cdd/, accessed on 6 August 2023) to predict structural domains with an e-value threshold of 0.01. Protein sequences that did not contain the B-box structural domain were removed. It was finally determined that M. sativa spp. Caerulea has 21 MaBBX members, M. truncatula has 25 MtBBX members, and M. sativa has 79 MsBBX members.
The molecular weight, theoretical isoelectric point, instability index, aliphatic index, and grand average of hydrophobicity of the BBX sequences were calculated using EXPASy (https://web.expasy.org/protparam/, accessed on 8 August 2023), which was used to predict and analyze the physicochemical properties of all BBX protein sequences in conjunction with information from the reference genome GFF file. The subcellular localization of BBX proteins was predicted and analyzed using the online tool Cell-PLoc (http://www.csbio.sjtu.edu.cn/bioinf/Cell-PLoc/, accessed on 8 August 2023).

4.2. Phylogenetic Analysis of BBX Genes

Phylogenetic analyses were performed using 21 MaBBX sequences in M. sativa spp. Caerulea, 25 MtBBX sequences in M. truncatula, and 79 MsBBX sequences in M. sativa, for a total of 125 full-length protein sequences. Multiple sequence alignment was conducted using Clustal W with default parameters. We constructed a phylogenetic tree based on the complete BBX protein sequences using the neighbor-joining method (N-J) as implemented in the MEGA 10.2.6 software with a bootstrap value of 1000 and all parameters kept at default values [48]. The phylogenetic tree was visualized and modified using iTOL (https://itol.embl.de/, accessed on 15 August 2023) [49].

4.3. Gene Structure, Conserved Domains, and Motif Composition of BBXs

The BBX conserved motifs were identified using the MEME online website (https://meme-suite.org/meme/tools/meme, accessed on 19 August 2023), with the maximum number of motifs set to 10 in the program settings and the remaining parameters kept at default values [50]. The conserved domain of BBX proteins was identified using the NCBI CDD tool (https://www.ncbi.nlm.nih.gov/Structure/cdd/, accessed on 20 August 2023). Phylogenetic trees, conserved motifs, conserved domains, and gene structures of 125 BBX proteins were analyzed and visualized using Gene Structure View (Advanced) of TBtools v2.096 software [51].

4.4. Chromosomal Localization and Collinearity analysis of BBX

Based on the three genome annotation data of M. sativa spp. Caerulea, M. truncatula, and M. sativa, the chromosome locations of BBXs were identified and mapped using the Gene Location visualization of TBtools software. Based on the gene location, the detected genes were named MaBBX1~MaBBX21, MtBBX1~MtBBX25, and MsBBX1~MsBBX79, respectively. The downloaded genome sequence files and GFF files were analyzed using One Step MCScanX—super Fast of TBtools software to obtain the genome sequence files of the three genomes of M. sativa spp. Caerulea, M. truncatula, and M. sativa within the BBX gene collinearity information. All output files were then imported into TBtools v2.096 software of TBtools to obtain visualization of the collinearity relationships among BBX family members. The homologous genes of these three Medicago species were analyzed separately using TBtools software One Step MCScanX—super Fast. The Simple Ka/Ks Calculator (NG) of TBtools software was used to calculate the non-synonymous substitution rate (Ka) and synonymous substitution rate (Ks) of BBX gene pairs [51].

4.5. Analysis of Expression Level of MsBBX Gene

The original transcriptome data of six different tissues of M. sativa were obtained in a previous study under NCBI (https://www.ncbi.nlm.nih, accessed on 17 September 2023) project ID PRJNA276155. The original transcriptome data were also obtained for cold treatment, cold and salicylic acid treatment, salt treatment, drought treatment, heat treatment, abscisic acid treatment, and salt and jasmonic acid treatment in projects PRJNA450305, PRJNA573724, PRJNA867517, PRJNA1019078, and PRJNA1070376, respectively.
The data were then converted into fastq files with SRA-Toolkit v2.9 (NCBI, USA). Raw reads were trimmed using Trimmomatic-0.39 [52]. The gene expression level was determined by mapping cleaned reads to the corresponding M. sativa reference genomes using the StringTie v2.1.3 package (GitHub, San Francisco, USA) [53].
TPM (transcripts per million) indicates the gene expression level [54]. Heat maps were produced using TBtools software and differential expression of MsBBXs was analyzed using the DESeq2 R package. Genes with an adjusted p-value < 0.01 and |log2 foldchange (FC)| > 1 according to DESeq2 were designated as differentially expressed genes.

4.6. Plant Materials

The XinJiangDaYe variety of alfalfa was used in this study; the seeds were obtained from Dr. Yanhui Zhang of the College of Prataculture and Environmental Sciences, Xinjiang Agricultural University (Urumqi, China). Seedlings were planted in humus soil and grown in a greenhouse with a 16/8 h day/night photoperiod at 25 °C. Alfalfa seedlings of the same size and growth at three months of age were selected as treatment material and continued in Hoagland’s solution for 14 days. Five treatments were set up: 150 mmol/L of NaCl, 0.5 mmol/L of SA, 0.5 mmol/L of ETH, 150 mmol/L of NaCl and 0.5 mmol/L of SA, and 150 mmol/L of NaCl and of 0.5 mmol/L ETH. Three biological replicates were set up for each treatment, with 15 alfalfa seedlings per replicate. At five treatment periods of 0 h, 3 h, 6 h, 12 h, and 24 h, root materials from each treatment group were collected and immediately placed in liquid nitrogen, then stored at −80 °C for subsequent experimental analyses.

4.7. Total RNA Extraction and qRT-PCR Analysis

Quantitative real-time PCR (qRT-PCR) was performed using TRIzol reagent (Invitrogen, Carlsbad, CA, USA) to extract total RNA from the samples. cDNA was synthesized using the FastQuant First Strand cDNA Synthesis Kit (Tiangen, Beijing, China) according to the manufacturer’s protocol. The qRT-PCR was performed using a LightCycler 480 Real-Time PCR system (Roche, Basel, Switzerland), an SYBR® Green Premix Pro Taq HS qPCR kit(Accurate Biotechnology, Hunan, China, and a Roche LightCycler instrument. Each treatment had 3 biological replicates. The qRT-PCR primers were designed using Premier5 software v5.00 (PREMIER Biosoft, San Francisco, USA) (Table S4). MsEF-1α was used as an internal reference gene. The 2−∆∆Ct method was used to compute the relative expression. Statistical analysis was performed using SPSS 22.0 software (SPSS Inc., Chicago, IL, USA). Statistical differences between measurements at different times or with different treatments were analyzed using Duncan’s multiple range test. Differences were considered significant at a probability level of p < 0.05.

4.8. Subcellular Localization

Nicotiana benthamiana seeds were obtained from the Key Laboratory of Xinjiang Phytomedicine Resource and Utilization of Ministry of Education in Shihezi University (Shihezi, China). To investigate the transient expression of MsBBXs in tobacco leaves, the full-length CDS removes the terminator. MsBBXs were PCR-amplified using primers containing kpn I and xba I restriction endonucleases (see Supplemental Table for the sequences) and ligated into the vector pCAMBIA1300-eGFP cleaved by kpn I and xba I enzymes. The constructed vector was transformed into Agrobacterium rhizogenes GV3101, infiltrated into 4-week-old Nicotiana benthamiana leaves, and dark-incubated for 48 h. The fluorescence signals of the epidermis of Nicotiana benthamiana leaves were observed using a confocal microscope (Nikon, Japan). Agrobacterium strains carrying recombinant plasmids were grown in a liquid LB medium. The experiments used pCAMBIA1300-35S-mCherry-NLS (Puint, Shaanxi, China) as a marker for the nucleus.

5. Conclusions

In our study, 125 BBX family members were identified in the genomes of three Medicago plants: 21 MaBBXs, 25 MtBBXs, and 79 MsBBXs. Their basic structures, conserved motifs, protein physicochemical properties, and chromosomal localization information were analyzed. According to the phylogenetic relationship, these BBXs are divided into five evolutionary branches, with the largest number of BBXs in Clade Ⅰ, with 44 members. WGD or segmental duplications and dispersed duplications were the main ways of family member duplication; 5, 5, and 106 pairs of homogenic genes were calculated in the MaBBX, MtBBX, and MsBBX genomes, respectively. Except for two gene pairs of Ka/Ks > 1, which experienced positive selection, the rest of the collinear gene pairs had Ka/Ks < 1, suggesting that most of the BBXs experienced strong purifying selection. We also analyzed the expression patterns of BBX genes in different tissues as well as under multiple abiotic stresses. Some BBX genes significantly induced by salt and hormones were detected by qRT-PCR. Subcellular localization experiments revealed that BBX genes may act as transcription factors to regulate the transcription of genes in the nucleus. These results provide a theoretical basis for insight into the evolution and function of BBX family genes in alfalfa. It lays a theoretical foundation for the study of the resistance performance of Medicago plants.

Supplementary Materials

The supporting information can be downloaded at https://www.mdpi.com/article/10.3390/ijms25115778/s1.

Author Contributions

J.W., Z.M., H.L. and Q.X. conceived and designed the research experiments; J.W. and Z.M. wrote the original manuscript. J.W. and Z.M. contributed equally to this work. H.H., P.D. and S.S. performed the experiments; J.W., Z.M., H.L. and Q.X. analyzed the data. H.H., P.D., P.P.D. and S.S. contributed materials and analytic tools. H.L. and Q.X. wrote and corrected this manuscript. All authors have read and agreed to the published version of the manuscript.

Funding

This research was funded by the Xinjiang Production and Construction Corps Youth Science and Technology Innovation Talent Plan, grant number 23CB008-01, and the Xinjiang Production and Construction Corps and Key Fields Science and Technology Research Plan, grant number 2023AB070.

Institutional Review Board Statement

Not applicable.

Informed Consent Statement

Informed consent was obtained from all subjects involved in the study.

Data Availability Statement

Data are contained within the article and supplementary materials.

Acknowledgments

We are very grateful to Yanhui Zhang from the College of Prataculture and Environmental Sciences, Xinjiang Agricultural University, for providing the Medicago sativa seeds and his helpful suggestions.

Conflicts of Interest

The authors declare no conflict of interest.

References

  1. Meroni, G.; Diez-Roux, G. TRIM/RBCC, a novel class of ‘single protein RING finger’ E3 ubiquitin ligases. BioEssays News Rev. Mol. Cell. Dev. Biol. 2005, 27, 1147–1157. [Google Scholar] [CrossRef]
  2. Min, J.-H.; Chung, J.-S.; Lee, K.-H.; Kim, C.S. The CONSTANS-like 4 transcription factor, AtCOL4, positively regulates abiotic stress tolerance through an abscisic acid-dependent manner in Arabidopsis. J. Integr. Plant Biol. 2015, 57, 313–324. [Google Scholar] [CrossRef] [PubMed]
  3. Wenkel, S.; Turck, F.; Singer, K.; Gissot, L.; Le Gourrierec, J.; Samach, A.; Coupland, G. CONSTANS and the CCAAT box binding complex share a functionally important domain and interact to regulate flowering of Arabidopsis. Plant Cell 2006, 18, 2971–2984. [Google Scholar] [CrossRef] [PubMed]
  4. Massiah, M.A.; Matts, J.A.B.; Short, K.M.; Simmons, B.N.; Singireddy, S.; Yi, Z.; Cox, T.C. Solution structure of the MID1 B-box2 CHC(D/C)C2H2 zinc-binding domain: Insights into an evolutionarily conserved RING fold. J. Mol. Biol. 2007, 369, 1–10. [Google Scholar] [CrossRef]
  5. Crocco, C.D.; Botto, J.F. BBX proteins in green plants: Insights into their evolution, structure, feature and functional diversification. Gene 2013, 531, 44–52. [Google Scholar] [CrossRef] [PubMed]
  6. Shalmani, A.; Fan, S.; Jia, P.; Li, G.; Muhammad, I.; Li, Y.; Sharif, R.; Dong, F.; Zuo, X.; Li, K.; et al. Genome Identification of B-BOX Gene Family Members in Seven Rosaceae Species and Their Expression Analysis in Response to Flower Induction in Malus domestica. Molecules 2018, 23, 1763. [Google Scholar] [CrossRef]
  7. Gangappa, S.N.; Botto, J.F. The BBX family of plant transcription factors. Trends Plant Sci. 2014, 19, 460–470. [Google Scholar] [CrossRef]
  8. Chu, Z.; Wang, X.; Li, Y.; Yu, H.; Li, J.; Lu, Y.; Li, H.; Ouyang, B. Genomic Organization, Phylogenetic and Expression Analysis of the B-BOX Gene Family in Tomato. Front. Plant Sci. 2016, 7, 1552. [Google Scholar] [CrossRef]
  9. Huang, J.; Zhao, X.; Weng, X.; Wang, L.; Xie, W. The rice B-box zinc finger gene family: Genomic identification, characterization, expression profiling and diurnal analysis. PLoS ONE 2012, 7, e48242. [Google Scholar] [CrossRef]
  10. Feng, Z.; Li, M.; Li, Y.; Yang, X.; Wei, H.; Fu, X.; Ma, L.; Lu, J.; Wang, H.; Yu, S. Comprehensive identification and expression analysis of B-Box genes in cotton. BMC Genom. 2021, 22, 439. [Google Scholar] [CrossRef]
  11. Zhang, X.; Zhang, L.; Ji, M.; Wu, Y.; Zhang, S.; Zhu, Y.; Yao, J.; Li, Z.; Gao, H.; Wang, X. Genome-wide identification and expression analysis of the B-box transcription factor gene family in grapevine (Vitis vinifera L.). BMC Genom. 2021, 22, 221. [Google Scholar] [CrossRef] [PubMed]
  12. Datta, S.; Hettiarachchi, G.H.C.M.; Deng, X.-W.; Holm, M. Arabidopsis CONSTANS-LIKE3 is a positive regulator of red light signaling and root growth. Plant Cell 2006, 18, 70–84. [Google Scholar] [CrossRef] [PubMed]
  13. Ando, E.; Ohnishi, M.; Wang, Y.; Matsushita, T.; Watanabe, A.; Hayashi, Y.; Fujii, M.; Ma, J.F.; Inoue, S.-i.; Kinoshita, T. TWIN SISTER OF FT, GIGANTEA, and CONSTANS have a positive but indirect effect on blue light-induced stomatal opening in Arabidopsis. Plant Physiol. 2013, 162, 1529–1538. [Google Scholar] [CrossRef] [PubMed]
  14. Mandaokar, A.; Thines, B.; Shin, B.; Lange, B.M.; Choi, G.; Koo, Y.J.; Yoo, Y.J.; Choi, Y.D.; Choi, G.; Browse, J. Transcriptional regulators of stamen development in Arabidopsis identified by transcriptional profiling. Plant J. Cell Mol. Biol. 2006, 46, 984–1008. [Google Scholar] [CrossRef] [PubMed]
  15. Liu, Y.; Chen, H.; Ping, Q.; Zhang, Z.; Guan, Z.; Fang, W.; Chen, S.; Chen, F.; Jiang, J.; Zhang, F. The heterologous expression of CmBBX22 delays leaf senescence and improves drought tolerance in Arabidopsis. Plant Cell Rep. 2019, 38, 15–24. [Google Scholar] [CrossRef] [PubMed]
  16. Nagaoka, S.; Takano, T. Salt tolerance-related protein STO binds to a Myb transcription factor homologue and confers salt tolerance in Arabidopsis. J. Exp. Bot. 2003, 54, 2231–2237. [Google Scholar] [CrossRef] [PubMed]
  17. Gangappa, S.N.; Crocco, C.D.; Johansson, H.; Datta, S.; Hettiarachchi, C.; Holm, M.; Botto, J.F. The Arabidopsis B-BOX protein BBX25 interacts with HY5, negatively regulating BBX22 expression to suppress seedling photomorphogenesis. Plant Cell 2013, 25, 1243–1257. [Google Scholar] [CrossRef] [PubMed]
  18. Soitamo, A.J.; Piippo, M.; Allahverdiyeva, Y.; Battchikova, N.; Aro, E.-M. Light has a specific role in modulating Arabidopsis gene expression at low temperature. BMC Plant Biol. 2008, 8, 13. [Google Scholar] [CrossRef] [PubMed]
  19. Kirik, V.; Bäumlein, H. A novel leaf-specific myb-related protein with a single binding repeat. Gene 1996, 183, 109–113. [Google Scholar] [CrossRef]
  20. Salanoubat, M.; Lemcke, K.; Rieger, M.; Ansorge, W.; Unseld, M.; Fartmann, B.; Valle, G.; Blöcker, H.; Perez-Alonso, M.; Obermaier, B.; et al. Sequence and analysis of chromosome 3 of the plant Arabidopsis thaliana. Nature 2000, 408, 820–822. [Google Scholar]
  21. Datta, S.; Hettiarachchi, C.; Johansson, H.; Holm, M. SALT TOLERANCE HOMOLOG2, a B-box protein in Arabidopsis that activates transcription and positively regulates light-mediated development. Plant Cell 2007, 19, 3242–3255. [Google Scholar] [CrossRef]
  22. An, J.-P.; Wang, X.-F.; Espley, R.V.; Lin-Wang, K.; Bi, S.-Q.; You, C.-X.; Hao, Y.-J. An Apple B-Box Protein MdBBX37 Modulates Anthocyanin Biosynthesis and Hypocotyl Elongation Synergistically with MdMYBs and MdHY5. Plant Cell Physiol. 2020, 61, 130–143. [Google Scholar] [CrossRef] [PubMed]
  23. Ouhibi, C.; Attia, H.; Rebah, F.; Msilini, N.; Chebbi, M.; Aarrouf, J.; Urban, L.; Lachaal, M. Salt stress mitigation by seed priming with UV-C in lettuce plants: Growth, antioxidant activity and phenolic compounds. Plant Physiol. Biochem. PPB 2014, 83, 126–133. [Google Scholar] [CrossRef]
  24. Yu, Z.; Duan, X.; Luo, L.; Dai, S.; Ding, Z.; Xia, G. How Plant Hormones Mediate Salt Stress Responses. Trends Plant Sci. 2020, 25, 1117–1130. [Google Scholar] [CrossRef]
  25. Liu, X.; Li, R.; Dai, Y.; Chen, X.; Wang, X. Genome-wide identification and expression analysis of the B-box gene family in the Apple (Malus domestica Borkh.) genome. Mol. Genet. Genom. 2018, 293, 303–315. [Google Scholar] [CrossRef]
  26. Liu, X.; Li, R.; Dai, Y.; Yuan, L.; Sun, Q.; Zhang, S.; Wang, X. A B-box zinc finger protein, MdBBX10, enhanced salt and drought stresses tolerance in Arabidopsis. Plant Mol. Biol. 2019, 99, 437–447. [Google Scholar] [CrossRef]
  27. An, J.-P.; Wang, X.-F.; Zhang, X.-W.; You, C.-X.; Hao, Y.-J. Apple B-box protein BBX37 regulates jasmonic acid mediated cold tolerance through the JAZ-BBX37-ICE1-CBF pathway and undergoes MIEL1-mediated ubiquitination and degradation. New Phytol. 2021, 229, 2707–2729. [Google Scholar] [CrossRef] [PubMed]
  28. Huang, X.; Zheng, L.; Xie, R. Effect of pre-harvest application of ethephon on colouration and expression of ripening related genes in citrus fruit. J. Hortic. Sci. Biotechnol. 2020, 96, 514–526. [Google Scholar] [CrossRef]
  29. Gharbi, E.; Martínez, J.-P.; Benahmed, H.; Lepoint, G.; Vanpee, B.; Quinet, M.; Lutts, S. Inhibition of ethylene synthesis reduces salt-tolerance in tomato wild relative species Solanum chilense. J. Plant Physiol. 2017, 210, 24–37. [Google Scholar] [CrossRef]
  30. Chang, C.; Wang, B.; Shi, L.; Li, Y.; Duo, L.; Zhang, W. Alleviation of salt stress-induced inhibition of seed germination in cucumber (Cucumis sativus L.) by ethylene and glutamate. J. Plant Physiol. 2010, 167, 1152–1156. [Google Scholar] [CrossRef]
  31. Jayakannan, M.; Bose, J.; Babourina, O.; Rengel, Z.; Shabala, S. Salicylic acid in plant salinity stress signalling and tolerance. Plant Growth Regul. 2015, 76, 25–40. [Google Scholar] [CrossRef]
  32. Khoury, C.K.; Bjorkman, A.D.; Dempewolf, H.; Ramirez-Villegas, J.; Guarino, L.; Jarvis, A.; Rieseberg, L.H.; Struik, P.C. Increasing homogeneity in global food supplies and the implications for food security. Proc. Natl. Acad. Sci. USA 2014, 111, 4001–4006. [Google Scholar] [CrossRef] [PubMed]
  33. Chen, H.; Zeng, Y.; Yang, Y.; Huang, L.; Tang, B.; Zhang, H.; Hao, F.; Liu, W.; Li, Y.; Liu, Y.; et al. Allele-aware chromosome-level genome assembly and efficient transgene-free genome editing for the autotetraploid cultivated alfalfa. Nat. Commun. 2020, 11, 2494. [Google Scholar] [CrossRef] [PubMed]
  34. Li, A.; Liu, A.; Du, X.; Chen, J.-Y.; Yin, M.; Hu, H.-Y.; Shrestha, N.; Wu, S.-D.; Wang, H.-Q.; Dou, Q.-W.; et al. A chromosome-scale genome assembly of a diploid alfalfa, the progenitor of autotetraploid alfalfa. Hortic. Res. 2020, 7, 194. [Google Scholar] [CrossRef]
  35. Pecrix, Y.; Staton, S.E.; Sallet, E.; Lelandais-Brière, C.; Moreau, S.; Carrère, S.; Blein, T.; Jardinaud, M.-F.; Latrasse, D.; Zouine, M.; et al. Whole-genome landscape of Medicago truncatula symbiotic genes. Nat. Plants 2018, 4, 1017–1025. [Google Scholar] [CrossRef] [PubMed]
  36. Gong, W.; Shen, Y.-P.; Ma, L.-G.; Pan, Y.; Du, Y.-L.; Wang, D.-H.; Yang, J.-Y.; Hu, L.-D.; Liu, X.-F.; Dong, C.-X.; et al. Genome-wide ORFeome cloning and analysis of Arabidopsis transcription factor genes. Plant Physiol. 2004, 135, 773–782. [Google Scholar] [CrossRef] [PubMed]
  37. Chen, H.-C.; Chien, T.-C.; Chen, T.-Y.; Chiang, M.-H.; Lai, M.-H.; Chang, M.-C. Overexpression of a Novel ERF-X-Type Transcription Factor, OsERF106MZ, Reduces Shoot Growth and Tolerance to Salinity Stress in Rice. Rice 2021, 14, 82. [Google Scholar] [CrossRef] [PubMed]
  38. Valverde, F. CONSTANS and the evolutionary origin of photoperiodic timing of flowering. J. Exp. Bot. 2011, 62, 2453–2463. [Google Scholar] [CrossRef] [PubMed]
  39. Ledger, S.; Strayer, C.; Ashton, F.; Kay, S.A.; Putterill, J. Analysis of the function of two circadian-regulated CONSTANS-LIKE genes. Plant J. Cell Mol. Biol. 2001, 26, 15–22. [Google Scholar] [CrossRef]
  40. Wang, Q.; Zeng, J.; Deng, K.; Tu, X.; Zhao, X.; Tang, D.; Liu, X. DBB1a, involved in gibberellin homeostasis, functions as a negative regulator of blue light-mediated hypocotyl elongation in Arabidopsis. Planta 2011, 233, 13–23. [Google Scholar] [CrossRef]
  41. Zhang, G.; Zhang, Z.; Luo, S.; Li, X.; Lyu, J.; Liu, Z.; Wan, Z.; Yu, J. Genome-wide identification and expression analysis of the cucumber PP2C gene family. BMC Genom. 2022, 23, 563. [Google Scholar] [CrossRef]
  42. Rogozin, I.B.; Sverdlov, A.V.; Babenko, V.N.; Koonin, E.V. Analysis of evolution of exon-intron structure of eukaryotic genes. Brief Bioinform. 2005, 6, 118–134. [Google Scholar] [CrossRef]
  43. Long, M.; Betrán, E.; Thornton, K.; Wang, W. The origin of new genes: Glimpses from the young and old. Nat. Rev. Genet. 2003, 4, 865–875. [Google Scholar] [CrossRef] [PubMed]
  44. Lynch, M.; Conery, J.S. The evolutionary fate and consequences of duplicate genes. Science 2000, 290, 1151–1155. [Google Scholar] [CrossRef] [PubMed]
  45. Hurst, L.D. The Ka/Ks ratio: Diagnosing the form of sequence evolution. Trends Genet. 2002, 18, 486–487. [Google Scholar] [CrossRef]
  46. Karpinska, B.; Razak, N.; James, E.K.; Morris, J.A.; Verrall, S.R.; Hedley, P.E.; Hancock, R.D.; Foyer, C.H. WHIRLY1 functions in the nucleus to regulate barley leaf development and associated metabolite profiles. Biochem. J. 2022, 479, 641–659. [Google Scholar] [CrossRef] [PubMed]
  47. Fang, L.; Liu, T.; Li, M.; Dong, X.; Han, Y.; Xu, C.; Li, S.; Zhang, J.; He, X.; Zhou, Q.; et al. MODMS: A multi-omics database for facilitating biological studies on alfalfa (Medicago sativa L.). Hortic. Res. 2024, 11, uhad245. [Google Scholar] [CrossRef]
  48. Tamura, K.; Stecher, G.; Kumar, S. MEGA11: Molecular Evolutionary Genetics Analysis Version 11. Mol. Biol. Evol. 2021, 38, 3022–3027. [Google Scholar] [CrossRef]
  49. Letunic, I.; Bork, P. Interactive Tree of Life (iTOL) v6: Recent updates to the phylogenetic tree display and annotation tool. Nucleic Acids Res. 2024, gkae268. [Google Scholar] [CrossRef]
  50. Bailey, T.L.; Elkan, C. Fitting a mixture model by expectation maximization to discover motifs in biopolymers. Proc. Int. Conf. Intell. Syst. Mol. Biol. 1994, 2, 28–36. [Google Scholar]
  51. Chen, C.; Chen, H.; Zhang, Y.; Thomas, H.R.; Frank, M.H.; He, Y.; Xia, R. TBtools: An Integrative Toolkit Developed for Interactive Analyses of Big Biological Data. Mol. Plant 2020, 13, 1194–1202. [Google Scholar] [CrossRef] [PubMed]
  52. Bolger, A.M.; Lohse, M.; Usadel, B. Trimmomatic: A flexible trimmer for Illumina sequence data. Bioinformatics 2014, 30, 2114–2120. [Google Scholar] [CrossRef] [PubMed]
  53. Pertea, M.; Pertea, G.M.; Antonescu, C.M.; Chang, T.-C.; Mendell, J.T.; Salzberg, S.L. StringTie enables improved reconstruction of a transcriptome from RNA-seq reads. Nat. Biotechnol. 2015, 33, 290–295. [Google Scholar] [CrossRef]
  54. Mortazavi, A.; Williams, B.A.; McCue, K.; Schaeffer, L.; Wold, B. Mapping and quantifying mammalian transcriptomes by RNA-Seq. Nat. Methods 2008, 5, 621–628. [Google Scholar] [CrossRef] [PubMed]
Figure 1. Phylogenetic relationships of BBXs retrieved in the M. sativa spp. Caerulea, M. truncatula, and M. sativa. The tree was constructed by Clustal W and MEGA X using the neighbor-joining method with 1000 bootstrap repetitions. The BBXs were classified and displayed in different groups by uniquely colored outer rings. The green triangle represents the BBXs in M. sativa spp. Caerulea; the yellow–brown circle represents the BBXs in M. truncatula; the red five-pointed star represents the BBXs in M. sativa. The number on the node in the phylogenetic tree represents the percentage of trustworthiness of the branch in the bootstrap validation.
Ijms 25 05778 g001
Figure 2. Chromosomal localization analysis of BBX in M. sativa spp. Caerulea, M. truncatula, and M. sativa. (A) The orange bar indicates the M. sativa spp. Caerulea chromosomes; (B) the pink bar indicates the M. truncatula chromosomes; (C) the blue bar indicates the M. sativa chromosomes. The gene on each chromosome is highlighted in red. The scale bar on the left indicates the chromosome lengths (Mb).
Ijms 25 05778 g002
Figure 3. The synteny analysis of BBXs in the genomes of M. sativa spp. Caerulea, M. truncatula, and M. sativa. (A) The collinear relationship of BBX genes in M. sativa spp. Caerulea; (B) the collinear relationship of BBX genes in M. truncatula; (C) the collinear relationship of BBX genes in M. sativa. The BBX collinear gene pairs are represented by different colored lines. The outermost circle shows the chromosome number. The information represented by each circle in the figure from inside out is gene density, GC content, chromosome length scale, and chromosome name in order.
Ijms 25 05778 g003
Figure 4. The synteny analysis of BBXs in the genomes between the M. sativa spp. Caerulea, M. truncatula, and M. sativa. The red lines represent homologous gene pairs between them.
Ijms 25 05778 g004
Figure 5. Expression profiles of MsBBX genes in different tissues of M. sativa. Heat maps reflect the transcripts per million (TPM) of MsBBXs. The color bar from blue to red indicates relative expression levels from lower to higher, respectively.
Ijms 25 05778 g005
Figure 6. Expression profiles of MsBBX genes under different abiotic stresses and hormone treatments of M. sativa. Heat maps reflect the transcripts per million (TPM) of MsBBXs. The color bar from blue to red indicates relative expression levels from lower to higher, respectively.
Ijms 25 05778 g006
Figure 7. The expression profiles of 15 selected MsBBX genes in response to NaCl, ETH, and NaCl and ETH treatment in M. sativa by using qRT-PCR. Data are the average of three independent biological samples ± SD and vertical bars indicate standard deviation. Different letters indicate significant differences at p < 0.05, as determined by Duncan’s multiple range tests.
Ijms 25 05778 g007
Figure 8. The expression profiles of 15 selected MsBBX genes in response to NaCl, SA, and NaCl and SA treatment in M. sativa by using qRT-PCR. Data are the average of three independent biological samples ± SD and vertical bars indicate standard deviation. Different letters indicate significant differences at p < 0.05, as determined by Duncan’s multiple range tests.
Ijms 25 05778 g008
Figure 9. Subcellular localization of MsBBX2, MsBBX17, and MsBBX32. MsBBX:GFP fusion proteins were transiently expressed in Nicotiana benthamiana leaves, and their localization was determined using confocal microscopy. The nucleus was visualized with mCherry-labeled nuclear markers. Bar = 50 µm.
Ijms 25 05778 g009
Disclaimer/Publisher’s Note: The statements, opinions and data contained in all publications are solely those of the individual author(s) and contributor(s) and not of MDPI and/or the editor(s). MDPI and/or the editor(s) disclaim responsibility for any injury to people or property resulting from any ideas, methods, instructions or products referred to in the content.

