Article

Ex Vivo Analysis of Cell Differentiation, Oxidative Stress, Inflammation, and DNA Damage on Cutaneous Field Cancerization

1
Department of Health Sciences, University of Eastern Piedmont, Via Paolo Solaroli 17, 28100 Novara, Italy
2
AOU Maggiore della Carità di Novara, c.so Mazzini 18, 28100 Novara, Italy
3
IRCCS San Raffaele Scientific Institute, Via Olgettina 58, 20132 Milan, Italy
4
San Raffaele Scientific Institute, Vita-Salute San Raffaele University, Via Olgettina 58, 20132 Milan, Italy
*
Author to whom correspondence should be addressed.
Int. J. Mol. Sci. 2024, 25(11), 5775; https://doi.org/10.3390/ijms25115775
Submission received: 13 April 2024 / Revised: 23 May 2024 / Accepted: 24 May 2024 / Published: 26 May 2024
(This article belongs to the Section Molecular Oncology)

Abstract

:
Cutaneous field cancerization (CFC) refers to a skin region containing mutated cells’ clones, predominantly arising from chronic exposure to ultraviolet radiation (UVR), which exhibits an elevated risk of developing precancerous and neoplastic lesions. Despite extensive research, many molecular aspects of CFC still need to be better understood. In this study, we conducted ex vivo assessment of cell differentiation, oxidative stress, inflammation, and DNA damage in CFC samples. We collected perilesional skin from 41 patients with skin cancer and non-photoexposed skin from 25 healthy control individuals. These biopsies were either paraffin-embedded for indirect immunofluorescence and immunohistochemistry stain or processed for proteins and mRNA extraction from the epidermidis. Our findings indicate a downregulation of p53 expression and an upregulation of Ki67 and p16 in CFC tissues. Additionally, there were alterations in keratinocyte differentiation markers, disrupted cell differentiation, increased expression of iNOS and proinflammatory cytokines IL-6 and IL-8, along with evidence of oxidative DNA damage. Collectively, our results suggest that despite its outwardly normal appearance, CFC tissue shows early signs of DNA damage, an active inflammatory state, oxidative stress, abnormal cell proliferation and differentiation.

1. Introduction

The concept of field cancerization (FC), first proposed by Slaughter in 1953, delineates an area surrounding a neoplastic lesion that appears morphologically normal yet harbors cellular clones exhibiting phenotypic alterations [1,2,3]. This concept is currently applied across various tissues throughout the body, including the skin [1]. Specifically, cutaneous field cancerization (CFC) predominantly affects photoexposed areas and is characterized by an elevated risk of multiple actinic keratoses (AKs) and cutaneous squamous cell carcinomas (cSCCs) [4,5,6]. However, the precise understanding of CFC remains ambiguous and subject to ongoing debate in the scientific community, especially regarding its definition, diagnostic criteria, and therapeutic strategies [7,8]. The main extrinsic factor implicated in CFC development is chronic exposure to ultraviolet radiation (UVR), which was also considered in the 8th AJCC classification for non-melanoma skin tumors [9]. UVR is known to induce driver mutations in specific target genes on some precursor cells. With prolonged UV exposure, these cells may accumulate additional mutations leading to uncontrolled cell growth and the establishment of fields of altered cells that gradually supplant the normal epithelium [3,10]. Mechanistically, UVR can cause DNA damage directly through direct absorption of UV photons by nucleotides or indirectly through reactive oxygen species (ROS) production [11,12,13], which in turn can induce oxidative lesions such as 8-hydroxy-2′-deoxyguanosine (8-OHdG) within the DNA [14,15]. Furthermore, UVR can also initiate an inflammatory response and upregulate the expression of the inducible nitric oxide synthase (iNOS) [16,17,18], collectively fostering an environment conductive to carcinogenesis. [1]. Genetic analyses reveal that the most frequently mutated genes in both normal sun-exposed skin and AKs are TP53 [6,19,20], NOTCH1-2 [21,22], and p16 [10,21,23]. Furthermore, Chitsazzadeh et al. [24] discovered mutations in NOTCH3 and FGFR3 in normal skin, while Miola et al. [25] have recently demonstrated alterations in Ki67 and surviving expression is affected in CFC. These genetic mutations highlight the profound clinical and therapeutic consequences of CFC in oncodermatology; yet, extant therapies directed at AKs and SCCs do not target the mutated cellular clones within CFC, consequently failing to prevent the recurrence of primary tumors as well as the genesis of de novo lesions [5,24]. Consequently, patients undergo multiple and invasive treatments, causing morbidities and generating tremendous costs [26]. Comprehensive understanding of all mechanisms involved in CFC formation and progression will contribute to the design of field-directed therapies to reduce and prevent AK development and the recurrence of cancer [27].
In this context, we have conducted an investigation into the expression of keratinocyte differentiation markers, pro- and anti-inflammatory cytokines, and markers of DNA damage in skin biopsies from both normal and CFC tissue.

2. Results

2.1. Expression of p53 and Ki67 Is Altered in CFC

In response to UV radiation, epidermal cells can arrest the cell cycle through the activation of p53 in order to allow DNA repair or promote apoptosis when severe mutations are present [16]. However, as demonstrated in both AKs and cSCCs, in chronic photodamaged areas p53 is often mutated, driving premature cell cycle progression and aberrant proliferation of cells before DNA damage has been repaired [28]. For this reason, p53 and Ki67, markers of cell proliferation, could be considered as indicators of field cancerization [29,30]. We therefore investigated whether the expression of normal p53 and Ki67 were altered in the CFC skin samples (Figure 1). Immunohistochemical analysis (Figure 1a) revealed that in healthy skin, both p53 and Ki67 are expressed mainly by keratinocytes of the basal layer showing a cytoplasmatic stain. On the other hand, in CFC skin we observed a significant reduction of p53 positive cells (Figure 1b) that was correlated with downregulation of the TP53 gene (Figure 1c) and protein expression (Figure 1d,e). We also observed that in CFC tissue, in comparison with healthy skin (CTRL), Ki67 is overexpressed at both the protein (Figure 1a) and gene (Figure 1c) level.

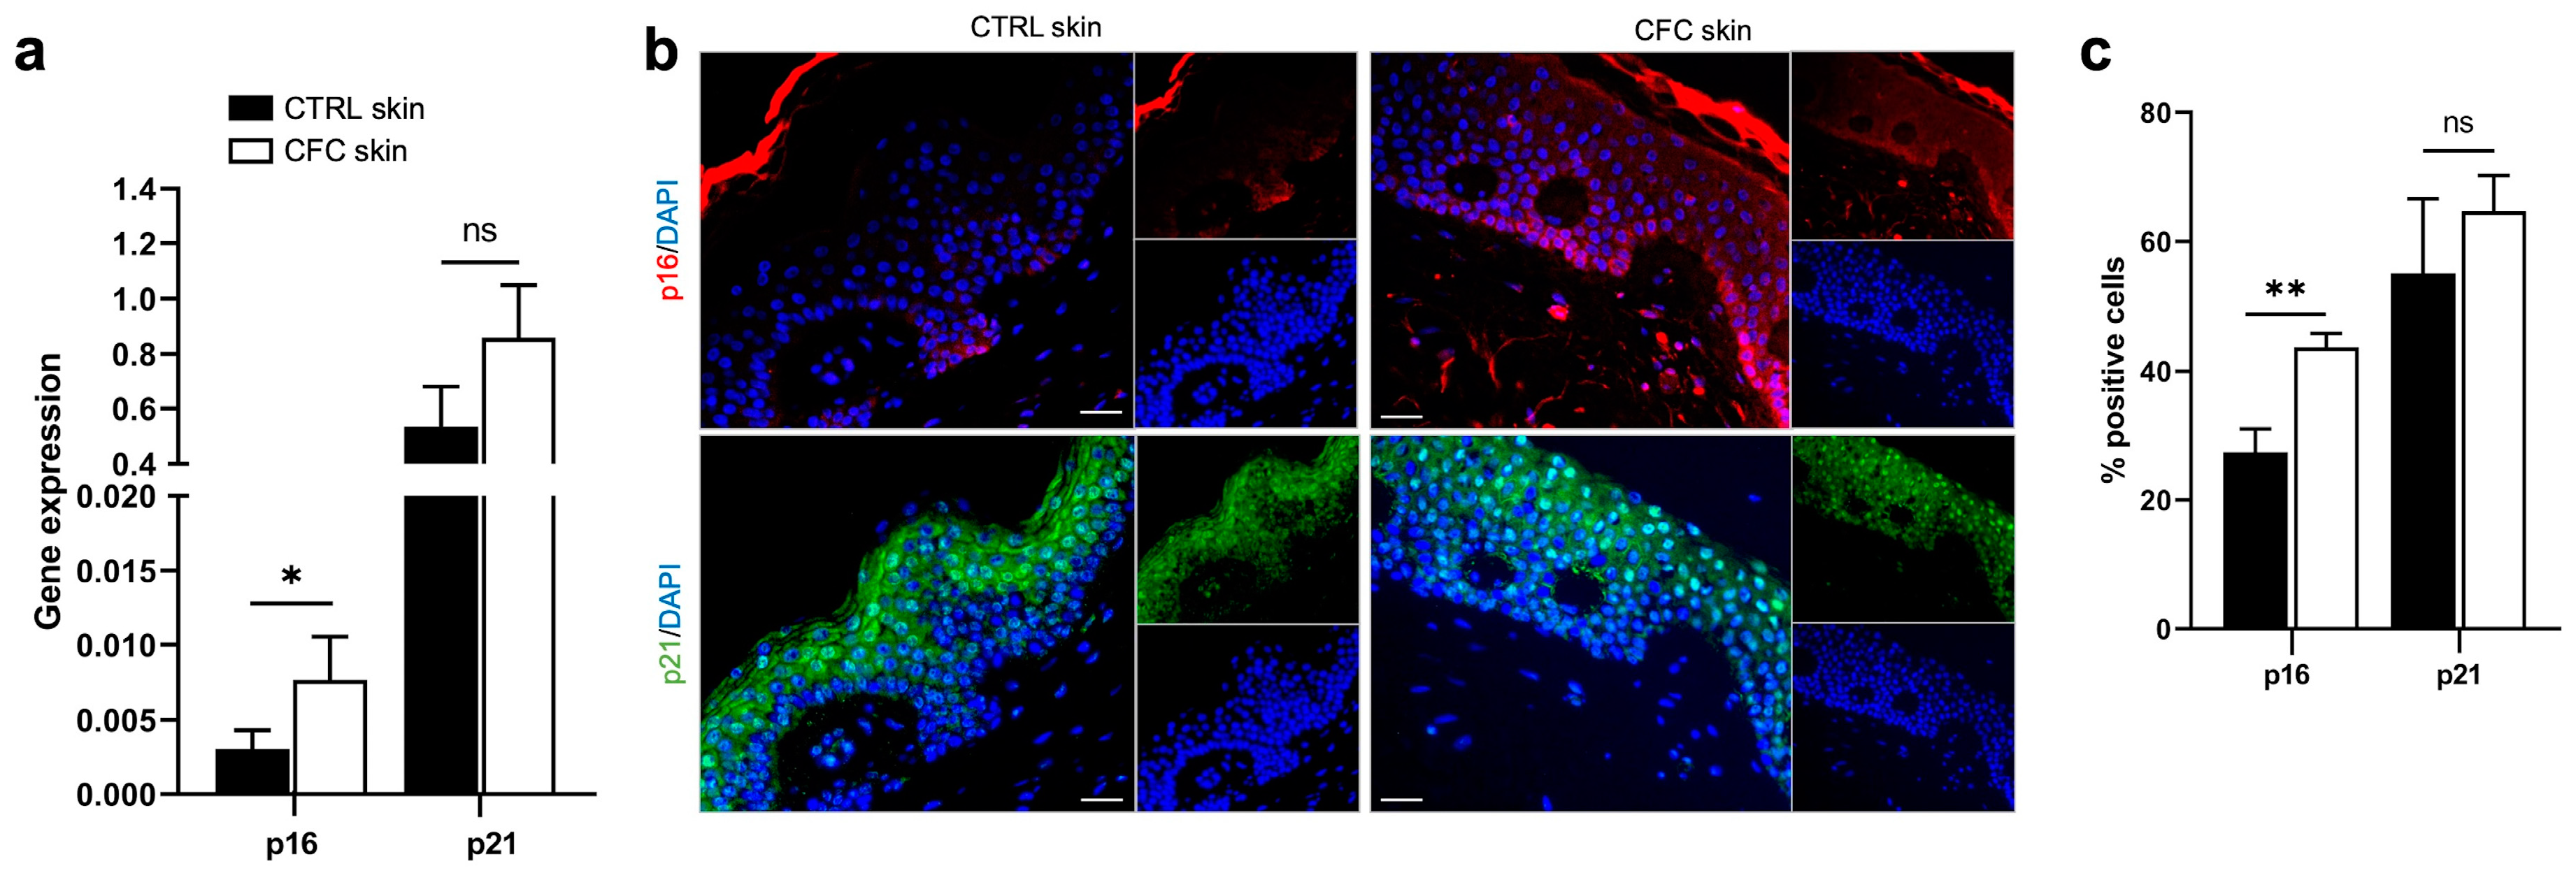
2.2. Cell Cycle Is Impaired in CFC

To correctly repair UV-induced DNA damage, cells activate the expression of cyclin-dependent kinase (CDK) inhibitors, together with p53, to arrest the cell cycle [31]. To verify whether this fundamental pathway could be affected by UVR, we investigated the expression of the CDK inhibitors and tumor suppressors p16 and p21 (Figure 2). We found that both p16 and p21 gene expression was upregulated in CFC skin samples, although a significant difference was observed only for p16 (Figure 2a). Through IF we observed that p16 was mostly expressed on keratinocytes of the basal layers, while p21 expression was diffused on spinous and granular layers of the epidermis (Figure 2b) of both normal and CFC samples. In accordance with gene expression results, we found that the number of cells expressing both proteins was higher in the CFC skin in comparison with normal skin, despite a significant difference was detected only with p16 (Figure 2c).

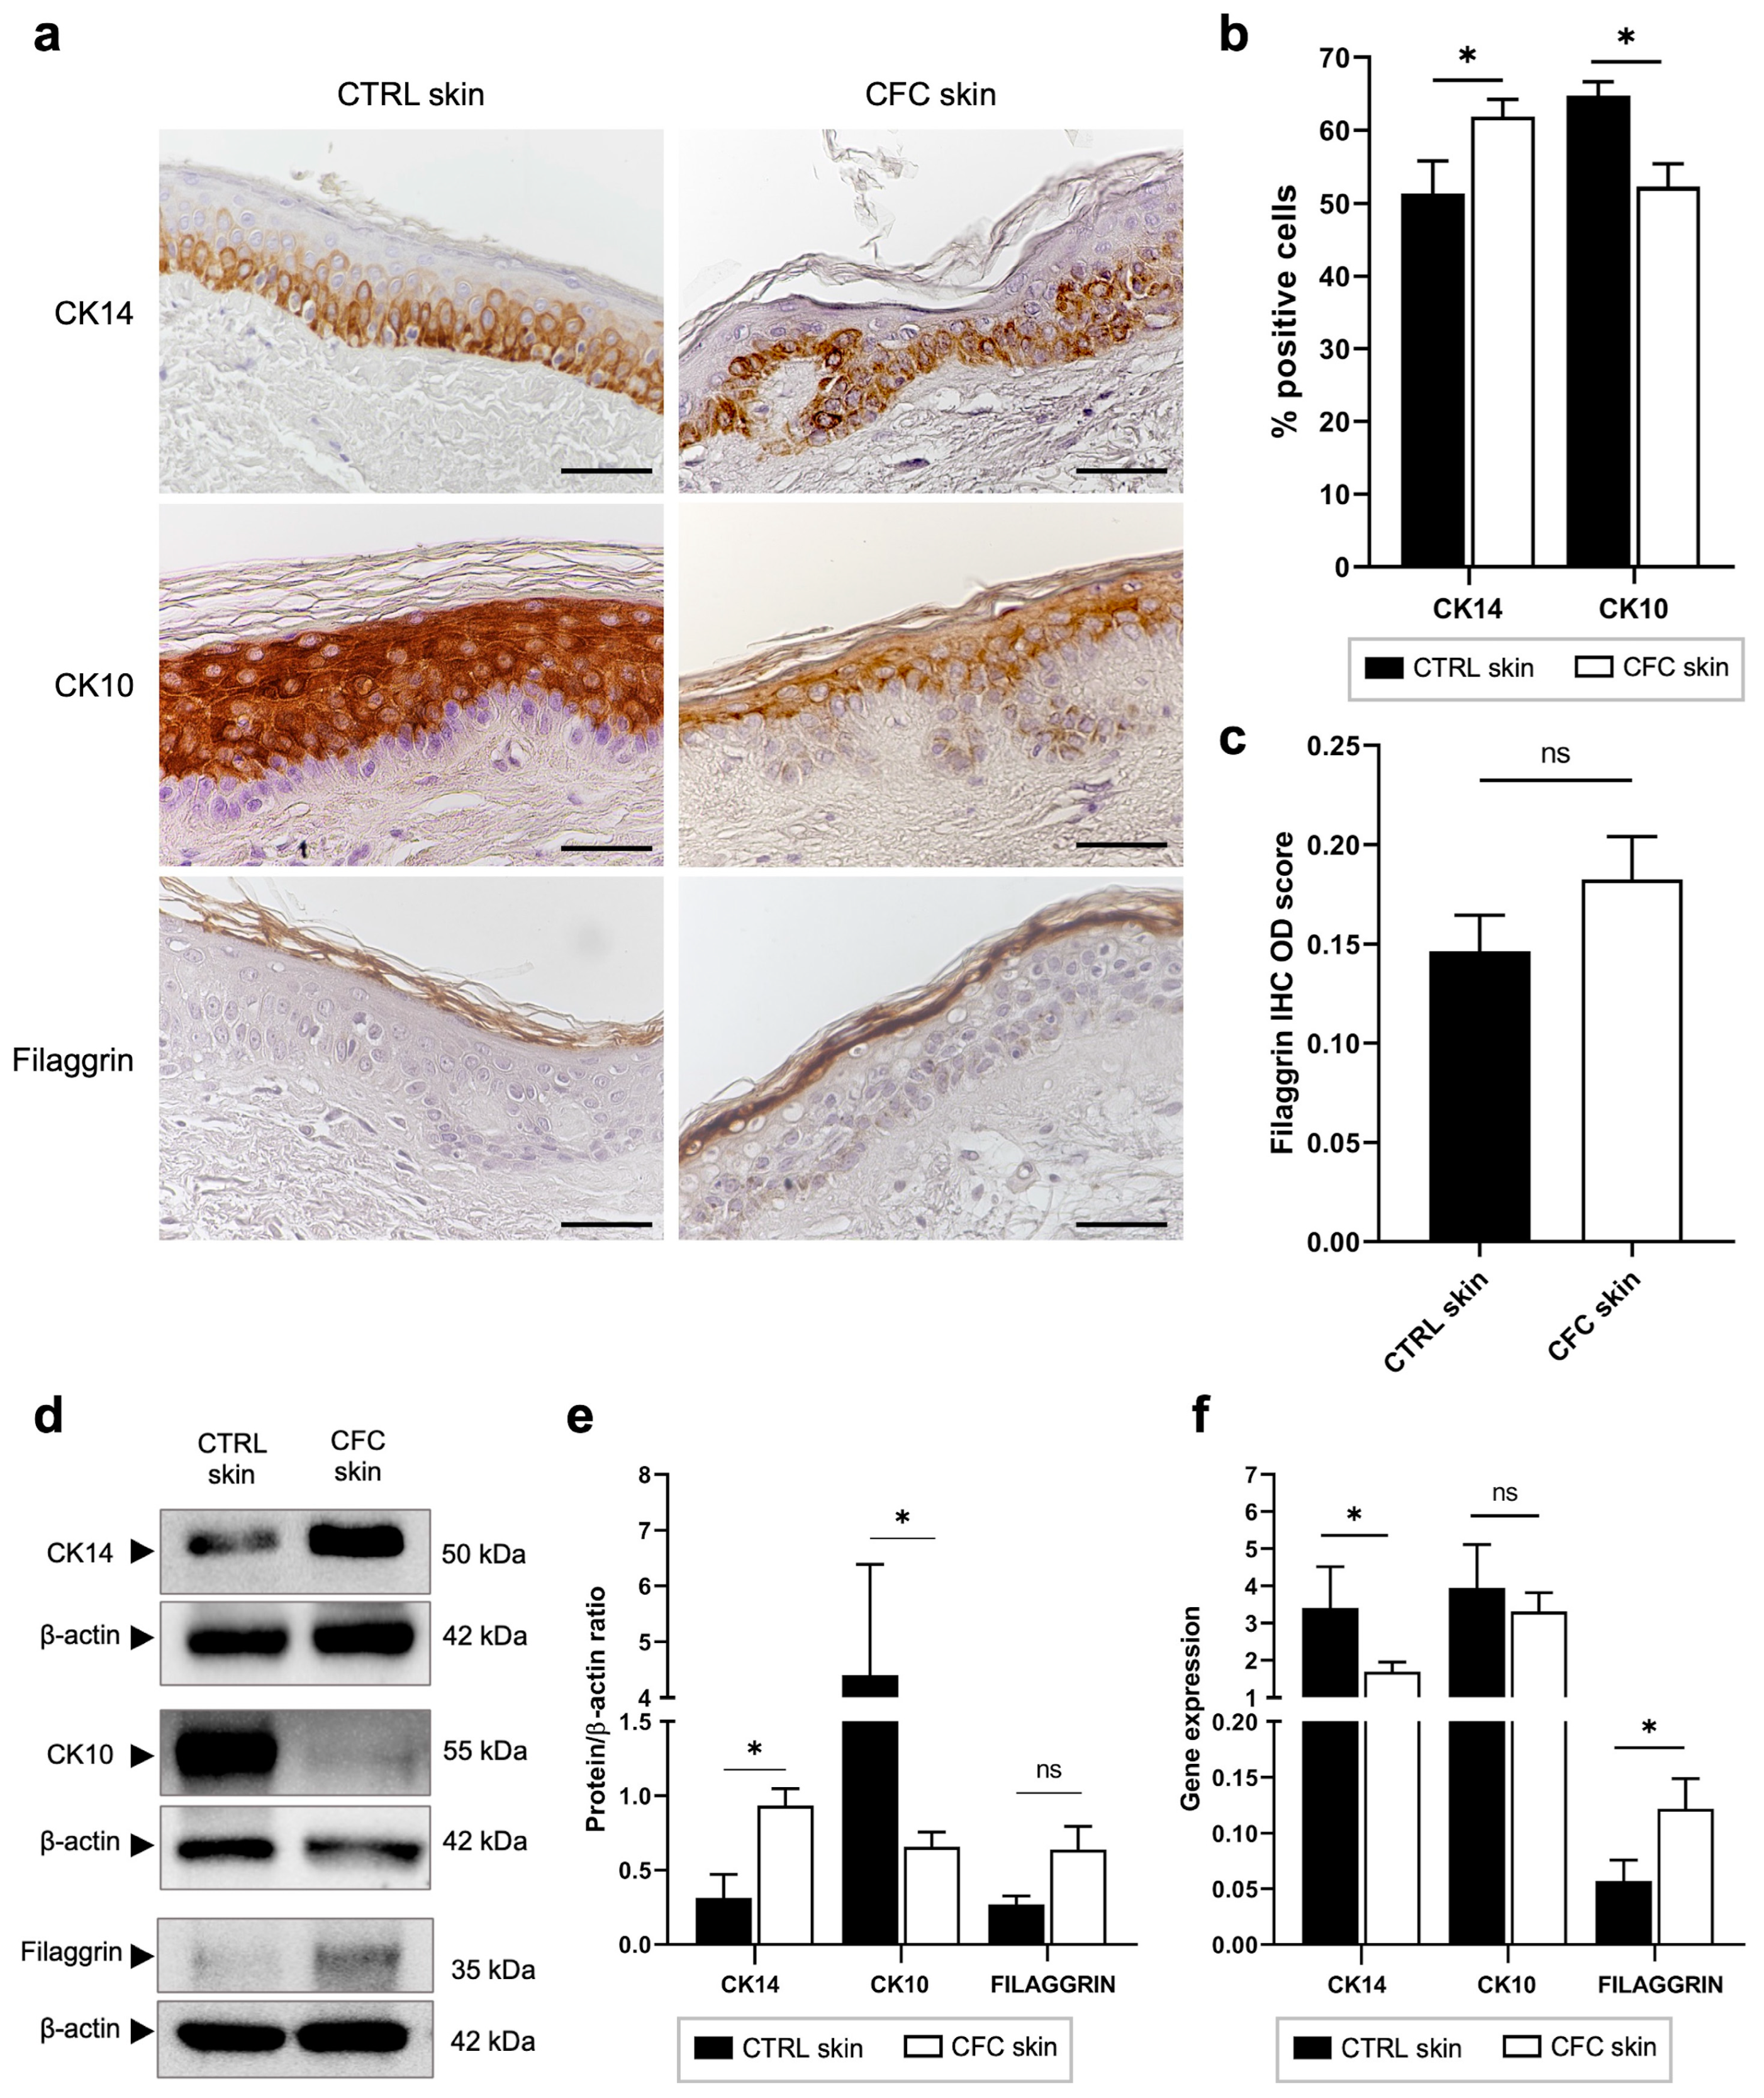
2.3. Analysis of Keratinocytes Differentiation Markers

CK14 and CK10 are intermediate filaments expressed by keratinocytes of the basal and spinous layers, respectively [32], while Filaggrin is expressed by full-differentiated keratinocytes on the stratum corneum [33]. Despite their important role in keratinocyte differentiation, no data are available about their expression on CFC. Hence, we evaluated their protein and gene expression in both normal and CFC biopsies (Figure 3).
Through IHC we observed that in control samples keratinocytes differentiated normally, as evidenced by the coordinate expression of CK14, CK10, and Filaggrin on their respective layers (Figure 3a), while in CFC skin, the cell differentiation process was altered. Indeed, we found that CK14 and CK10 expressions, respectively, were up- and down-regulated, evaluating both the number of IHC-positive cells (Figure 3b) and protein expression through Western blot analysis (Figure 3d,e). Analyzing the gene expression (Figure 3f), we found that CK14 and Filaggrin were down- and up-regulated in the CFC tissue, respectively, while no significant difference was found when analyzing CK10 expression. Moreover, we recorded a slight, but not significant, increased expression of Filaggrin both in terms of IHC optical density (Figure 3c) and Western blot analysis (Figure 3d,e).

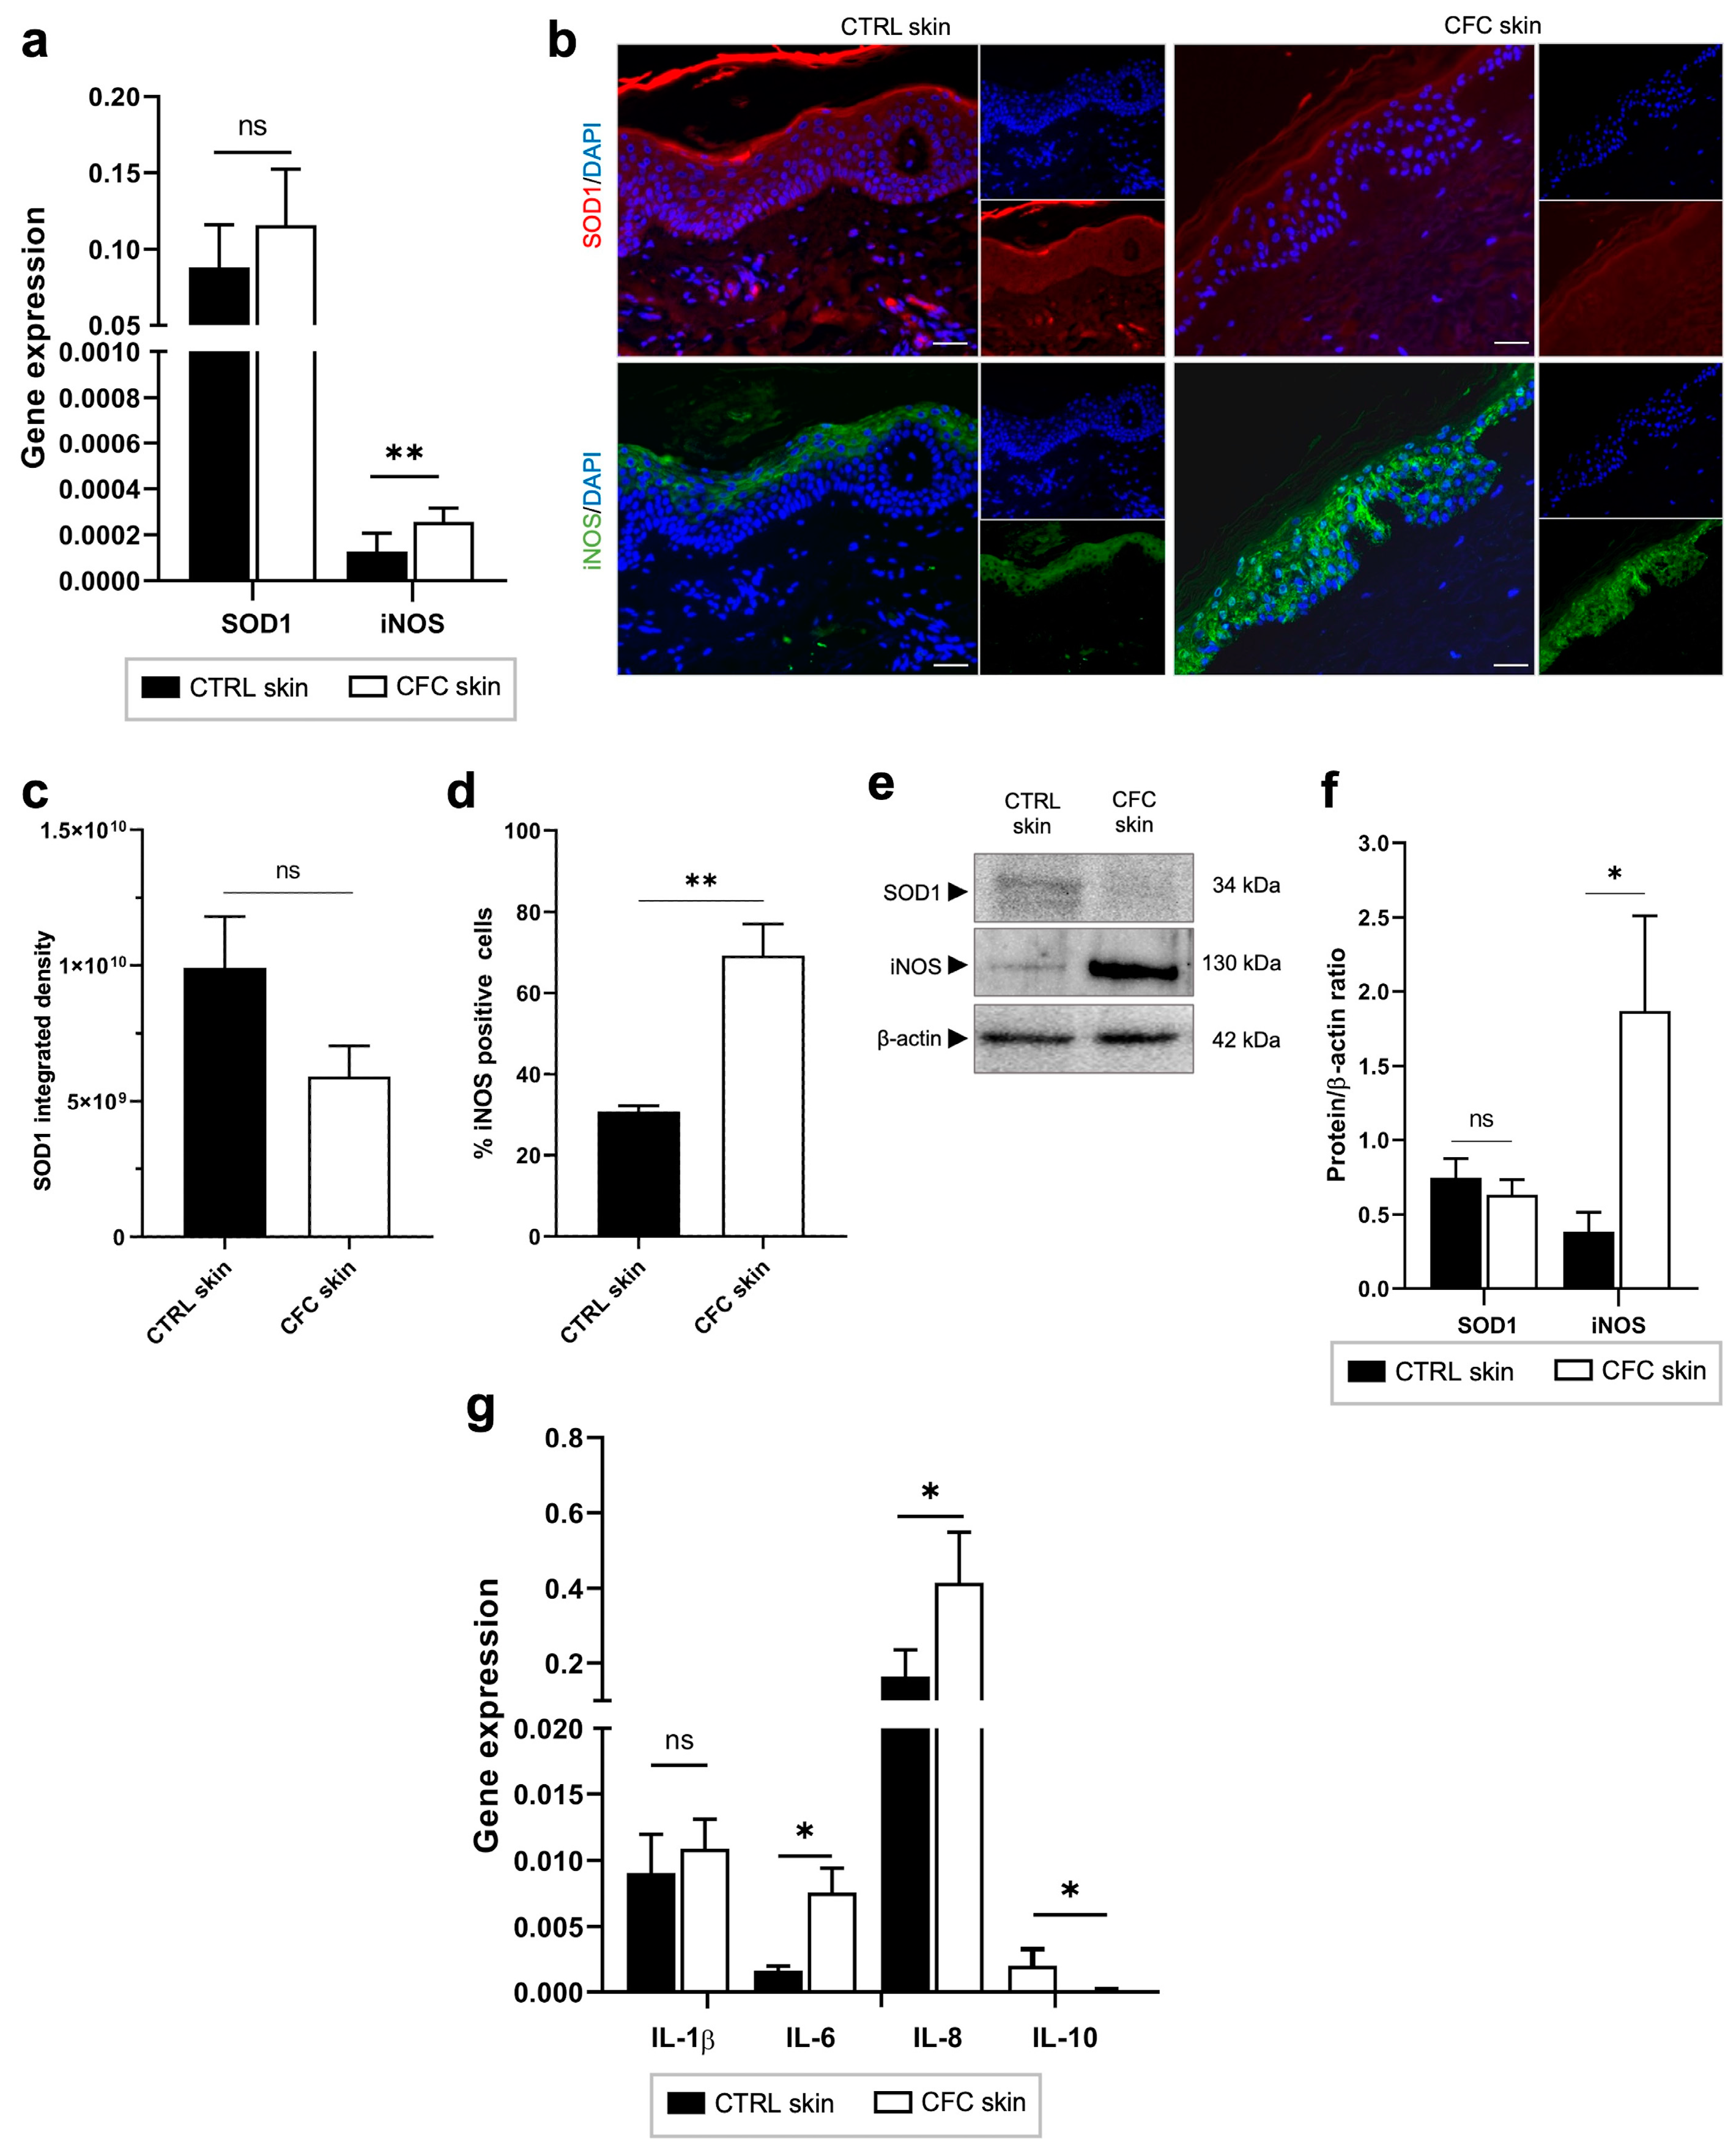
2.4. Oxidative Stress and Inflammation in CFC

UVR exposure triggers the generation of oxidative stress and inflammation, both contributors to DNA damage and photocarcinogenesis through the production of ROS [34]. Here, we evaluated the expression of antioxidant superoxide dismutase 1 (SOD1), iNOS, and pro- and anti-inflammatory cytokines (Figure 4). As shown in Figure 4a, we found that iNOS gene expression was significantly increased in the CFC samples compared with control skin, while no significant difference was observed in SOD1 expression. Similar results were observed through protein expression analysis. Indeed, no significant changes were recorded in SOD1 protein expression (Figure 4b,c), in contrast with iNOS that was expressed by a significantly greater percentage of cells (Figure 3b,d) recording high level of protein expression (Figure 4e,f). Moreover, we observed that whereas in normal skin iNOS is mainly expressed in the upper layers of the epidermis, in CFC, this protein is present also in the spinous and the basal layer.
Finally, analyzing inflammatory cytokine expression, we observed in photoexposed skin samples a remarkable overexpression of IL-6 and IL-8 and a downregulation of IL-10 at the gene level (Figure 4g).

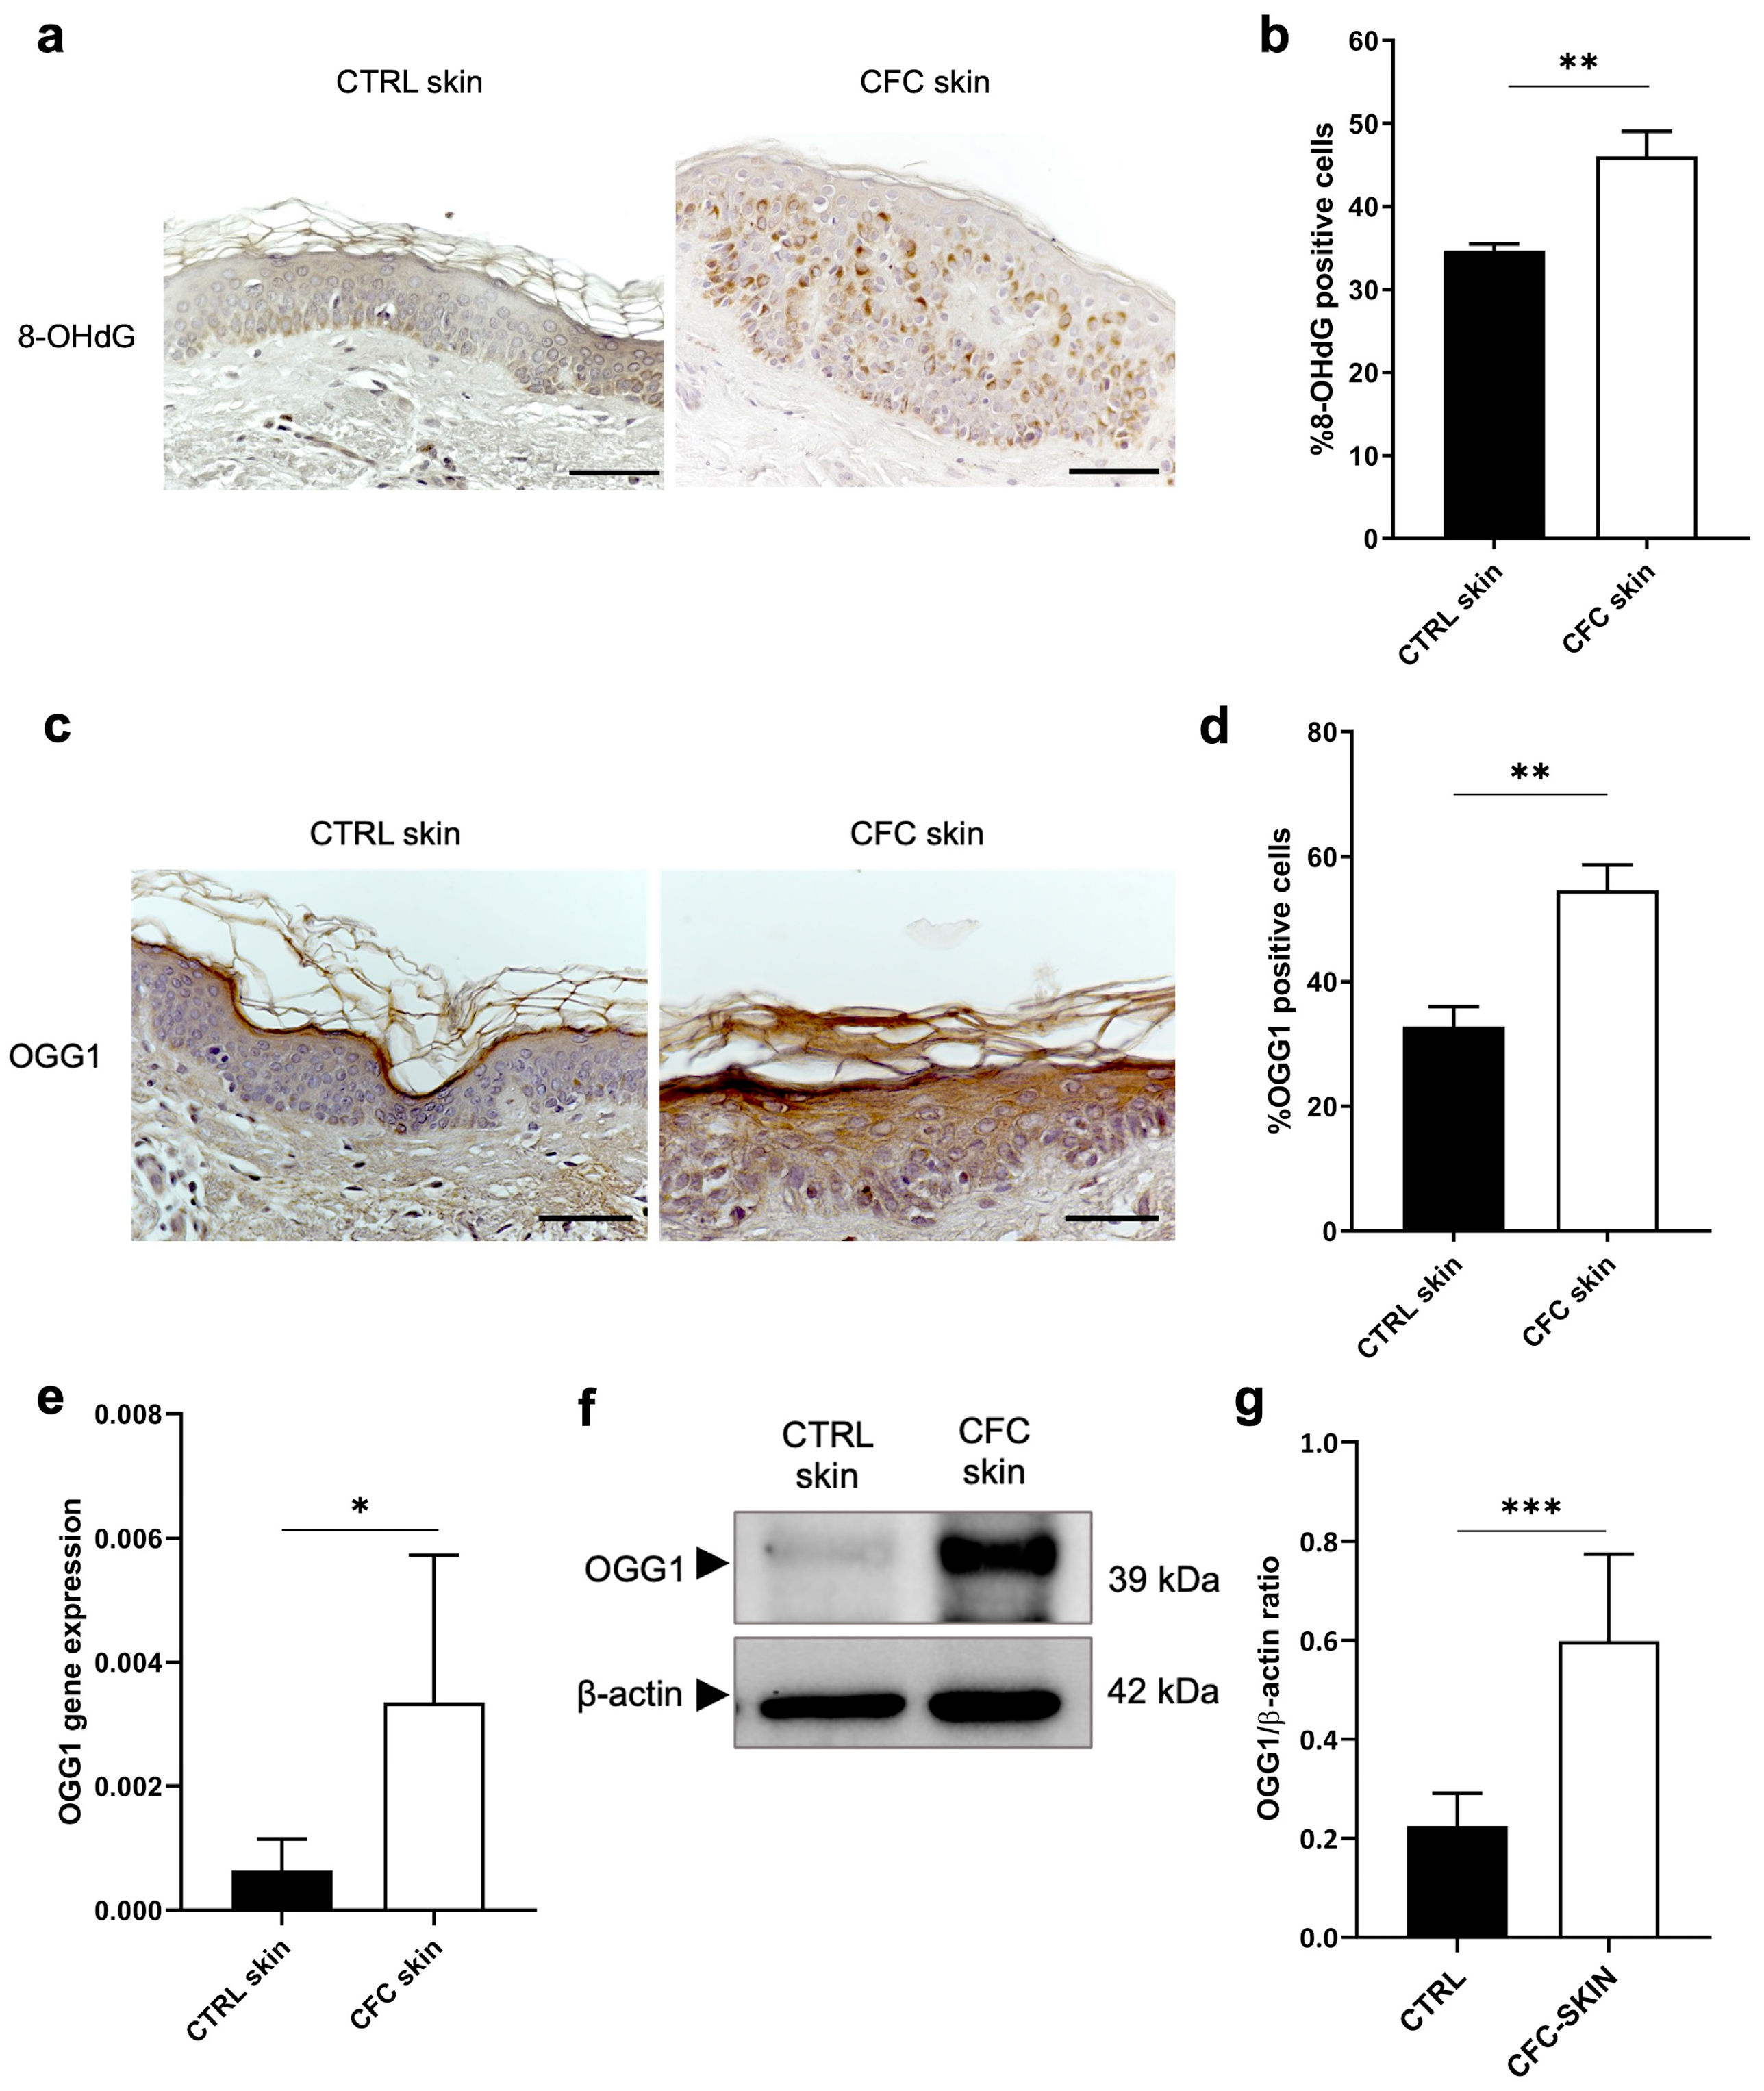
2.5. Analysis of Oxidative DNA Damage

ROS can react with nucleotides inducing the formation of oxidative base lesions like the 8-OHdG that is promptly excised by the 8-oxoguanine DNA glycosylase (OGG1) enzyme [35]. If left uncorrected, this DNA damage contributes to the accumulation of gene mutations within DNA molecules [36]. Thus, we investigated the expression of 8-OHdG and OGG1 in CFC as early signs of photodamage (Figure 5). Through IHC, we observed that 8-OHdG was mostly present in the basal and spinous layers of CFC epidermis (Figure 5a), recording a higher number of positive cells compared with control skin (Figure 5b). Consequently, we found an increased OGG1 gene expression (Figure 5c,e) in the CFC samples, which also correlated with a protein overexpression (Figure 5f) in terms of the number of positive cells (Figure 5d) and protein expression (Figure 5f,g).

3. Discussion

CFC is primarily responsible for initiating skin cancer, operating through a complex multistep mutagenesis process [36,37]. Ultraviolet radiation (UVR) critically affects CFC’s development and progression into neoplastic states by inducing mutations in essential growth-regulating genes, including TP53, NOTCH1-2, p21, and p16 [22,24,37]. These mutations disrupt normal cellular proliferation and facilitate escape from cell cycle control mechanisms [1]. Moreover, UV exposure amplifies the production of reactive oxygen species (ROS) through several pathways, notably those mediated by nuclear factor (erythroid-derived 2)-like 2 (NRF2) [38,39], NF-kB, and p63 [40,41]. Repeated UV exposure leads to additional cellular changes, causing cells to expand and displace normal tissue, ultimately contributing to the formation of AKs and cSCCs [42]. Identifying reliable biomarkers for treatment response in CFC remains a significant challenge.
Our study unveils previously unreported insights into CFC cell and molecular biology, showing that keratinocytes at this site exhibit early signs of UVR-induced alterations, such as reduced p53 expression, increased cell proliferation, altered cell cycles, and changes in keratinocyte differentiation, alongside the presence of oxidative stress, inflammation, and DNA damage. P53, one of the most frequently mutated genes in human cancers [4,43], appears to play a critical role in the development of CFC. Multiple studies have documented the presence of p53-mutated cell clones within chronically photoexposed skin and in both AKs and cSCCs [44,45]. However, data regarding the expression of wild-type (WT) p53 in CFC were lacking. Our investigation into both gene and protein levels in our CFC samples reveals a significant downregulation compared to healthy skin, where p53 is abundantly expressed in basal layer keratinocytes. This aligns with findings by Gupta and Ramani, who observed a complete absence of p53 staining in histological specimens of oral squamous cell carcinoma (OSCC) [46]. The reduced expression of p53 might result from negative interactions with MDM2 and MDM4 [47] or from mutations leading to a truncated p53 form undetectable by monoclonal antibodies. These observations suggest that WT-p53 expression could serve as an indicator of UVR damage and potentially as a biomarker for CFC, pending further verification.
Considering p53’s role in cell cycle arrest, we also examined the expression of cell cycle inhibitors p16 and p21, which play essential roles in cell cycle control by coordinating internal and external signals and impeding proliferation at several key checkpoints (reviewed in 10.1016/j.bcp.2023.115739). We observed an upregulation of both factors, although the increase in p21 was not statistically significant compared to healthy controls, suggesting an alteration of cell cycle checkpoints in photoexposed skin. This observation is consistent with Hodges et al. [28] and Marinescu et al. [48], who have linked p16 and p21 expression with the early stages of skin tumorigenesis and with UVR-induced cell cycle arrest phases G1 and G2 [49].
Additionally, we evaluated Ki67 expression as a cell proliferation marker and found it upregulated in CFC, particularly in the basal layer where keratinocyte stem cells reside. This finding is consistent with studies by Birajdar et al. [50] and Montebugnoli et al. [51], who reported abnormal Ki67 expression in and around OSCC lesions. To our knowledge, no other studies have assessed Ki67 expression specifically in CFC.
Moreover, we investigated the expression of keratinocyte differentiation markers CK14, CK10, and Filaggrin in CFC samples. Overexpression of CK14 and Filaggrin and downregulation of CK10 were observed, although gene and protein expressions were not always concordant, possibly due to the low number of patients and their heterogeneity or to alterations in the translation process or epigenetic effects. These preliminary findings are unique as no prior studies have explored these markers in CFC. Notably, they correlate with results by Choi et al. [52] and Sun et al. [53], who have documented changes in these protein levels during AK to SCC progression and in SCCs, respectively.
Finally, we analyzed oxidative stress and inflammation markers, discovering upregulated expression of iNOS and SOD1 and altered levels of cytokines IL-6, IL-8, and IL-10 in photoexposed samples [36]. Although the impact of oxidative stress and inflammation on skin cancer has been extensively documented [54], no studies have specifically examined SOD1 and iNOS expression in the CFC. Lastly, we assessed markers of oxidative DNA damage, 8-OHdG and OGG1, finding elevated levels in CFC keratinocytes, which corroborates findings by Yoshifuku et al. [55] regarding their overexpression in AKs and SCCs.

4. Materials and Methods

4.1. Patient Population and Skin Biopsies

In this study, we enrolled between 2019 and 2023 66 subjects (48 males, 18 females; average age 72.6 ± 12.7 years) of which 41 patients (33 males, 8 females; average age 79.0 ± 9.5 years) were affected by precancerous skin lesions, non-melanoma skin cancer (NMSC), and/or cutaneous melanoma developed on cutaneous field cancerization (CFC) areas and 25 unaffected subjects were used as healthy control (CTRL) (15 males, 10 females; average age 71.2 ± 15.6 years). Patients and healthy controls were not matched; however, differences in terms of gender composition and median age were not statistically significant. The diagnosis and surgical treatment were performed at the Dermatology Unit of AOU Maggiore della Carità, Novara (Italy), and all donors signed the informed consent approved by the competent ethical board. All patients were treated according to the best clinical practice. From each subject enrolled, we collected a small biopsy at a distance not exceeding 2 cm from resection margins of perilesional skin in the case of CFC patients, and non-photoexposed areas from the control population. Age, biological gender, anatomical site of samples, and type of skin cancer diagnosed (only for CFC patients) are presented in Table 1 for CTRL subjects and Table 2 for CFC patients. Full-thickness skin biopsies (7 CTRL, 10 CFC) were formalin-fixed, paraffin-embedded (FFPE) to perform immunohistochemistry (IHC) and indirect immunofluorescence (IF), while 18 CTRL skin biopsies and 31 CFC skin biopsies were treated to extract protein and RNA from the epidermis.

4.2. Separation and Lysis of Epidermis

Skin biopsies were washed three times with ethanol 75% and NaCl 0.9% solution and cut into small pieces. Then, samples were incubated with Dispase II 2 mg/mL (Merck KGaA, Darmstadt, Germany) prepared in Dulbecco’s modified eagle medium (DMEM) added with penicillin/streptomycin, at 4 °C overnight. Skin biopsies were incubated for at least 1 h at 37 °C, 5% CO2, and the epidermis was separated, weighed, and stored on ice. Samples were lysed with TRIzol reagent (Fisher Molecular Biology, Trevose, PA, USA) for RNA extraction and with RIPA lysis buffer (Merck KGaA) supplemented with protease inhibitor cocktail (Thermo Fisher, Waltham, MA, USA) and phosphatase inhibitors for protein isolation. Tissue lysis was performed on ice using a glass homogenizer and with 1 mL of lysis buffer per 50–100 mg of tissue.

4.3. Immunohistochemistry (IHC)

Four-μm FFPE skin samples were deparaffinized and rehydrated in xylene and ethanol (100%, 95%, 90% and 75%) and washed with phosphate buffer saline (PBS). Slides were heated in microwaves for 5 min at 550 W in citrate buffer pH 6.0 (Vector Laboratories, Burlingame, CA, USA) for antigen unmasking. Endogenous peroxidases and non-specific bindings were blocked by incubating with Peroxidase 1 solution (Biocare Medical, Pacheco, CA, USA) for 10 min at room temperature (RT) and with Blocking Solution Vectastain ABC system (Vector Laboratories) for 30 min at RT. Then, primary antibodies anti-p53, anti-Ki67, anti-CK14, anti-CK10, anti-Filaggrin, anti-OGG1, and anti-8-OHdG were prepared (Supplementary Table S1), and added for 1 h at RT. Subsequently, slides were incubated with secondary biotinylated antibody (Vector Laboratories) and Vectastain ABC reagent (Vector Laboratories) for 30 min at RT each. ImmPACT DAB (Vector Laboratories) was used as a chromogen. Sections were counterstained with Gill’s Hematoxylin (Bio Optica, Milan, Italy) and dehydrated by soaking with graded ethanol (75%, 95%, 100%) and xylene. Cover slips were mounted using VectaMount Mounting Medium (Vector Laboratories). Pictures were taken using an optical microscope Nikon ECLIPSE Ci and cell count was performed using ImageJ software [56] (https://imagej.net/ij/, accessed on 23 May 2024). Cell positivity was calculated as the percentage of positive cells out of the total of cells present in the full-thickness epidermis (dermis was excluded). For each patient, we counted cells from four different fields. IHC optical density (OD) was performed using ImageJ software [56]. Briefly, the epidermis was countered using the polygon sections tool and the mean grey value was measured. Then, the OD was calculated as Log (max intensity/mean intensity). For each sample, three pictures from different areas were taken and measured.

4.4. Indirect Immunofluorescence (IF)

Next, 4 μm FFPE slides were dewaxed and heated for antigen retrieval with Tris-based unmasking solution pH 9.0 (Vector Laboratories) in a microwave for 5 min at 550 W. Slides were washed in PBS and incubated with blocking solution (BSA 5%, PBS 1x, Triton 0.1%) for 1 h at RT. Then, primary antibodies anti-p16, anti-p21, anti-SOD1, and anti-iNOS were diluted as indicated in Supplementary Table S1 in dilution buffer (BSA 2%, PBS 1x, Triton 0.1%) and incubated for 2 h at RT. After rinsing in PBS 1x + 0.1% Tween20, slides were incubated with DAPI (1:500, Merck KGaA) and secondary antibodies anti-mouse Alexa Fluor-546 and anti-rabbit Alexa-Fluor-488 (1:500, Thermo Fisher) for 45 min at RT in the dark. Finally, slides were washed in PBS 1x and mounted with glycerol/PBS 1x solution (9:1). Pictures were taken with an optical fluorescent microscope Leica DS5500B (Leica Microsystems, Inc., Buffalo Grove, IL, USA). The percentage of positive cells was expressed as the number of iNOS-stained cells divided by the total number of cells stained with DAPI counted in full-thickness epidermis of four different fields for each sample (the dermis was excluded). SOD1 integrated density was measured using ImageJ software using the formula: mean gray value* area.

4.5. Quantitative Real-Time PCR

The epidermis was separated and lysed in TRIzol reagent as described in Section 4.2. RNA was isolated according to manufacturer’s instructions. Briefly, samples were incubated with chloroform for phase separation and centrifuged at 12,000× g for 15 min at 4 °C. The aqueous phase was transferred in a fresh tube and isopropanol was added. Samples were centrifuged at 12,000× g for 10 min at 4 °C. Supernatants were discarded and RNA precipitates were washed with ethanol 75% prepared in DEPC (diethylpyrocarbonate) water and centrifuged at 12,000× g for 5 min at 4 °C. The excess ethanol was removed, and the RNA pellets were allowed to dry. Total RNA purity and concentration was quantified at the spectrophotometer (Nanodrop, Thermo Fisher) by measuring the optical density at 260 and 280 nm. Reverse transcription and cDNA synthesis was performed using a High-capacity cDNA reverse transcription kit (Applied Biosystems, Foster City, CA, USA) according to the manufacturer’s instructions. qRT-PCR was performed using SensiFast SYBR No-Rox kit (Bioline, London, UK) with forward and reverse primers (Supplementary Table S2) on the Bio-rad CFX96 Touch Real-Time PCR Detection System (Biorad, Hercules, CA, USA). GAPDH was used as the housekeeping gene for data normalization.

4.6. Western Blotting

The epidermis was separated and lysed using RIPA buffer as described in Section 4.2. Proteins were quantified with BCA assay (Thermo Fisher) and denaturized with 2× Loading Buffer (Merck KGaA) at 95 °C for 5 min. 30 μg of denaturized proteins were loaded on SDS-PAGE gel at 10% acrylamide. Proteins were transferred to a PVDF membrane and incubated with primary antibodies anti-p53, anti-CK14, anti-CK10, anti-Filaggin, anti-OGG1, anti-iNOS, and anti-SOD1 as indicated in Supplementary Table S1. Specific secondary antibodies HRP-conjugated were added for 1 h at RT. Membranes were developed using enhanced chemiluminescence method (ECL, Biorad, Hercules, CA, USA) and acquired with ChemiDoc Imaging System (Biorad, Hercules, CA, USA). Β-actin was used for housekeeping. The relative band intensity was quantified using ImageJ software. Densitometric analysis data are expressed as protein/β-actin ratio.

4.7. Statistical Analysis

Statistical analysis was performed using GraphPad Prism 8 (San Diego, CA, USA). Data were expressed as mean ± SEM of n different samples. Statistical significance was assessed by using Student’s t-test among CTRL skin and CFC skin samples. Statistical significance was defined as p < 0.05.

5. Conclusions

Our study significantly advances the understanding of cutaneous field cancerization (CFC) by demonstrating, for the first time, the downregulation of wild-type p53 and an increase in cell proliferation despite high levels of CDK inhibitor expression within the CFC. Additionally, our findings reveal that chronic exposure to ultraviolet radiation (UVR) not only triggers inflammation and oxidative stress but also actively contributes to the production of reactive oxygen species (ROS) and DNA damage, thus underlining the critical molecular dynamics at play in the development of CFC. Despite the limitations of our study, such as the limited number of patients analyzed, our findings open new avenues for research on the molecular mechanisms behind CFC development, thus identifying novel targets for preventing chronic actinic damage and treating CFC. Furthermore, exploring the role of dermal changes induced by UVR in the process of field cancerization and skin cancer development could prove extremely valuable. This deeper insight could lead to significant advancements in the strategies for managing and mitigating skin cancer risks associated with chronic UVR exposure.

Supplementary Materials

The following supporting information can be downloaded at: https://www.mdpi.com/article/10.3390/ijms25115775/s1.

Author Contributions

Conceptualization, L.C. and P.S.; methodology, L.C. and P.S.; validation, L.C., E.Z., F.V., L.C.G., O.C. and P.S.; formal analysis, L.C., E.Z., F.V., L.C.G. and P.S.; investigation, L.C., E.Z. and P.S.; resources, L.C., O.C. and P.S.; data curation, L.C., E.Z. and P.S.; writing—original draft preparation, L.C. and P.S.; writing—review and editing, L.C., E.Z., F.V., L.C.G., O.C. and P.S.; visualization, L.C., E.Z., F.V., L.C.G., O.C. and P.S.; supervision, P.S.; project administration, L.C., E.Z. and P.S.; funding acquisition, O.C. and P.S. All authors have read and agreed to the published version of the manuscript.

Funding

This research received no external funding.

Institutional Review Board Statement

Not applicable.

Informed Consent Statement

Informed consent was obtained from all subjects involved in the study.

Data Availability Statement

The data presented on this study are available on request from the corresponding author.

Conflicts of Interest

The authors declare no conflicts of interest.

References

  1. Curtius, K.; Wright, N.A.; Graham, T.A. An Evolutionary Perspective on Field Cancerization. Nat. Rev. Cancer 2018, 18, 19–32. [Google Scholar] [CrossRef] [PubMed]
  2. Slaughter, D.P.; Southwick, H.W.; Smejkal, W. Field Cancerization in Oral Stratified Squamous Epithelium; Clinical Implications of Multicentric Origin. Cancer 1953, 6, 963–968. [Google Scholar] [CrossRef] [PubMed]
  3. Braakhuis, B.J.M.; Tabor, M.P.; Kummer, J.A.; Leemans, C.R.; Brakenhoff, R.H. A Genetic Explanation of Slaughter’s Concept of Field Cancerization: Evidence and Clinical Implications. Cancer Res. 2003, 63, 1727–1730. [Google Scholar] [PubMed]
  4. Willenbrink, T.J.; Ruiz, E.S.; Cornejo, C.M.; Schmults, C.D.; Arron, S.T.; Jambusaria-Pahlajani, A. Field Cancerization: Definition, Epidemiology, Risk Factors, and Outcomes. J. Am. Acad. Dermatol. 2020, 83, 709–717. [Google Scholar] [CrossRef] [PubMed]
  5. Fernandez Figueras, M.T. From Actinic Keratosis to Squamous Cell Carcinoma: Pathophysiology Revisited. J. Eur. Acad. Dermatol. Venereol. 2017, 31 (Suppl. S2), 5–7. [Google Scholar] [CrossRef] [PubMed]
  6. Huang, A.; Nguyen, J.K.; Austin, E.; Mamalis, A.; Jagdeo, J. Updates on Treatment Approaches for Cutaneous Field Cancerization. Curr. Dermatol. Rep. 2019, 8, 122–132. [Google Scholar] [CrossRef] [PubMed]
  7. Morton, S.; Muir, J. Field Cancerization in the Skin: Past Errors Repeated. J. Am. Acad. Dermatol. 2021, 85, e41. [Google Scholar] [CrossRef] [PubMed]
  8. Willenbrink, T.J.; Ruiz, E.S.; Cornejo, C.M.; Schmults, C.D.; Arron, S.T.; Jambusaria-Pahlajani, A. Field Cancerization: Looking to the Future. J. Am. Acad. Dermatol. 2021, 85, e43–e44. [Google Scholar] [CrossRef] [PubMed]
  9. Amin, M.B.; Edge, S.B.; Greene, F.L.; Byrd, D.R.; Brookland, R.K.; Washington, M.K.; Gershenwald, J.E.; Compton, C.C.; Hess, K.R.; Sullivan, D.C.; et al. AJCC Cancer Staging Manual; Springer International Publishing: Berlin/Heidelberg, Germany, 2018; ISBN 978-3-319-40617-6. [Google Scholar]
  10. Torezan, L.A.R.; Festa-Neto, C. Cutaneous Field Cancerization: Clinical, Histopathological and Therapeutic Aspects. An. Bras. Dermatol. 2013, 88, 775–786. [Google Scholar] [CrossRef]
  11. Matsumura, Y.; Ananthaswamy, H.N. Toxic Effects of Ultraviolet Radiation on the Skin. Toxicol. Appl. Pharmacol. 2004, 195, 298–308. [Google Scholar] [CrossRef]
  12. Fisher, G.J.; Kang, S.; Varani, J.; Bata-Csorgo, Z.; Wan, Y.; Datta, S.; Voorhees, J.J. Mechanisms of Photoaging and Chronological Skin Aging. Arch. Dermatol. 2002, 138, 1462–1470. [Google Scholar] [CrossRef] [PubMed]
  13. D’Orazio, J.; Jarrett, S.; Amaro-Ortiz, A.; Scott, T. UV Radiation and the Skin. Int. J. Mol. Sci. 2013, 14, 12222–12248. [Google Scholar] [CrossRef] [PubMed]
  14. Klaunig, J.E. Oxidative Stress and Cancer. Curr. Pharm. Des. 2018, 24, 4771–4778. [Google Scholar] [CrossRef]
  15. Valavanidis, A.; Vlachogianni, T.; Fiotakis, C. 8-Hydroxy-2′-Deoxyguanosine (8-OHdG): A Critical Biomarker of Oxidative Stress and Carcinogenesis. J. Environ. Sci. Health C Environ. Carcinog. Ecotoxicol. Rev. 2009, 27, 120–139. [Google Scholar] [CrossRef]
  16. Kim, Y.; He, Y.-Y. Ultraviolet Radiation-Induced Non-Melanoma Skin Cancer: Regulation of DNA Damage Repair and Inflammation. Genes. Dis. 2014, 1, 188–198. [Google Scholar] [CrossRef] [PubMed]
  17. Halliday, G.M. Inflammation, Gene Mutation and Photoimmunosuppression in Response to UVR-Induced Oxidative Damage Contributes to Photocarcinogenesis. Mutat. Res. 2005, 571, 107–120. [Google Scholar] [CrossRef] [PubMed]
  18. Berman, B.; Cockerell, C.J. Pathobiology of Actinic Keratosis: Ultraviolet-Dependent Keratinocyte Proliferation. J. Am. Acad. Dermatol. 2013, 68, S10–S19. [Google Scholar] [CrossRef] [PubMed]
  19. Ling, G.; Persson, A.; Berne, B.; Uhlén, M.; Lundeberg, J.; Ponten, F. Persistent P53 Mutations in Single Cells from Normal Human Skin. Am. J. Pathol. 2001, 159, 1247–1253. [Google Scholar] [CrossRef]
  20. Jonason, A.S.; Kunala, S.; Price, G.J.; Restifo, R.J.; Spinelli, H.M.; Persing, J.A.; Leffell, D.J.; Tarone, R.E.; Brash, D.E. Frequent Clones of P53-Mutated Keratinocytes in Normal Human Skin. Proc. Natl. Acad. Sci. USA 1996, 93, 14025–14029. [Google Scholar] [CrossRef]
  21. Martincorena, I.; Roshan, A.; Gerstung, M.; Ellis, P.; Van Loo, P.; McLaren, S.; Wedge, D.C.; Fullam, A.; Alexandrov, L.B.; Tubio, J.M.; et al. Tumor Evolution. High Burden and Pervasive Positive Selection of Somatic Mutations in Normal Human Skin. Science 2015, 348, 880–886. [Google Scholar] [CrossRef]
  22. South, A.P.; Purdie, K.J.; Watt, S.A.; Haldenby, S.; den Breems, N.; Dimon, M.; Arron, S.T.; Kluk, M.J.; Aster, J.C.; McHugh, A.; et al. NOTCH1 Mutations Occur Early during Cutaneous Squamous Cell Carcinogenesis. J. Investig. Dermatol. 2014, 134, 2630–2638. [Google Scholar] [CrossRef] [PubMed]
  23. Kanellou, P.; Zaravinos, A.; Zioga, M.; Stratigos, A.; Baritaki, S.; Soufla, G.; Zoras, O.; Spandidos, D.A. Genomic Instability, Mutations and Expression Analysis of the Tumour Suppressor Genes P14(ARF), P15(INK4b), P16(INK4a) and P53 in Actinic Keratosis. Cancer Lett. 2008, 264, 145–161. [Google Scholar] [CrossRef] [PubMed]
  24. Chitsazzadeh, V.; Coarfa, C.; Drummond, J.A.; Nguyen, T.; Joseph, A.; Chilukuri, S.; Charpiot, E.; Adelmann, C.H.; Ching, G.; Nguyen, T.N.; et al. Cross-Species Identification of Genomic Drivers of Squamous Cell Carcinoma Development across Preneoplastic Intermediates. Nat. Commun. 2016, 7, 12601. [Google Scholar] [CrossRef] [PubMed]
  25. Miola, A.C.; Castilho, M.A.; Schmitt, J.V.; Marques, M.E.A.; Miot, H.A. Contribution to Characterization of Skin Field Cancerization Activity: Morphometric, Chromatin Texture, Proliferation, and Apoptosis Aspects. An. Bras. Dermatol. 2019, 94, 698–703. [Google Scholar] [CrossRef] [PubMed]
  26. Warino, L.; Tusa, M.; Camacho, F.; Teuschler, H.; Fleischer, A.B.; Feldman, S.R. Frequency and Cost of Actinic Keratosis Treatment. Dermatol. Surg. 2006, 32, 1045–1049. [Google Scholar] [CrossRef] [PubMed]
  27. Cornejo, C.M.; Jambusaria-Pahlajani, A.; Willenbrink, T.J.; Schmults, C.D.; Arron, S.T.; Ruiz, E.S. Field Cancerization: Treatment. J. Am. Acad. Dermatol. 2020, 83, 719–730. [Google Scholar] [CrossRef] [PubMed]
  28. Hodges, A.; Smoller, B.R. Immunohistochemical Comparison of P16 Expression in Actinic Keratoses and Squamous Cell Carcinomas of the Skin. Mod. Pathol. 2002, 15, 1121–1125. [Google Scholar] [CrossRef] [PubMed]
  29. Mohan, M.; Jagannathan, N. Oral Field Cancerization: An Update on Current Concepts. Oncol. Rev. 2014, 8, 244. [Google Scholar] [CrossRef] [PubMed]
  30. Peralta-Mamani, M.; Terrero-Pérez, Á.; Tucunduva, R.M.A.; Rubira, C.M.F.; Santos, P.S.d.S.; Honório, H.M.; Rubira-Bullen, I.R.F. Occurrence of Field Cancerization in Clinically Normal Oral Mucosa: A Systematic Review and Meta-Analysis. Arch. Oral. Biol. 2022, 143, 105544. [Google Scholar] [CrossRef]
  31. Sherr, C.J.; McCormick, F. The RB and P53 Pathways in Cancer. Cancer Cell 2002, 2, 103–112. [Google Scholar] [CrossRef]
  32. Moll, R.; Divo, M.; Langbein, L. The Human Keratins: Biology and Pathology. Histochem. Cell Biol. 2008, 129, 705–733. [Google Scholar] [CrossRef]
  33. Kezic, S.; Jakasa, I. Filaggrin and Skin Barrier Function. Curr. Probl. Dermatol. 2016, 49, 1–7. [Google Scholar] [CrossRef] [PubMed]
  34. Montes de Oca, M.K.; Pearlman, R.L.; McClees, S.F.; Strickland, R.; Afaq, F. Phytochemicals for the Prevention of Photocarcinogenesis. Photochem. Photobiol. 2017, 93, 956–974. [Google Scholar] [CrossRef] [PubMed]
  35. Boiteux, S.; Radicella, J.P. The Human OGG1 Gene: Structure, Functions, and Its Implication in the Process of Carcinogenesis. Arch. Biochem. Biophys. 2000, 377, 1–8. [Google Scholar] [CrossRef] [PubMed]
  36. Nishisgori, C. Current Concept of Photocarcinogenesis. Photochem. Photobiol. Sci. 2015, 14, 1713–1721. [Google Scholar] [CrossRef] [PubMed]
  37. Christensen, S.R. Recent Advances in Field Cancerization and Management of Multiple Cutaneous Squamous Cell Carcinomas. F1000Res 2018, 7, F1000 Faculty Rev-690. [Google Scholar] [CrossRef] [PubMed]
  38. Wang, R.; Liang, L.; Matsumoto, M.; Iwata, K.; Umemura, A.; He, F. Reactive Oxygen Species and NRF2 Signaling, Friends or Foes in Cancer? Biomolecules 2023, 13, 353. [Google Scholar] [CrossRef] [PubMed]
  39. Panieri, E.; Telkoparan-Akillilar, P.; Saso, L. NRF2, a Crucial Modulator of Skin Cells Protection against Vitiligo, Psoriasis, and Cancer. BioFactors 2023, 49, 228–250. [Google Scholar] [CrossRef] [PubMed]
  40. Zinatizadeh, M.R.; Schock, B.; Chalbatani, G.M.; Zarandi, P.K.; Jalali, S.A.; Miri, S.R. The Nuclear Factor Kappa B (NF-kB) Signaling in Cancer Development and Immune Diseases. Genes. Dis. 2020, 8, 287–297. [Google Scholar] [CrossRef]
  41. Bang, E.; Kim, D.H.; Chung, H.Y. Protease-Activated Receptor 2 Induces ROS-Mediated Inflammation through Akt-Mediated NF-κB and FoxO6 Modulation during Skin Photoaging. Redox Biol. 2021, 44, 102022. [Google Scholar] [CrossRef]
  42. Conforti, C.; Giuffrida, R.; Pizzichetta, M.A.; Di Meo, N.; Magaton-Rizzi, G.; Zalaudek, I. Integrating the Concept of Field Cancerization in the Classification and Risk Assessment of Cutaneous Squamous Cell Carcinoma: Proposal for a New Classification and Terminology of Keratinocyte Skin Cancer. J. Eur. Acad. Dermatol. Venereol. 2019, 33, e327–e330. [Google Scholar] [CrossRef] [PubMed]
  43. Ozaki, T.; Nakagawara, A. P53: The Attractive Tumor Suppressor in the Cancer Research Field. J. Biomed. Biotechnol. 2011, 2011, 603925. [Google Scholar] [CrossRef]
  44. Berg, R.J.; van Kranen, H.J.; Rebel, H.G.; de Vries, A.; van Vloten, W.A.; Van Kreijl, C.F.; van der Leun, J.C.; de Gruijl, F.R. Early P53 Alterations in Mouse Skin Carcinogenesis by UVB Radiation: Immunohistochemical Detection of Mutant P53 Protein in Clusters of Preneoplastic Epidermal Cells. Proc. Natl. Acad. Sci. USA 1996, 93, 274–278. [Google Scholar] [CrossRef] [PubMed]
  45. Kramata, P.; Lu, Y.-P.; Lou, Y.-R.; Singh, R.N.; Kwon, S.M.; Conney, A.H. Patches of Mutant P53-Immunoreactive Epidermal Cells Induced by Chronic UVB Irradiation Harbor the Same P53 Mutations as Squamous Cell Carcinomas in the Skin of Hairless SKH-1 Mice. Cancer Res. 2005, 65, 3577–3585. [Google Scholar] [CrossRef] [PubMed]
  46. Gupta, V.; Ramani, P. Histologic and Immunohistochemical Evaluation of Mirror Image Biopsies in Oral Squamous Cell Carcinoma. J. Oral. Biol. Craniofac Res. 2016, 6, 194–197. [Google Scholar] [CrossRef] [PubMed]
  47. Duffy, M.J.; Synnott, N.C.; O’Grady, S.; Crown, J. Targeting P53 for the Treatment of Cancer. Semin. Cancer Biol. 2022, 79, 58–67. [Google Scholar] [CrossRef] [PubMed]
  48. Marinescu, A.; Mărgăritescu, C.; Stepan, A.E.; Marinescu, A.M.; Simionescu, C.E.; Nitu, F.M. P21 Immunoexpression in Actinic Keratosis and Cutaneous Carcinomas. Curr. Health Sci. J. 2017, 43, 226–230. [Google Scholar] [CrossRef] [PubMed]
  49. Pavey, S.; Russell, T.; Gabrielli, B. G2 Phase Cell Cycle Arrest in Human Skin Following UV Irradiation. Oncogene 2001, 20, 6103–6110. [Google Scholar] [CrossRef] [PubMed]
  50. Birajdar, S.S.; Radhika, M.; Paremala, K.; Sudhakara, M.; Soumya, M.; Gadivan, M. Expression of Ki-67 in Normal Oral Epithelium, Leukoplakic Oral Epithelium and Oral Squamous Cell Carcinoma. J. Oral. Maxillofac. Pathol. 2014, 18, 169–176. [Google Scholar] [CrossRef]
  51. Montebugnoli, L.; Gissi, D.B.; Badiali, G.; Marchetti, C.; Cervellati, F.; Farnedi, A.; Foschini, M.P. Ki-67 from Clinically and Histologically “Normal” Distant Mucosa as Prognostic Marker in Early-Stage (T1-T2N0) Oral Squamous Cell Carcinoma: A Prospective Study. J. Oral Maxillofac. Surg. 2011, 69, 2579–2584. [Google Scholar] [CrossRef]
  52. Choi, K.H.; Kim, G.M.; Kim, S.Y. The Keratin-14 Expression in Actinic Keratosis and Squamous Cell Carcinoma: Is This a Prognostic Factor for Tumor Progression? Cancer Res. Treat. 2010, 42, 107–114. [Google Scholar] [CrossRef] [PubMed]
  53. Sun, Y.; Li, A.; Liu, X.; Wang, Q.; Bai, Y.; Liu, Z.; Huang, L.; Wu, M.; Li, H.; Miao, J.; et al. A Panel of Biomarkers for Skin Squamous Cell Carcinoma: Various Functional Entities and Differential Responses to Resveratrol. Int. J. Clin. Exp. Pathol. 2019, 12, 1363–1377. [Google Scholar] [PubMed]
  54. Dotto, G.P. Multifocal Epithelial Tumors and Field Cancerization: Stroma as a Primary Determinant. J. Clin. Investig. 2014, 124, 1446–1453. [Google Scholar] [CrossRef] [PubMed]
  55. Yoshifuku, A.; Fujii, K.; Kanekura, T. Comparison of Oxidative Stress on DNA, Protein and Lipids in Patients with Actinic Keratosis, Bowen’s Disease and Squamous Cell Carcinoma. J. Dermatol. 2018, 45, 1319–1323. [Google Scholar] [CrossRef]
  56. Schneider, C.A.; Rasband, W.S.; Eliceiri, K.W. NIH Image to ImageJ: 25 Years of Image Analysis. Nat. Methods 2012, 9, 671–675. [Google Scholar] [CrossRef]
Figure 1. p53 and Ki67 expression is modulated on CFC skin samples. (a) Representative IHC and (b) % of p53 and Ki67 positive cells counted in four random areas of CTRL (n = 7) and CFC (n = 10) skin samples expressed as means ± SEM. (c) TP53 and Ki67 gene expression expressed as means ± SEM of CTRL (n = 12) and CFC (n = 21) skin samples. (d) Representative western blotting and (e) densitometric analysis of p53 expression tested on CTRL (n = 6) and CFC (n = 10) skin samples expressed as mean ± SEM. CTRL, control; CFC, cutaneous field cancerization; ns, no significance. Scale bar: 10 μm. * p < 0.05, ** p < 0.01.
Ijms 25 05775 g001
Figure 2. p16 expression is increased in CFC skin samples. (a) p16 and p21 gene expression indicated as means ± SEM of CTRL (n = 12) and CFC (n = 21) skin samples. (b) Representative IF and (c) % of p16 and p21 positive cells counted in four random areas of CTRL (n = 7) and CFC (n = 10) skin samples expressed as means ± SEM. CTRL, control; CFC, cutaneous field cancerization; ns, no significance. Scale bar: 10 μm. * p < 0.05, ** p < 0.01.
Ijms 25 05775 g002
Figure 3. Keratinocyte differentiation is altered in CFC skin. (a) Representative IHC expression of CK14, CK10 and Filaggrin and (b) % of IHC CK14 and CK10 stain-positive cells counted in four random areas of CTRL (n = 7) and CFC (n = 10) skin samples expressed as means ± SEM. (c) Filaggrin IHC OD score expressed as mean ± SEM of CTRL (n = 7) and CFC (n = 10) samples. (d) Representative Western blot and densitometric analysis (e) of CK14, CK10 and Filaggrin tested on CTRL (n = 6) and CFC (n = 10) skin samples expressed as means ± SEM. (f) CK14, CK10 and Filaggrin gene expression indicated as means ± SEM of CTRL (n = 12) and CFC (n = 21) skin samples. CTRL, control; CFC, cutaneous field cancerization; ns, no significance; OD, optical density. Scale bar: 10 μm. * p < 0.05.
Ijms 25 05775 g003
Figure 4. Oxidative stress and inflammatory markers are expressed in CFC skin. (a) SOD1 and iNOS gene expression evaluated on CTRL (n = 12) and CFC (n = 20) samples and expressed as means ± SEM. (b) Representative IF of SOD1 and iNOS and (c) analysis of IF SOD1 integrated density and (d) % of IF iNOS positive cells expressed as means ± SEM of CTRL (n = 7) and CFC (n = 10) skin samples. (e) Representative Western blot and densitometric analysis (f) of SOD1 and iNOS on CTRL (n = 6) and CFC (n = 10) skin samples expressed as mean ± SEM. (g) IL-1β, IL-6, IL-8, IL-10 gene expression expressed as means ± SEM of CTRL (n = 12) and CFC (n = 21) samples. CTRL, control; CFC, cutaneous field cancerization; iNOS, inducible nitric oxide synthase; SOD1, superoxide dismutase; ns, no significance. Scale bar: 10 μm. * p < 0.05, ** p < 0.01.
Ijms 25 05775 g004
Figure 5. Evaluation of OGG1 expression as marker of DNA damage. (a) Representative IHC and (b) % of 8-OHdG positive cells of cells counted in four random areas of CTRL (n = 7) and CFC (n = 10) samples expressed as means ± SEM. (c) OGG1 gene expression expressed as means ± SEM of CTRL (n = 12) and CFC (n = 21) skin samples. (d) Representative IHC expression and (e) % of OGG1 positive cells counted in four random areas of CTRL (n = 7) and CFC (n = 10) samples expressed as means ± SEM. (f) Representative Western blot and densitometric analysis (g) of OGG1 performed on CTRL (n = 6) and CFC (n = 10) samples expressed as means ± SEM. CTRL, control; CFC, cutaneous field cancerization; OGG1, 8-oxoguanine DNA glycosylase; 8-OHdG, 8-hydroxy-2-deoxyguanosine. Scale bar: 10 μm. * p < 0.05, ** p < 0.01, *** p < 0.001.
Ijms 25 05775 g005
Table 1. Clinical characteristics CTRL subjects.
AgeSexAnatomical Site
Ctrl_151MTrunk
Ctrl_241MTrunk
Ctrl_379MTrunk
Ctrl_467MTrunk
Ctrl_588MTrunk
Ctrl_686MLower limb
Ctrl_784FScalp
Ctrl_861FHead
Ctrl_939FScalp
Ctrl_1079MFace
Ctrl_1162MLower limb
Ctrl_1247FScalp
Ctrl_1351MScalp
Ctrl_1476FNeck
Ctrl_1575MScalp
Ctrl_1688FTrunk
Ctrl_1790MTrunk
Ctrl_1867MUpper limb
Ctrl_1971FScalp
Ctrl_2065MFace
Ctrl_2179FScalp
Ctrl_2285FNeck
Ctrl_2389MTrunk
Ctrl_2486FScalp
Ctrl_2575MLower limb
CTRL, control; F, female; M, male.
Table 2. Clinical characteristics of CFC patients.
PatientAgeSexAnatomical SiteSkin Cancer
CFC_183MHeadBCC
CFC_283MTrunkBCC
CFC_382MFaceBCC
CFC_487MFaceBCC
CFC_591MHeadKeratoacanthomas
CFC_678FFaceBCC
CFC_784MTrunkBCC
CFC_880MTrunkBCC
CFC_983MTrunkBCC
CFC_1075MHeadSCC
CFC_1182MFaceBCC
CFC_1287MNeckBCC
CFC_1391MHeadKeratoacanthomas
CFC_1478FFaceBCC
CFC_1587FFaceBCC
CFC_1667MLower limbBCC
CFC_1786MLower limbMelanoma
CFC_1887MFaceSCC
CFC_1990FFaceBCC
CFC_2072MTrunkAK
CFC_2183MTrunkEpithelioma
CFC_2285MUpper limbBCC
CFC_2383MHeadBCC
CFC_2486MScalpKA
CFC_2583MHeadEpithelioma
CFC_2675MFaceBCC
CFC_2777FTrunkBCC
CFC_2851MTrunkBCC
CFC_2974MTrunkMelanoacanthoma
CFC_3063MTrunkBCC
CFC_3189MLower limbSCC
CFC_3286MHeadAK
CFC_3367MTrunkBCC
CFC_3454MTrunkDisplastic nevi
CFC_3578FTrunkBCC
CFC_3682MUpper limbBCC
CFC_3766FTrunkBCC
CFC_3864FFaceBCC
CFC_3983MHeadBCC
CFC_4083MHeadBCC
CFC_4174MLower limbMelanoma
CFC, cutaneous field cancerization; BCC, basal cell carcinoma; SCC, squamous cells carcinoma; AK, actinic keratosis; M, male; F, female.
Disclaimer/Publisher’s Note: The statements, opinions and data contained in all publications are solely those of the individual author(s) and contributor(s) and not of MDPI and/or the editor(s). MDPI and/or the editor(s) disclaim responsibility for any injury to people or property resulting from any ideas, methods, instructions or products referred to in the content.

