Article

ADPN Regulates Oxidative Stress-Induced Follicular Atresia in Geese by Modulating Granulosa Cell Apoptosis and Autophagy

College of Animal Science and Veterinary Medicine, Shenyang Agricultural University, Shenyang 110866, China
*
Authors to whom correspondence should be addressed.
These authors contributed equally to this work.
Int. J. Mol. Sci. 2024, 25(10), 5400; https://doi.org/10.3390/ijms25105400
Submission received: 13 April 2024 / Revised: 9 May 2024 / Accepted: 10 May 2024 / Published: 15 May 2024
(This article belongs to the Section Molecular Biology)

Abstract

:
Geese are susceptible to oxidative stress during reproduction, which can lead to follicular atresia and impact egg production. Follicular atresia is directly triggered by the apoptosis and autophagy of granulosa cells (GCs). Adiponectin (ADPN), which is secreted by adipose tissue, has good antioxidant and anti-apoptotic capacity, but its role in regulating the apoptosis of GCs in geese is unclear. To investigate this, this study examined the levels of oxidative stress, apoptosis, and autophagy in follicular tissues and GCs using RT-qPCR, Western blotting, immunofluorescence, flow cytometry, transcriptomics and other methods. Atretic follicles exhibited high levels of oxidative stress and apoptosis, and autophagic flux was obstructed. Stimulating GCs with H2O2 produced results similar to those of atretic follicles. The effects of ADPN overexpression and knockdown on oxidative stress, apoptosis and autophagy in GCs were investigated. ADPN was found to modulate autophagy and reduced oxidative stress and apoptosis in GCs, in addition to protecting them from H2O2-induced damage. These results may provide a reasonable reference for improving egg-laying performance of geese.

1. Introduction

Follicular development plays a crucial role in determining reproductive performance in animals. In poultry, follicle production and development occur continuously throughout the reproductive period. The follicles form a hierarchical system in the ovary and develop sequentially in a set order [1]. Follicles are typically classified into two categories based on their size and functional status: pre-hierarchical follicles and hierarchical follicles. Pre-hierarchical follicles consist of small white follicles (SWFs), large white follicles (LWFs), small yellow follicles (SYFs), and large yellow follicles (LYFs). The hierarchical follicles are named F1–F5 in order of size [2,3]. Primordial follicles have three fates: (1) they remain dormant as part of the follicular pool; (2) they are activated by reproductive hormones, growth factors, and other factors, and gradually mature; or (3) they deteriorate and die while in the dormant state due to various factors [4]. In avian species, the primordial follicles that develop into SYFs are the only ones recruited for further progression, and then selection occurs and they gradually develop into hierarchical follicles that ovulate sequentially from F1 to F5 [5]. However, only a very small percentage of primordial follicles in both mammalian and avian species are able to mature and ovulate, and the vast majority of follicles undergo follicular atresia during development.
Granulosa cells (GCs) synthesize a variety of steroid hormones and growth factors, which regulate the growth and differentiation of follicular membrane cells and oocytes, and thus follicular development. The growth and differentiation of granulosa cells play an important role in primordial follicle activation and subsequent follicle selection and development. Therefore, the growth and differentiation of granulosa cells can be used as a marker of follicle development [6]. Follicular atresia is triggered by the death of GCs, mainly through cell apoptosis and autophagy. Previous studies showed that the apoptosis of GCs can cause follicular atresia, a phenomenon observed in mice, chickens and geese [5,7,8]. However, it is important to note that follicular atresia is not solely controlled by cell apoptosis, as enhanced autophagy of GCs has also been observed during follicular atresia in mice and geese [9,10].
During the breeding process, oxidative stress can occur in poultry, which produces reactive oxygen species (ROS) and damages the follicular microenvironment. Excessive accumulation of ROS in follicular fluid can lead to the apoptosis and autophagy of GCs, ultimately resulting in follicular atresia [11,12,13]. Other evidence also suggests that ROS can cause apoptosis and autophagy in poultry follicular GCs [10,14,15].
Adiponectin (ADPN) is a cytokine secreted by adipose tissue. It regulates glucose and lipid metabolism, insulin sensitivity, and inflammation resistance by binding to its receptor [16,17]. ADPN and its receptors are present in the follicular GCs of humans, mice, and poultry [18,19]. Evidence suggested that ADPN has strong anti-oxidative stress and anti-apoptotic capabilities. ADPN can reduce ROS and malondialdehyde (MDA) levels, increase superoxide dismutase (SOD) and glutathione peroxidase (GSH-Px) activities, increase B-cell lymphoma-2 (Bcl-2) expression, decrease BCL2-Associated X (Bax) expression, and prevent ROS-induced decreases in mitochondrial membrane potential [20,21].
Disruption of the ADPN receptor, AdipoR1, results in apoptosis in the granulosa cell line KGN [22]. Furthermore, high levels of ADPN contribute to the protection of GCs from apoptosis [23]. Our previous study showed that ADPN can regulate the secretion of steroid hormones to modulate reproductive activity in geese [24]. In this study, the effects of oxidative stress, apoptosis, autophagy and the expression of adiponectin were investigated in follicles from geese at different stages of development, and atretic follicles were also investigated. This study also sought to ascertain whether the overexpression or knockdown of ADPN could regulate apoptosis and autophagy of goose primary GCs caused by H2O2 through in vitro analysis. Our findings might provide a theoretical basis and reasonable therapeutic strategies for improving egg production rates and treating related diseases in geese.

2. Results

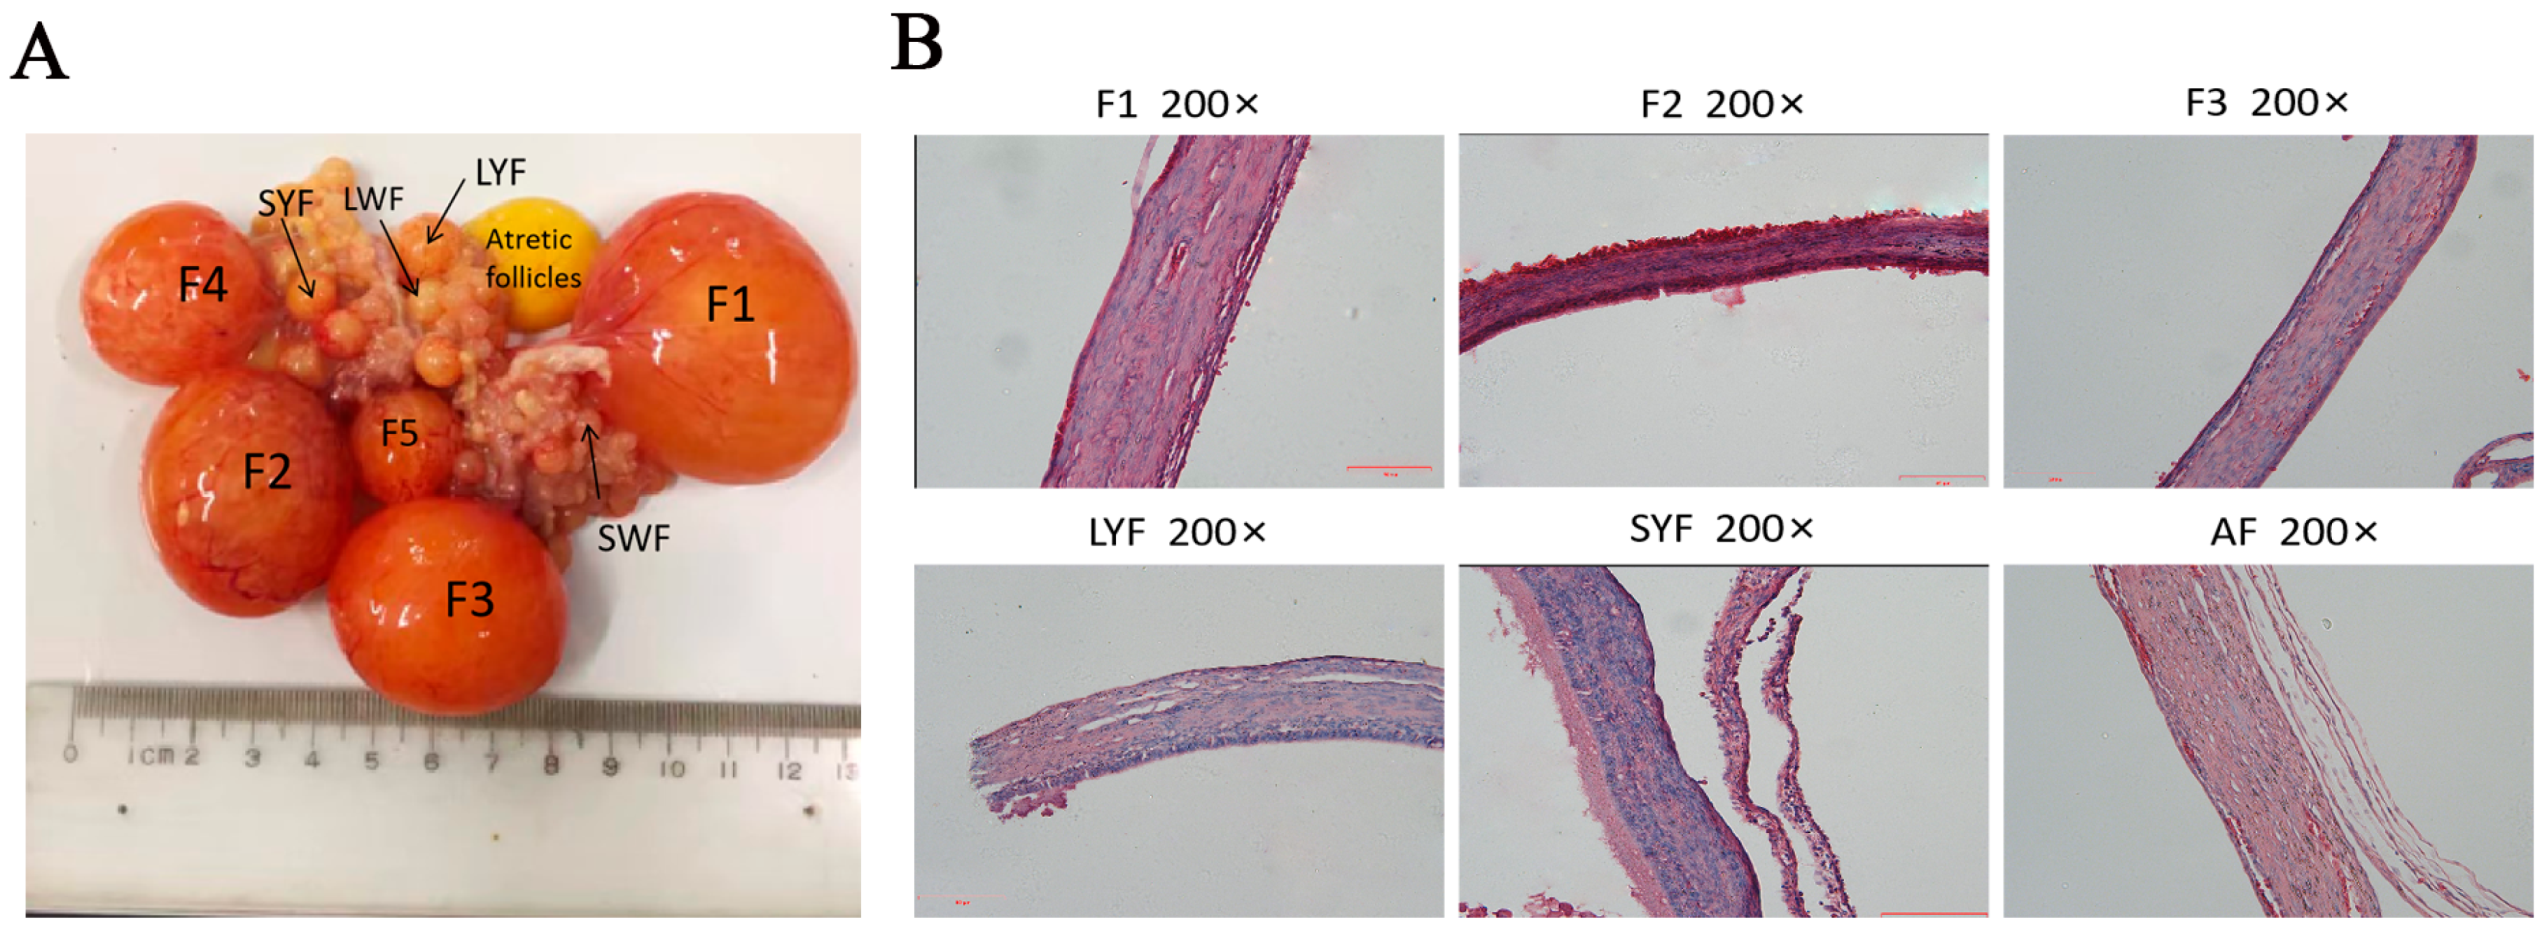
2.1. Morphology of Follicles at Different Stages of Development and Histological Characteristics of Each Membrane Layer of Follicles in Geese

The morphological features of follicles at different stages were observed, in particular changes in the color and elasticity of atretic follicles and the loss of blood vessels on the surface of the membrane (Figure 1A). The histological characteristics of each membrane layer of follicles at different stages were observed, and the results showed that the layers of the AFs were loosely arranged and that the GC layer was detached (Figure 1B).

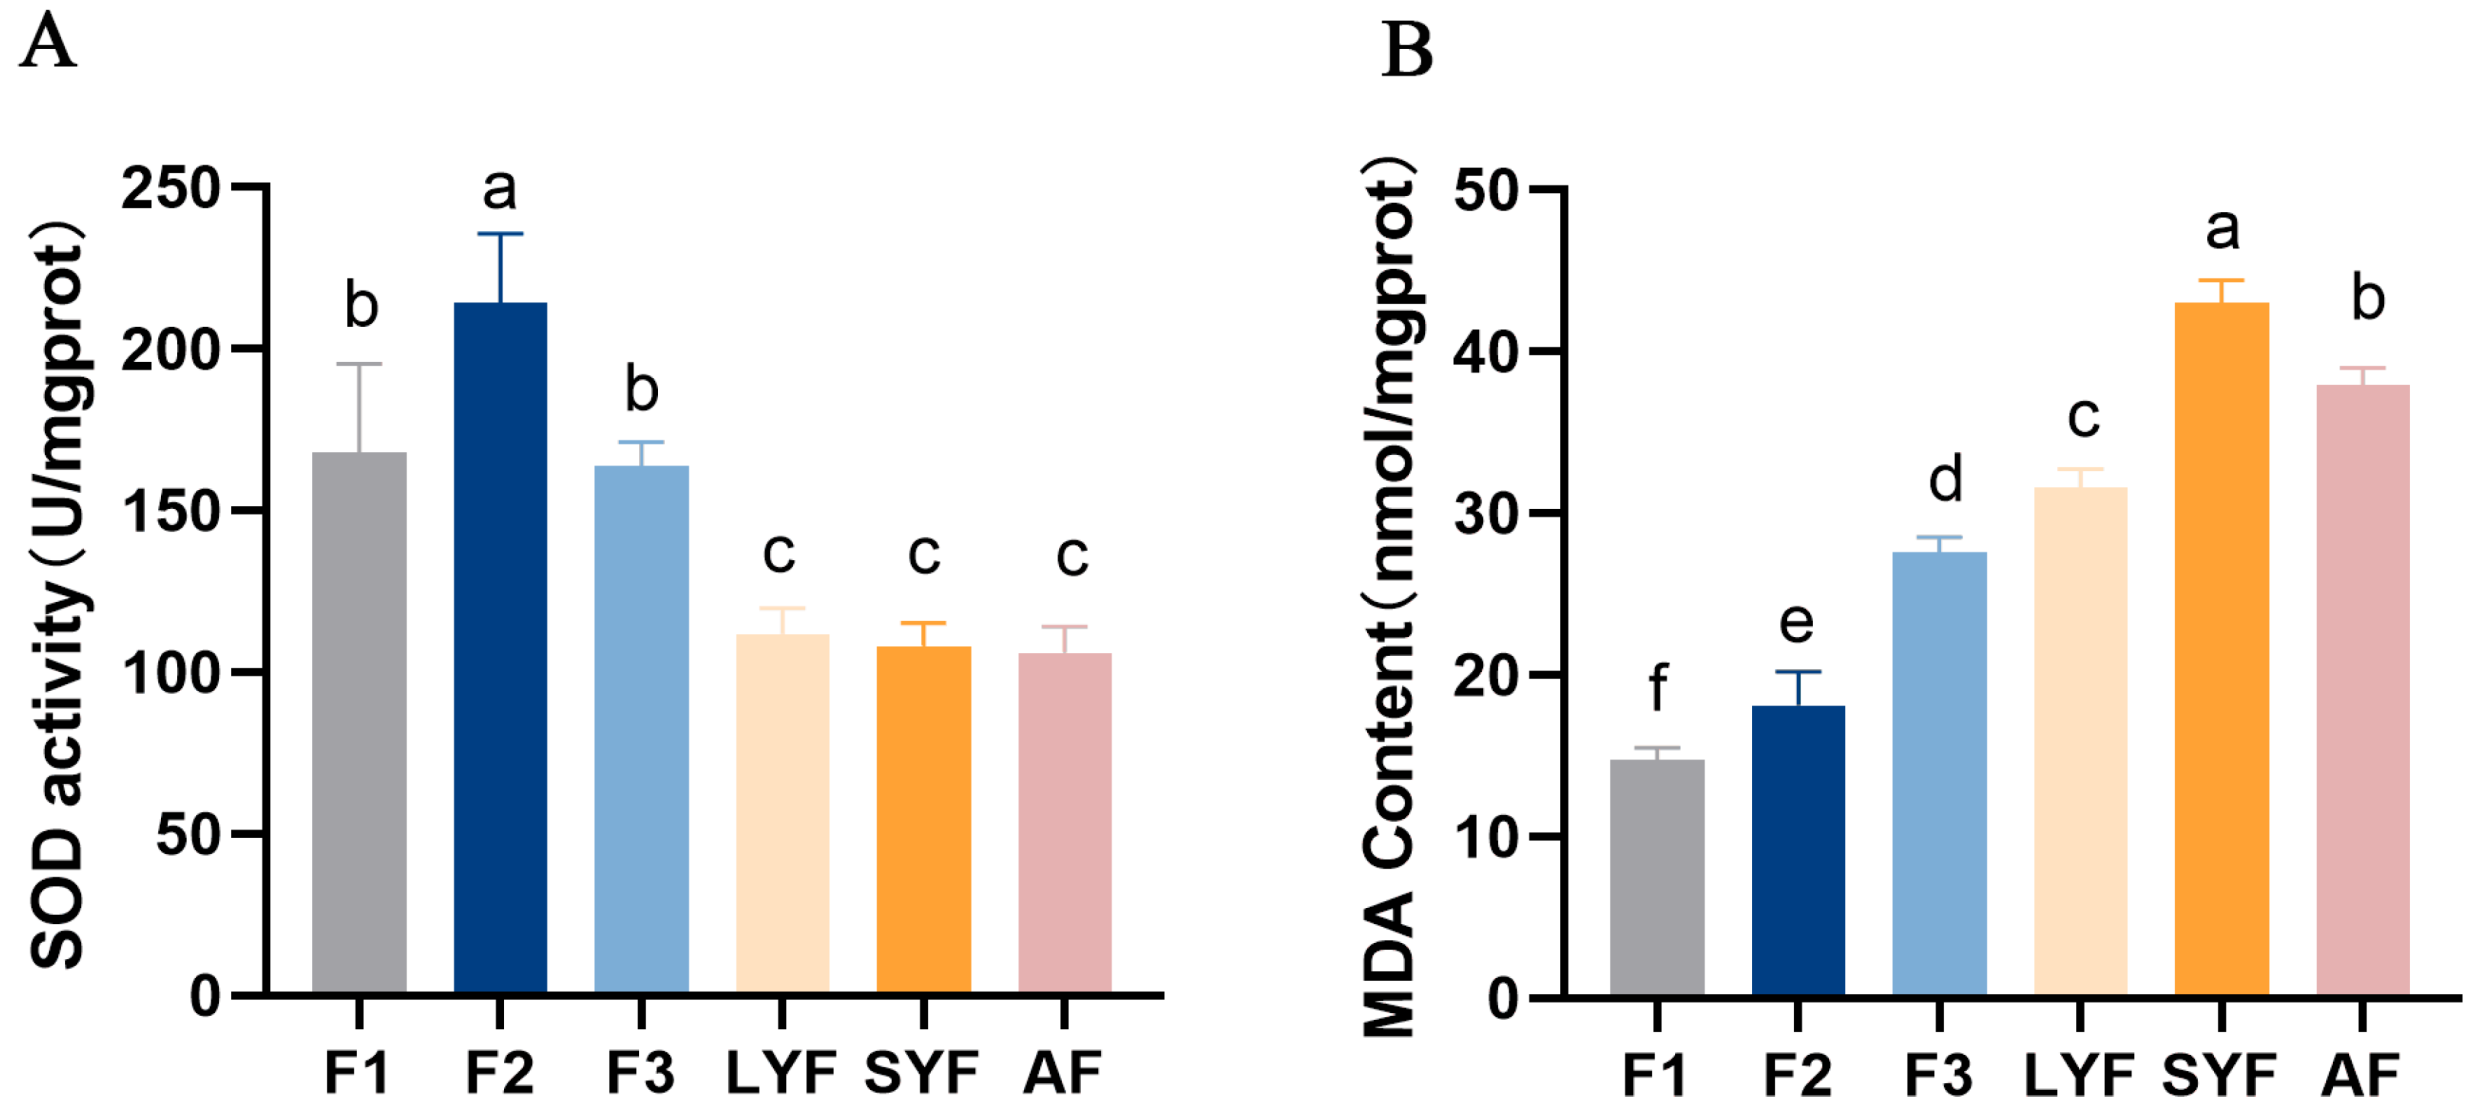
2.2. High Levels of Oxidative Stress in Pre-Hierarchical and Atretic Follicles

The antioxidant capacity of atretic follicles was found to be reduced, with significantly lower SOD viability compared to hierarchical follicles (Figure 2A). Additionally, the MDA content was significantly higher in atretic follicles compared to hierarchical follicles. LYFs and SYFs exhibited a comparable pattern to atretic follicles: they had significantly higher MDA levels compared to hierarchical follicles. (Figure 2B), possibly due to being in an early stage of follicular development, where the antioxidant capacity is weaker and the follicles are more vulnerable to oxidative stress.

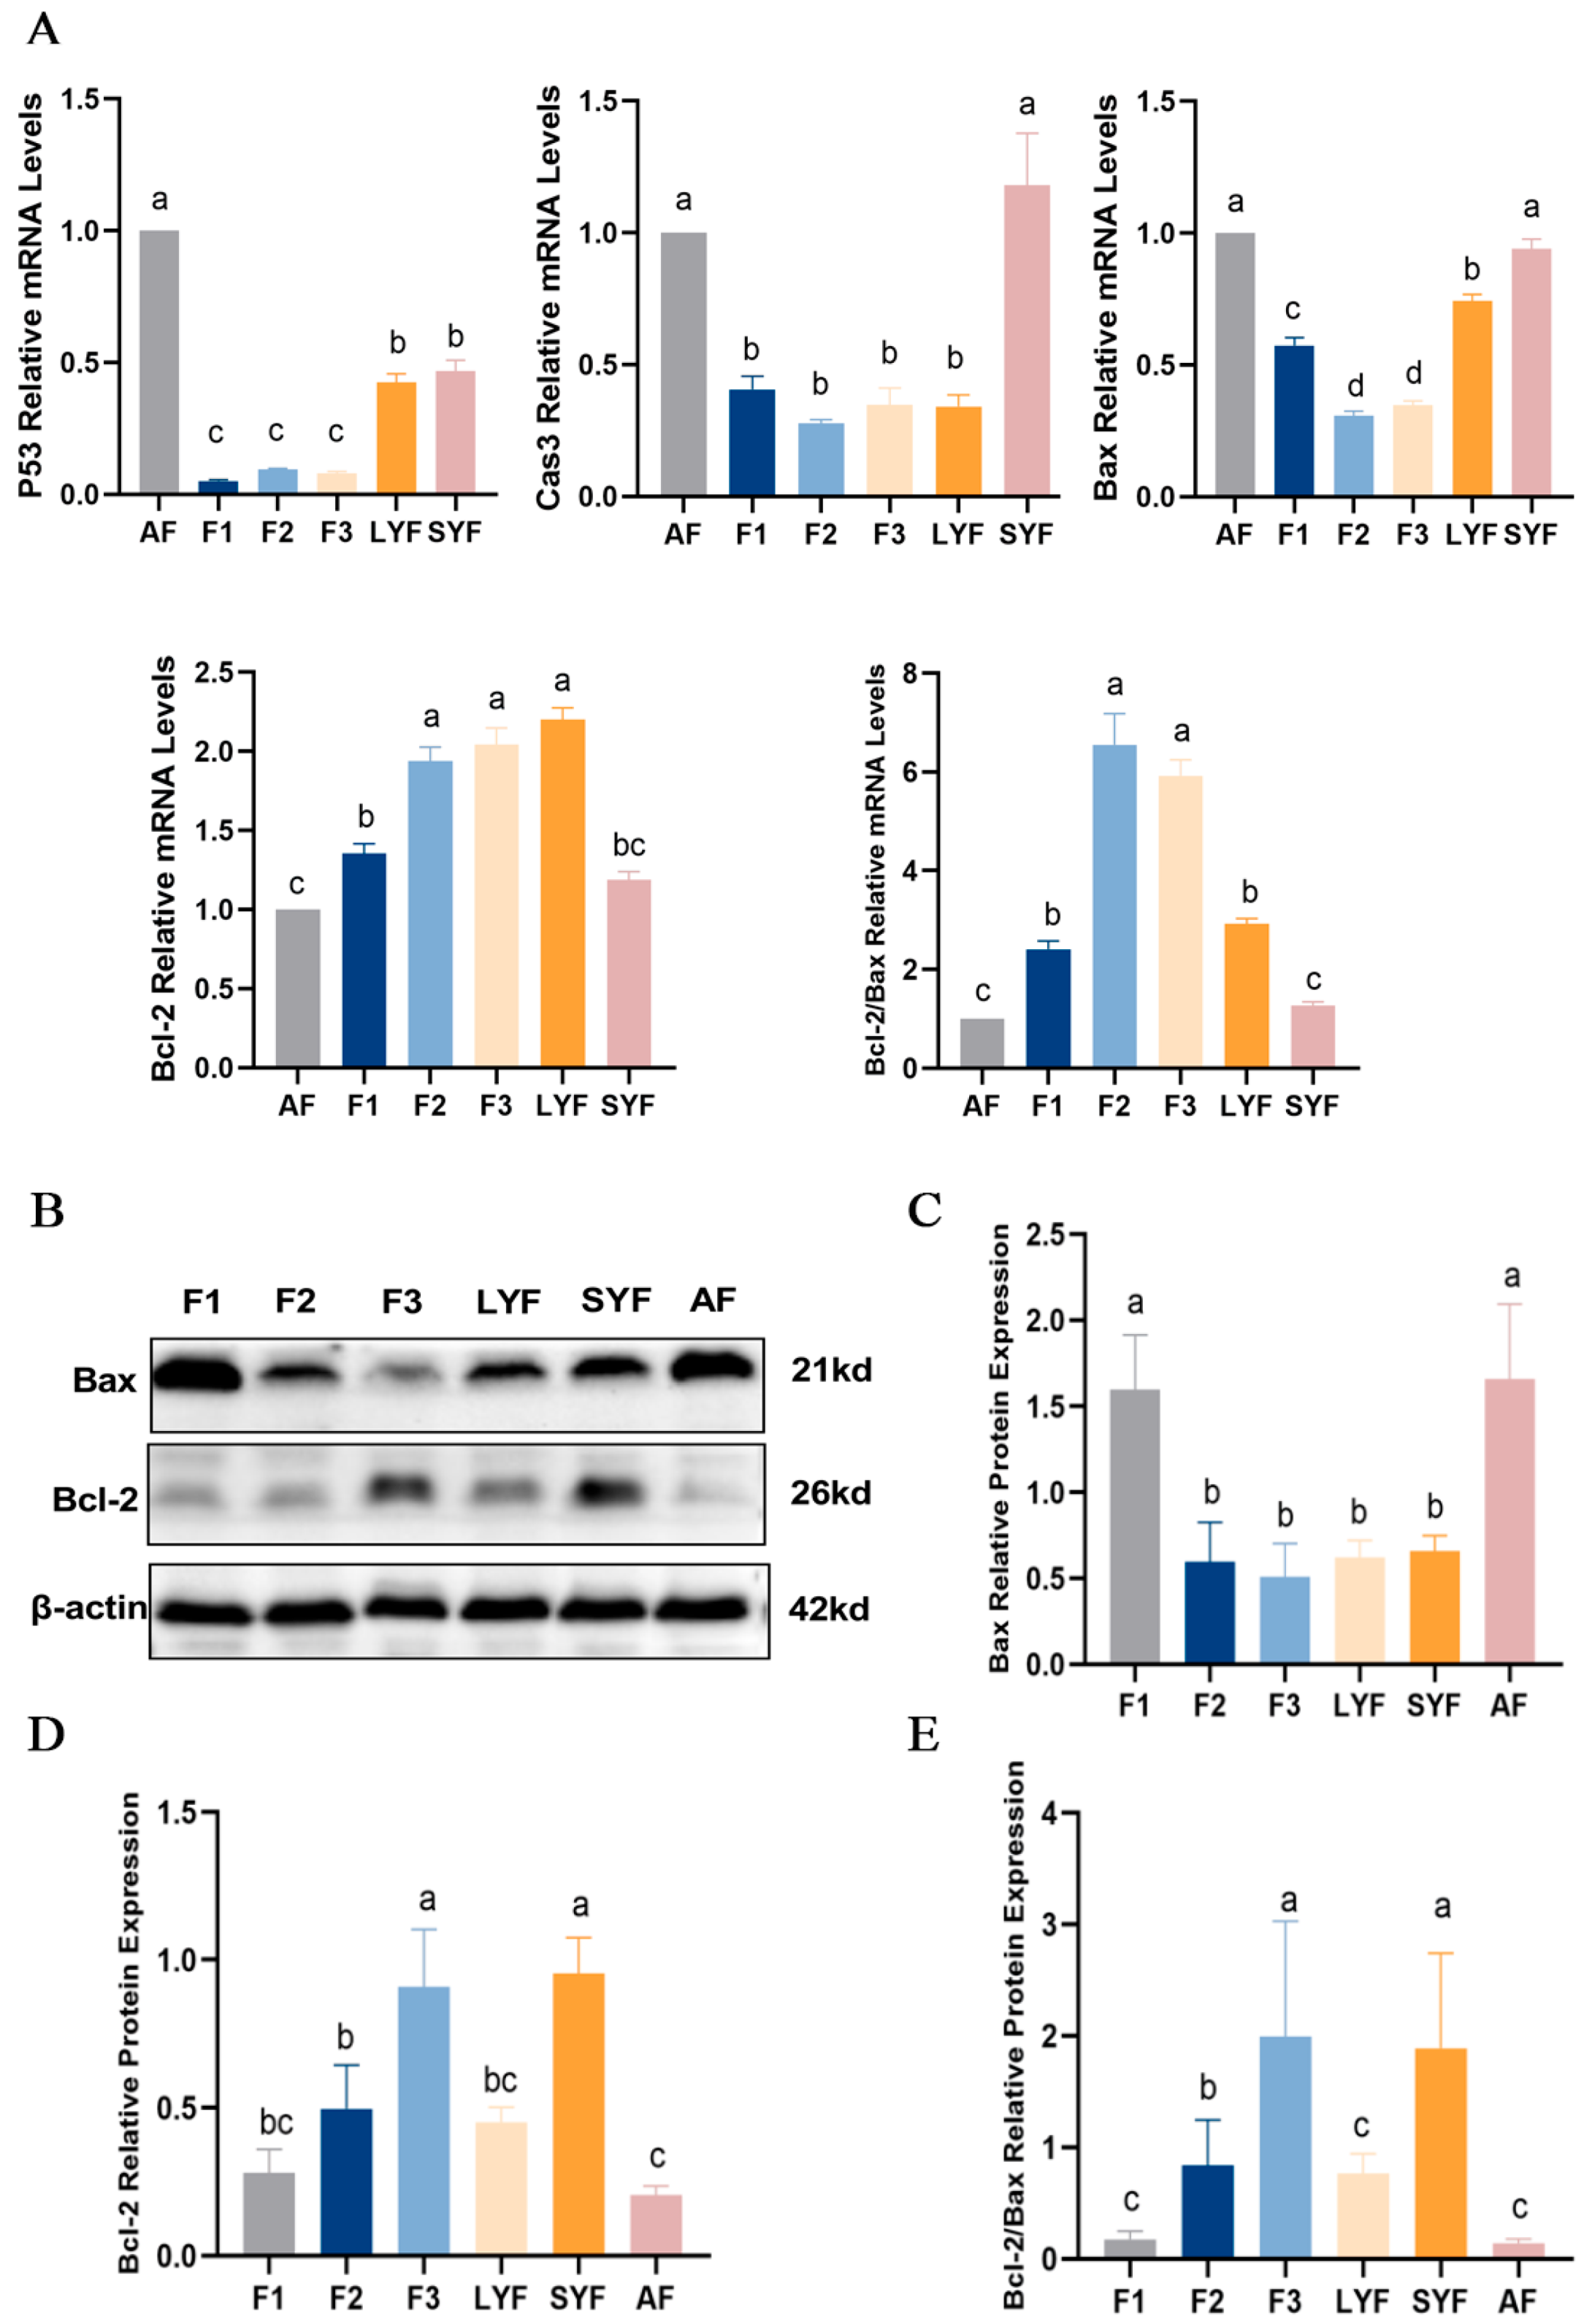
2.3. High Levels of Apoptosis in Atretic Follicles

To determine the level of apoptosis in follicles at each developmental stage, the mRNA and protein expression of apoptosis-related genes was determined. There were higher levels of apoptosis in atretic follicles, with increased expression of the pro-apoptotic genes P53, caspase-3 and Bax mRNA and decreased expression of the anti-apoptotic gene Bcl-2 (Figure 3A), a significant increase in Bax protein expression (Figure 3B,C), a significant decrease in Bcl-2 protein expression (Figure 3B,D), and a decrease in the ratio of Bcl-2 to Bax (Figure 3E). We also found higher levels of apoptosis in F1 follicles. These results indicated that atretic follicles had a higher level of apoptosis and that F1 follicles might be transitioning progressively toward atresia.

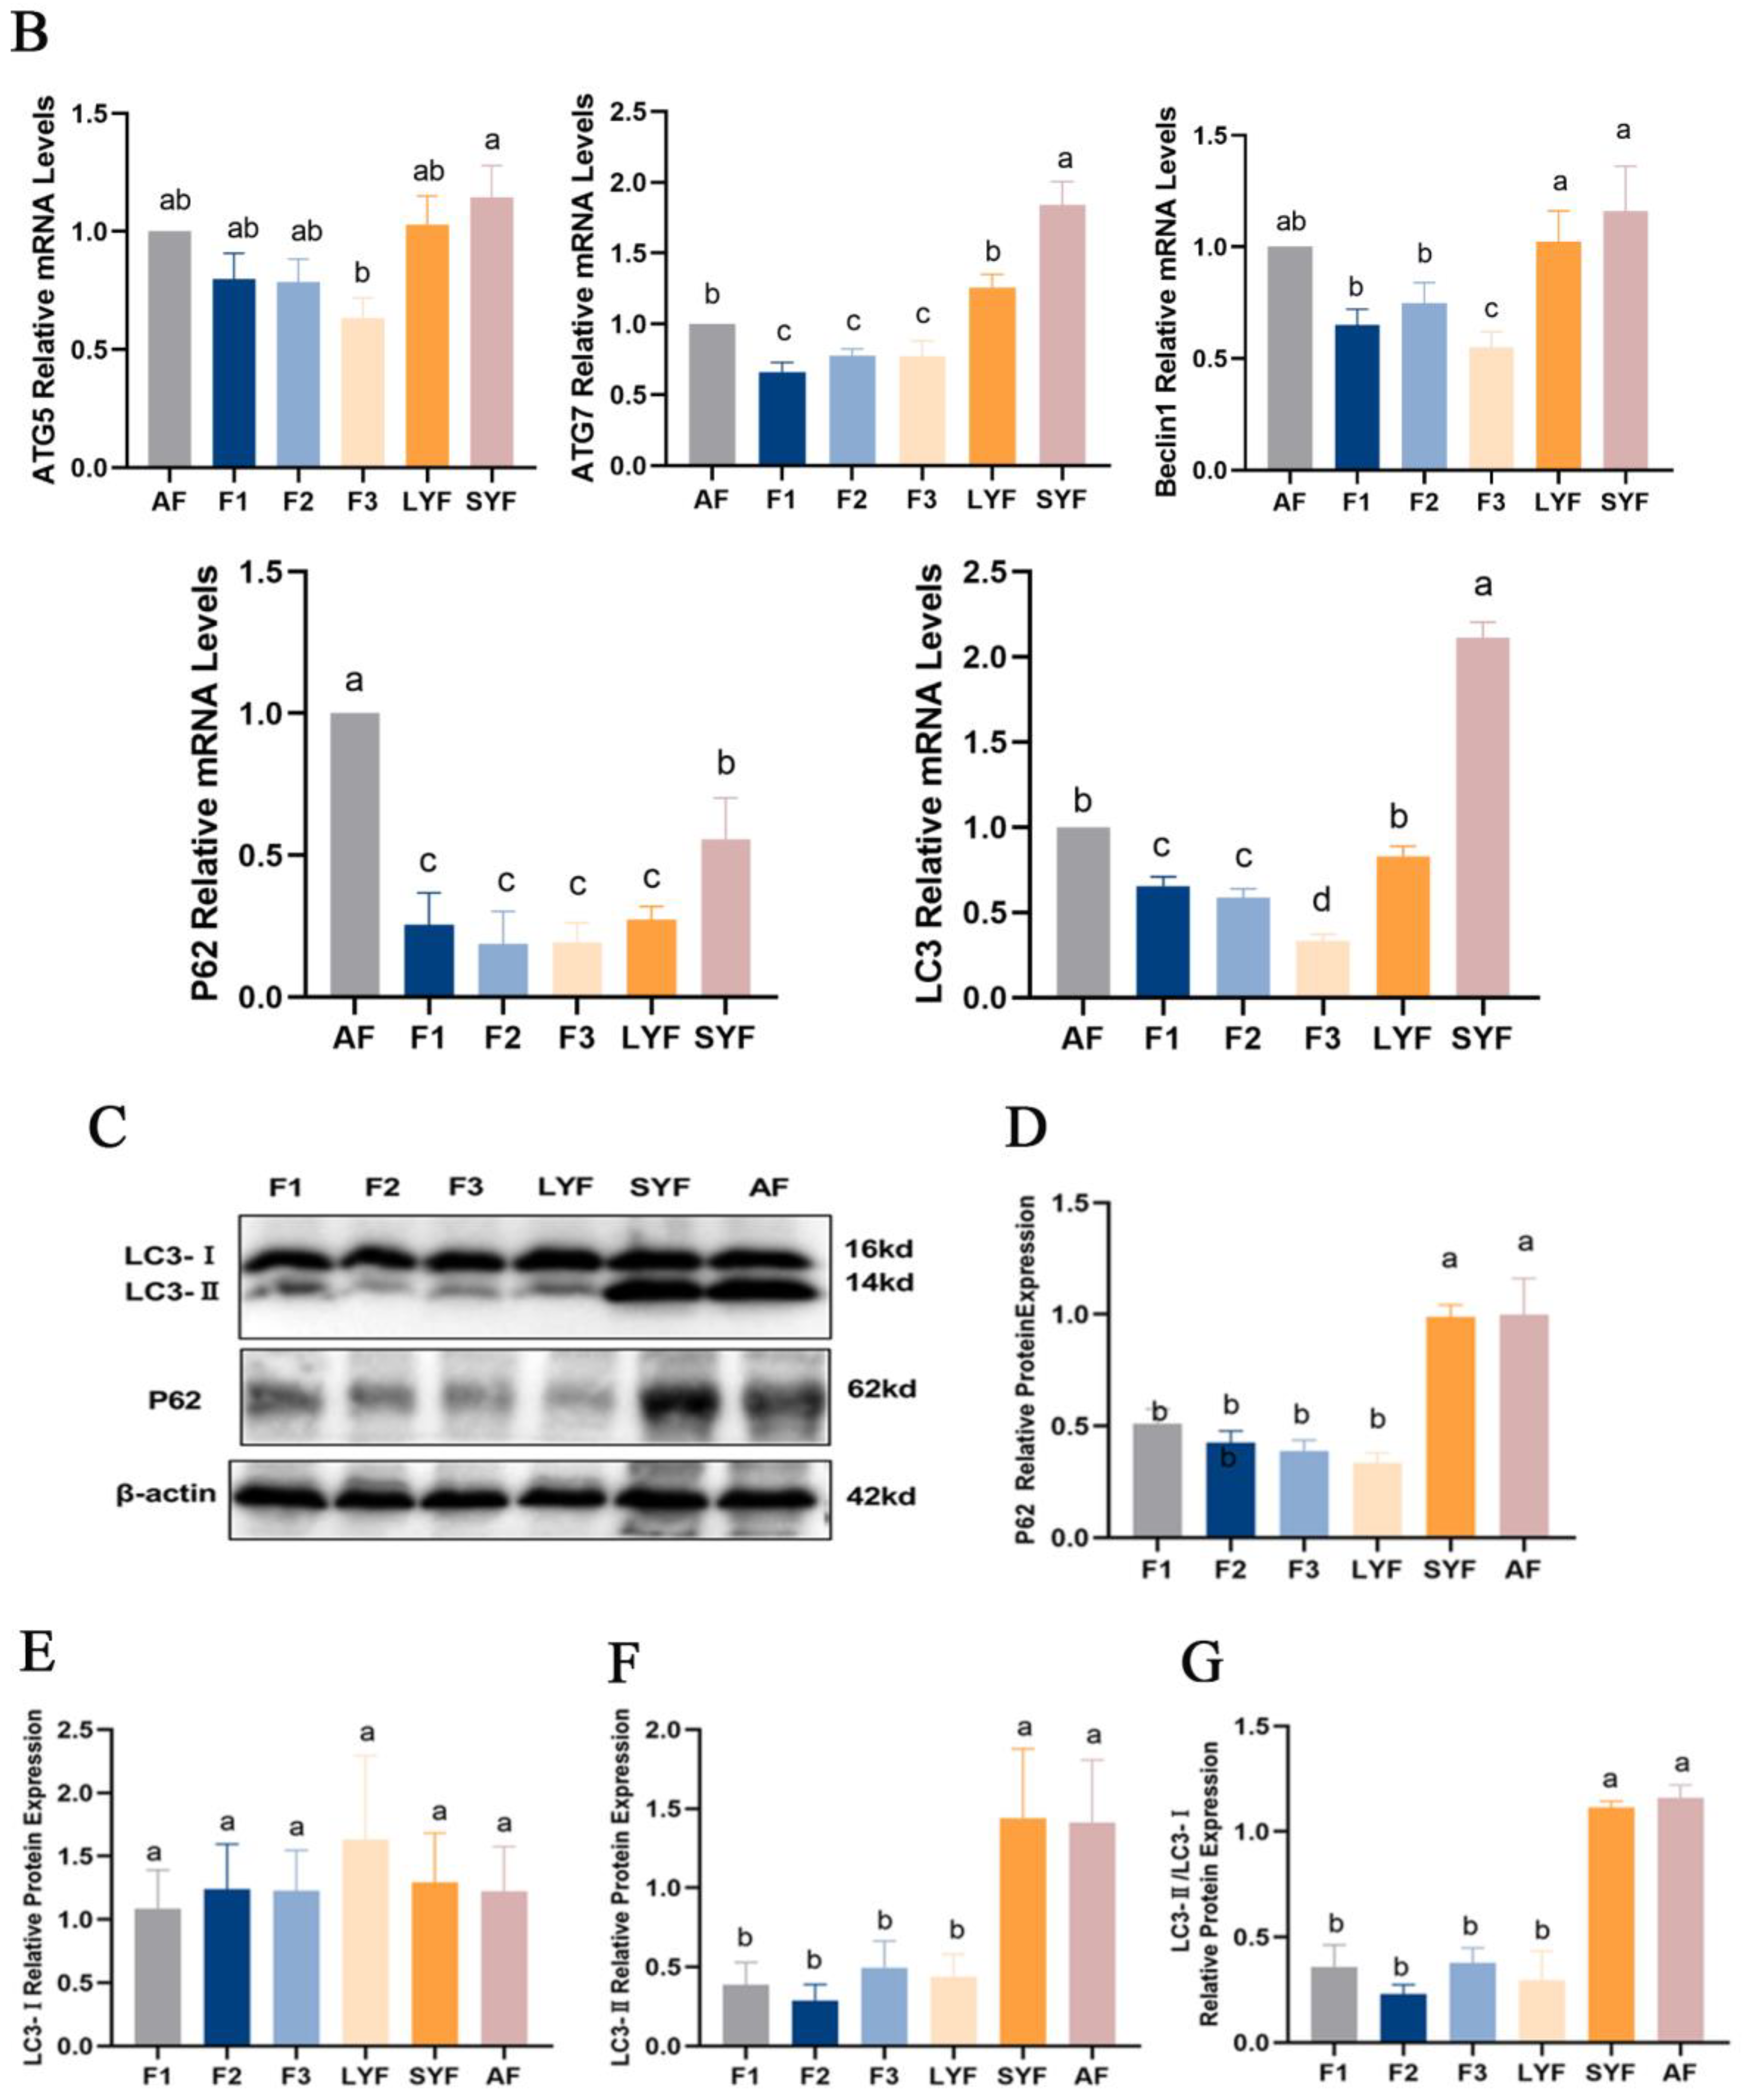
2.4. Autophagy Is Involved in Follicular Atresia

Transmission electron microscopy was used to observe the submicroscopic structure of atretic follicles. The atretic follicles showed nucleolysis and the loss of mitochondrial cristae. Additionally, mitochondria with disappearing cristae were observed to be phagocytosed by autophagosomes (Figure 4A).
The mRNA and protein expression of autophagy-related genes were investigated. The expression levels of ATG5, ATG7, Beclin1, P62 and LC3 were higher in atretic follicles compared to hierarchical follicles. The same trend was observed in pre-hierarchical follicles, particularly SYFs, although statistical significance was not achieved for some of these changes (Figure 4B). Similar to their mRNA expression levels, the expression of P62 and LC3-II proteins, as well as the ratio of LC3-II to LC3-I protein expression, were higher in atretic follicles and SYFs compared to hierarchical follicles (Figure 4C–G). These data suggest that autophagy plays an important role in the process of follicular atresia.

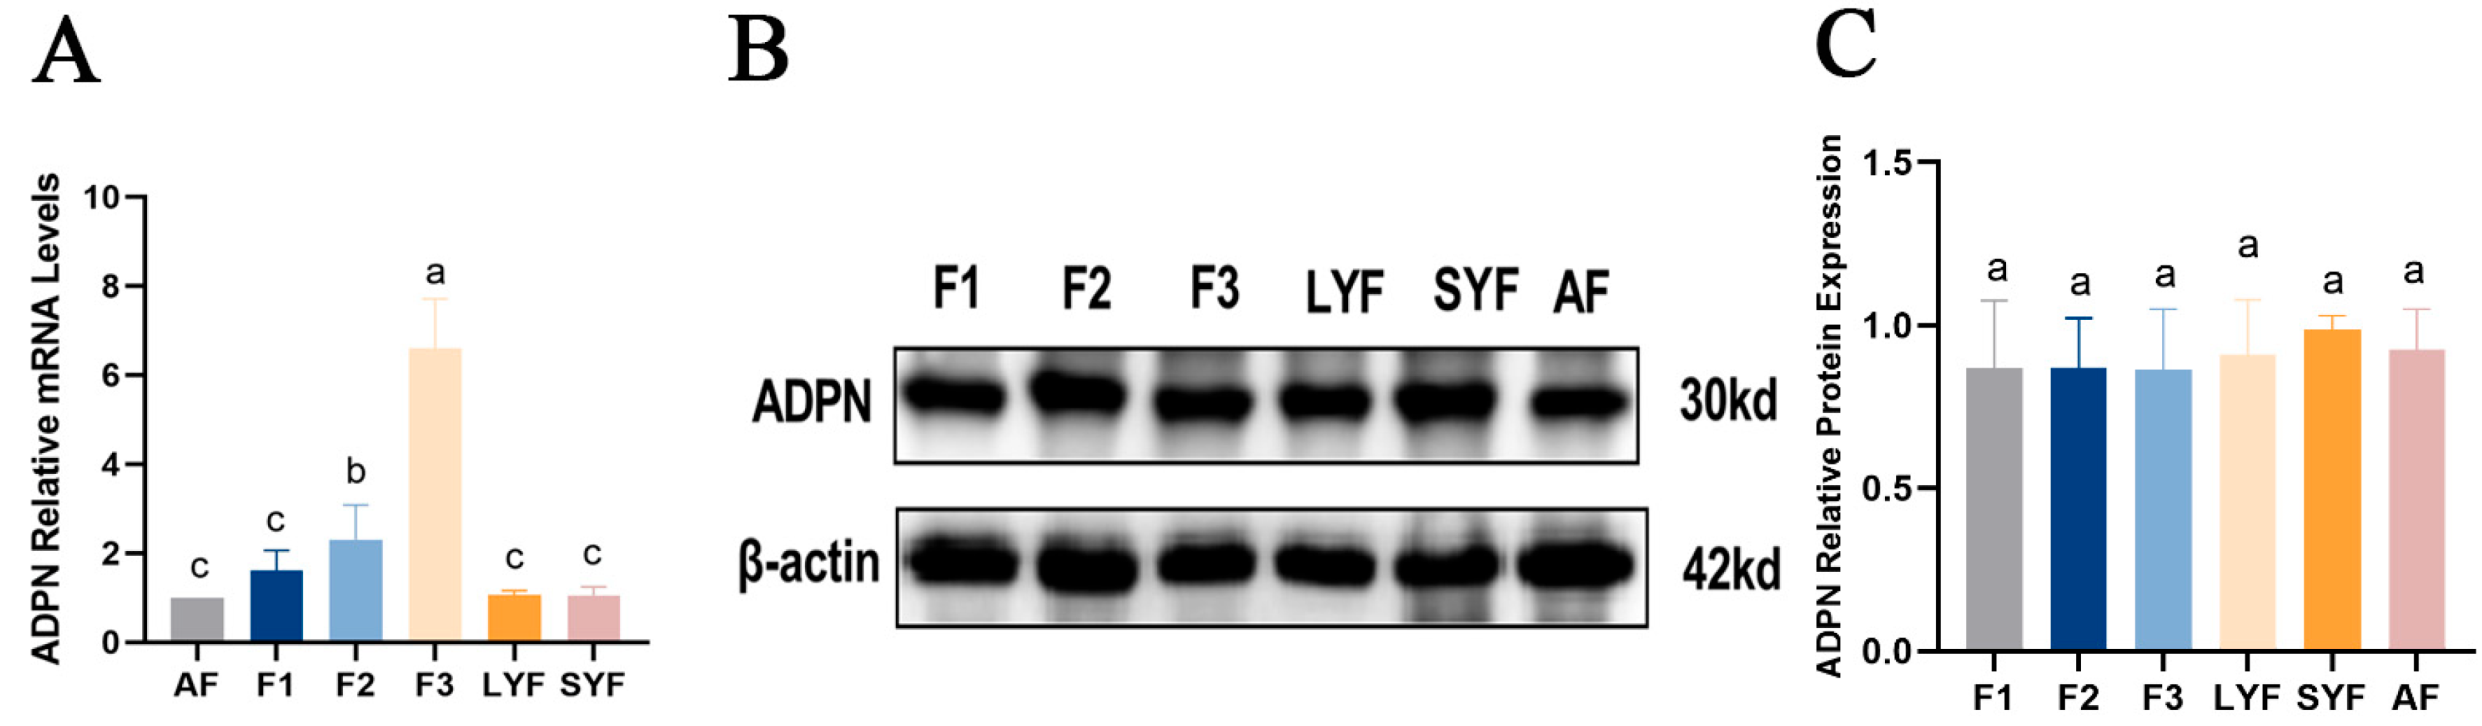
2.5. Expression of ADPN in Goose Follicles at Different Stages

Upon examining the mRNA and protein expression of ADPN, it was discovered that ADPN mRNA expression was lower in atretic follicles compared to hierarchical follicles, and its expression decreased progressively as the follicles developed into F1 follicles (Figure 5A). However, there was no significant difference in the level of ADPN protein among the follicles (Figure 5B,C).

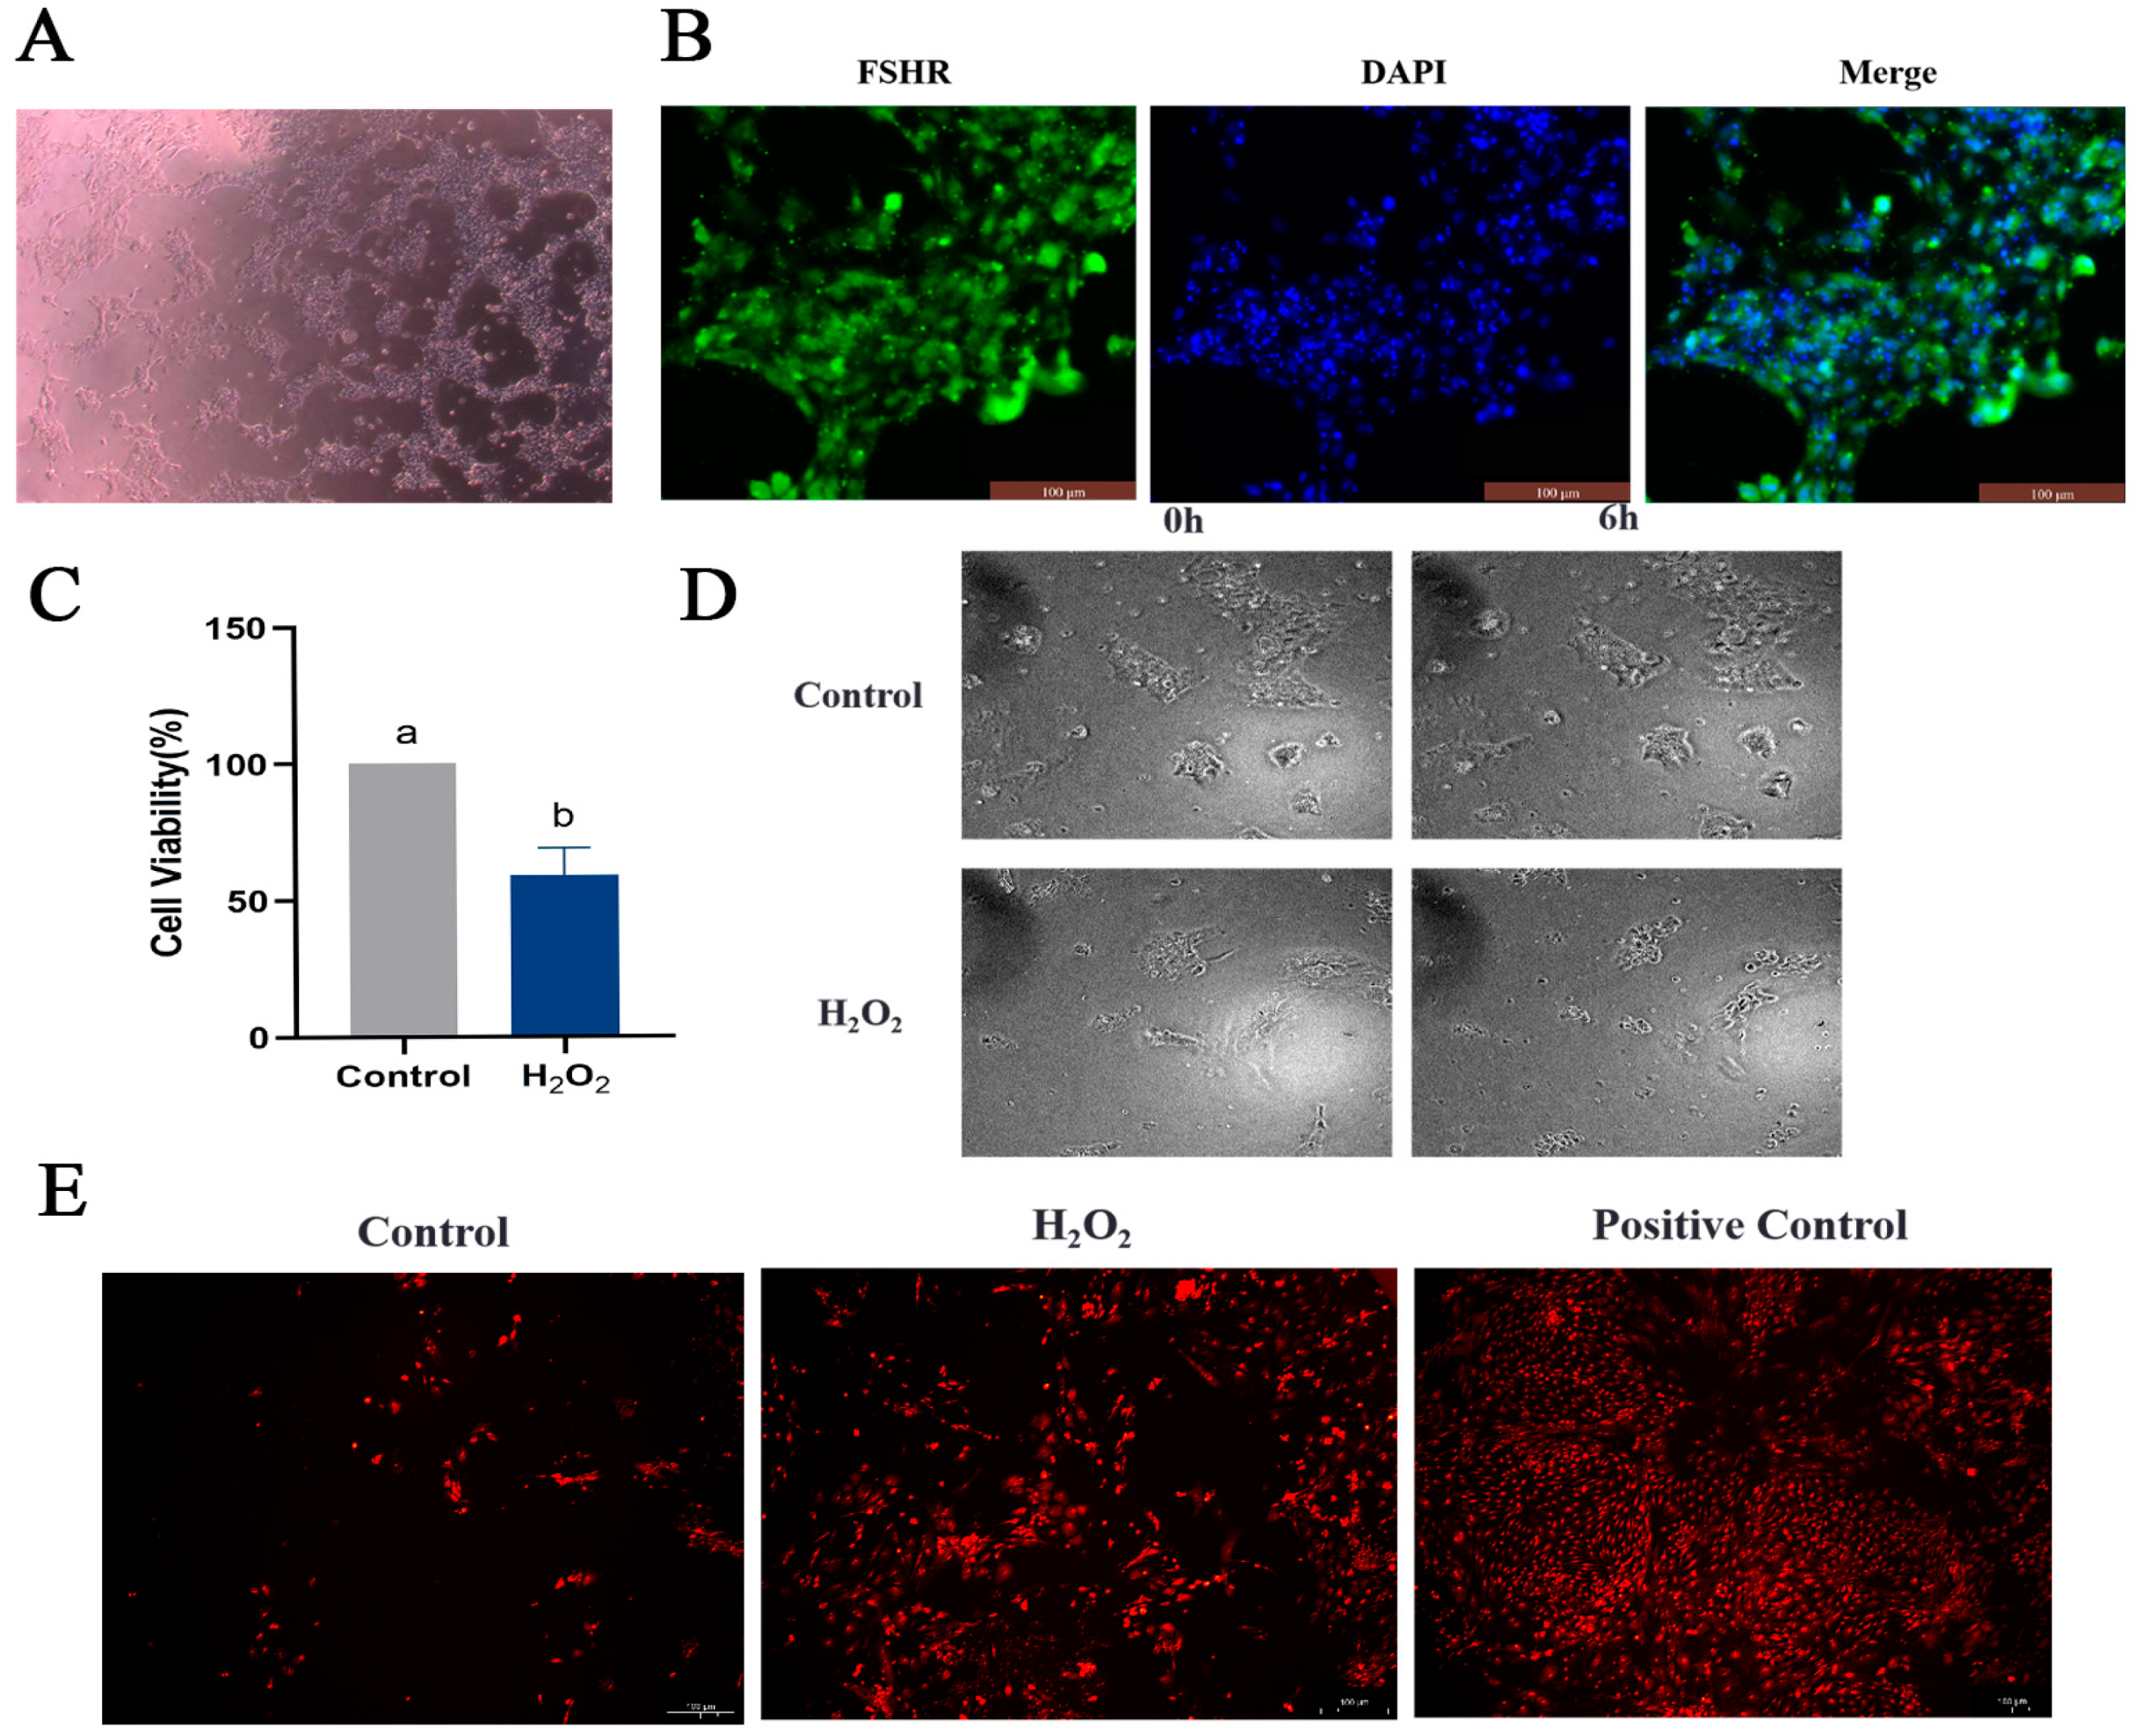
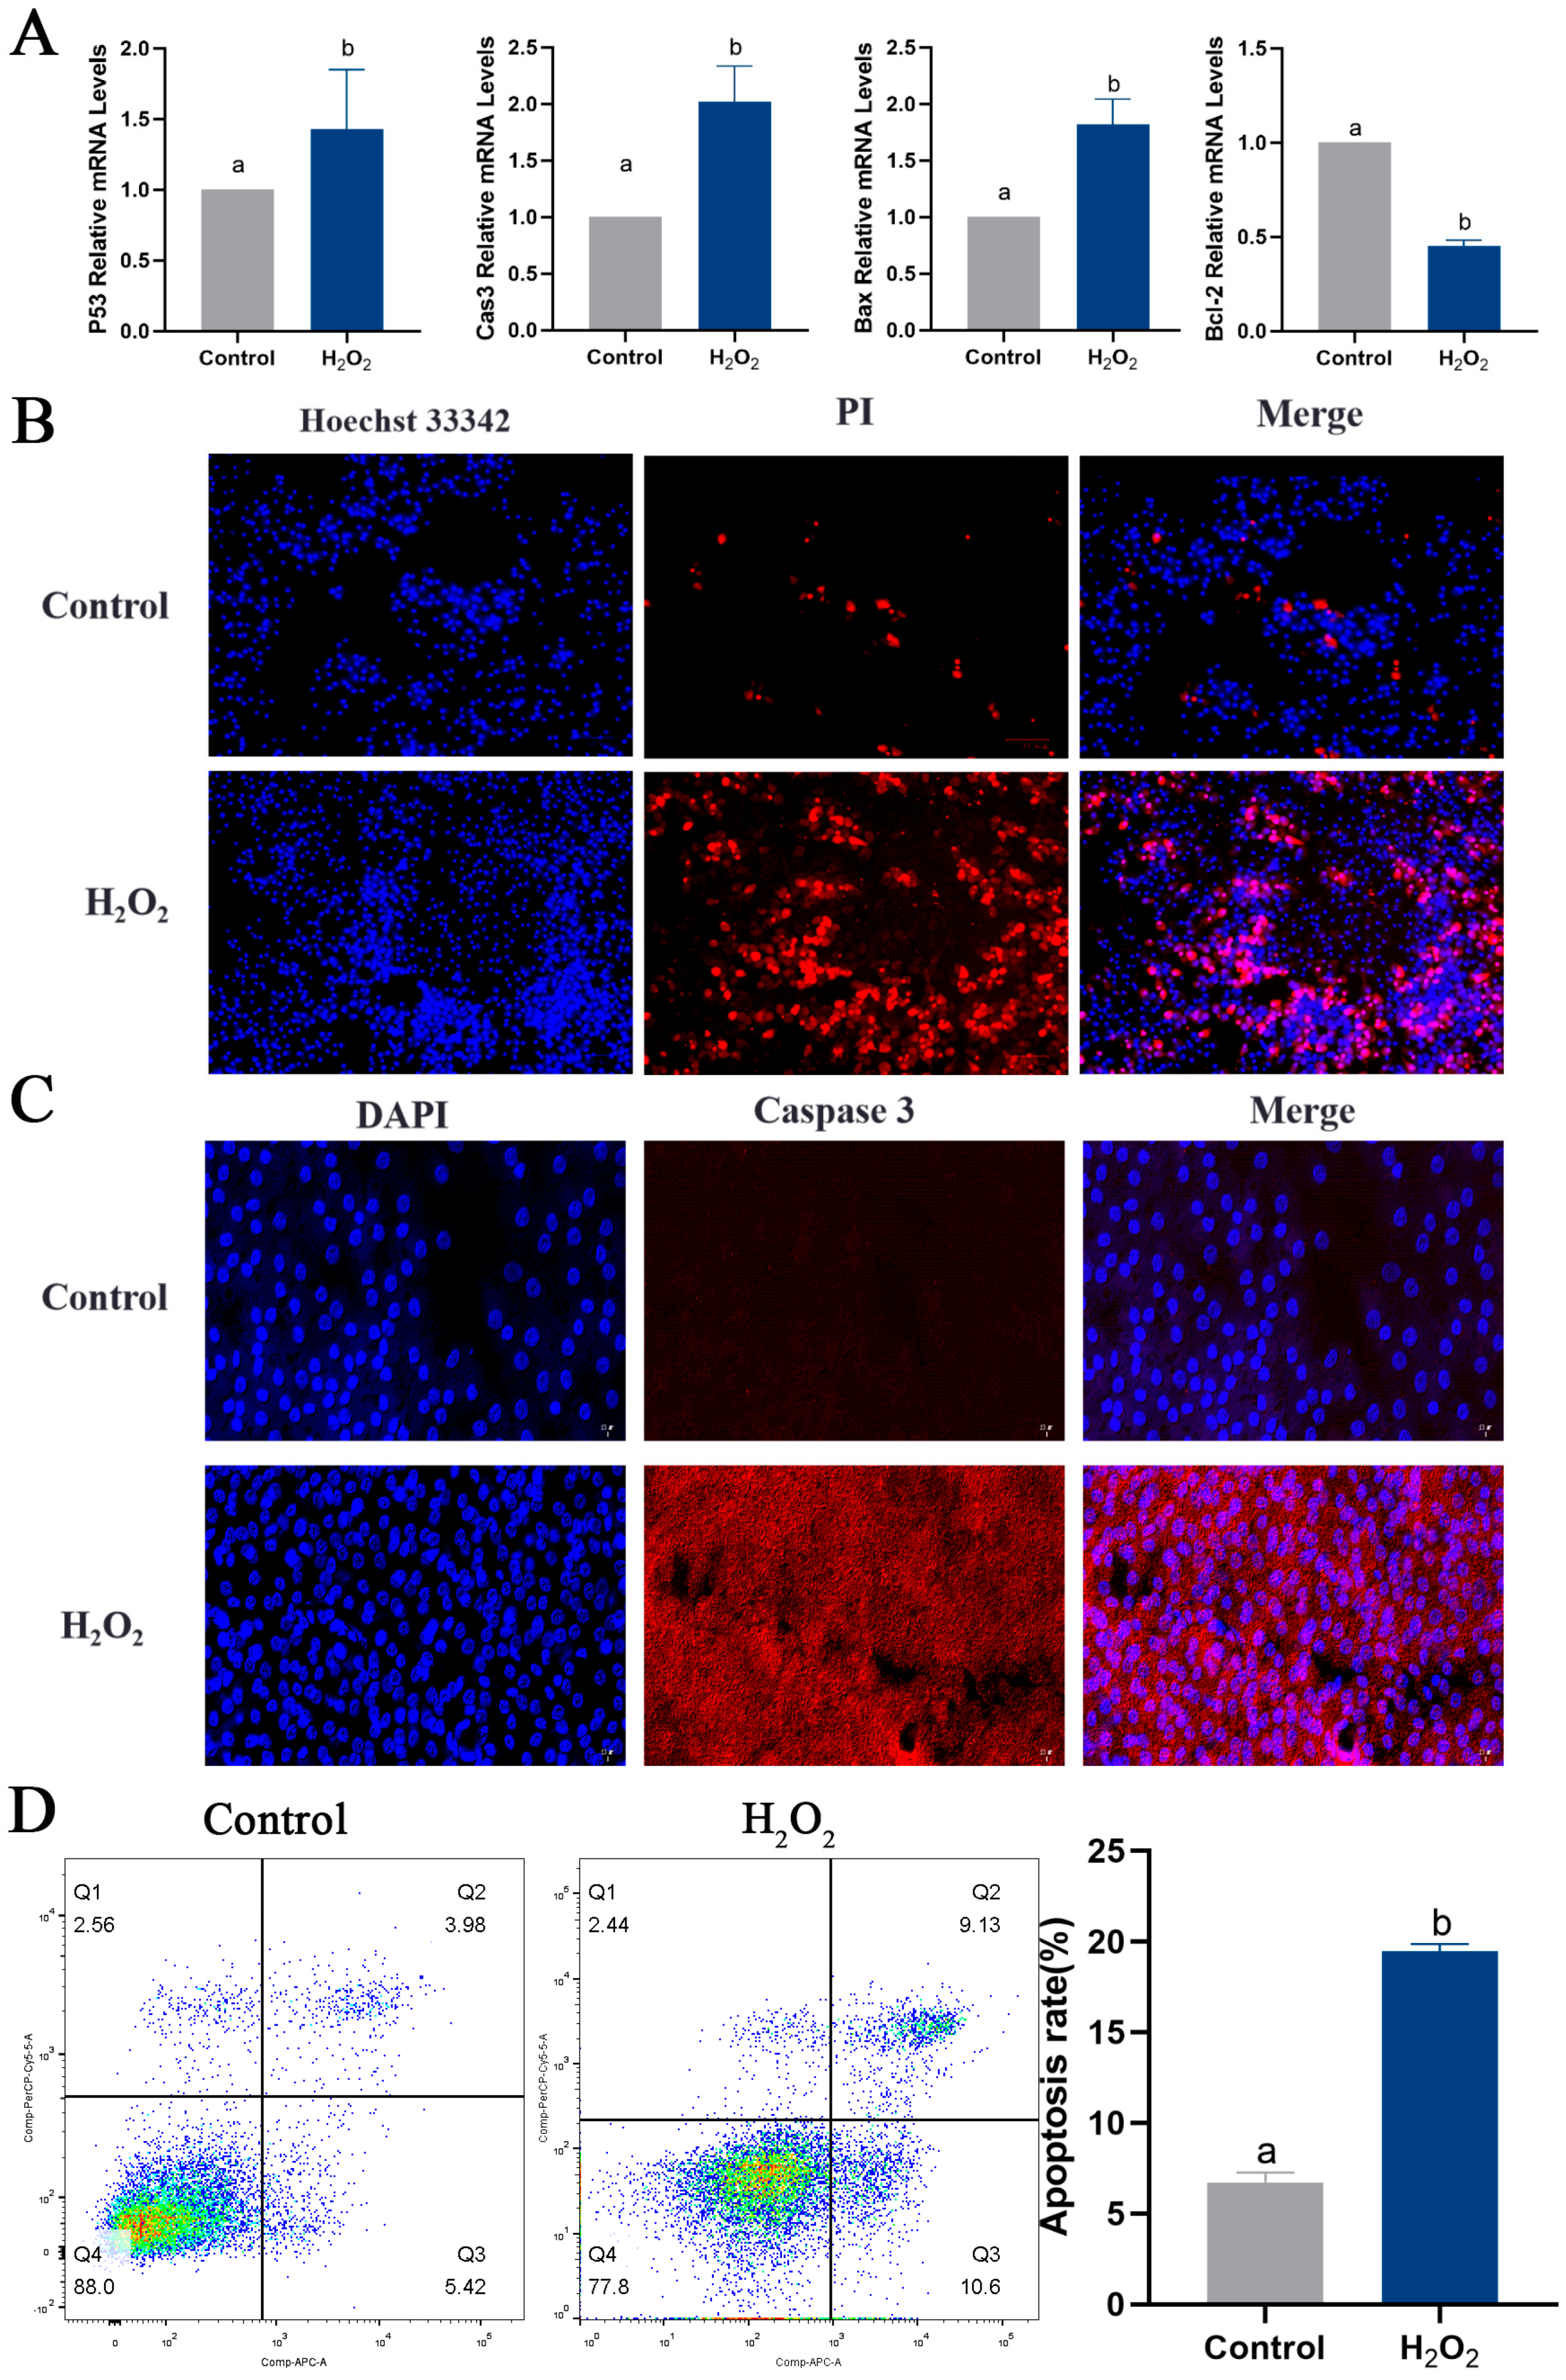
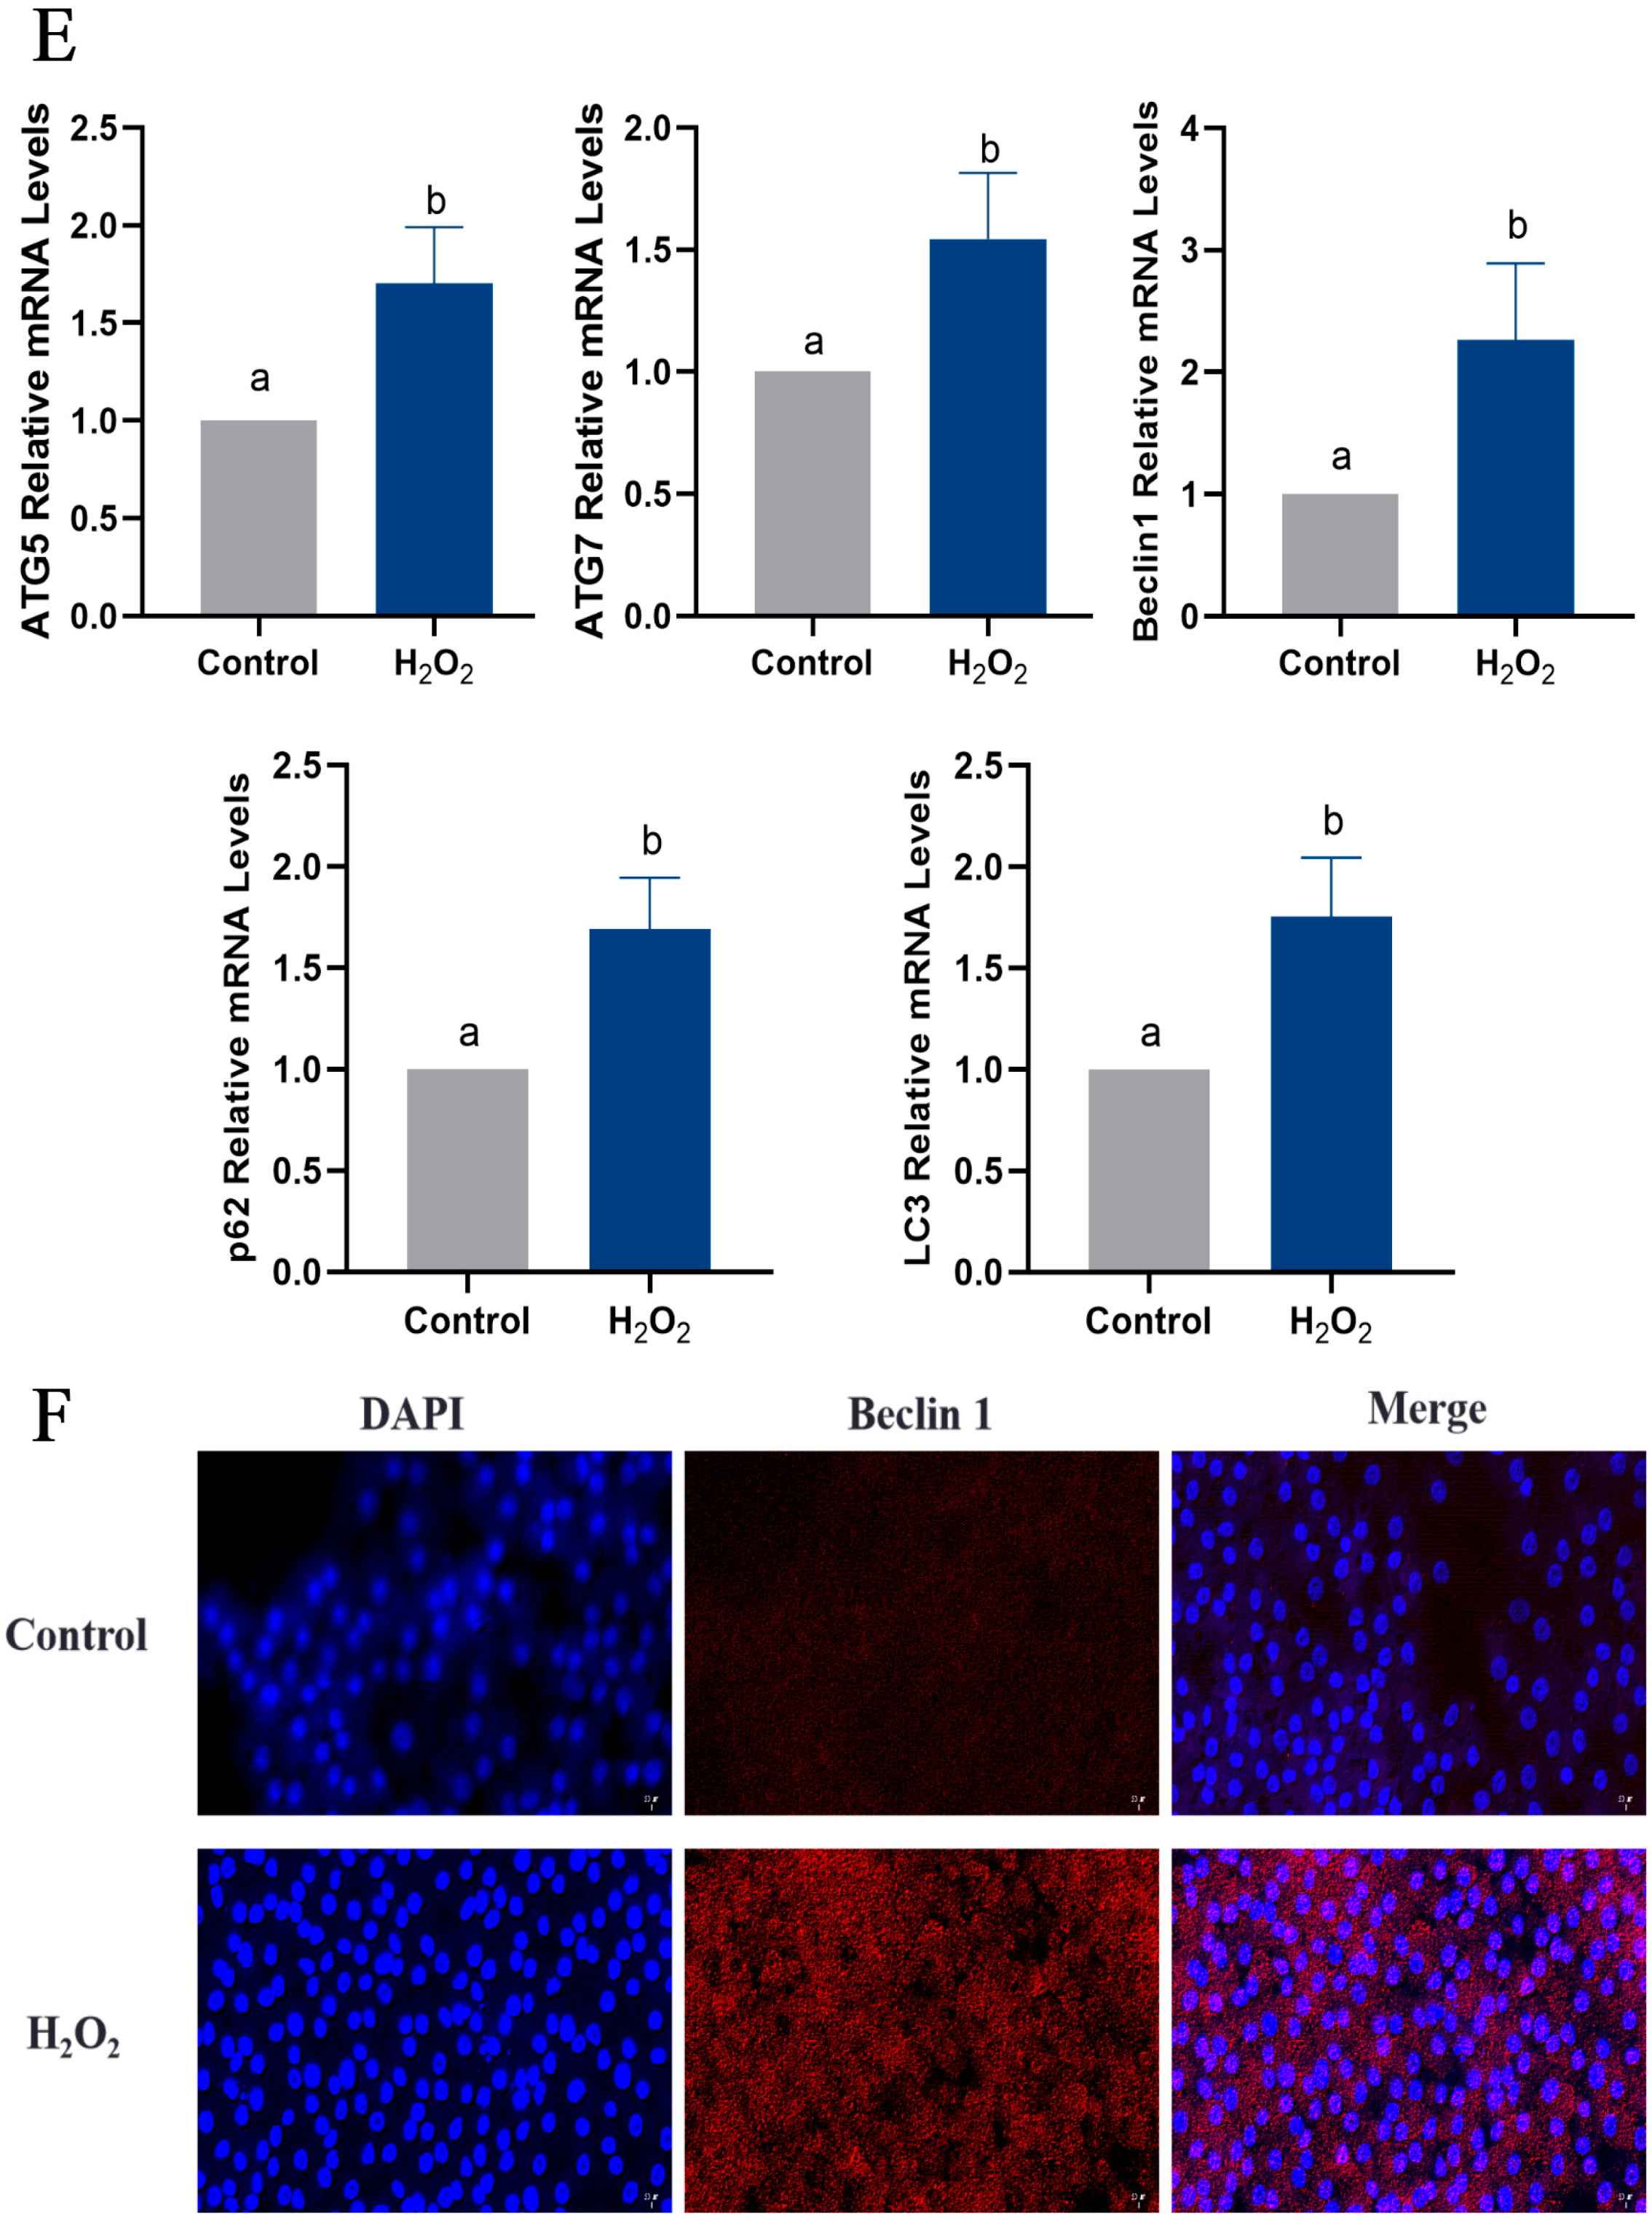
2.6. Oxidative Stress Induces Apoptosis and Autophagy in Goose GCs

To determine the effect of oxidative stress on GCs, primary GCs were isolated (Figure 6A), and FSHR-positive expression was used as a criterion for identification (Figure 6B). An oxidative stress model of GCs was constructed by stimulating GCs with 250 μmol/L H2O2 for 6 h, based on previous experiments conducted in our laboratory. Viability of the GCs was detected using a CCK8 assay and via observation of their morphology. GC viability was significantly reduced in the H2O2 group compared to the control group (Figure 6C). Furthermore, after 6 h of H2O2 stimulation, the morphology of the GCs was altered, and intercellular junctions were disrupted (Figure 6D). The ROS assay results suggested that H2O2 stimulation induced oxidative stress in GCs (Figure 6E). The apoptosis of GCs was examined, revealing increased expression of the pro-apoptotic genes P53, Caspase-3 and Bax and decreased expression of the anti-apoptotic gene Bcl-2 in the H2O2 group compared to the control group (Figure 7A). High levels of apoptosis were similarly revealed in the H2O2 group through Hoechst33342/PI staining (Figure 7B) and immunofluorescence (Figure 7C) results. Additionally, the increased apoptosis rate of GCs in response to H2O2 stimulation was confirmed by means of flow cytometry (Figure 7D). Similarly, the level of autophagy in GCs was assessed, and it was found that the expression levels of ATG5, ATG7, Beclin 1, P62 and LC3 all increased in response to H2O2 stimulation (Figure 7E). The expression of the Beclin 1 protein was also increased, as determined by means of immunofluorescence (Figure 7F). These findings suggested that oxidative stress induced apoptosis and autophagy in GCs by increasing ROS production.

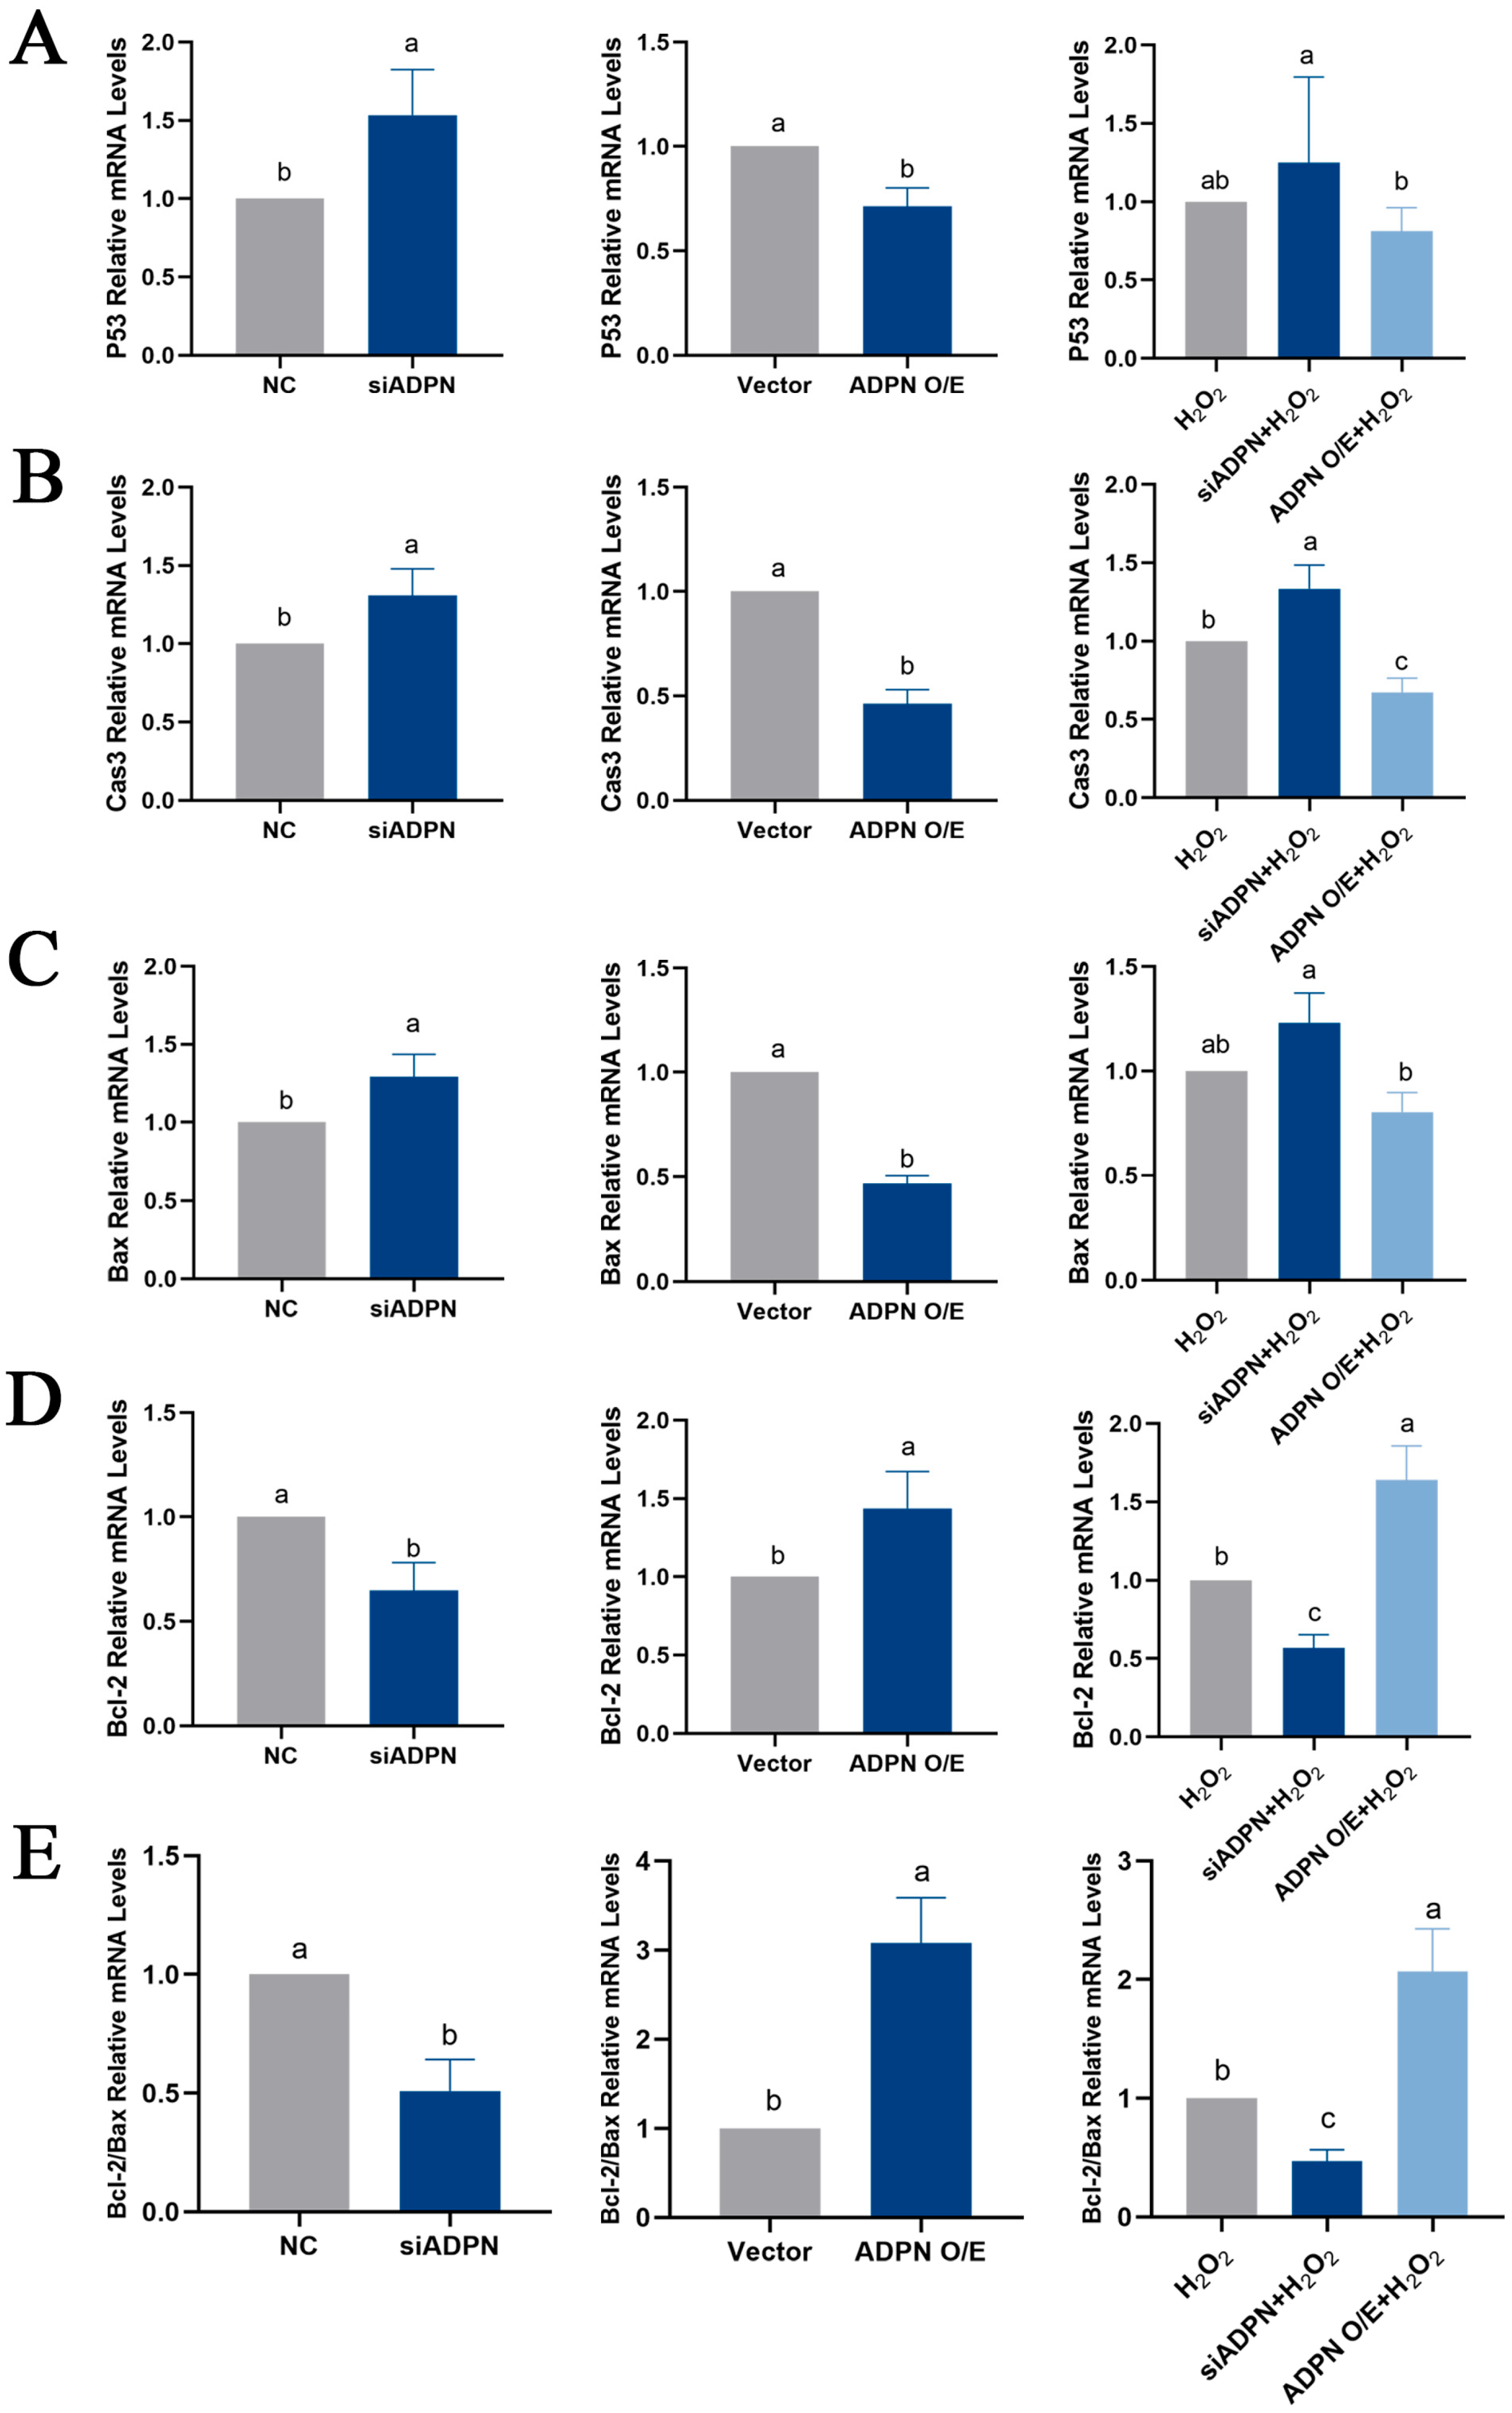
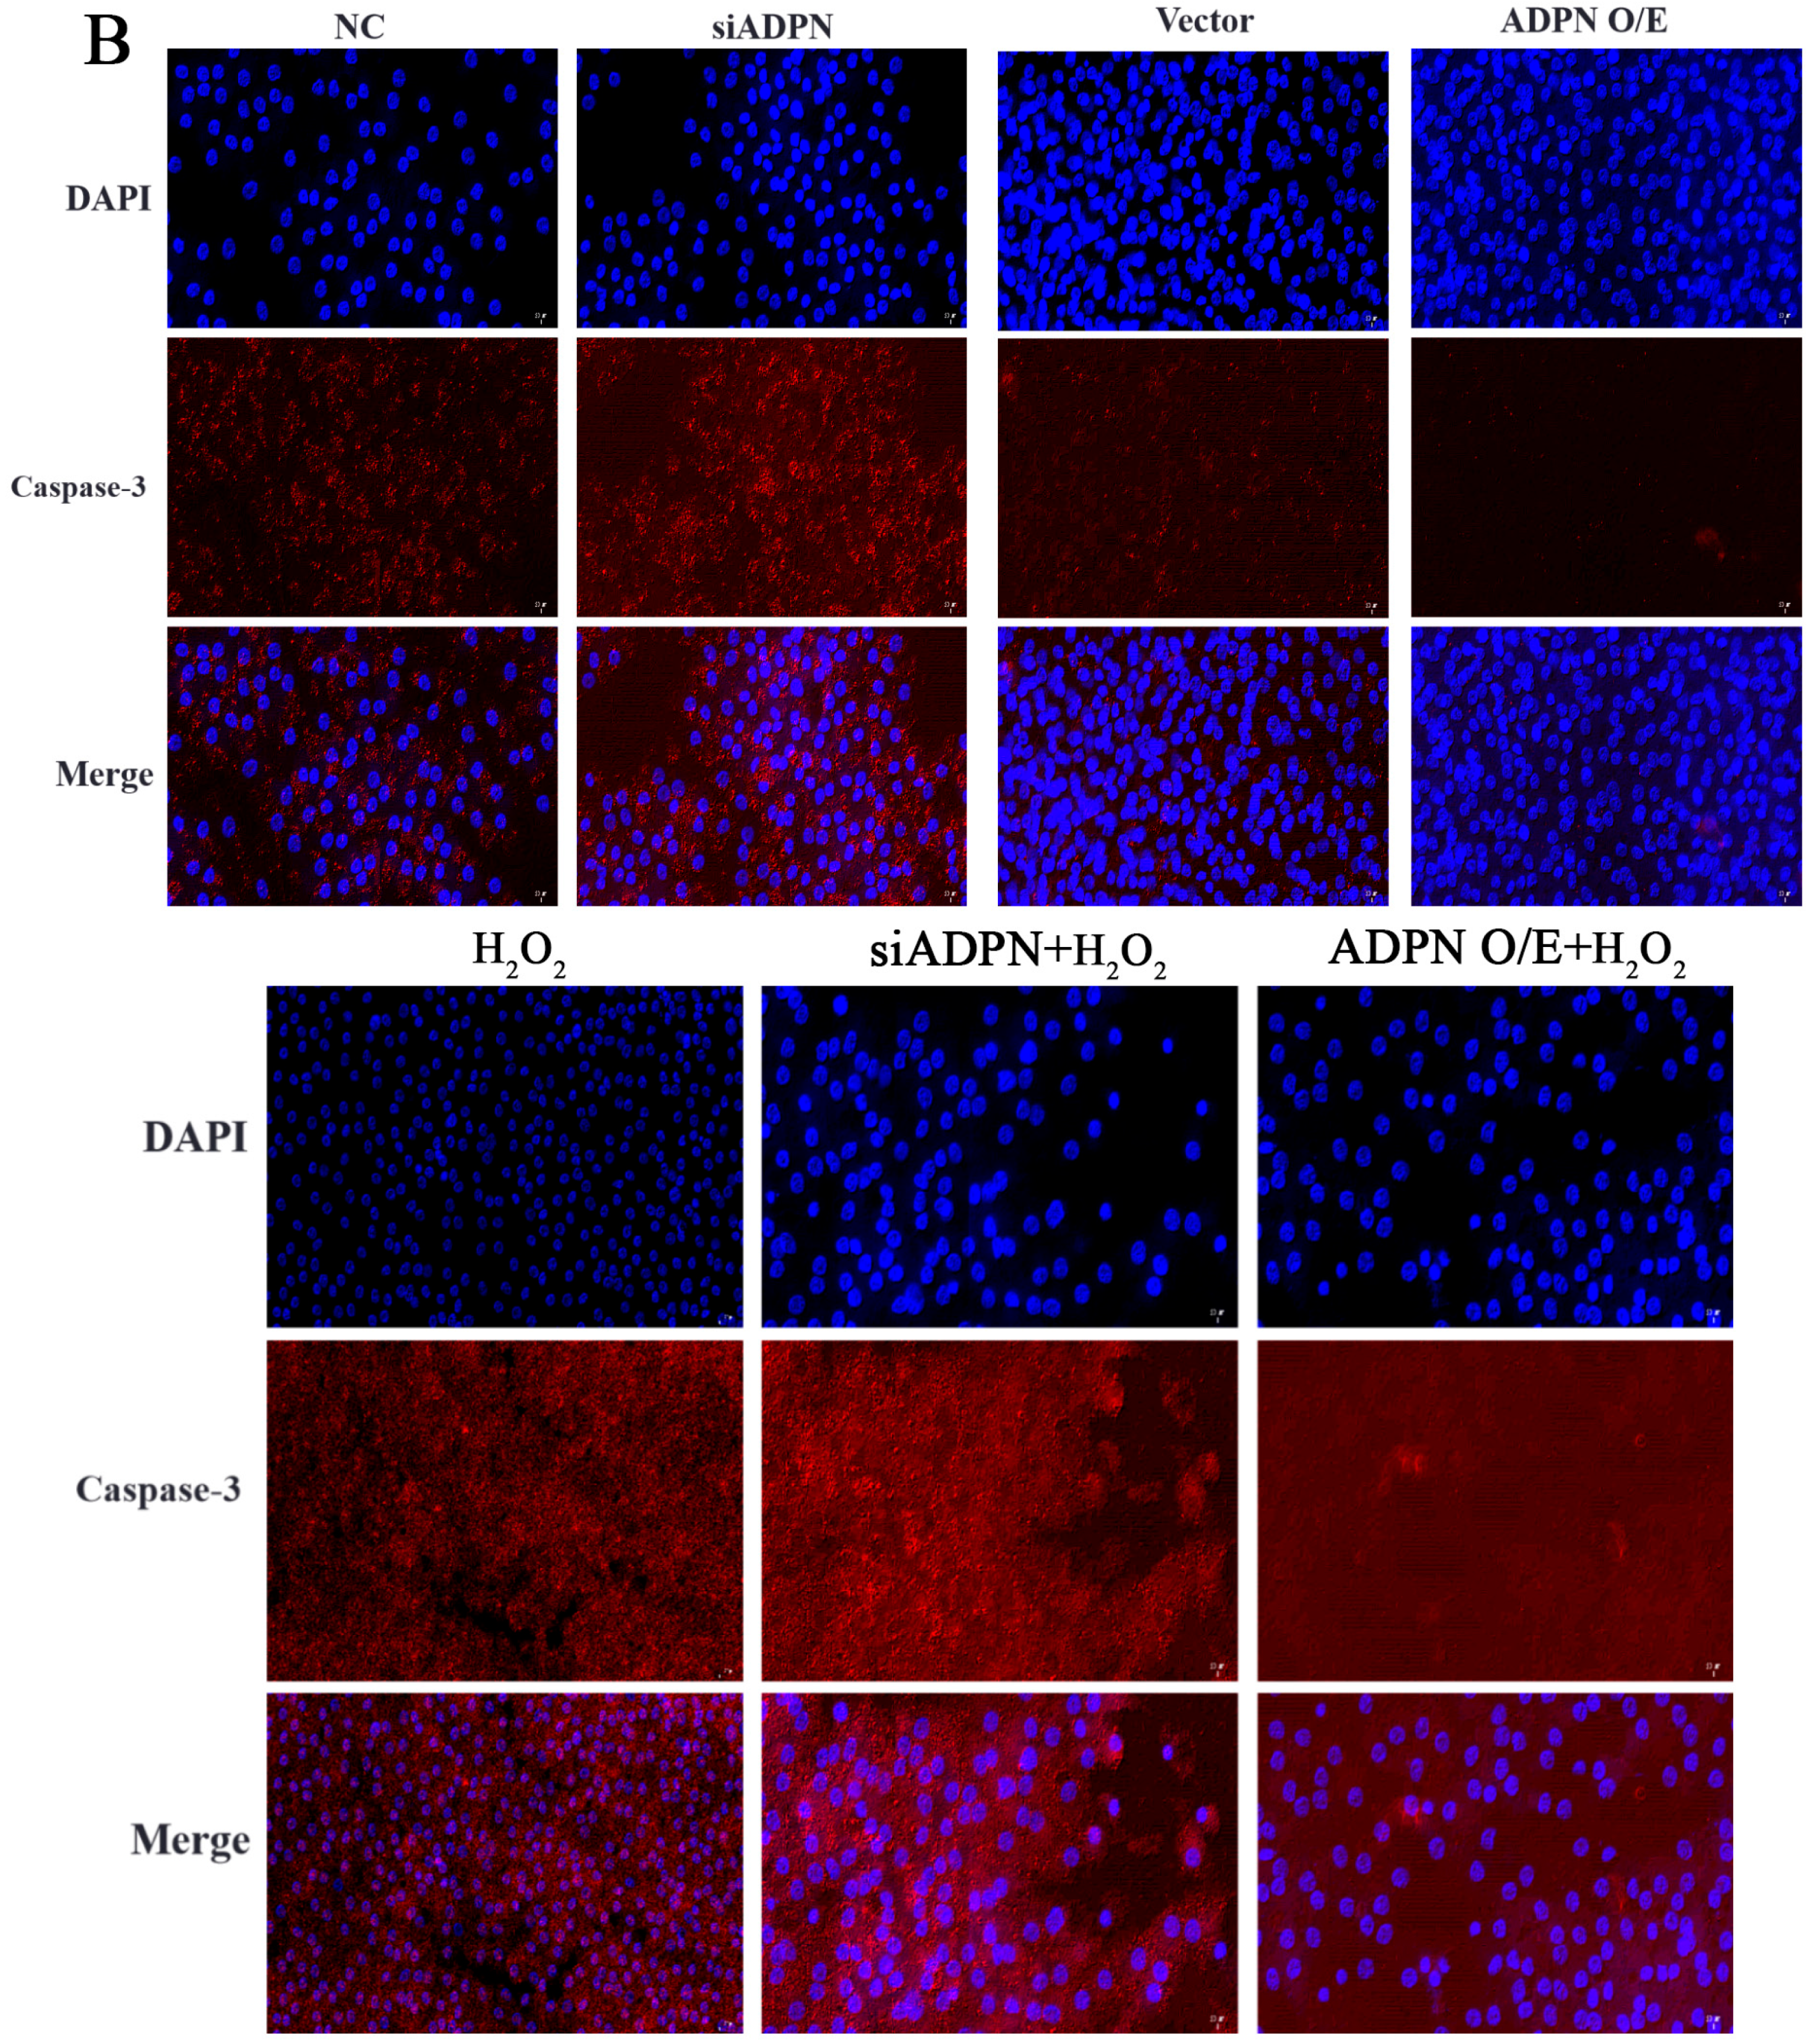
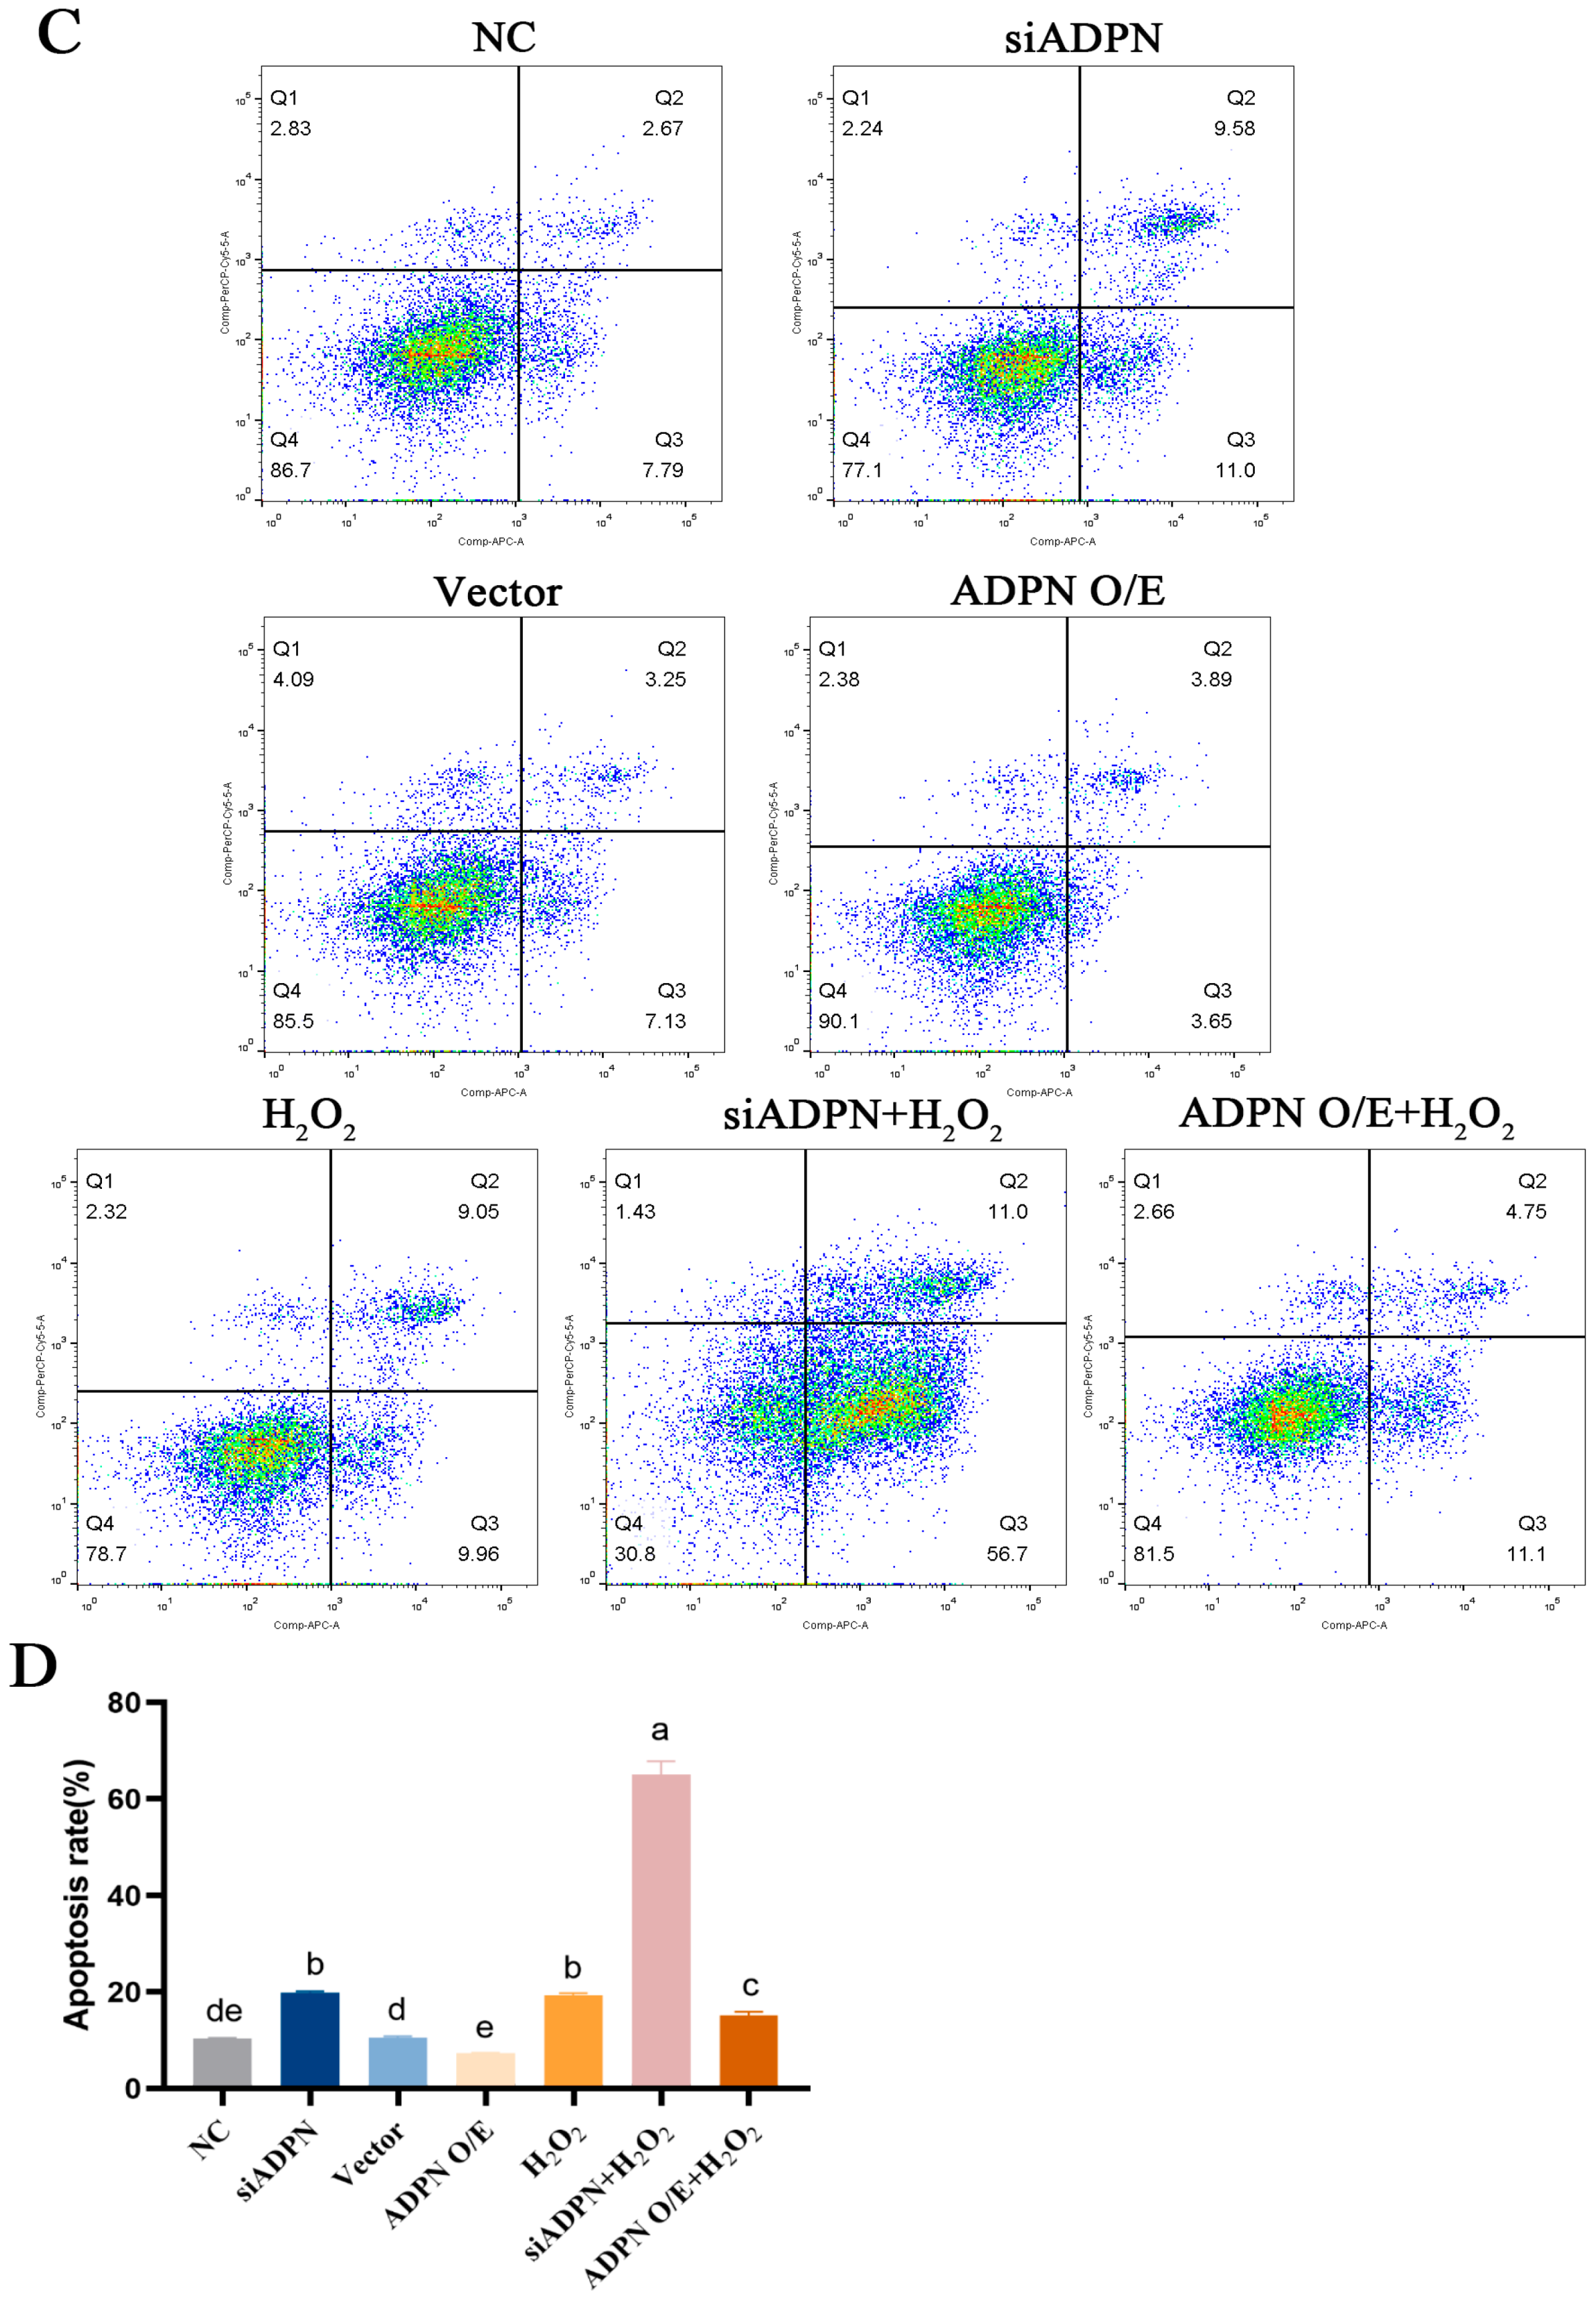
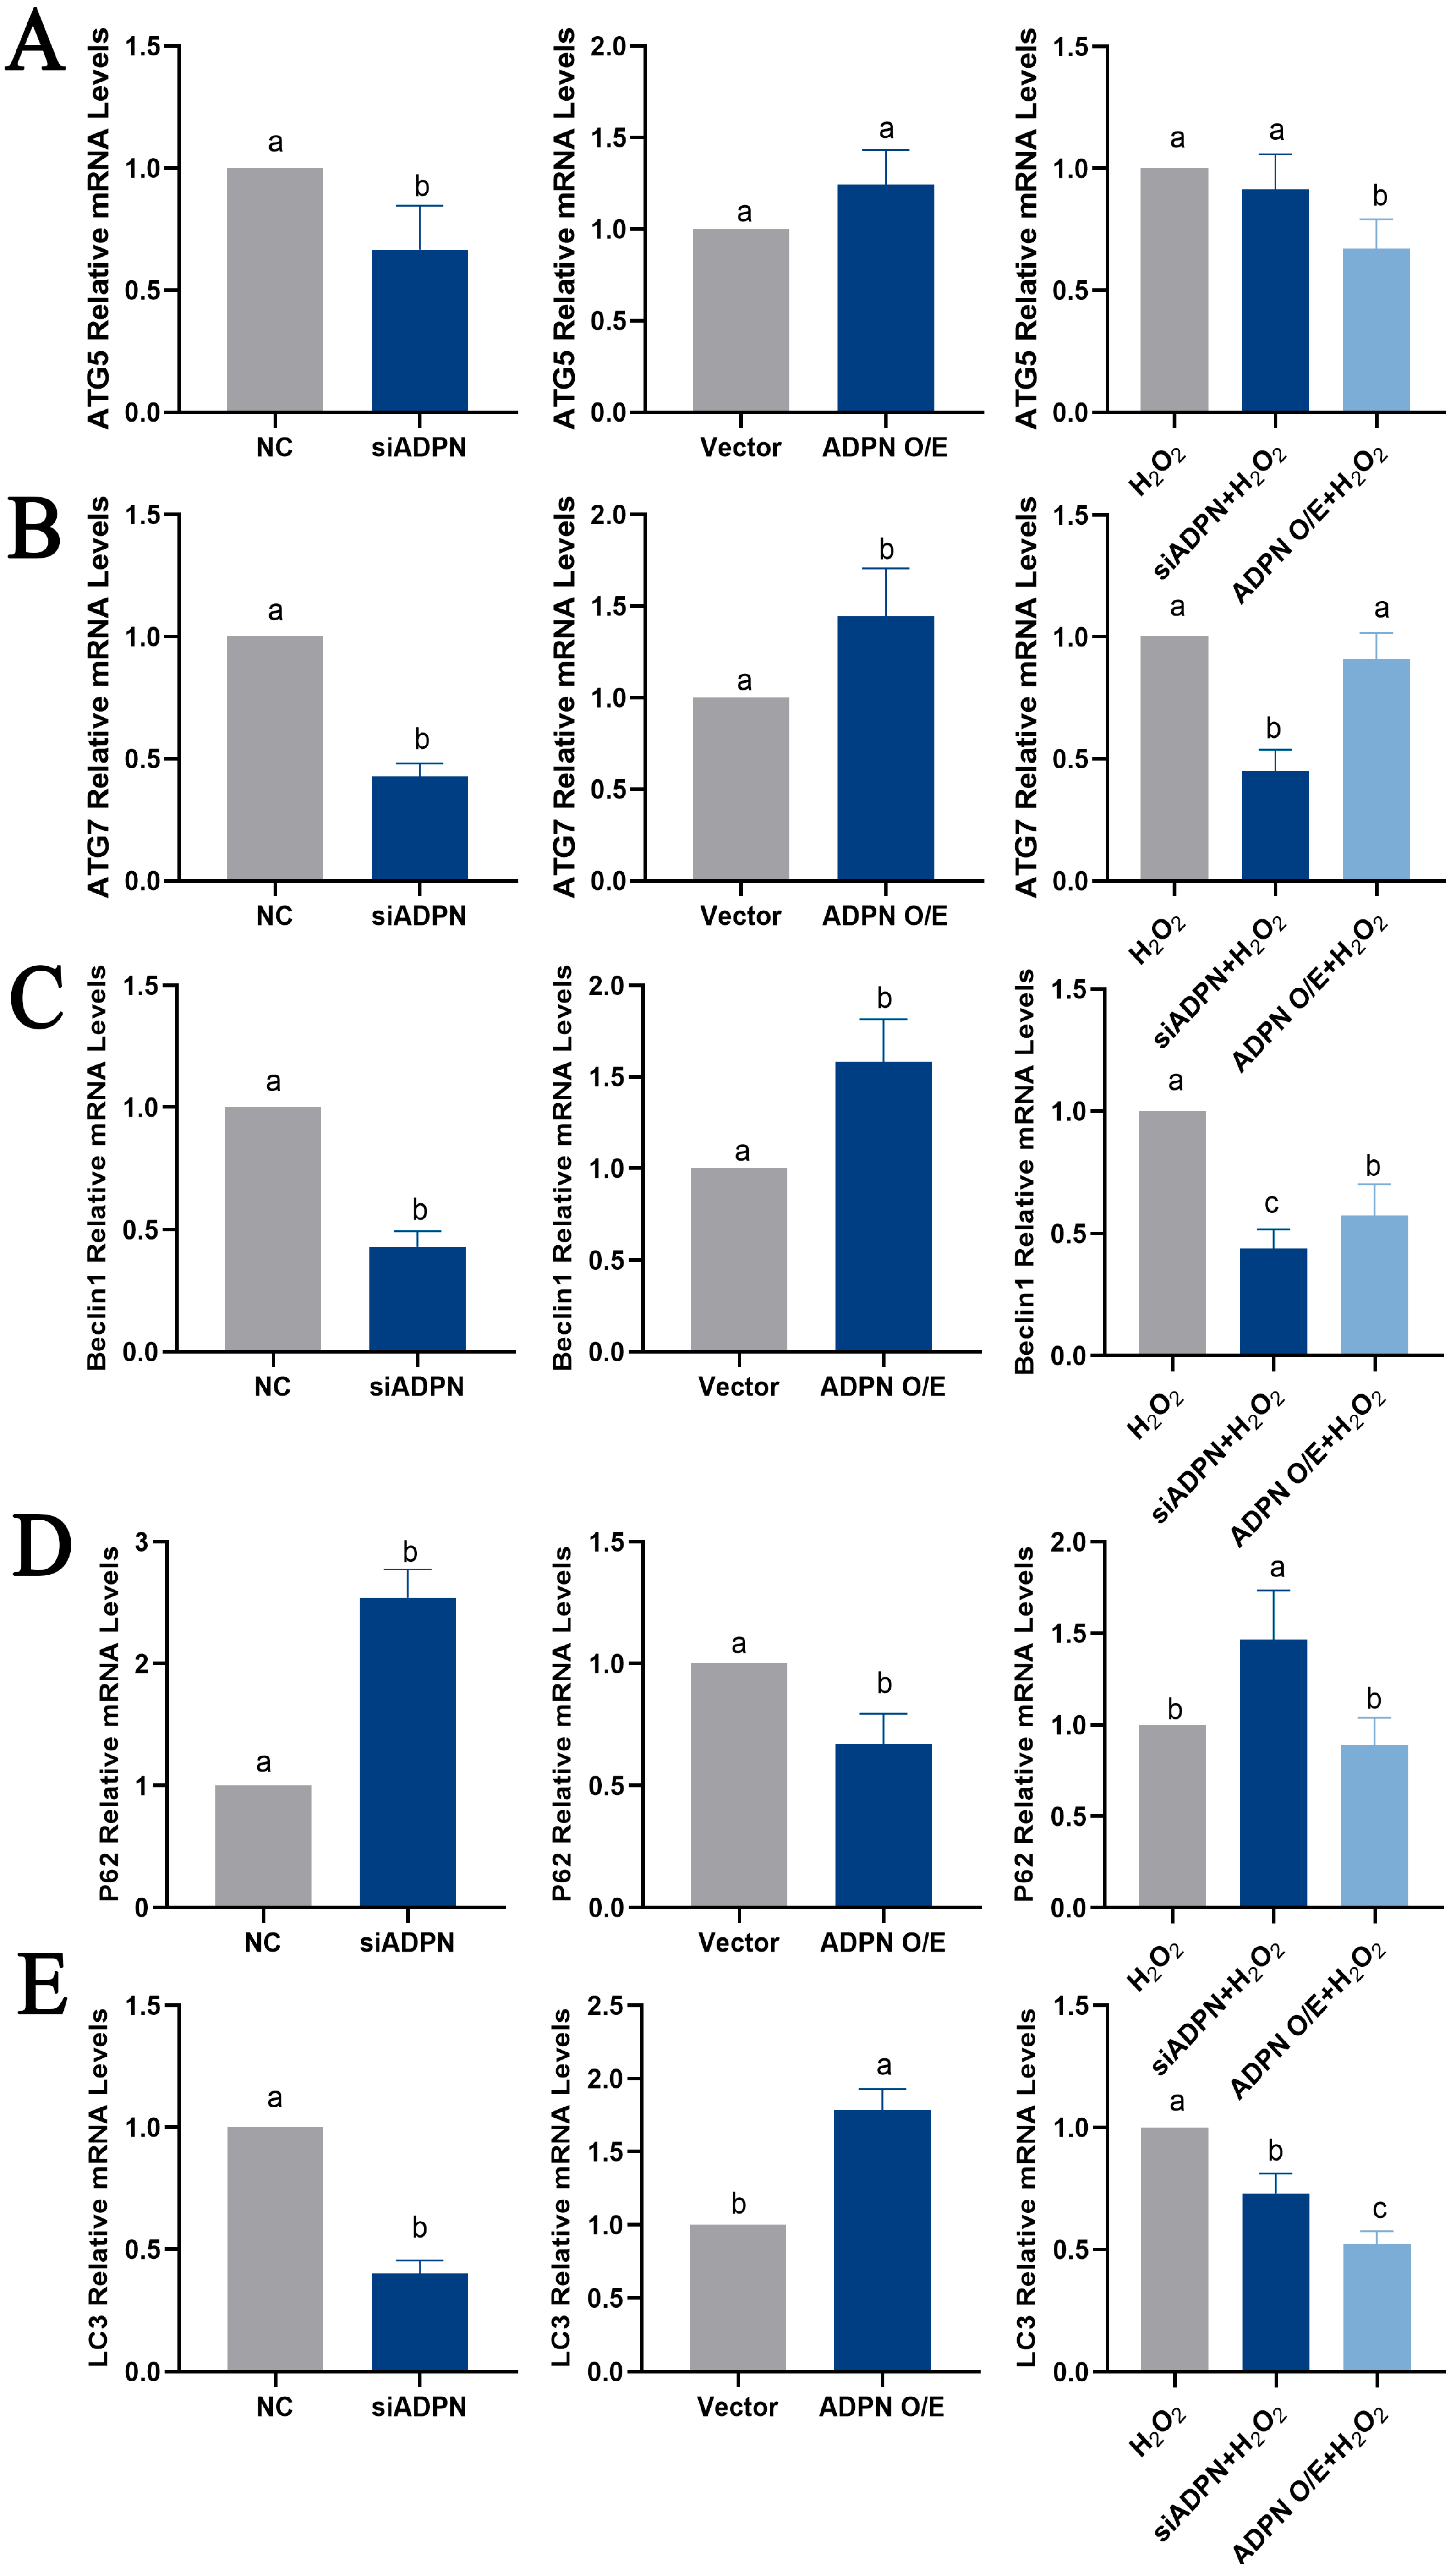
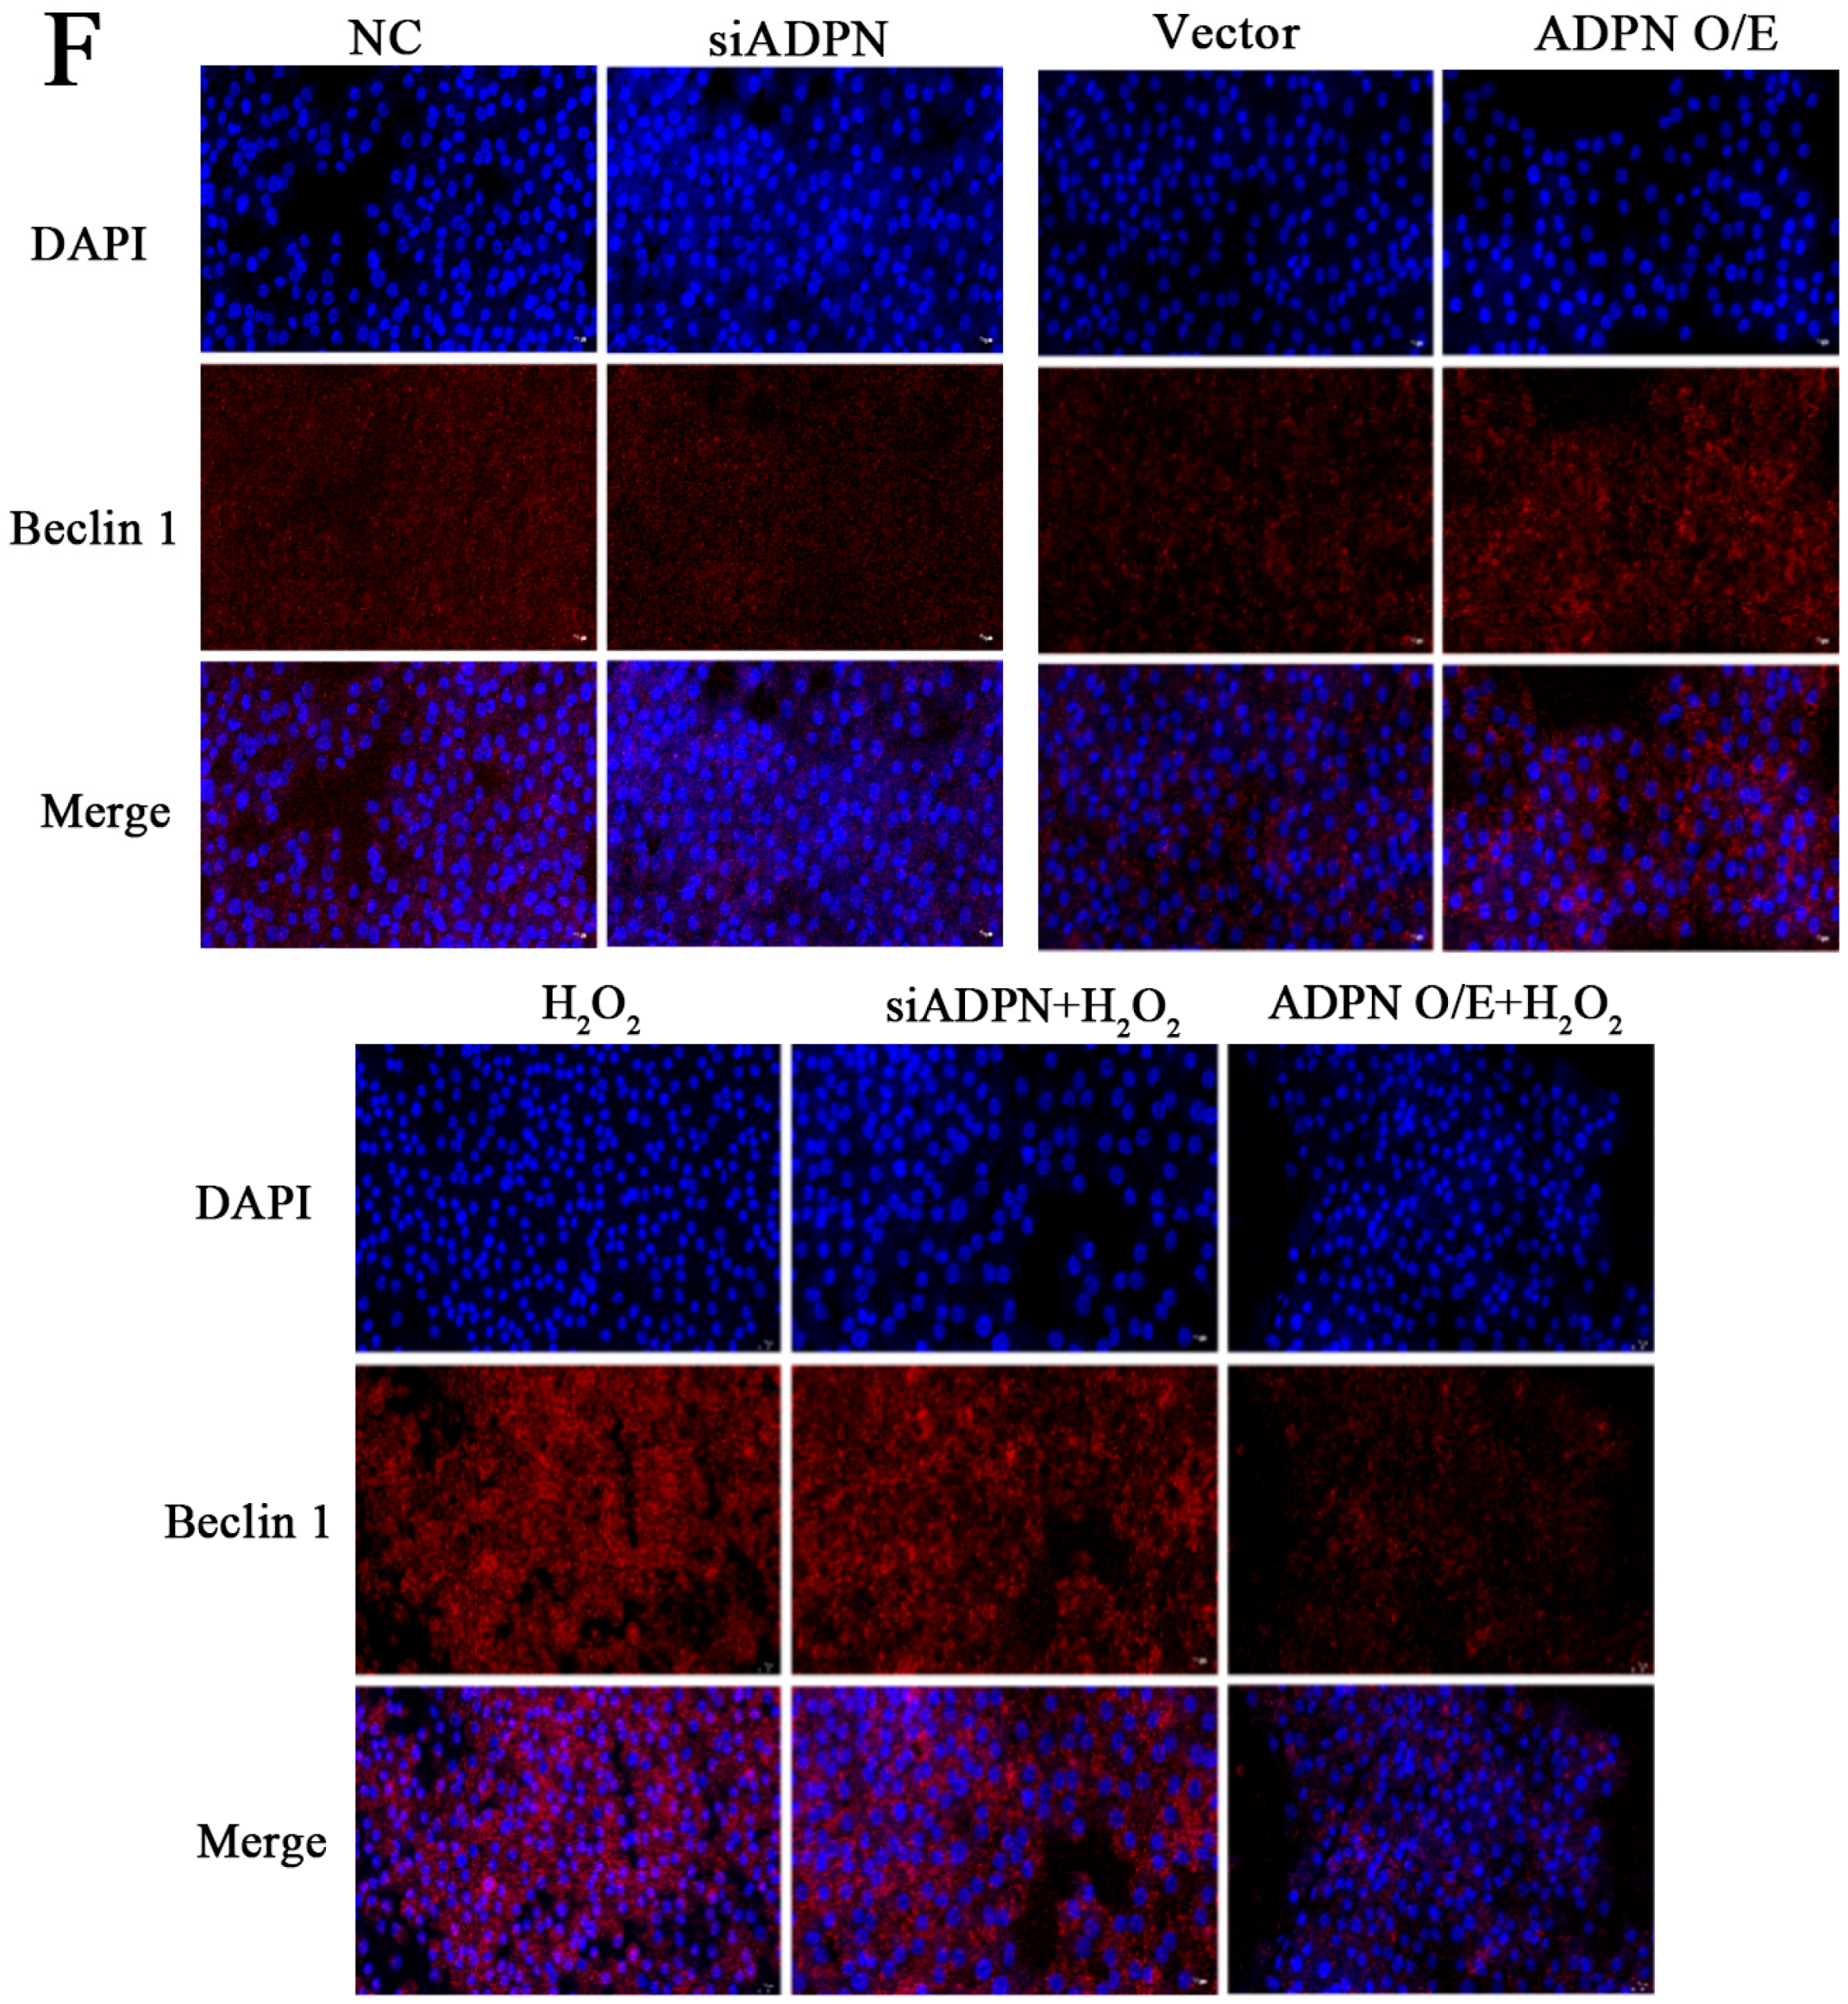
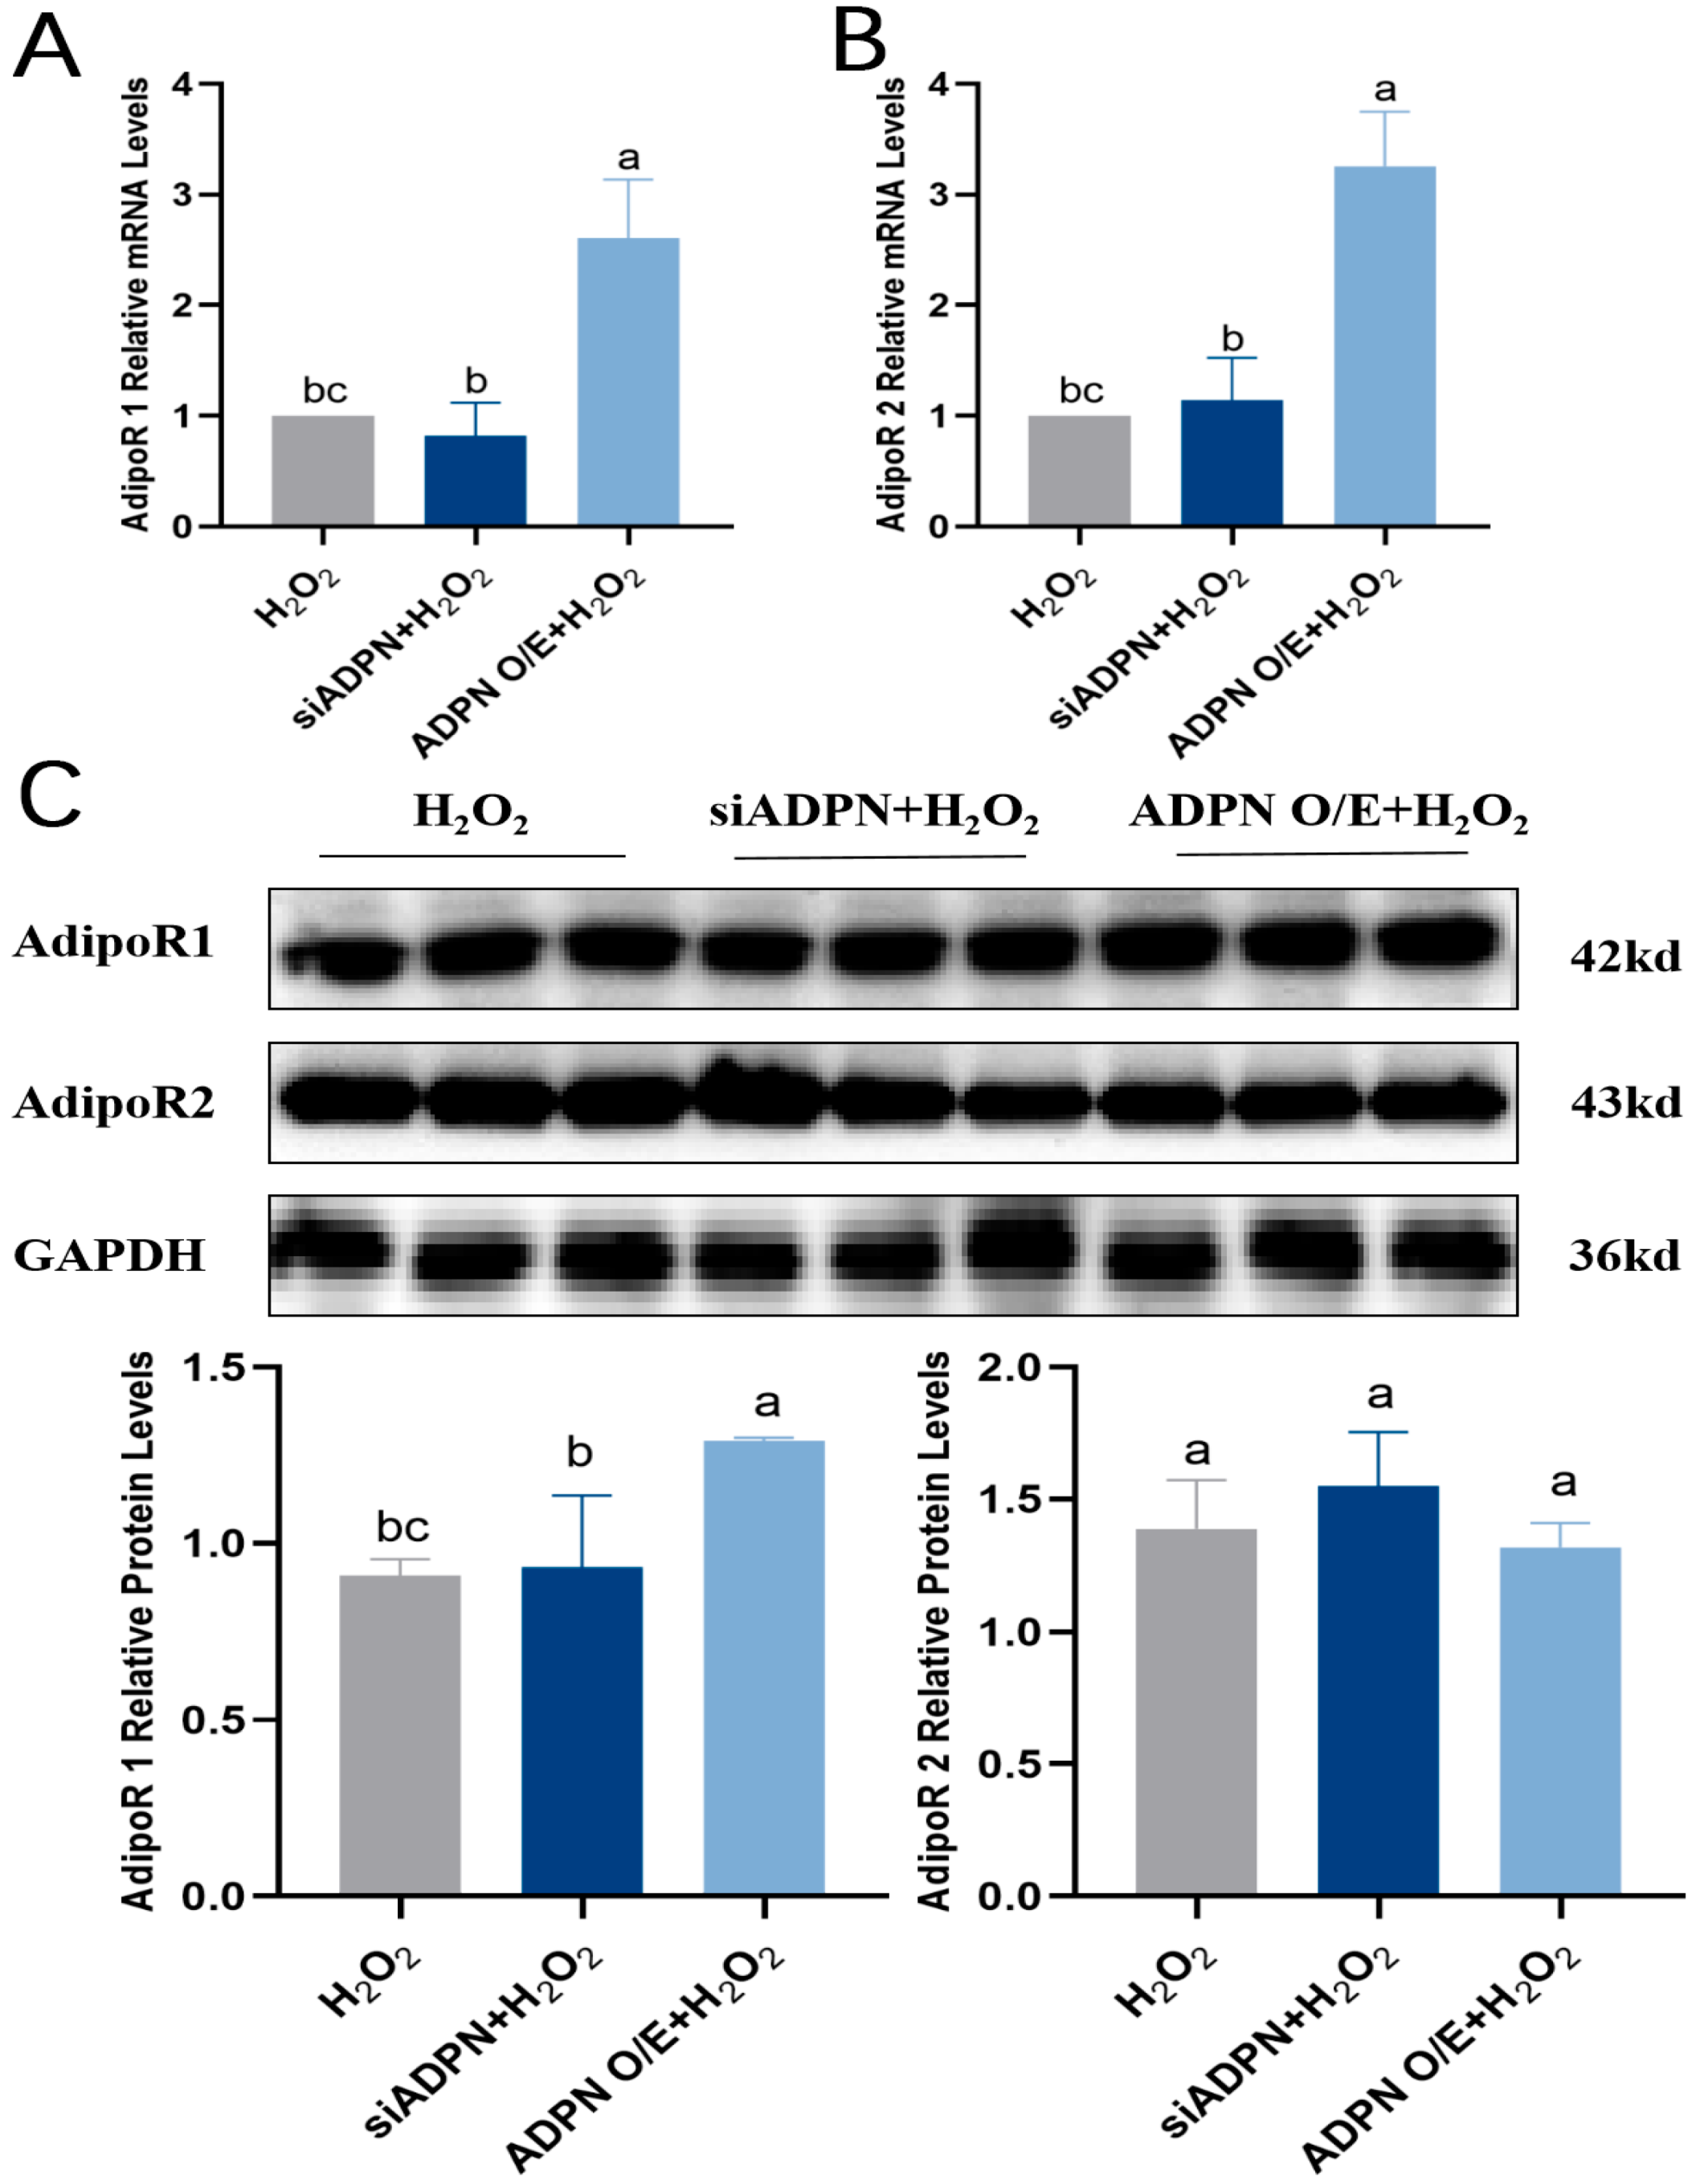
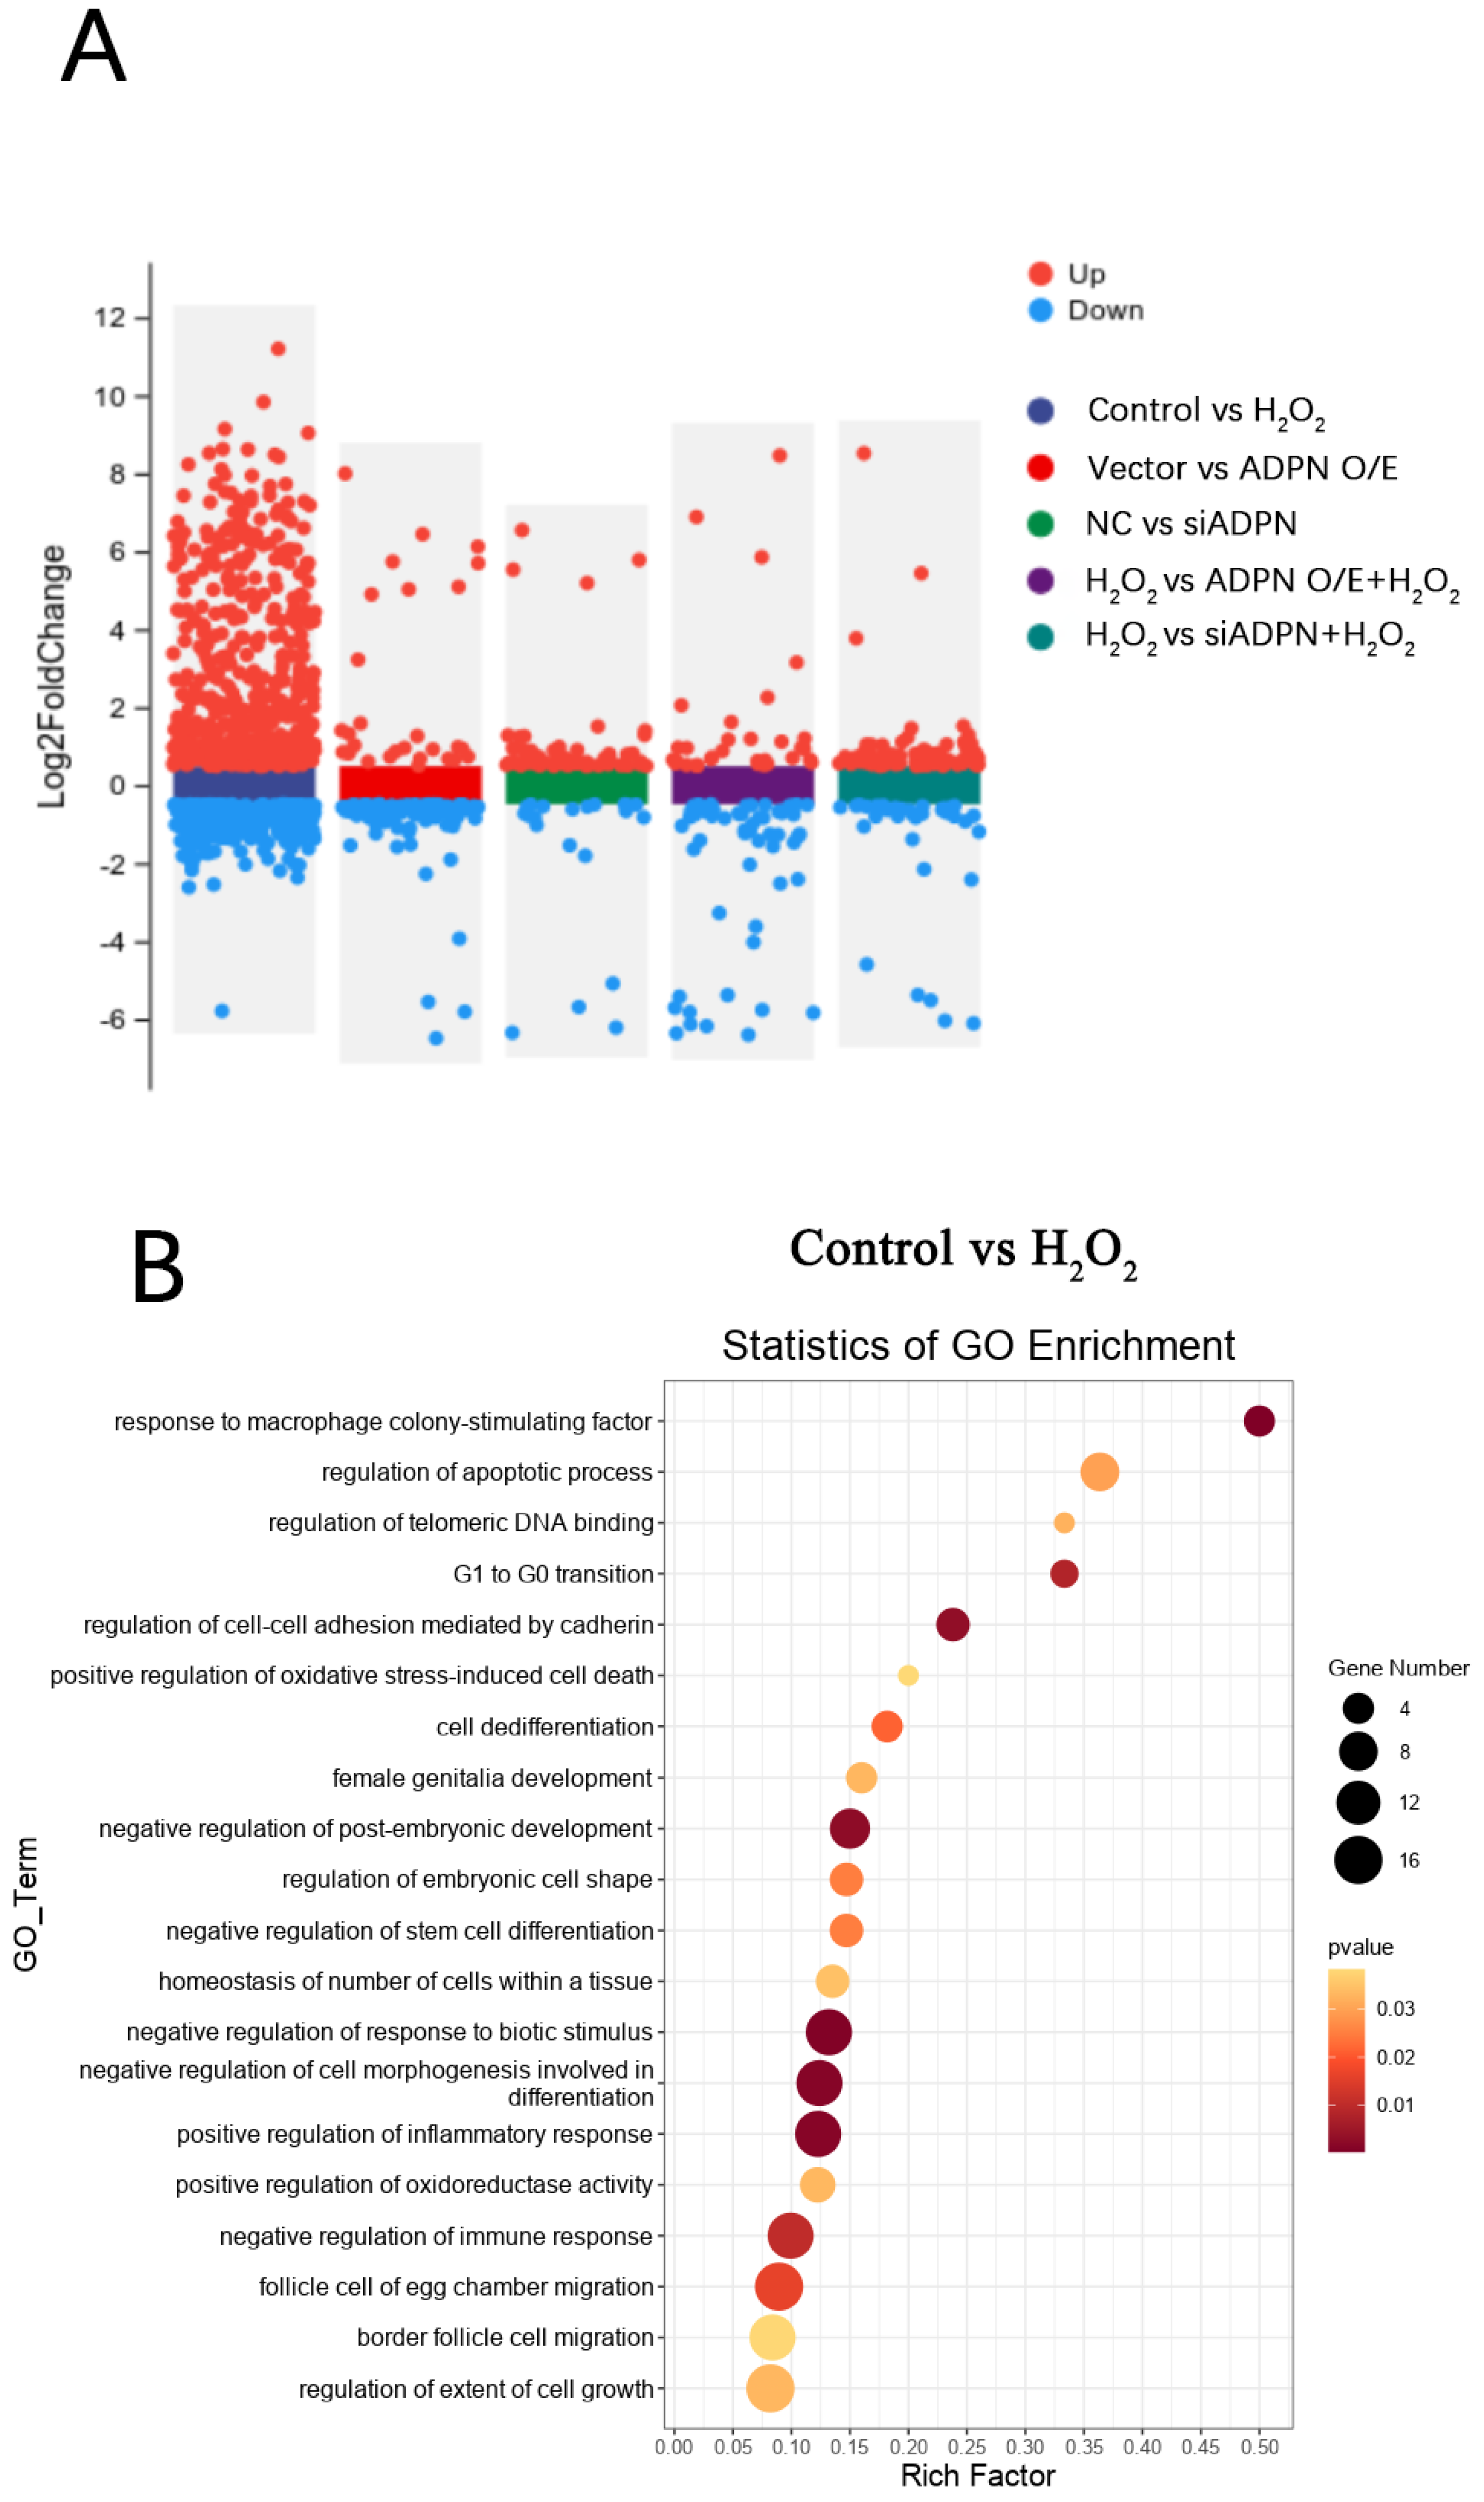
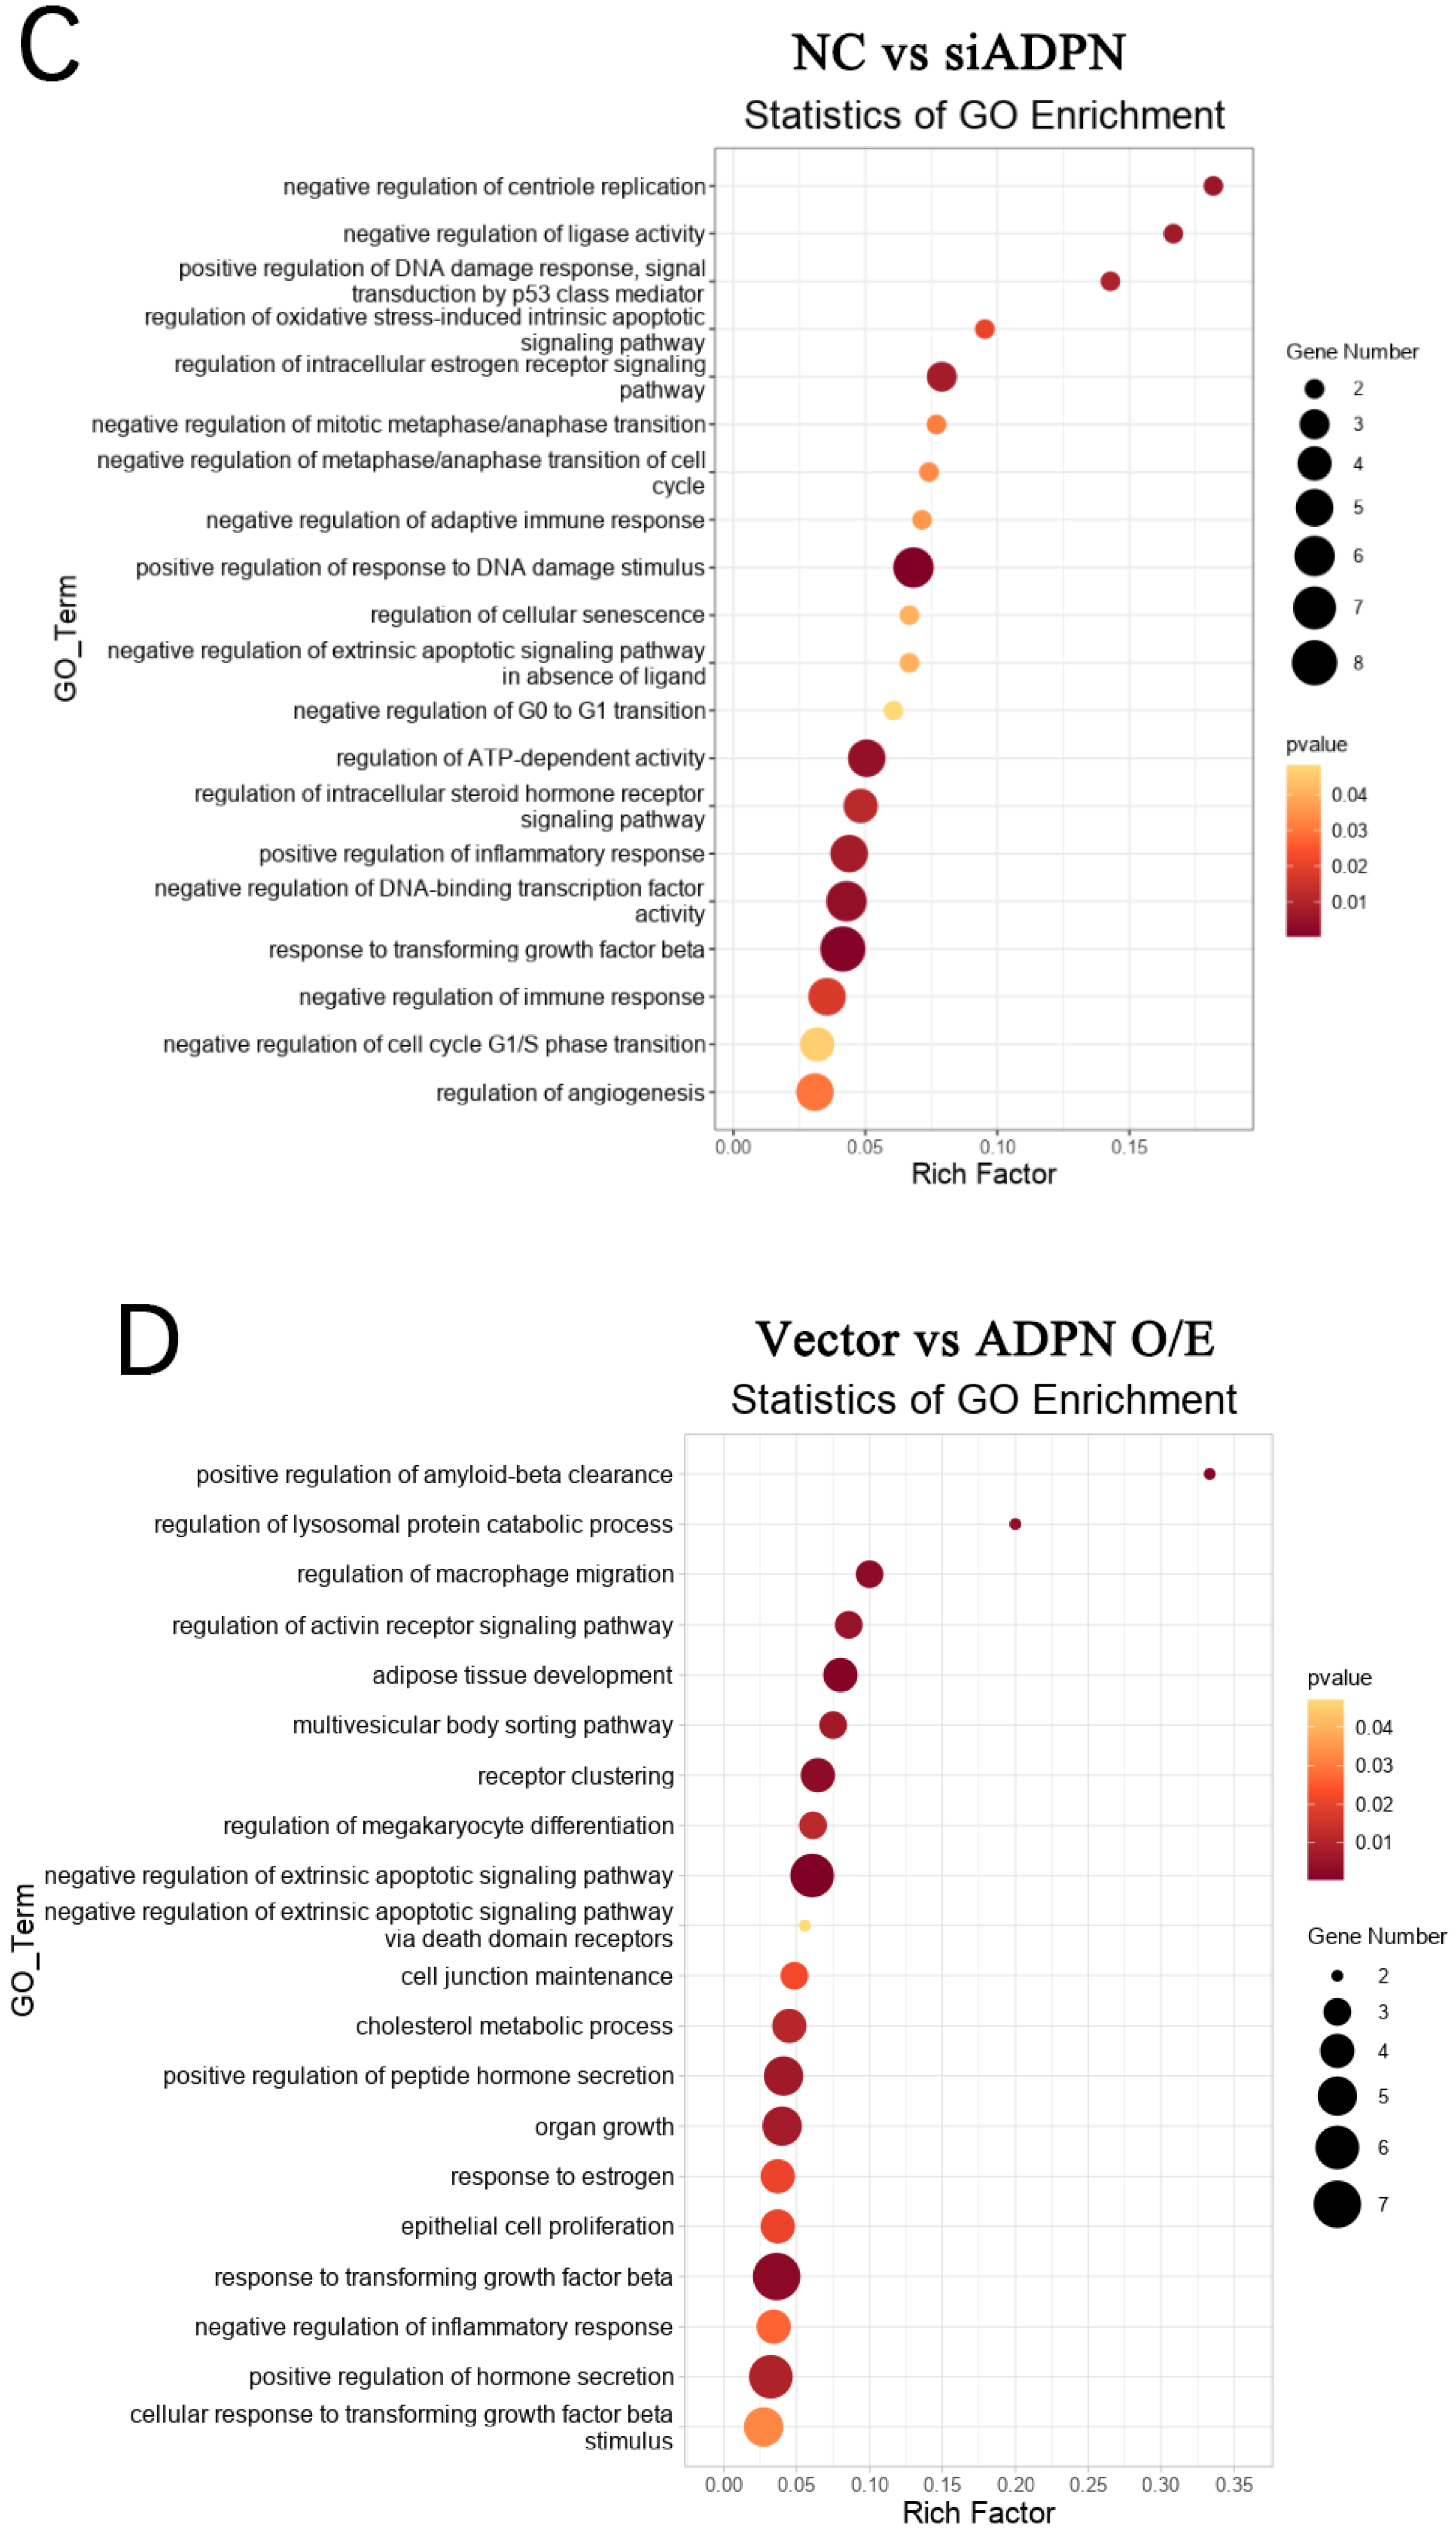
2.7. ADPN Regulated Apoptosis and Autophagy in GCs Induced by Oxidative Stress in GCs

To assess the effect of ADPN on apoptosis and autophagy in GCs under oxidative stress, specific siRNA and overexpression plasmids were used to decrease or increase its expression, respectively. The mRNA expression of ADPN was reduced in GCs transfected with siRNA-ADPN (siADPN) compared to the negative control group (NC), and the mRNA expression of ADPN increased in GCs transfected with the ADPN overexpression plasmid (ADPN O/E) compared to the vector group (Figure 8A). The same trend was observed for ADPN secretion in the culture supernatant of GCs (Figure 8B). The ROS assays results suggested that ADPN has a regulatory effect on oxidative stress in GCs. The knockdown of ADPN resulted in an increase in ROS production, which further enhanced H2O2-induced ROS production. Conversely, the overexpression of ADPN led to a decrease in ROS production (Figure 8C).
The downregulation of ADPN induced apoptosis in GCs. The data indicated an increase in the expression of P53, Caspase-3, and Bax, a decrease in the expression of Bcl-2 and a decrease in the Bcl-2/Bax ratio (Figure 9A–E). Additionally, the number of Hoechst33342/PI-staining-positive cells (Figure 10A), the level of Caspase-3 protein expression (Figure 10B) and the apoptosis rate (Figure 10C,D) all increased after ADPN knockdown. This trend was more noticeable when siADPN and H2O2 were combined to influence GCs. In contrast, upregulation of ADPN resisted apoptosis. Compared to the vector group, the ADPN O/E group exhibited a decrease in P53, Caspase-3 and Bax expression, an increase in Bcl-2 expression and an increase the Bcl-2/Bax ratio. (Figure 9A–E). Furthermore, the number of Hoechst33342/PI-staining-positive cells (Figure 10A), the level of Caspase-3 protein expression (Figure 10B) and the apoptosis rate (Figure 10C,D) were reduced while attenuating H2O2-induced apoptosis.
ADPN regulates cellular autophagy. The knockdown of ADPN inhibits autophagy, while the overexpression of ADPN promotes it. The siADPN group exhibited decreased mRNA expression of ATG5, ATG7, Beclin1 and LC3, as well as increased expression of P62 mRNA (Figure 11A–E), and decreased protein expression of Beclin1 (Figure 11F). In contrast, the ADPN overexpression group showed increased mRNA expression of ATG5, ATG7, Beclin1 and LC3, decreased P62 mRNA expression and increased Beclin1 protein expression. Stimulating GCs with H2O2 led to a decrease in mRNA expression of ATG5, ATG7, Beclin 1, and LC3, as well as a decrease in Beclin 1 protein expression in both the siADPN + H2O2 group and the ADPN O/E + H2O2 group. Furthermore, p62 expression was increased in the siADPN + H2O2 group and decreased in the ADPN O/E + H2O2 group (Figure 11A–F).
Since the biological effects of ADPN are mediated by its binding to the AdipoR1 and AdipoR2 receptors, the expression levels of AdipoR1 and AdipoR2 were next examined. The results showed that both AdipoR1 and AdipoR2 mRNA expression increased (Figure 12A,B), AdipoR1 protein expression level was significantly elevated, and there was no significant difference in AdipoR2 protein expression level in the ADPN O/E + H2O2 group compared to the H2O2 group (Figure 12C). There was no significant difference in both AdipoR1 and AdipoR2 mRNA and protein expression in the siADPN + H2O2 group compared to the H2O2 group (Figure 12A–C).
To investigate the role of ADPN in regulating apoptosis and autophagy, RNA-seq analysis was conducted on each group of GCs. The differentially expressed genes (DEGs) in each group of GCs are shown in Figure 13A. A total of 723 DEGs were identified between the control group and the H2O2 group, of which 477 were upregulated and 246 were downregulated; 75 DEGs were identified between the NC group and siADPN group, of which 58 were upregulated and 17 were downregulated; 106 DEGs were identified between the vector group and ADPN O/E group, of which 25 were upregulated and 81 were downregulated; 112 DEGs were identified between the siADPN group and siADPN + H2O2 group, of which 77 were upregulated and 35 were downregulated; and 88 DEGs were identified between the ADPN O/E group and ADPN O/E + H2O2 group, of which 31 were upregulated and 57 were downregulated.
Furthermore, GO analysis of DEGs in the control and H2O2 groups enriched biological processes such as regulation of the apoptotic progress (DEGs: MCL1, FGF10, MAPK7, etc.), cell cycle (DEGs: CAPN3, etc.), positive regulation of oxidative-stress-induced cell death (DEGs: MCL1, etc.), and inflammatory response (DEGs: CTSS, NFκBIA, CCR2, CCR7, etc.), negatively regulating of cell growth (DEGs: SRF, PAK1, MAP3K9, etc.), differentiation (DEGs: ESRRβ, HOXC9, etc.), immune response (DEGs: CRK, ACOD1, ADRA2B, etc.), post-embryonic development (DEGs: APC, SMARCC2, etc.), etc. (Figure 13B). The GO analysis also showed the NC and siADPN groups to be enriched in DEGs negatively regulating the cell cycle (DEGs: PLK2, PCNA, CDKN2B, etc.) and immune response (DEGs: TGFβ3, SAMSN1, etc.) and positively regulating DNA damage (DEGs: FGF10, PCNA, CDKN2B, etc.), inflammatory responses (DEGs: AGTR1, NFκBIA, etc.), apoptosis (DEGs: FGF10, MAPK7, etc.), etc. (Figure 13C). In the Vector and ADPN O/E groups, the DEGs were enriched in biological processes, such as the negative regulation of extrinsic apoptosis (DEGs: FGF10, MAPK7, AGAP2, HMGB2, etc.) and immune response (DEGs: GPX2, MAPK7, etc.), the regulation of hormone secretion (DEGs: GLUL, CASR, etc.), organ growth (DEGs: TENM4, GGCX, etc.) and cell junction maintenance (DEGs: TENM4, F2R, etc.) (Figure 13D). In the H2O2 and siADPN + H2O2 groups, the DEGs were enriched in the negative regulation of the cell cycle (DEGs: HUS1, TTK, etc.), the reproductive process (DEGs: CALR, HUS1, etc.), cell proliferation (DEGs: TGFβ3, MEF2C, etc.) and the immune effector process (DEGs: TGFβ3, DHX58, etc.) (Figure 13E). The ADPN O/E and ADPN O/E + H2O2 groups showed enriched biological processes, such as the regulation of the cell cycle (DEGs: FGF10, PLK2, etc.), hormone secretion (DEGs: AGTR1, NRG1, etc.), response to cAMP (DEGs: COL1A1, AKAP6, PAX4, etc.) and developmental induction (DEGs: FGF10, GDNF, etc.), the negative regulation of apoptosis (DEGs: FGF10, NRG1, GDNF, etc.), the positive regulation of DNA repair (DEGs: FGF10, etc.), etc. (Figure 13F).
The KEGG pathway database was used to conduct pathway analysis and identify enriched pathways in DEGs. The pathway enrichment analysis, results are shown in Figure 14. KEGG analysis of DEGs in the control and H2O2 groups showed significantly enriched pathways such as GnRH (DEGs: KRAS, ITPR3, etc.), VEGF (DEGs: KRAS, PLA2G4F, etc.), ECM-receptor interaction (DEGs: SV2C, COL2A1, etc.), ErbB (DEGs: ERBB2, CDKN1A, etc.) and apoptosis (DEGs: MCL1, KRAS, etc.) (Figure 14A). The NC and siADPN groups showed an enriched cell cycle (DEGc: PCNA, TGFβ3, CDKN2B, etc.), AGE-RAGE (DEGs: AGTR1, STAT2, etc.), PPAR (DEGs: ME1, CPT1B, etc.) and TGF-β (DEGs: TGFβ3, SP1, etc.) (Figure 14B). In the vector and ADPN O/E groups, the citrate cycle (DEGs: BCKDHA, etc.), arginine biosynthesis (DEGs: GLUL, ARG2, etc.), pyruvate metabolism (DEGs: BCKDHA, etc.) and ECM-receptor interaction (DEGs COL1A1, COL1A2, etc.) pathways were enriched (Figure 14C). In the H2O2 and siADPN + H2O2 groups, pathways were enriched for nitrogen metabolism (DEGs: GLUL, CA8) and AGE-RAGE (DEGs: TGFβ3, COL1A1, AGTR1, etc.) (Figure 14D), and in the H2O2 and ADPN O/E + H2O2 groups, AGE-RAGE (DEGs: TGFβ3, COL1A1, AGTR1, etc.) and TGF-β (DEGs: TGFβ3, etc.) pathways were enriched (Figure 14E).

3. Discussion

Unlike those in mammals, avian follicles ovulate in a strict hierarchical sequence and only a small number of primordial follicles develop into SYFs and progress to hierarchical follicles. The majority of follicles degenerate and undergo atresia before developing into SYFs or during the hierarchical development process, resulting in only a few follicles maturing and ovulating [1,2,5]. In geese with low egg production, follicular development and atresia have a direct impact on their poor breeding performance. Therefore, understanding the mechanism and regulation of follicular atresia in geese is crucial for improving geese productivity.
In the present study, changes were observed in atretic follicles, including alterations in their color, shape and elasticity, as well as the detachment of the granulosa cell layer. Notably, the blood vessels on the surface of the atretic follicles’ membrane disappeared. This phenomenon may be considered normal. According to a previous study, follicle-related blood vessels are temporary structures that are completely eliminated after ovulation or atresia [25].
Various factors in farming can induce oxidative stress, resulting in the generation of large amounts of ROS. Mitochondria-derived ROS are the primary inducers of apoptosis and autophagy during oxidative stress, mediating multiple signaling pathways; excessive accumulation of ROS in the follicular fluid can cause destruction and damage to proteins, enzymes, lipids and DNA. This can lead to apoptosis and autophagy in granulosa cells, ultimately resulting in follicular atresia [11,12,13]. Our findings are consistent with this hypothesis, as we observed high levels of oxidative stress, apoptosis and autophagy in atretic follicles of geese. It was also found that there was a high degree of oxidative stress in pre-hierarchical follicles compared to hierarchical follicles. This may be due to the follicle’s weak antioxidant capacity during the early stage of its development. However, it should be noted that autophagy was similarly enhanced in SYFs, which may explain why SYFs are susceptible to oxidative stress but have reduced expression of the pro-apoptotic protein Bax and elevated expression of the anti-apoptotic protein Bcl-2.
Autophagy can have both positive and negative effects. In normal conditions, autophagy can inhibit apoptosis, but excessive autophagy can also lead to apoptosis [26]. When follicles are stimulated to undergo oxidative stress, autophagy is activated to inhibit apoptosis. However, with continued oxidative stress, autophagy is gradually enhanced, ultimately resulting in follicular atresia. Furthermore, elevated levels of apoptosis were detected in F1 follicles, indicating their potential progression towards follicular atresia. As previously stated, poultry ovulation follows a strict hierarchical system. Therefore, if atresia occurs in an F1 follicle, a different F2 follicle needs to develop into an F1 follicle for ovulation to occur, resulting in longer intervals between laying and reduced egg production within the limited laying cycle.
GCs are crucial in follicular development, and their apoptosis leads to follicular atresia, which, in turn, affects reproductive function. Numerous studies have demonstrated that follicular atresia is caused by the apoptosis of follicular granulosa cells. During follicular atresia, the first observable change is nuclear shrinkage in the granulosa cells. This is followed by detachment of the granulosa cell layer, rupture of the basement membrane and, ultimately, hypertrophy of the membrane cells and disruption of the membrane vasculature. Additionally, granulosa cell apoptosis may occur before the morphological changes of follicular atresia appear, and follicular atresia can only be observed when granulosa cell apoptosis has reached a certain level [27,28,29].
By culturing primary GCs in vitro and constructing an oxidative stress model with the addition of H2O2, we demonstrated that oxidative stress results in the accumulation of ROS in goose GCs, reducing their cell viability and leading to apoptosis and autophagy. This is similar to the results of previous studies in chickens and pigs [30,31]. Notably, autophagy was enhanced in H2O2-treated GCs, and P62 mRNA expression was also increased. Increased mRNA and protein expression of P62 was similarly found in atretic follicle tissues. This could be related to the blockage of autophagic flux.
Autophagy is a dynamic process that involves three sequential steps: autophagosome formation, autophagosome-lysosome fusion and degradation [32]. P62 carries ubiquitinated substrates that bind to LC3 and are then transported by autophagosomes to lysosomes for degradation [33]. Therefore, the level of P62 can be used as a marker to assess autophagic flux.
As our results demonstrate, P62 expression was increased in atretic follicles and H2O2-treated GCs, but the expression of autophagy marker molecules such as LC3, Beclin1, etc., was also found to be increased. This indicates that the autophagy process activated by oxidative stress in GCs may not be complete. When GCs were stimulated with H2O2, autophagy was initiated, but the degradation stage was blocked, leading to the inability to degrade the carried substrate despite the formation of an autophagosome. This resulted in the accumulation of P62 and substrate, ultimately leading to GC apoptosis. Recent research has demonstrated that blocked autophagic flux has a negative impact on the growth and differentiation of GCs [34].
ADPN has been extensively studied in its role in the regulation of glycolipid metabolism [35,36]. In recent years, there has been an increasing interest in the role of ADPN in regulating the reproductive system. Previous studies showed ADPN can stimulate spermatogenesis and protects germ cells from apoptosis and promote oogenesis and ovarian steroid hormones production [37,38]. Our study found that ADPN expression and antioxidant capacity was lower in atretic and pre-hierarchical follicles compared to hierarchical follicles, suggesting a correlation between ADPN and follicular antioxidant capacity. Luti et al. [39] similarly found a significant correlation between the total ADPN levels and the degree of oxidative stress in human follicular fluid and serum. In addition, Choubey et al. [38] demonstrated that ADPN enhances the antioxidant capacity of the reproductive system. In contrast, decreased synthesis of ADPN leads to increased oxidative stress and inhibition of testicular function [40]. It has been previously confirmed that ADPN is expressed in goose ovaries and regulates steroid hormone secretion in GCs [24]. In chickens, the activation of ADPN was found to promote progesterone secretion and inhibit estrogen secretion in GCs, which further affects ovarian function [20]. ADPN also indirectly affects reproductive function in pigs by influencing the gonadal secretion of LH and FSH [41]. In addition, ADPN promotes the proliferation of GCs and regulates follicular growth and embryonic development in bovines, mice, and humans [18,42].
Although ADPN has been reported to regulate apoptosis and autophagy [20,21], its role in the regulation of oxidative stress and death in geese GCs is not well understood. In this study, ADPN was found to regulate oxidative stress and apoptosis in GCs. Overexpression of ADPN reduced ROS accumulation and increased resistance to apoptosis. Conversely, knockdown of ADPN expression had the opposite effect. It is this beneficial effect of ADPN that allows it to mitigate the effects of H2O2 on GCs. Knockdown of ADPN exacerbated the degree of oxidative stress and apoptosis in GCs caused by H2O2, while overexpression of ADPN alleviated these effects. These effects of ADPN may be mediated by binding to AdipoR1, as we detected an increase or decrease in the expression levels of AdipoR1 upon overexpression of ADPN and knockdown of ADPN.
Meanwhile, it has been found in both our research and the research of others [43,44,45] that ADPN can activate autophagy. Overexpression of ADPN can activate the autophagy of GCs and the knockdown of ADPN expression can inhibit it. In the model of oxidative stress in GCs, the knockdown of ADPN still inhibited autophagy, but overexpression of ADPN did not activate autophagy, and it reduced the expression of both LC3 and Beclin1 in GCs. This suggested that ADPN may play a role in the restoration of obstructed autophagic flux. Previous studies have reported the role of ADPN in regulating autophagic flux. For instance, ADPN activates autophagic flux to reduce endoplasmic reticulum stress and insulin resistance in skeletal muscle cells [46]. ADPN reduces insulin resistance induced by a high-fat diet and decreases oxidative stress by promoting autophagic flux in skeletal muscle cells [43]. Furthermore, ADPN was observed to restore the autophagic process and activate autophagic flux to protect hepatocytes from ethanol-induced apoptosis by regulating ATG5 expression through the AMPK/FoxO3A axis [47].
GO analysis showed that, in addition to inducing apoptosis in GCs, oxidative stress affects the cell cycle and differentiation of GCs, promoting inflammation and suppressing the immune response. GO analyses in the siRNA group were similar to those in the H2O2 group. Conversely, overexpression of ADPN lead to the enrichment of biological processes that benefit the growth of GCs, such as anti-apoptosis, regulation of hormone secretion, organ growth and maintenance of cell junctions. KEGG analysis showed that pathways, such as metabolism, PPAR, GnRH, VEGF, ECM-receptor interaction, ErbB, apoptosis, cell cycle, TGF-β and AGE-RAGE, etc., were enriched in response to overexpression of ADPN.
As previously mentioned, ADPN regulates glycolipid metabolism and modulates the secretion of reproductive hormones. Studies have reported that ADPN binds to its receptor and promotes fatty acid oxidation through the AMPK-PPAR pathway [48]. ADPN can regulate ovarian activities through autocrine/paracrine effects, and previous studies showed that ADPN modulates ovarian steroid hormone secretion in a variety of organisms (e.g., bovines, mice, pigs, etc.) [49]. In addition, the ADPN receptor agonist AdipoRon promotes the secretion of reproductive hormones and gonadal development through the hypothalamic-pituitary-gonadal (HPG) axis, and GnRH is an important regulator of the HPG axis [50]. Our aforementioned results suggest that oxidative stress and ADPN have a function in regulating apoptosis. Taken together, our unpublished results and other studies suggest that ADPN has a role in resisting cellular senescence [51,52]. Therefore, it is not surprising that metabolism, PPAR, GnRH, apoptosis and cell cycle pathways were enriched in response to its overexpression.
ErbB is a member of the EGFR family and it has been claimed that the EGF/EGFR pathway regulates GC and follicle development [53]. In addition, inhibition of ErbB induced apoptosis and oxidative stress, whereas overexpression of ErbB increased the expression of antioxidant enzymes and decreased ROS levels [54,55]. The ECM is involved in the regulation of ovarian physiological activities, and its interactions with the receptor are critical for ovarian development [56,57]. VEGF is closely associated with angiogenesis, and VGEF has also been found to regulate the activity and apoptosis of GCs in yak [58]. Luo et al. [59] also demonstrated that upregulation of VEGF expression resists apoptosis and oxidative stress through the Notch 1-Jagged 1 signaling pathway.
Based on the enriched GO terms and KEGG pathways, we focused on the TGF-β and AGE-RAGE pathways. The GO analysis in this study showed that FGF10 was involved in the regulation of apoptosis, cell cycle, DNA repair and other biological processes. FGF10 may increase cellular sensitivity by upregulating TGF-β expression and augmenting its regulatory effects on cells [60]. TGFβ was able to modulate oxidative stress. For example, knockdown of TGF-β1 and TGF-β2 increased the accumulation of ROS in retinal ganglion cells, and TGFβ1 also protected chondrocytes from oxidative stress [61,62]. Some previous studies also showed that TGF-β can regulate autophagy and cell apoptosis [63,64,65]. Furthermore, TGF-β can interact with EGFR and VEGF to regulate apoptosis. For instance, TGF-β can resist apoptosis by increasing the expression of EGFR ligands and reducing inflammation and promoting VEGF-dependent angiogenesis [66,67]. The AGE-RAGE pathway was reported to induce oxidative stress and apoptosis in a variety of cells [68,69]. AGE-RAGE can interact with TGF-β to regulate apoptosis, and RAGE deletion in RAGE knockout mice affected TGF-β responsiveness and enhanced anti-apoptotic capacity in kidneys [70]. The RNA-seq results demonstrate the role of oxidative stress and ADPN in regulating GCs. However, in this study, the limited laying cycle of geese and the existence of individual differences made it challenging to obtain a sufficient number of primary cell samples that could be used to fulfil the experimental requirements. Therefore, it is unclear how oxidative stress leads to the blockage of autophagic flux in GCs and the molecular mechanism by which ADPN regulates this process. These two scientific issues will be further explored in our future studies.

4. Materials and Methods

4.1. Ethics Statement

All experimental procedures in this study were approved by the animal welfare committee of the College of Animal Science and Veterinary Medicine of Shenyang Agricultural University (No. 202006006).

4.2. Animals and Sample Collection

Sixty 10-month-old laying geese were obtained from the Liaoyang Huoyan Goose Stock Breeding Farm in Liaoyang City, China. After anesthesia and sacrifice of the geese by exsanguination through the jugular vein, the ovaries were dissected using sterilized scissors and forceps. The ovaries were then washed in a Petri dish filled with normal saline on ice to distinguish between healthy and atretic follicles based on their external morphological characteristics, such as shape, color, elasticity and the presence of hemorrhagic spots on their surface. The follicles were classified into categories based on their size and stored at −80 °C for future use. Additionally, the follicles from each period were fixed in a 4% paraformaldehyde and glutaraldehyde fixative for subsequent Hematoxylin and Eosin (H and E) staining and transmission electron microscopy observation.

4.3. Hematoxylin and Eosin (H and E) Staining

The follicles were fixed in 4% paraformaldehyde for 72 h, rinsed under running water for 24 h, dehydrated using gradient ethanol, transferred to gradient xylene and embedded in paraffin. Sections of approximately 4 μm were cut, stained with hematoxylin and eosin and observed under a light microscope (Nikon Eclipse Ti-SR, Tokyo, Japan).

4.4. Measurement of SOD and MDA Content in Follicular Tissue

Commercially available kits were used to measure SOD (Elabscience, Wuhan, China, E-BC-K020-M) and MDA (Nanjing Jiancheng Bioengineering Institute, Nanjing, China, A003-1-2) levels in follicular tissue, following the manufacturer’s instructions.

4.5. Quantitative Real-Time PCR

Total RNA was extracted from follicular tissue and GC samples using TRIzol reagent (Vazyme, Nanjing, China, R411-01) according to the manufacturer’s instructions. RNA purity and concentration were detected by measuring the absorbance ratio at 260 nm and 280 nm (NanoDrop, Thermo Scientific, Waltham, MA, USA). The cDNA was synthesized according to the manufacturer’s instructions using the HiScript III 1st Strand cDNA Synthesis Kit with gDNA wiper (Vazyme, Nanjing, China, R312-02). The mRNA expression levels of related genes were quantified using Taq Pro Universal SYBR qPCR Master Mix (Vazyme, Nanjing, China, Q712-02). Each 20 μL reaction volume contained 10 μL 2 × Taq Pro Universal SYBR qPCR Master Mix, 1 μL cDNA template, 0.4 μL forward and reverse primer sand 8.2 μL ddH2O. The reaction procedure included pre-denaturation at 95 °C for 30 s, 40 cycles of denaturation at 94 °C for 10 s and specific annealing and extension at 60 °C for 30 s. The primers used for the RT-qPCR are listed in Table 1. The relative expression of the targeted gene was calculated using the 2−ΔΔCt method, and beta-actin was designated as an internal reference gene.

4.6. Western Blot

The follicular tissue was lysed on ice with RIPA Lysis Buffer (Beyotime, Shanghai, China, P0013B) and supplemented with a 1% protease inhibitor cocktail (Beyotime, Shanghai, China, P1005). Protein concentrations were determined using the BCA Protein Assay Kit (Beyotime Shanghai, China, P0012). Samples containing 50 μg protein were separated on 10–15% SDS-PAGE gels and subsequently electro-transferred onto a polyvinylidene difluoride (PVDF) membranes (Millipore, Darmstadt, France). The membranes were blocked with 5% non-fat milk for 1 h at room temperature. Subsequently, they were incubated overnight at 4 °C with anti-β-actin (1:8000, Immunoway, Plano, TX, USA, YT0099), anti-GAPDH (1:8000, Immunoway, Plano, TX, USA, YN5585), anti-Bax (1:1000, Proteintech, Chicago, IL, USA, 50599-2-Ig), anti-Bcl-2 (1:1000, Immunoway, Plano, TX, USA, YT0470), anti-ADPN (1:1000, Proteintech, Chicago, IL, USA, YT0091), anti-AdipoR1 (1:1500, Abmart, Shanghai, China, PK14733), anti-AdipoR2 (1:1000, Affintiy, OH, USA, DF12811), anti-microtubule-associated protein light chain 3B (LC3B) (1:2000, Abcam, Cambridge, UK, ab192890) or anti-Sequestosome 1 (p62/SQSTM1) (1:1000, Proteintech, Chicago, IL, USA, YT7058 ) primary antibodies. The membranes were washed three times with TBST for 10 min and then were incubated with a secondary horseradish peroxidase-conjugated antibody (1:8000, Proteintech, Chicago, IL, USA, PR30009) at 37 °C for 1 h. The membranes were visualized using a SuperPico ECL Chemiluminescence Kit (Vazyme, Nanjing, China, E422-01). The stained proteins were quantified densitometrically using ImageJ (v1.5.3s) software (National Institutes of Health, Bethesda, MD, USA).

4.7. Transmission Electron Microscopy (TEM)

The follicles were fixed in 2.5% glutaraldehyde for TEM and dehydrated in ethyl alcohol and acetone. They were then embedded in epoxy resin. Ultrathin sections, with a thickness of 50–70 nm, were cut using a diamond knife and double-stained with uranyl acetate and lead citrate. The ultra-microstructure of the samples was examined using a transmission electron microscope (HITACHI, Tokyo, Japan).

4.8. Cell Culture Identification and Transfection

Hierarchical follicles were collected, and GCs were isolated according to the method of Gilbert et al. [71], and digested and cultured according to the method of Kang et al. [72]. The GCs were cultured in an incubator at 38.5 °C with 5% CO2 until the cell fusion rate exceeded 80%. The M199 (Gibco, Carlsbad, CA, USA, 11150059) complete medium (with 15% FBS) was changed every 24 h. The identification of GCs was based on the expression of FSHR (Bioss, Beijing, China, bs-0895R), which is a specific marker for GCs. siRNA-ADPN sequences (Table 2) and pIRES2-EGFP-ADPN plasmids were designed and synthesized based on the goose ADPN gene sequence (NCBI Gene ID: 106040284). The pIRES2-EGFP plasmids were purchased from Bio-Transduction Lab Co., Ltd. (Wuhan, China) siRNA-NC, and siRNA-ADPN were synthesized by GenePharma (Suzhou, China). GCs were seeded into six-well plates and cultured for 24 h until 60% confluence. Cell transfection was performed according to Lipofectamine 3000 (Invitrogen, Carlsbad, CA, USA, L3000015) instructions.

4.9. Cell Viability Assay

GCs were seeded in 96-well plates until the cells grew to 90% confluency. Then, Cell Counting Kit-8 (CCK-8; Elabscience, Wuhan, China, E-CK-A362) was used to measure the cell viability following the manufacturer’s instructions.

4.10. ROS Staining Assay

ROS accumulation was measured using the fluorescent ROS probe dihydroethidium (DHE) (GLPBIO, Montclair, CA, USA, GD20803). After treatment, cells were washed three times with PBS, and 10 μmol/L DHE in non-phenol red medium was added to the wells. The cells were then incubated at 37 °C for 30 min, protected from light, and washed three times with PBS. Finally, they were observed under a fluorescence microscope (Leica DMI8, Wetzlar, Germany).

4.11. Immunofluorescence

Cells were plated on coverslips, fixed with 4% paraformaldehyde for 1 h, washed three times with PBS and permeabilized with 0.5% Triton X-100 for 20 min. They were then treated in PBS with 2% bovine serum albumin (BSA) for 1 h and incubated overnight at 4 °C with anti-Caspase-3 antibody (1:100; Proteintech, Chicago, IL, USA, 66470-1-lg) or anti-Beclin1 antibody (1:100; Proteintech, Chicago, IL, USA, 11306-1-ap) diluted in 2% BSA. Finally, the cells were washed with PBS and incubated with a FITC-conjugated secondary antibody for 1 h in the dark. After washing, the cells were stained in PBS with DAPI. Subsequently, they were observed under a fluorescent microscope (Leica DMI8, Wetzlar, Germany).

4.12. Flow Cytometry

GCs were digested with 0.25% trypsin and collected to produce a cell suspension, which was then washed three times with PBS. Flow cytometry was used to analyze apoptosis in the GCs using an Annexin V-Elab Fluor®647/PI Apoptosis Kit (Elabscience, Wuhan, China, E-CK-A213) according to the manufacturer’s instructions.

4.13. Enzyme-Linked Immunosorbent Assay (ELISA)

Commercially available ADPN ELISA kits were used to measure ADPN (Nanjing Jiancheng Bioengineering Institute, Nanjing, China, H179-1-2) levels in GCs and the culture supernatant of GCs, following the manufacturer’s instructions.

4.14. RNA Sequencing and Data Processing

The RNA sequencing was conducted by the APExBIO Chinese distributor (Shanghai, China). Briefly, the RNA of GCs was extracted and tested for concentration and purity. Subsequently, double-stranded cDNA was synthesized and the product was purified. The library was then constructed and sequenced after quality control. Following sequencing, quality assessment of the fastq files using FastQC (0.12.1) software was carried out to filter out low-quality data. HISAT2 (v2.0.4) software was used to compare the clean data with the goose reference genome sequence (GCF_002166845.1) to obtain the comparison reference genome. Transcript reconstruction was performed using StringTie (2.1.7) software, assembled to obtain accurate transcript results and the expression of each gene or transcript was counted. Differential expression analysis was performed using DESeq2 (R4.1.2), and finally, the relevant pathways were found via enrichment analysis (KEGG, GO). Genes with p ≤ 0.05 and |Fold Change| ≥ 1.5 were classified as differentially expressed genes.

4.15. Statistical Analysis

Data are presented as the mean ± SEM unless indicated otherwise. Data were analyzed using a t-test and analysis of variance (ANOVA) with GraphPad Prism version 5.0 (GraphPad Software, San Diego, CA, USA). p <0.05 was considered to indicate statistical significance.

5. Conclusions

The accumulation of ROS caused by oxidative stress can lead to apoptosis and the blockage of autophagic flux in GCs, resulting in follicular atresia. However, adiponectin (ADPN) protects GCs from oxidative stress and has anti-apoptotic and autophagy-regulating effects.

Author Contributions

Conceptualization, X.L. and Z.C.; methodology, X.L. and Z.C.; software, Q.W. and Y.Q.; validation, X.L. and Z.C.; formal analysis, Y.Z.; investigation, Y.Z., Q.W., M.G. and Y.Q.; resources, X.L. and Z.C; data curation, Y.Z., Y.Q. and M.G.; writing—original draft preparation, Y.Z.; writing—review and editing, X.L. and Z.C.; visualization, X.L. and Z.C.; supervision, X.L. and Z.C.; project administration, X.L. and Z.C.; funding acquisition, X.L. and Z.C. All authors have read and agreed to the published version of the manuscript.

Funding

This research was funded by the National Natural Science Foundation of China (32072810).

Institutional Review Board Statement

The animal study protocol was approved by the Animal Care and Use Committee of Shenyang Agricultural University (protocol code 202006006).

Data Availability Statement

The data used to support the findings of this study are available upon request from the corresponding author.

Acknowledgments

We appreciate the support of the Liaoyang Huoyan Goose Stock Breeding Farm in providing the experimental animals. We would also like to thank Shuo Han and Guangyi Ouyang for their help with this study.

Conflicts of Interest

The authors declare no conflicts of interest.

Abbreviations

P53, Tumor Protein 53; ATG5, Autophagy related gene 5; ATG7, Autophagy related gene 7; H2O2, Hydrogen peroxide, MCL1, myeloid cell leukemia-1; FGF10, Fibroblast Growth Factor 10; MAPK7, Mitogen-activated protein kinase; CAPN3, Calpain-3; CTSS. Cathepsin S; NFκBIA, Nuclear factor of kappa light polypeptide gene enhancer in B-cells inhibitor, alpha; CCR2, Chemokine C-C-Motif Receptor 2; CCR7, Chemokine C-C-Motif Receptor 7; SRF, Serum Response Factor; PAK1, p21 (CDKN1A)-activated kinase 1; MAP3K9, Mitogen-activated protein kinase 9; ESRRβ, Estrogen related receptor β; HOXC9, Homeobox C9; CRK, Cysteine receptor-like kinase; ACOD1, Aconitate decarboxylase 1; ADRA2B, Adrenoceptor alpha 2B; APC, Adenomatous polyposis coli; SMARCC2, SWI/SNF related, matrix associated, actin dependent regulator of chromatin, subfamily c, member 2; PLK2, Polo-like kinase 2; PCNA, Proliferating Cell Nuclear Antigen; CDKN2B, Cyclin dependent kinase inhibitor 2B; AGTR1, Angiotensin II receptor type 1; TGFβ3. Transforming growth factor β 3; AGAP2, ArfGAP with GTPase domain, ankyrin repeat and PH domain 2; GPX2, Glutathione peroxidase 2; GLUL, glutamate-ammonia ligase; CASR, Calcium sensing receptor; TENM4, Teneurin transmembrane protein 4; F2R, Coagulation factor II thrombin receptor; HUS1, HUS1 checkpoint homolog; TTK, Threonine tyrosine kinase; CALR, calreticulin; MEF2C, Myocyte enhancer factor 2C; DHX58, DEXH (Asp-Glu-X-His) box polypeptide 58; NRG1, NeuReGulin 1; COL1A1, Collagen Type Ⅰ Alpha 1; AKAP6, A kinase (PRKA) anchor protein 6; PAX4, Paired box 4; GDNF, Glial cell line-derived growth factor; GnRH, Gonadotropin-releasing hormone; KRAS, Kirsten ratsarcoma viral oncogene homolog; ITPR3, inositol 1,4,5-triphosphate receptor, type 3; SV2C, Synaptic vesicle glycoprotein 2C; COL2A1, Collagen Type Ⅱ Alpha 1; CDKN1A, Cyclin dependent kinase inhibitor 1A; STAT2, Signal transducer and activator of transcription 2; ME1, Malic enzyme 1; VEGF, Vascular endothelial growth factor; PLA2G4F, Phospholipase A2, group IVF; ECM, Extracellular Matrix; ErbB, Epidermal growth factor receptor; AGE, Advanced Glycation Endproducts; RAGE, the Receptor of Advanced Glycation Endproducts; PPAR, Peroxisome proliferator-activated receptor; CPT1B, Carnitine palmitoyltransferase 1B; SP1, Sp1 transcription factor; BCKDHA, Branched chain ketoacid dehydrogenase E1, alpha polypeptide; ARG2, Arginase 2; CA8, Carbonic anhydrase 8.

References

  1. Renema, R.A.; Robinson, F.E.; Proudman, J.A.; Newcombe, M.; McKay, R.I. Effects of body weight and feed allocation during sexual maturation in broiler breeder hens. 2. Ovarian morphology and plasma hormone profiles. Poult. Sci. 1999, 78, 629–639. [Google Scholar] [CrossRef] [PubMed]
  2. Lovell, T.M.; Gladwell, R.T.; Groome, N.P.; Knight, P.G. Ovarian follicle development in the laying hen is accompanied by divergent changes in inhibin A, inhibin B, activin A and follistatin production in granulosa and theca layers. J. Endocrinol. 2003, 177, 45–55. [Google Scholar] [CrossRef] [PubMed]
  3. Onagbesan, O.; Bruggeman, V.; Decuypere, E. Intra-ovarian growth factors regulating ovarian function in avian species: A review. Anim. Reprod. Sci. 2009, 111, 121–140. [Google Scholar] [CrossRef] [PubMed]
  4. Zhang, H.; Liu, K. Seeing is believing: No adult oogenesis in mammals. Cell Cycle (Georget. Tex.) 2015, 14, 935–936. [Google Scholar] [CrossRef] [PubMed]
  5. Tilly, J.L.; Kowalski, K.I.; Johnson, A.L.; Hsueh, A.J. Involvement of apoptosis in ovarian follicular atresia and postovulatory regression. Endocrinology 1991, 129, 2799–2801. [Google Scholar] [CrossRef] [PubMed]
  6. Eppig, J.J. Oocyte control of ovarian follicular development and function in mammals. Reproduction 2001, 122, 829–838. [Google Scholar] [CrossRef] [PubMed]
  7. Chaube, S.; Shrivastav, T.; Prasad, S.; Tiwari, M.; Tripathi, A.; Pandey, A.N.; Premkumar, V. Clomiphene Citrate Induces ROS-Mediated Apoptosis in Mammalian Oocytes. Open J. Apoptosis 2014, 3, 33006. [Google Scholar] [CrossRef]
  8. Wang, Z.; Lu, L.; Gu, T.; Hou, L.; Du, L.; Zhang, Y.; Zhang, Y.; Xu, Q.; Chen, G. The effects of FAR1 and TGFBRAP1 on the proliferation and apoptosis of follicular granulosa cells in goose (Anser cygnoides). Gene 2021, 769, 145194. [Google Scholar] [CrossRef] [PubMed]
  9. Shen, M.; Cao, Y.; Jiang, Y.; Wei, Y.; Liu, H. Melatonin protects mouse granulosa cells against oxidative damage by inhibiting FOXO1-mediated autophagy: Implication of an antioxidation-independent mechanism. Redox Biol. 2018, 18, 138–157. [Google Scholar] [CrossRef] [PubMed]
  10. Lou, Y.; Yu, W.; Han, L.; Yang, S.; Wang, Y.; Ren, T.; Yu, J.; Zhao, A. ROS activates autophagy in follicular granulosa cells via mTOR pathway to regulate broodiness in goose. Anim. Reprod. Sci. 2017, 185, 97–103. [Google Scholar] [CrossRef] [PubMed]
  11. Al-Gubory, K.H.; Fowler, P.A.; Garrel, C. The roles of cellular reactive oxygen species, oxidative stress and antioxidants in pregnancy outcomes. Int. J. Biochem. Cell Biol. 2010, 42, 1634–1650. [Google Scholar] [CrossRef] [PubMed]
  12. Kannan, K.; Jain, S.K. Oxidative stress and apoptosis. Pathophysiol. Off. J. Int. Soc. Pathophysiol. 2000, 7, 153–163. [Google Scholar] [CrossRef]
  13. Yamamoto, H.; Zhang, S.; Mizushima, N. Autophagy genes in biology and disease. Nat. Rev. Genet. 2023, 24, 382–400. [Google Scholar] [CrossRef] [PubMed]
  14. Kang, B.; Wang, X.; Xu, Q.; Wu, Y.; Si, X.; Jiang, D. Effect of 3-nitropropionic acid inducing oxidative stress and apoptosis of granulosa cells in geese. Biosci. Rep. 2018, 38, BSR20180274. [Google Scholar] [CrossRef] [PubMed]
  15. Hou, L.; Gu, T.; Weng, K.; Zhang, Y.; Zhang, Y.; Chen, G.; Xu, Q. Effects of Oxidative Stress on the Autophagy and Apoptosis of Granulosa Cells in Broody Geese. Int. J. Mol. Sci. 2023, 24, 2154. [Google Scholar] [CrossRef] [PubMed]
  16. Díez, J.J.; Iglesias, P. The role of the novel adipocyte-derived hormone adiponectin in human disease. Eur. J. Endocrinol. 2003, 148, 293–300. [Google Scholar] [CrossRef] [PubMed]
  17. Chappaz, E.; Albornoz, M.S.; Campos, D.; Che, L.; Palin, M.F.; Murphy, B.D.; Bordignon, V. Adiponectin enhances in vitro development of swine embryos. Domest. Anim. Endocrinol. 2008, 35, 198–207. [Google Scholar] [CrossRef] [PubMed]
  18. Richards, J.S.; Liu, Z.; Kawai, T.; Tabata, K.; Watanabe, H.; Suresh, D.; Kuo, F.T.; Pisarska, M.D.; Shimada, M. Adiponectin and its receptors modulate granulosa cell and cumulus cell functions, fertility, and early embryo development in the mouse and human. Fertil. Steril. 2012, 98, 471–479.e471. [Google Scholar] [CrossRef] [PubMed]
  19. Li, J.; Ma, X.J.; Wu, X.; Si, S.J.; Li, C.; Yang, P.K.; Li, G.X.; Liu, X.J.; Tian, Y.D.; Kang, X.T. Adiponectin modulates steroid hormone secretion, granulosa cell proliferation and apoptosis via binding its receptors during hens’ high laying period. Poult. Sci. 2021, 100, 101197. [Google Scholar] [CrossRef] [PubMed]
  20. Wang, B.; Guo, H.; Li, X.; Yue, L.; Liu, H.; Zhao, L.; Bai, H.; Liu, X.; Wu, X.; Qu, Y. Adiponectin Attenuates Oxygen-Glucose Deprivation-Induced Mitochondrial Oxidative Injury and Apoptosis in Hippocampal HT22 Cells via the JAK2/STAT3 Pathway. Cell Transplant. 2018, 27, 1731–1743. [Google Scholar] [CrossRef] [PubMed]
  21. Hu, J.; Cui, W.; Ding, W.; Gu, Y.; Wang, Z.; Fan, W. Globular Adiponectin Attenuated H2O2-Induced Apoptosis in Rat Chondrocytes by Inducing Autophagy Through the AMPK/ mTOR Pathway. Cell. Physiol. Biochem. Int. J. Exp. Cell. Physiol. Biochem. Pharmacol. 2017, 43, 367–382. [Google Scholar] [CrossRef] [PubMed]
  22. Pierre, P.; Froment, P.; Nègre, D.; Ramé, C.; Barateau, V.; Chabrolle, C.; Lecomte, P.; Dupont, J. Role of adiponectin receptors, AdipoR1 and AdipoR2, in the steroidogenesis of the human granulosa tumor cell line, KGN. Hum. Reprod. 2009, 24, 2890–2901. [Google Scholar] [CrossRef] [PubMed]
  23. Liu, Z.; Rudd, M.D.; Hernandez-Gonzalez, I.; Gonzalez-Robayna, I.; Fan, H.Y.; Zeleznik, A.J.; Richards, J.S. FSH and FOXO1 regulate genes in the sterol/steroid and lipid biosynthetic pathways in granulosa cells. Mol. Endocrinol. 2009, 23, 649–661. [Google Scholar] [CrossRef] [PubMed]
  24. Meng, B.; Cao, Z.; Gai, Y.; Liu, M.; Gao, M.; Chen, M.; Ning, Z.; Luan, X. Effects of recombinant goose adiponectin on steroid hormone secretion in Huoyan geese ovarian granulosa cells. Anim. Reprod. Sci. 2019, 205, 34–43. [Google Scholar] [CrossRef] [PubMed]
  25. Xu, X.; Mu, L.; Li, L.; Liang, J.; Zhang, S.; Jia, L.; Yang, X.; Dai, Y.; Zhang, J.; Wang, Y.; et al. Imaging and tracing the pattern of adult ovarian angiogenesis implies a strategy against female reproductive aging. Sci. Adv. 2022, 8, eabi8683. [Google Scholar] [CrossRef] [PubMed]
  26. Gump, J.M.; Thorburn, A. Autophagy and apoptosis: What is the connection? Trends Cell Biol. 2011, 21, 387–392. [Google Scholar] [CrossRef] [PubMed]
  27. Shen, M.; Lin, F.; Zhang, J.; Tang, Y.; Chen, W.K.; Liu, H. Involvement of the up-regulated FoxO1 expression in follicular granulosa cell apoptosis induced by oxidative stress. J. Biol. Chem. 2012, 287, 25727–25740. [Google Scholar] [CrossRef] [PubMed]
  28. Matsuda-Minehata, F.; Inoue, N.; Goto, Y.; Manabe, N. The regulation of ovarian granulosa cell death by pro- and anti-apoptotic molecules. J. Reprod. Dev. 2006, 52, 695–705. [Google Scholar] [CrossRef] [PubMed]
  29. Manabe, N.; Kimura, Y.; Uchio, K.; Tajima, C.; Matsushita, H.; Nakayama, M.; Sugimoto, M.; Miyamoto, H. Regulatory Mechanisms of Granulosa Cell Apoptosis in Ovarian Follicle Atresia. In Animal Cell Technology: Challenges for the 21st Century: Proceedings of the Joint International Meeting of the Japanese Association for Animal Cell Technology (JAACT) and the European Society for Animal Cell Technology (ESACT) 1998, Kyoto, Japan; Ikura, K., Nagao, M., Masuda, S., Sasaki, R., Eds.; Springer: Dordrecht, The Netherlands, 2002; pp. 343–347. [Google Scholar] [CrossRef]
  30. Han, S.; Wang, J.; Cui, C.; Yu, C.; Zhang, Y.; Li, D.; Ma, M.; Du, H.; Jiang, X.; Zhu, Q.; et al. Fibromodulin is involved in autophagy and apoptosis of granulosa cells affecting the follicular atresia in chicken. Poult. Sci. 2022, 101, 101524. [Google Scholar] [CrossRef]
  31. Zhang, J.Q.; Ren, Q.L.; Chen, J.F.; Gao, B.W.; Wang, X.W.; Zhang, Z.J.; Wang, J.; Xu, Z.J.; Xing, B.S. Autophagy Contributes to Oxidative Stress-Induced Apoptosis in Porcine Granulosa Cells. Reprod. Sci. 2021, 28, 2147–2160. [Google Scholar] [CrossRef]
  32. Glick, D.; Barth, S.; Macleod, K.F. Autophagy: Cellular and molecular mechanisms. J. Pathol. 2010, 221, 3–12. [Google Scholar] [CrossRef] [PubMed]
  33. Bjørkøy, G.; Lamark, T.; Brech, A.; Outzen, H.; Perander, M.; Overvatn, A.; Stenmark, H.; Johansen, T. p62/SQSTM1 forms protein aggregates degraded by autophagy and has a protective effect on huntingtin-induced cell death. J. Cell Biol. 2005, 171, 603–614. [Google Scholar] [CrossRef] [PubMed]
  34. Shao, T.; Ke, H.; Liu, R.; Xu, L.; Han, S.; Zhang, X.; Dang, Y.; Jiao, X.; Li, W.; Chen, Z.J.; et al. Autophagy regulates differentiation of ovarian granulosa cells through degradation of WT1. Autophagy 2022, 18, 1864–1878. [Google Scholar] [CrossRef] [PubMed]
  35. Kusminski, C.M.; McTernan, P.G.; Schraw, T.; Kos, K.; O’Hare, J.P.; Ahima, R.; Kumar, S.; Scherer, P.E. Adiponectin complexes in human cerebrospinal fluid: Distinct complex distribution from serum. Diabetologia 2007, 50, 634–642. [Google Scholar] [CrossRef] [PubMed]
  36. Fruebis, J.; Tsao, T.S.; Javorschi, S.; Ebbets-Reed, D.; Erickson, M.R.; Yen, F.T.; Bihain, B.E.; Lodish, H.F. Proteolytic cleavage product of 30-kDa adipocyte complement-related protein increases fatty acid oxidation in muscle and causes weight loss in mice. Proc. Natl. Acad. Sci. USA 2001, 98, 2005–2010. [Google Scholar] [CrossRef] [PubMed]
  37. Nikanfar, S.; Oghbaei, H.; Rastgar Rezaei, Y.; Zarezadeh, R.; Jafari-Gharabaghlou, D.; Nejabati, H.R.; Bahrami, Z.; Bleisinger, N.; Samadi, N.; Fattahi, A.; et al. Role of adipokines in the ovarian function: Oogenesis and steroidogenesis. J. Steroid Biochem. Mol. Biol. 2021, 209, 105852. [Google Scholar] [CrossRef] [PubMed]
  38. Choubey, M.; Ranjan, A.; Bora, P.S.; Baltazar, F.; Krishna, A. Direct actions of adiponectin on changes in reproductive, metabolic, and anti-oxidative enzymes status in the testis of adult mice. Gen. Comp. Endocrinol. 2019, 279, 1–11. [Google Scholar] [CrossRef] [PubMed]
  39. Luti, S.; Fiaschi, T.; Magherini, F.; Modesti, P.A.; Piomboni, P.; Semplici, B.; Morgante, G.; Amoresano, A.; Illiano, A.; Pinto, G.; et al. Follicular microenvironment: Oxidative stress and adiponectin correlated with steroids hormones in women undergoing in vitro fertilization. Mol. Reprod. Dev. 2021, 88, 175–184. [Google Scholar] [CrossRef] [PubMed]
  40. Choubey, M.; Ranjan, A.; Bora, P.S.; Baltazar, F.; Martin, L.J.; Krishna, A. Role of adiponectin as a modulator of testicular function during aging in mice. Biochim. Biophys. Acta. Mol. Basis Dis. 2019, 1865, 413–427. [Google Scholar] [CrossRef] [PubMed]
  41. Kiezun, M.; Smolinska, N.; Maleszka, A.; Dobrzyn, K.; Szeszko, K.; Kaminski, T. Adiponectin expression in the porcine pituitary during the estrous cycle and its effect on LH and FSH secretion. Am. J. Physiology. Endocrinol. Metab. 2014, 307, E1038–E1046. [Google Scholar] [CrossRef]
  42. Maillard, V.; Uzbekova, S.; Guignot, F.; Perreau, C.; Ramé, C.; Coyral-Castel, S.; Dupont, J. Effect of adiponectin on bovine granulosa cell steroidogenesis, oocyte maturation and embryo development. Reprod. Biol. Endocrinol. 2010, 8, 23. [Google Scholar] [CrossRef] [PubMed]
  43. Liu, Y.; Palanivel, R.; Rai, E.; Park, M.; Gabor, T.V.; Scheid, M.P.; Xu, A.; Sweeney, G. Adiponectin stimulates autophagy and reduces oxidative stress to enhance insulin sensitivity during high-fat diet feeding in mice. Diabetes 2015, 64, 36–48. [Google Scholar] [CrossRef] [PubMed]
  44. Oh, H.J.; Lee, S.; Park, P.H. ER stress contributes to autophagy induction by adiponectin in macrophages: Implication in cell survival and suppression of inflammatory response. Cytokine 2020, 127, 154959. [Google Scholar] [CrossRef] [PubMed]
  45. Kim, M.J.; Kim, E.H.; Pun, N.T.; Chang, J.H.; Kim, J.A.; Jeong, J.H.; Choi, D.Y.; Kim, S.H.; Park, P.H. Globular Adiponectin Inhibits Lipopolysaccharide-Primed Inflammasomes Activation in Macrophages via Autophagy Induction: The Critical Role of AMPK Signaling. Int. J. Mol. Sci. 2017, 18, 1275. [Google Scholar] [CrossRef] [PubMed]
  46. Ahlstrom, P.; Rai, E.; Chakma, S.; Cho, H.H.; Rengasamy, P.; Sweeney, G. Adiponectin improves insulin sensitivity via activation of autophagic flux. J. Mol. Endocrinol. 2017, 59, 339–350. [Google Scholar] [CrossRef]
  47. Nepal, S.; Kim, M.J.; Lee, E.S.; Kim, J.A.; Choi, D.Y.; Sohn, D.H.; Lee, S.H.; Song, K.; Kim, S.H.; Jeong, G.S.; et al. Modulation of Atg5 expression by globular adiponectin contributes to autophagy flux and suppression of ethanol-induced cell death in liver cells. Food Chem. Toxicol. Int. J. Publ. Br. Ind. Biol. Res. Assoc. 2014, 68, 11–22. [Google Scholar] [CrossRef] [PubMed]
  48. Yoon, M.J.; Lee, G.Y.; Chung, J.J.; Ahn, Y.H.; Hong, S.H.; Kim, J.B. Adiponectin increases fatty acid oxidation in skeletal muscle cells by sequential activation of AMP-activated protein kinase, p38 mitogen-activated protein kinase, and peroxisome proliferator-activated receptor alpha. Diabetes 2006, 55, 2562–2570. [Google Scholar] [CrossRef] [PubMed]
  49. Singh, A.; Choubey, M.; Bora, P.; Krishna, A. Adiponectin and Chemerin: Contrary Adipokines in Regulating Reproduction and Metabolic Disorders. Reprod. Sci. 2018, 25, 1462–1473. [Google Scholar] [CrossRef] [PubMed]
  50. Li, C.; Cao, Y.; Ren, Y.; Zhao, Y.; Wu, X.; Si, S.; Li, J.; Li, Q.; Zhang, N.; Li, D.; et al. The adiponectin receptor agonist, AdipoRon, promotes reproductive hormone secretion and gonadal development via the hypothalamic-pituitary-gonadal axis in chickens. Poult. Sci. 2023, 102, 102319. [Google Scholar] [CrossRef] [PubMed]
  51. Cui, X.J.; Lin, X.; Zhong, J.Y.; Li, S.; He, J.Y.; Ni, Y.Q.; Zhan, J.K.; Liu, Y.S. Adiponectin attenuates the premature senescence of vascular smooth muscle cells induced by high glucose through mTOR signaling pathway. Aging Med. 2020, 3, 178–187. [Google Scholar] [CrossRef] [PubMed]
  52. Lee, K.E.; Nho, Y.H.; Yun, S.K.; Park, S.M.; Kang, S.; Yeo, H. Caviar Extract and Its Constituent DHA Inhibits UVB-Irradiated Skin Aging by Inducing Adiponectin Production. Int. J. Mol. Sci. 2020, 21, 3383. [Google Scholar] [CrossRef] [PubMed]
  53. Wang, C.; Sun, H.; Davis, J.S.; Wang, X.; Huo, L.; Sun, N.; Huang, Q.; Lv, X.; Wang, C.; He, C.; et al. FHL2 deficiency impairs follicular development and fertility by attenuating EGF/EGFR/YAP signaling in ovarian granulosa cells. Cell Death Dis. 2023, 14, 239. [Google Scholar] [CrossRef]
  54. Dogan, I.; Cumaoglu, A.; Aricioglu, A.; Ekmekci, A. Inhibition of ErbB2 by herceptin reduces viability and survival, induces apoptosis and oxidative stress in Calu-3 cell line. Mol. Cell. Biochem. 2011, 347, 41–51. [Google Scholar] [CrossRef] [PubMed]
  55. Belmonte, F.; Das, S.; Sysa-Shah, P.; Sivakumaran, V.; Stanley, B.; Guo, X.; Paolocci, N.; Aon, M.A.; Nagane, M.; Kuppusamy, P.; et al. ErbB2 overexpression upregulates antioxidant enzymes, reduces basal levels of reactive oxygen species, and protects against doxorubicin cardiotoxicity. Am. J. Physiology. Heart Circ. Physiol. 2015, 309, H1271–H1280. [Google Scholar] [CrossRef] [PubMed]
  56. Zhao, Y.; Feng, H.; Zhang, Y.; Zhang, J.V.; Wang, X.; Liu, D.; Wang, T.; Li, R.H.W.; Ng, E.H.Y.; Yeung, W.S.B.; et al. Current Understandings of Core Pathways for the Activation of Mammalian Primordial Follicles. Cells 2021, 10, 1491. [Google Scholar] [CrossRef] [PubMed]
  57. Kulus, J.; Kulus, M.; Kranc, W.; Jopek, K.; Zdun, M.; Józkowiak, M.; Jaśkowski, J.M.; Piotrowska-Kempisty, H.; Bukowska, D.; Antosik, P.; et al. Transcriptomic Profile of New Gene Markers Encoding Proteins Responsible for Structure of Porcine Ovarian Granulosa Cells. Biology 2021, 10, 1214. [Google Scholar] [CrossRef] [PubMed]
  58. Wu, J.F.; Liu, Y.; Gong, S.N.; Zi, X.D.; Tan, Y.G. Effects of vascular endothelial growth factor (VEGF) on the viability, apoptosis and steroidogenesis of yak (Bos grunniens) granulosa cells. Theriogenology 2023, 207, 1–10. [Google Scholar] [CrossRef] [PubMed]
  59. Luo, G.; Wang, R.; Zhou, H.; Liu, X. ALDOA protects cardiomyocytes against H/R-induced apoptosis and oxidative stress by regulating the VEGF/Notch 1/Jagged 1 pathway. Mol. Cell. Biochem. 2021, 476, 775–783. [Google Scholar] [CrossRef] [PubMed]
  60. Abolhassani, A.; Riazi, G.H.; Azizi, E.; Amanpour, S.; Muhammadnejad, S.; Haddadi, M.; Zekri, A.; Shirkoohi, R. FGF10: Type III Epithelial Mesenchymal Transition and Invasion in Breast Cancer Cell Lines. J. Cancer 2014, 5, 537–547. [Google Scholar] [CrossRef] [PubMed]
  61. Chen, H.Y.; Ho, Y.J.; Chou, H.C.; Liao, E.C.; Tsai, Y.T.; Wei, Y.S.; Lin, L.H.; Lin, M.W.; Wang, Y.S.; Ko, M.L.; et al. TGF-β1 signaling protects retinal ganglion cells from oxidative stress via modulation of the HO-1/Nrf2 pathway. Chem.-Biol. Interact. 2020, 331, 109249. [Google Scholar] [CrossRef] [PubMed]
  62. Kurakazu, I.; Akasaki, Y.; Tsushima, H.; Sueishi, T.; Toya, M.; Kuwahara, M.; Uchida, T.; Lotz, M.K.; Nakashima, Y. TGFβ1 signaling protects chondrocytes against oxidative stress via FOXO1-autophagy axis. Osteoarthr. Cartil. 2021, 29, 1600–1613. [Google Scholar] [CrossRef] [PubMed]
  63. Fu, M.Y.; He, Y.J.; Lv, X.; Liu, Z.H.; Shen, Y.; Ye, G.R.; Deng, Y.M.; Shu, J.C. Transforming growth factor-β1 reduces apoptosis via autophagy activation in hepatic stellate cells. Mol. Med. Rep. 2014, 10, 1282–1288. [Google Scholar] [CrossRef] [PubMed]
  64. He, Y.; Liu, H.; Jiang, L.; Rui, B.; Mei, J.; Xiao, H. miR-26 Induces Apoptosis and Inhibits Autophagy in Non-small Cell Lung Cancer Cells by Suppressing TGF-β1-JNK Signaling Pathway. Front. Pharmacol. 2018, 9, 1509. [Google Scholar] [CrossRef] [PubMed]
  65. Zhang, Y.; Tang, H.; Yuan, X.; Ran, Q.; Wang, X.; Song, Q.; Zhang, L.; Qiu, Y.; Wang, X. TGF-β3 Promotes MUC5AC Hyper-Expression by Modulating Autophagy Pathway in Airway Epithelium. EBioMedicine 2018, 33, 242–252. [Google Scholar] [CrossRef] [PubMed]
  66. Del Castillo, G.; Murillo, M.M.; Alvarez-Barrientos, A.; Bertran, E.; Fernández, M.; Sánchez, A.; Fabregat, I. Autocrine production of TGF-beta confers resistance to apoptosis after an epithelial-mesenchymal transition process in hepatocytes: Role of EGF receptor ligands. Exp. Cell Res. 2006, 312, 2860–2871. [Google Scholar] [CrossRef] [PubMed]
  67. Luo, H.; Zhang, Y.; Zhang, Z.; Jin, Y. The protection of MSCs from apoptosis in nerve regeneration by TGFβ1 through reducing inflammation and promoting VEGF-dependent angiogenesis. Biomaterials 2012, 33, 4277–4287. [Google Scholar] [CrossRef] [PubMed]
  68. Wang, X.L.; Yu, T.; Yan, Q.C.; Wang, W.; Meng, N.; Li, X.J.; Luo, Y.H. AGEs Promote Oxidative Stress and Induce Apoptosis in Retinal Pigmented Epithelium Cells RAGE-dependently. J. Mol. Neurosci. MN 2015, 56, 449–460. [Google Scholar] [CrossRef] [PubMed]
  69. Waghela, B.N.; Vaidya, F.U.; Ranjan, K.; Chhipa, A.S.; Tiwari, B.S.; Pathak, C. AGE-RAGE synergy influences programmed cell death signaling to promote cancer. Mol. Cell. Biochem. 2021, 476, 585–598. [Google Scholar] [CrossRef] [PubMed]
  70. Hagiwara, S.; Sourris, K.; Ziemann, M.; Tieqiao, W.; Mohan, M.; McClelland, A.D.; Brennan, E.; Forbes, J.; Coughlan, M.; Harcourt, B.; et al. RAGE Deletion Confers Renoprotection by Reducing Responsiveness to Transforming Growth Factor-β and Increasing Resistance to Apoptosis. Diabetes 2018, 67, 960–973. [Google Scholar] [CrossRef] [PubMed]
  71. Gilbert, A.B.; Evans, A.J.; Perry, M.M.; Davidson, M.H. A method for separating the granulosa cells, the basal lamina and the theca of the preovulatory ovarian follicle of the domestic fowl (Gallus domesticus). J. Reprod. Fertil. 1977, 50, 179–181. [Google Scholar] [CrossRef] [PubMed]
  72. Kang, B.; Jiang, D.; He, H.; Ma, R.; Chen, Z.; Yi, Z. Effect of Oaz1 overexpression on goose ovarian granulosa cells. Amino Acids 2017, 49, 1123–1132. [Google Scholar] [CrossRef] [PubMed]
Figure 1. Morphological and histological characteristics of follicles at various stages in geese. (A) Follicles at different stages of development and atretic follicles. Hierarchical follicles are arranged in ascending order of size. Follicles 1–2 mm in diameter are SWFs, those 2–5 mm are LWFs, those 5–10 mm are SYFs, and pre-hierarchical follicles > 10 mm in diameter are LYFs. (B) H and E staining showing histological features of each membrane layer of the follicle. AF represents an atretic follicle. Scale bar = 50 μm.
Ijms 25 05400 g001
Figure 2. Oxidative stress levels were measured in various follicles. (A) SOD activity. (B) MDA content. The letters above each bar indicate the significance of the differences. Differences with the same letter were not considered significant, while those with different letters were considered significant (p < 0.05). The values in the bars with vertical lines represent the mean ± SEM, which are the same as in the following figures.
Ijms 25 05400 g002
Figure 3. The level of apoptosis in goose follicles at different stages. (A) The mRNA expression of P53, Caspase-3, Bax and Bcl-2. (BD) The protein expression of Bax and Bcl-2 with β-actin as an internal control. (E) The ratio of Bcl-2 to Bax protein expression. Different letters were considered significant (p < 0.05).
Ijms 25 05400 g003
Figure 4. The level of autophagy in goose follicles at different stages. (A) The submicroscopic structure of an atretic follicle. The lysed nucleus is indicated by the red arrowheads, while the cristae-vanishing mitochondria encapsulated by autophagosomes are indicated by the blue arrowheads. The yellow arrowheads indicate cristae-vanishing mitochondria. The scale bars from left to right are 2.0 μm, 500 nm and 1.0 μm, respectively. (B) The mRNA expression of ATG5, ATG7, Beclin 1, P62 and LC3. (CF) The protein expression of P62, LC3-I and LC3-II normalized to that of β-actin. (G) The ratio of LC3-II to LC3-I protein expression. Different letters were considered significant (p < 0.05).
Ijms 25 05400 g004aIjms 25 05400 g004b
Figure 5. The expression of ADPN in goose follicles at different stages. (A) The mRNA expression of ADPN. (B,C) The protein expression of ADPN. Different letters were considered significant (p < 0.05).
Ijms 25 05400 g005
Figure 6. Cultivation and identification of GCs and establishment of an in vitro oxidative stress model. (A) GCs isolated and cultured from goose follicles; GC images are shown under 100× magnification. (B) The expression of the follicle stimulating hormone receptor (FSHR) in GCs determined via immunofluorescence; scale bar = 100 μm. (C) Viability of GCs as examined via CCK8 assay. (D) Observation of morphological changes in GCs using live cell imaging; scale bar = 200 μm. (E) ROS determination using the dihydroethidium (DHE) probe; scale bar = 100 μm. Different letters were considered significant (p < 0.05).
Ijms 25 05400 g006
Figure 7. Oxidative stress conditions induce apoptosis and autophagy in GCs. (A) The expression levels of P53, Caspase-3, Bax and Bcl-2 were measured. (B) Apoptosis in GCs determined via Hoechst33342/PI double staining; scale bar = 100 μm. (C) The expression of Caspase-3 protein detected using immunofluorescence; scale bar = 20 μm. (D) Apoptosis rate of GCs determined via flow cytometry. Apoptosis rate (%) = (number of cells in Quadrant 2 + Quadrant 3)/total number of cells × 100%. (E) The expression of ATG5, ATG7, Beclin 1, P62 and LC3. (F) The expression of Beclin 1 protein detected using immunofluorescence; scale bar = 20 μm. Different letters were considered significant (p < 0.05).
Ijms 25 05400 g007aIjms 25 05400 g007b
Figure 8. ADPN regulates the production of ROS and influences the generation of ROS induced by H2O2. (A) Expression of ADPN mRNA after siRNA-mediated ADPN knockdown and overexpression plasmid-mediated ADPN overexpression. (B) ADPN secretion in culture supernatants of GCs after ADPN knockdown and overexpression. (C) Effect of ADPN knockdown and overexpression on ROS production in GCs; scale bar = 100 μm. Different letters were considered significant (p < 0.05).
Ijms 25 05400 g008
Figure 9. Effects of ADPN knockdown and overexpression on mRNA expression of apoptosis-related genes in GCs. (A) RT-qPCR analysis of P53 gene expression. (B) RT-qPCR analysis of Caspase-3 gene expression. (C) RT-qPCR analysis of Bax gene expression. (D) RT-qPCR analysis of Bcl-2 gene expression. (E) The ratio of Bcl-2 to Bax mRNA expression. Different letters were considered significant (p < 0.05).
Ijms 25 05400 g009
Figure 10. The role of ADPN knockdown and overexpression apoptosis of GCs. (A) Apoptosis in GCs determined using Hoechst33342/PI staining; scale bar = 100 μm. (B) The expression of Caspase-3 protein detected using immunofluorescence; scale bar = 20 μm. (C,D) Flow cytometry was used to track apoptosis and calculate the apoptosis rate. Different letters were considered significant (p < 0.05).
Ijms 25 05400 g010aIjms 25 05400 g010bIjms 25 05400 g010c
Figure 11. Effects of ADPN knockdown and overexpression on mRNA expression of autophagy-related genes in GCs. (A) RT-qPCR analysis of ATG5 gene expression. (B) RT-qPCR analysis of ATG7 gene expression. (C) RT-qPCR analysis of Beclin 1 gene expression. (D) RT-qPCR analysis of P62 gene expression. (E) RT-qPCR analysis of LC3 gene expression. (F) The expression of Beclin 1 protein detected using immunofluorescence; scale bar = 20 μm. Different letters were considered significant (p < 0.05).
Ijms 25 05400 g011aIjms 25 05400 g011b
Figure 12. Effects of ADPN overexpression and knockdown on AdipoR1 and AdipoR2 expression levels in GCs. (A) RT-qPCR analysis of AdipoR1 mRNA expression. (B) RT-qPCR analysis of AdipoR2 mRNA expression. (C) The protein expression of AdipoR1 and AdipoR2. Different letters were considered significant (p < 0.05).
Ijms 25 05400 g012
Figure 13. DEGs and GO enrichment in each group of GCs. (A) Volcano plot showing DEGs (p < 0.05, |FoldChange| ≥ 1.5). (B) GO function enrichment of DEGs between control and H2O2 groups. (C) GO function enrichment of DEGs between NC and siADPN groups. (D) GO function enrichment of DEGs between vector and ADPN O/E groups. (E) GO function enrichment of DEGs between H2O2 and siADPN + H2O2 groups. (F) GO function enrichment of DEGs between H2O2 and ADPN O/E + H2O2 groups.
Ijms 25 05400 g013aIjms 25 05400 g013bIjms 25 05400 g013c
Figure 14. KEGG enrichment in each group of GCs. (A) KEGG pathways enrichment of DEGs between control and H2O2 groups. (B) KEGG pathway enrichment of DEGs between NC and siADPN groups. (C) KEGG pathway enrichment of DEGs between vector and ADPN O/E groups. (D) KEGG pathway enrichment of DEGs between H2O2 and siADPN + H2O2 groups. (E) KEGG pathway enrichment of DEGs between H2O2 and ADPN O/E + H2O2 groups.
Ijms 25 05400 g014aIjms 25 05400 g014bIjms 25 05400 g014c
Table 1. Primer sequences of quantitative real-time PCR.
GenesSequences (5′→3′)Accession No.Size (bp)
ADPNFP: AACGAGCAGAACCACTAC
RP: CGCCTTGTCCTTCTTGTA
KP993199132
AdipoR1FP: AAGTTGGATTATTCAGGAA
RP: AATGGAGAGGTAGATGAG
KP993200108
AdipoR2FP: ATACTGAACAAGGCCACTATTT
RP: CACCTGAATGCCTTACTCTC
KP993201123
p53FP: AGGAGGAGAACTTCCGCAAGAGG
RP: CGTCGTTGATCTCCTTCAGCATCTC
XM_038171819.197
Caspase-3FP: AGTGGACCAGATGAAATGAC
RP: AGACTGAATAAACCAGGAGC
XM_013179825126
BaxFP: CTTCTCGGGTTTCTTGAGG
RP: AACGCAGCAGGTGTAGGA
KY788660200
Bcl-2FP: TGACCGAGTACCTGAACCG
RP: GCTCCCACCAGAACCAAA
XM_013187395154
ATG5FP: GATGAAATAACTGAAAGGGAAGC
RP: TGAAGATCAAAGAGCAAACCAA
NM_001006409.1124
ATG7FP: CGACCAGTATGAACGAGA
RP: CTGATGTAATAAAGTTAGACCC
XM_048046141100
Beclin1FP: GCACGCCCTCGCTAACA
RP: GCAGTCCAAGAAAGCCACC
XM_048051864184
p62FP: GGTGGTGGGTGCTAGATTCAAGTG
RP: TGTGCTCCTTGTGGATGCCTTTAC
XM_048057319.189
LC3BFP: TGCTAACCAAGCCTTCTTCCTC
RP: TCCTGCGAGGCATAAACCAT
NM_001364358129
β-actinFP: ATTGTCCACCGCAAATGCTTC
RP: AAATAAAGCCATGCCAATCTCGTC
M26111113
Table 2. Primer sequences for quantitative real-time PCR.
NameSequences (5′-3′)
siRNA-ADPNFP: GGGACAACAACGGUGUCUATT
RP: UAGACACCGUUGUUGUCCCTT
siRNA-NCFP: UUCUCCGAACGUGUCACGUTT
RP: ACGUGACACGUUCGGAGAATT
Disclaimer/Publisher’s Note: The statements, opinions and data contained in all publications are solely those of the individual author(s) and contributor(s) and not of MDPI and/or the editor(s). MDPI and/or the editor(s) disclaim responsibility for any injury to people or property resulting from any ideas, methods, instructions or products referred to in the content.

