
Exploring Seaweed and Glycine Betaine Biostimulants for Enhanced Phenolic Content, Antioxidant Properties, and Gene Expression of Vitis vinifera cv. “Touriga Franca” Berries

 ,
,  , , ,
, , ,  ,
,  and
and 
Abstract
1. Introduction
2. Results
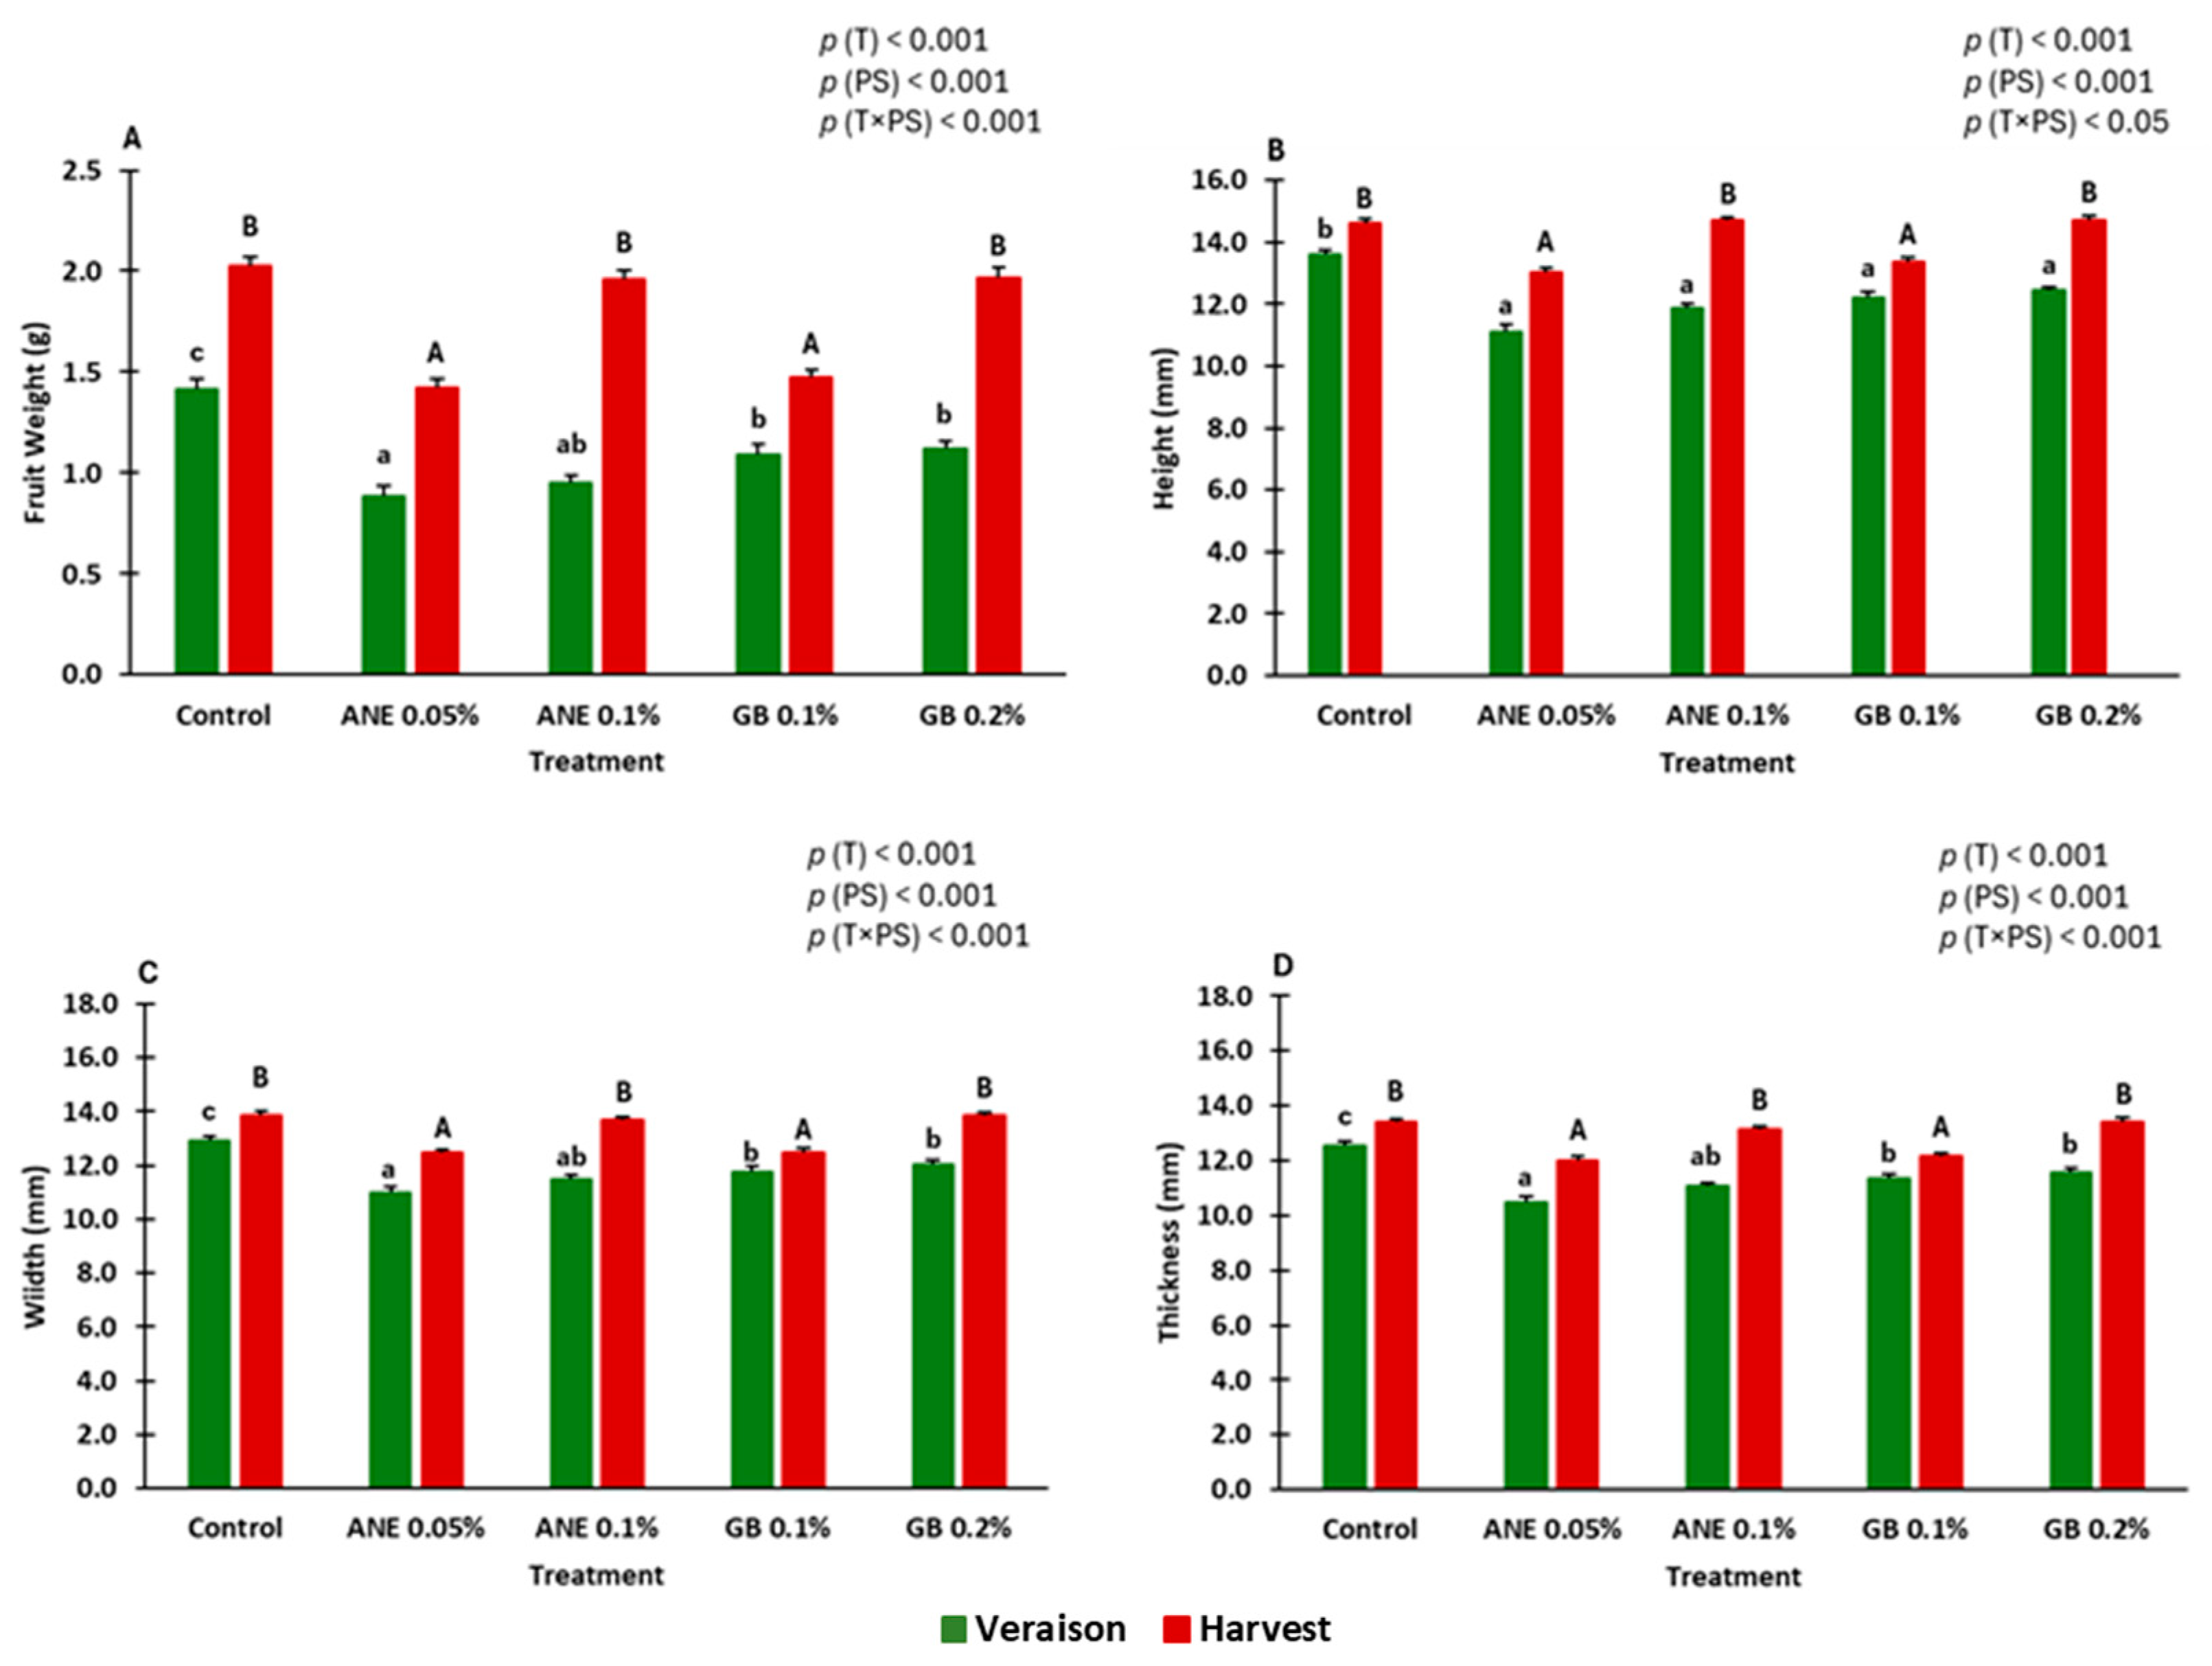
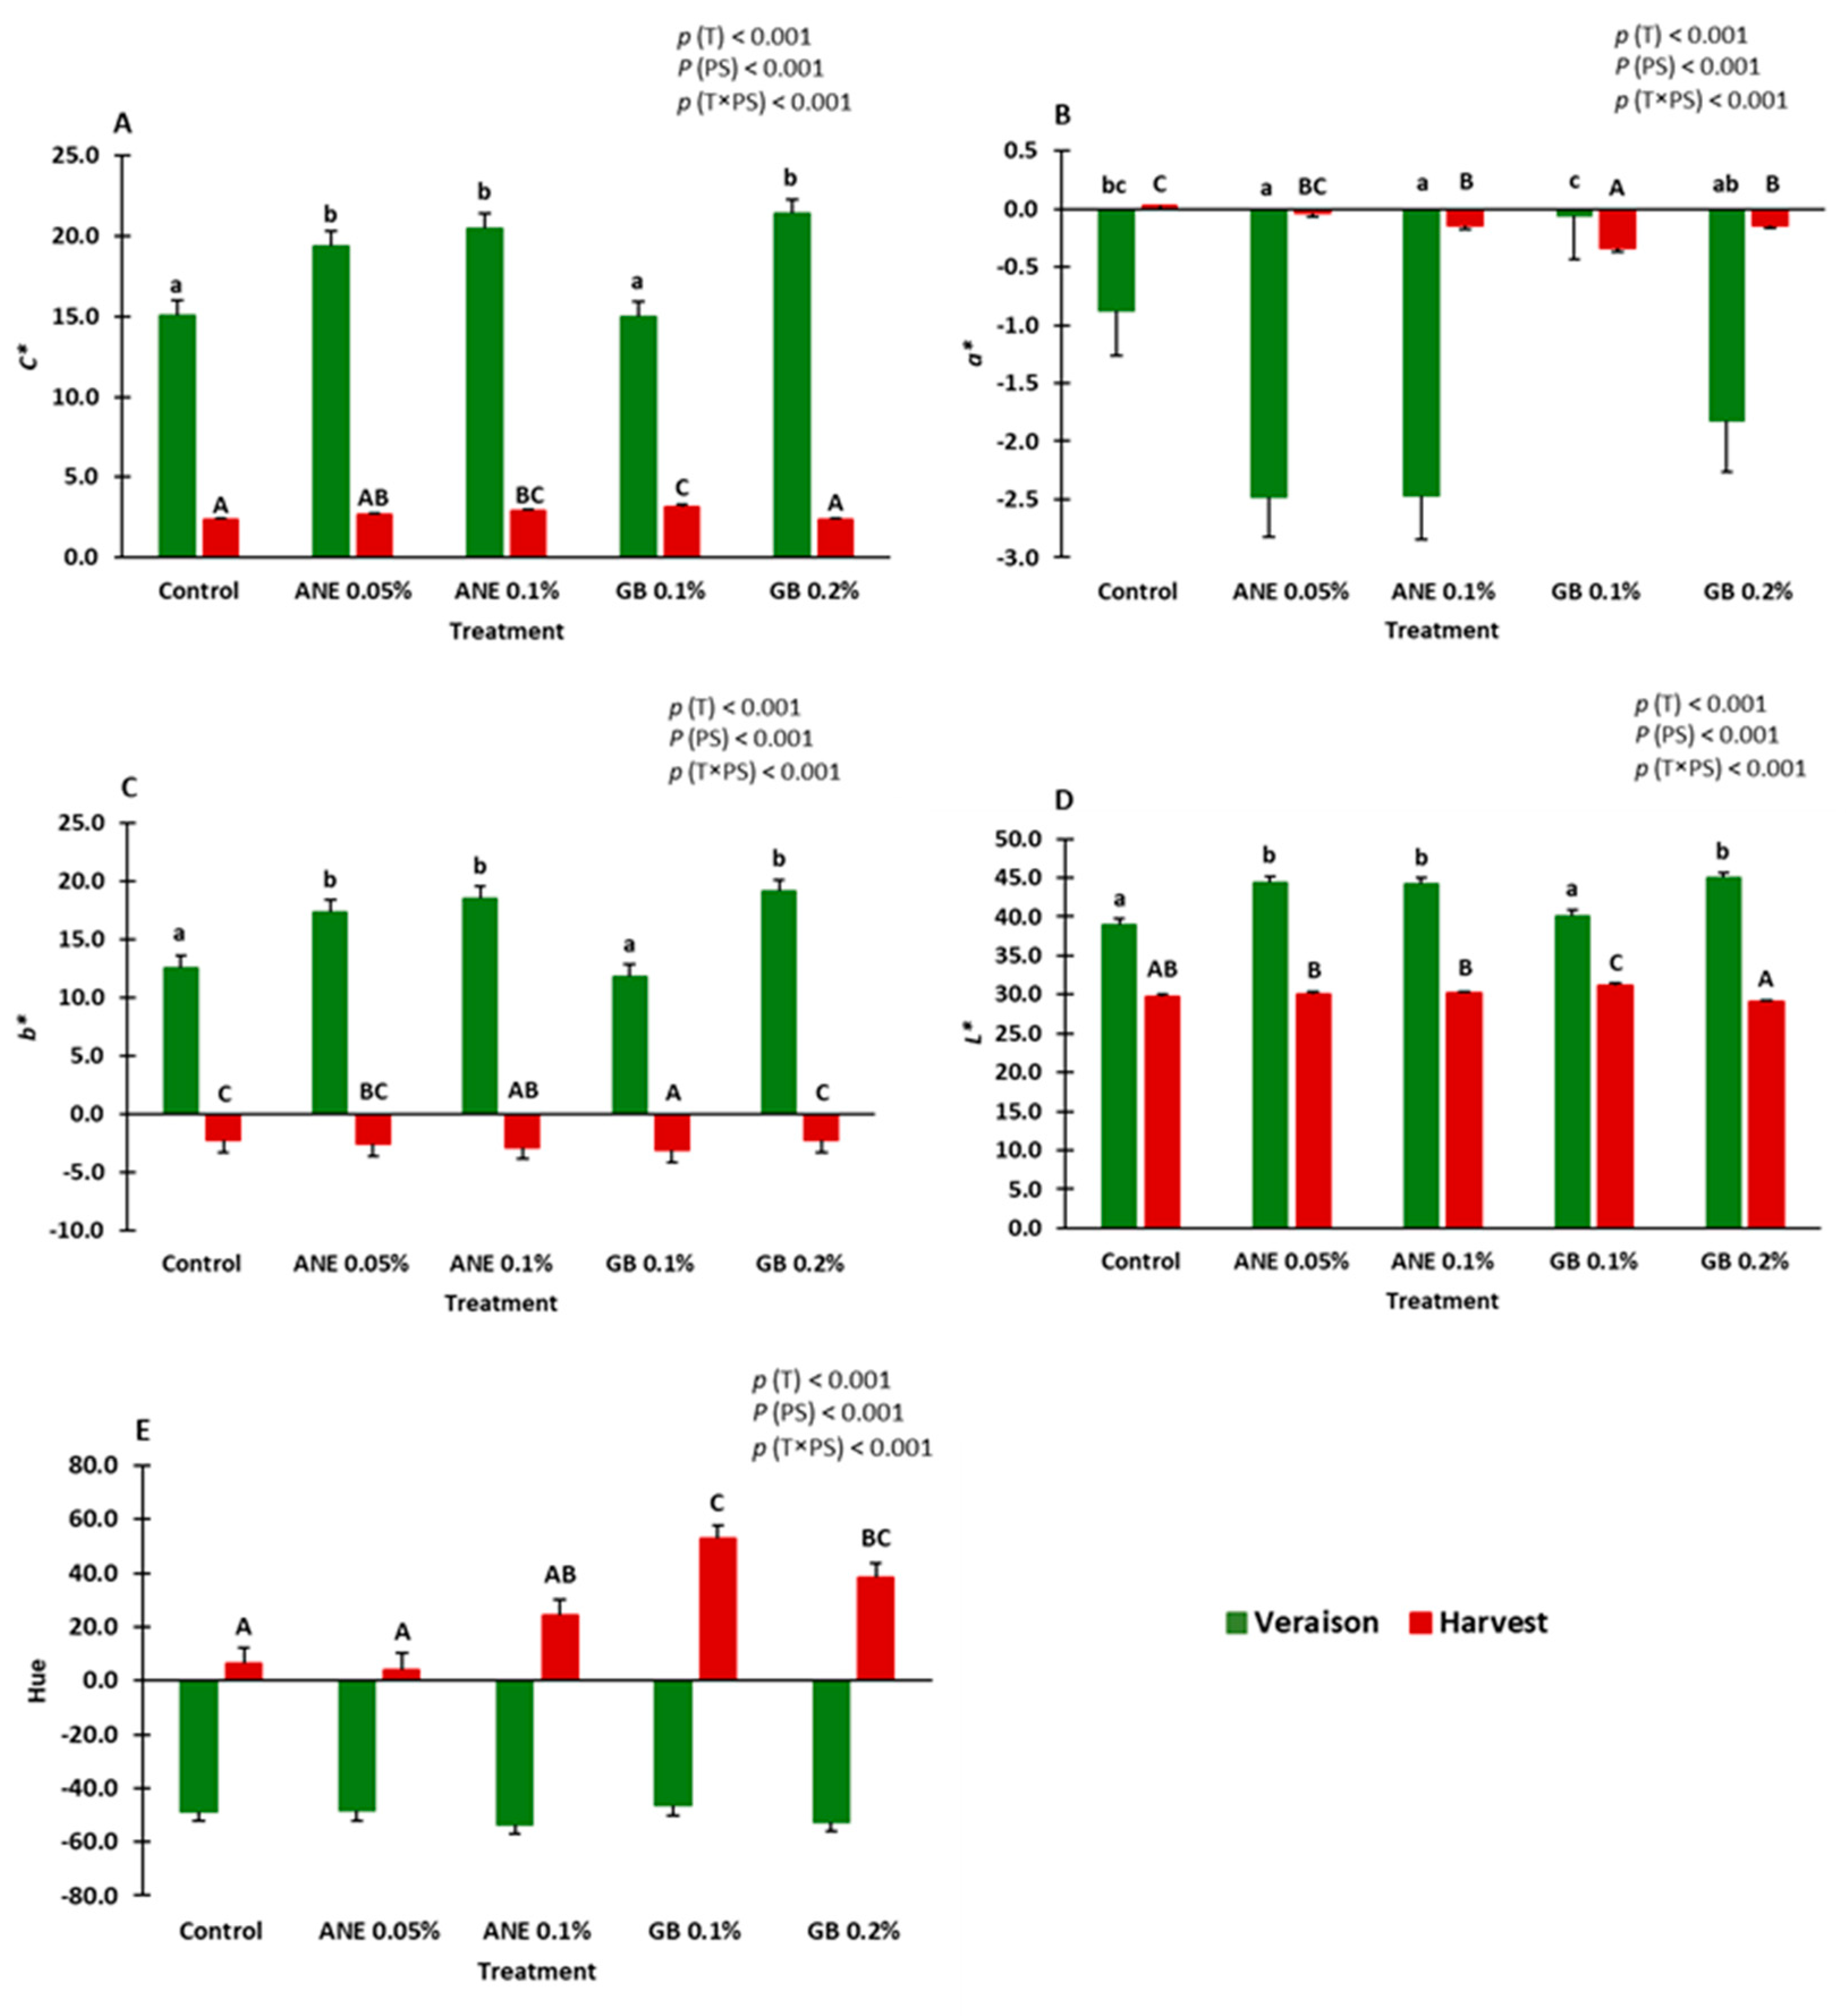
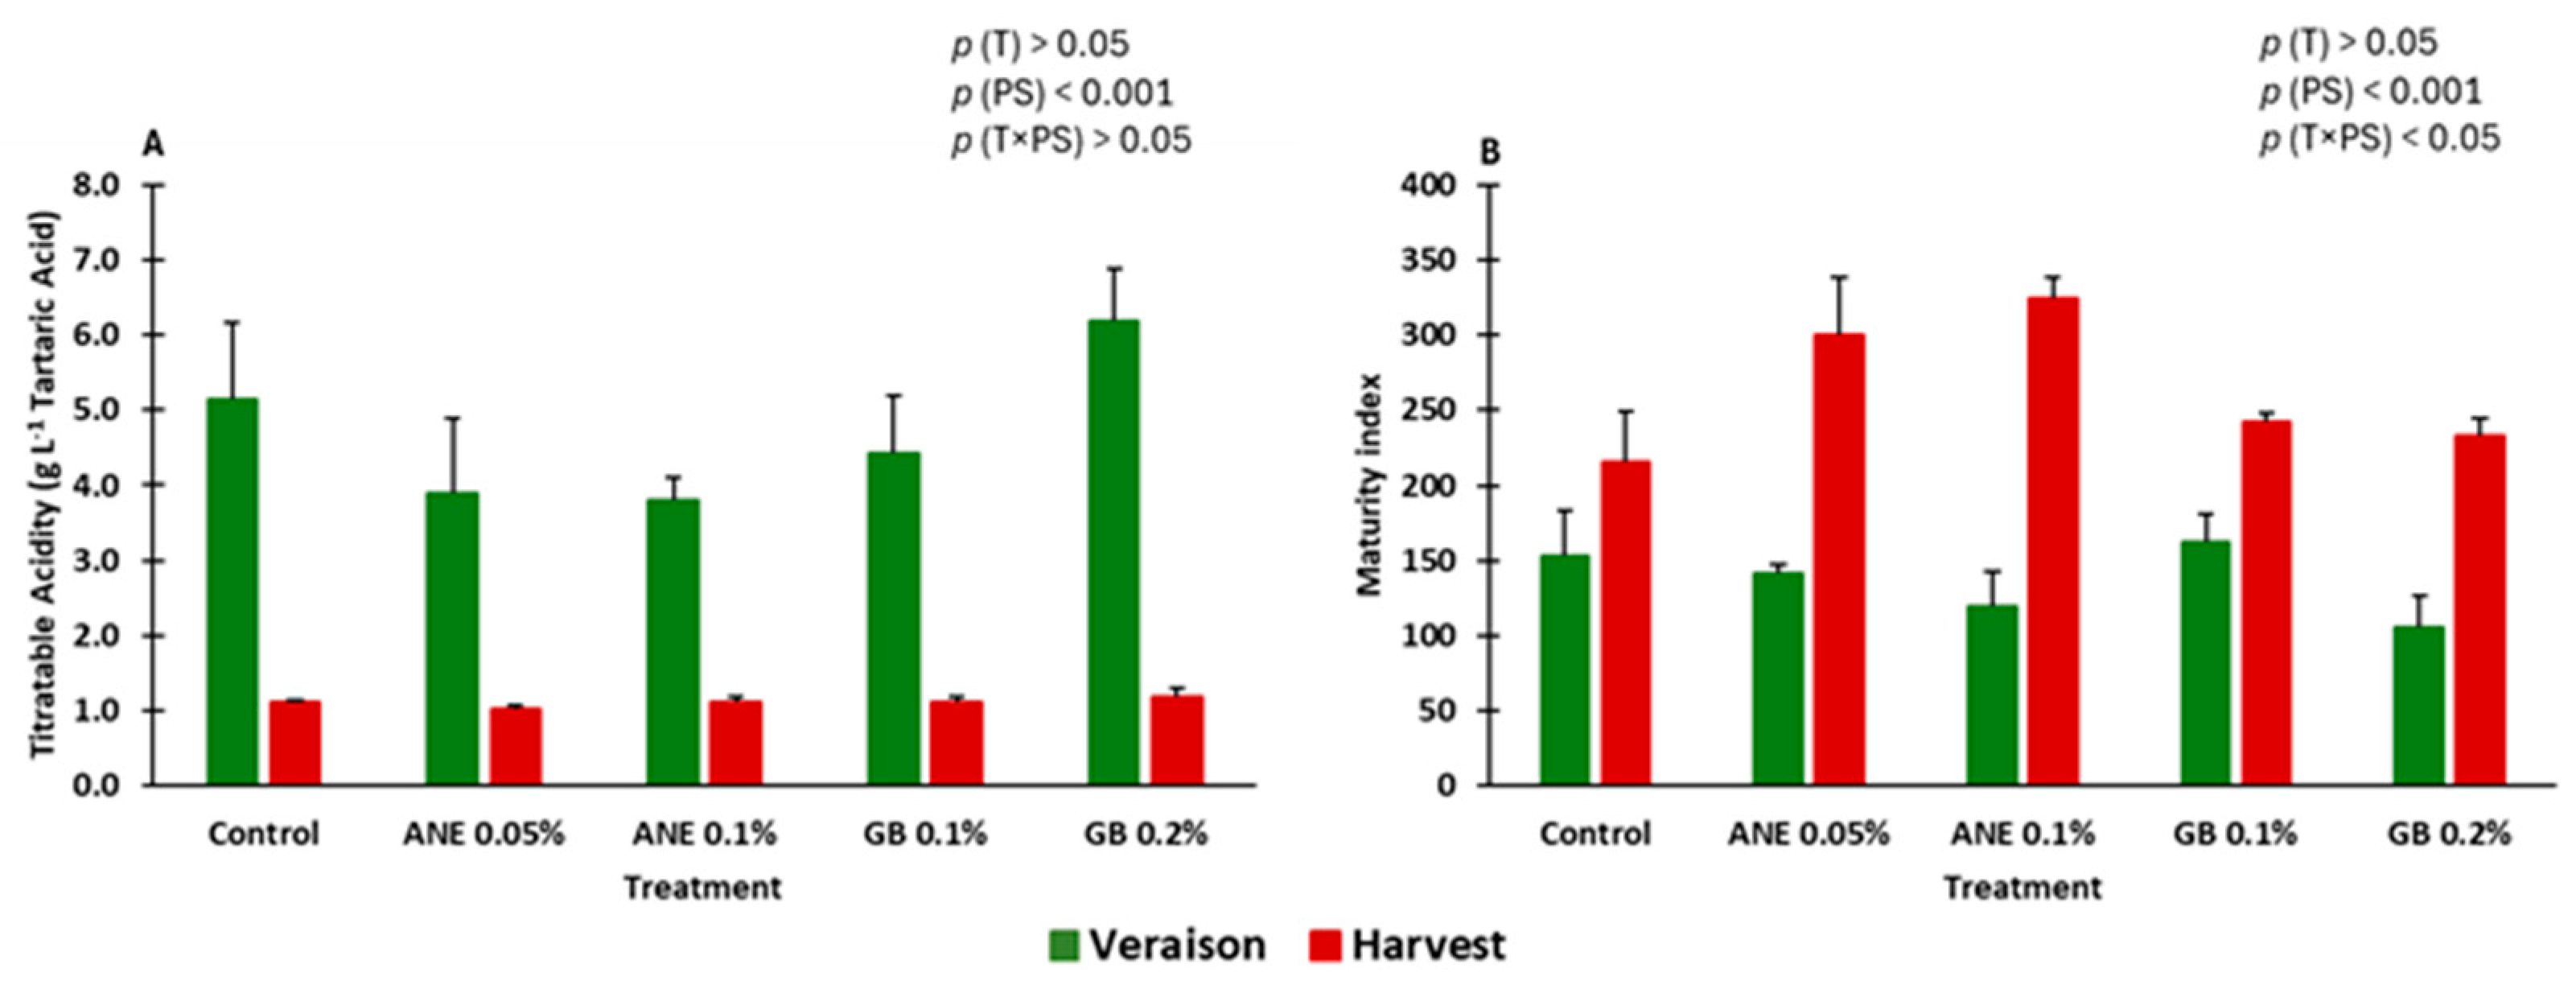
2.1. Berry Quality
2.2. Phenolic Compounds
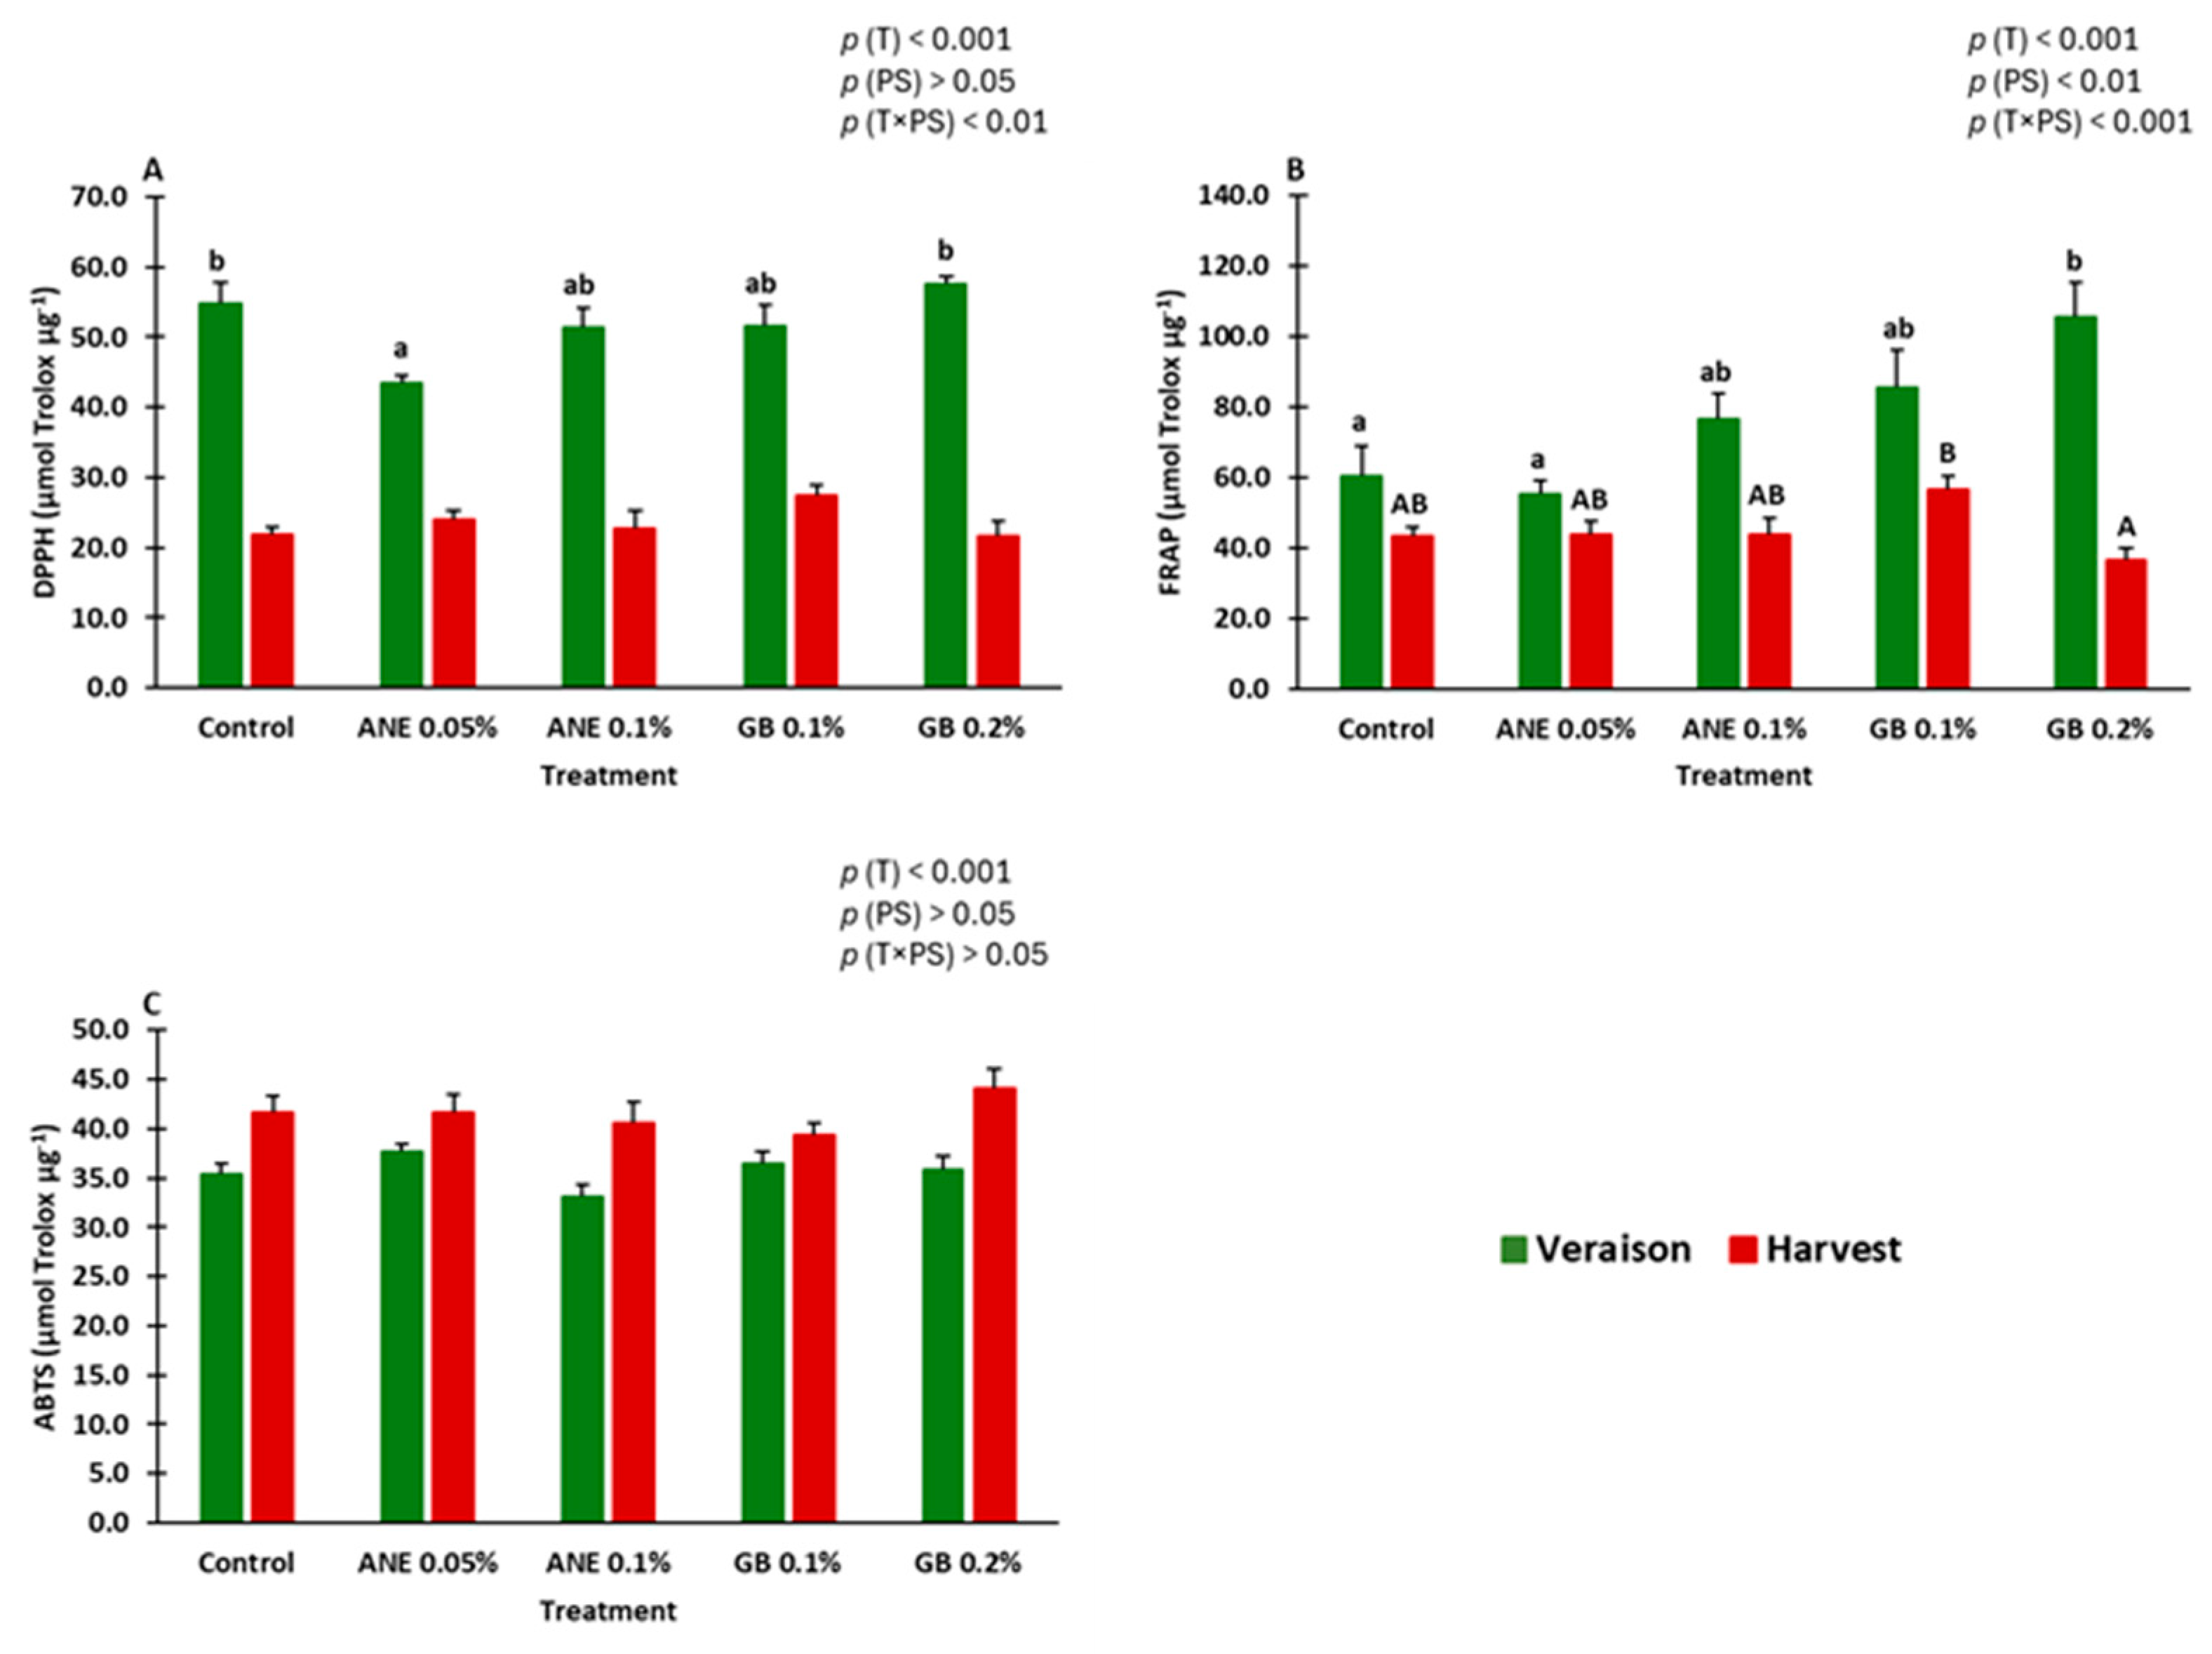
2.3. Antioxidant Potential
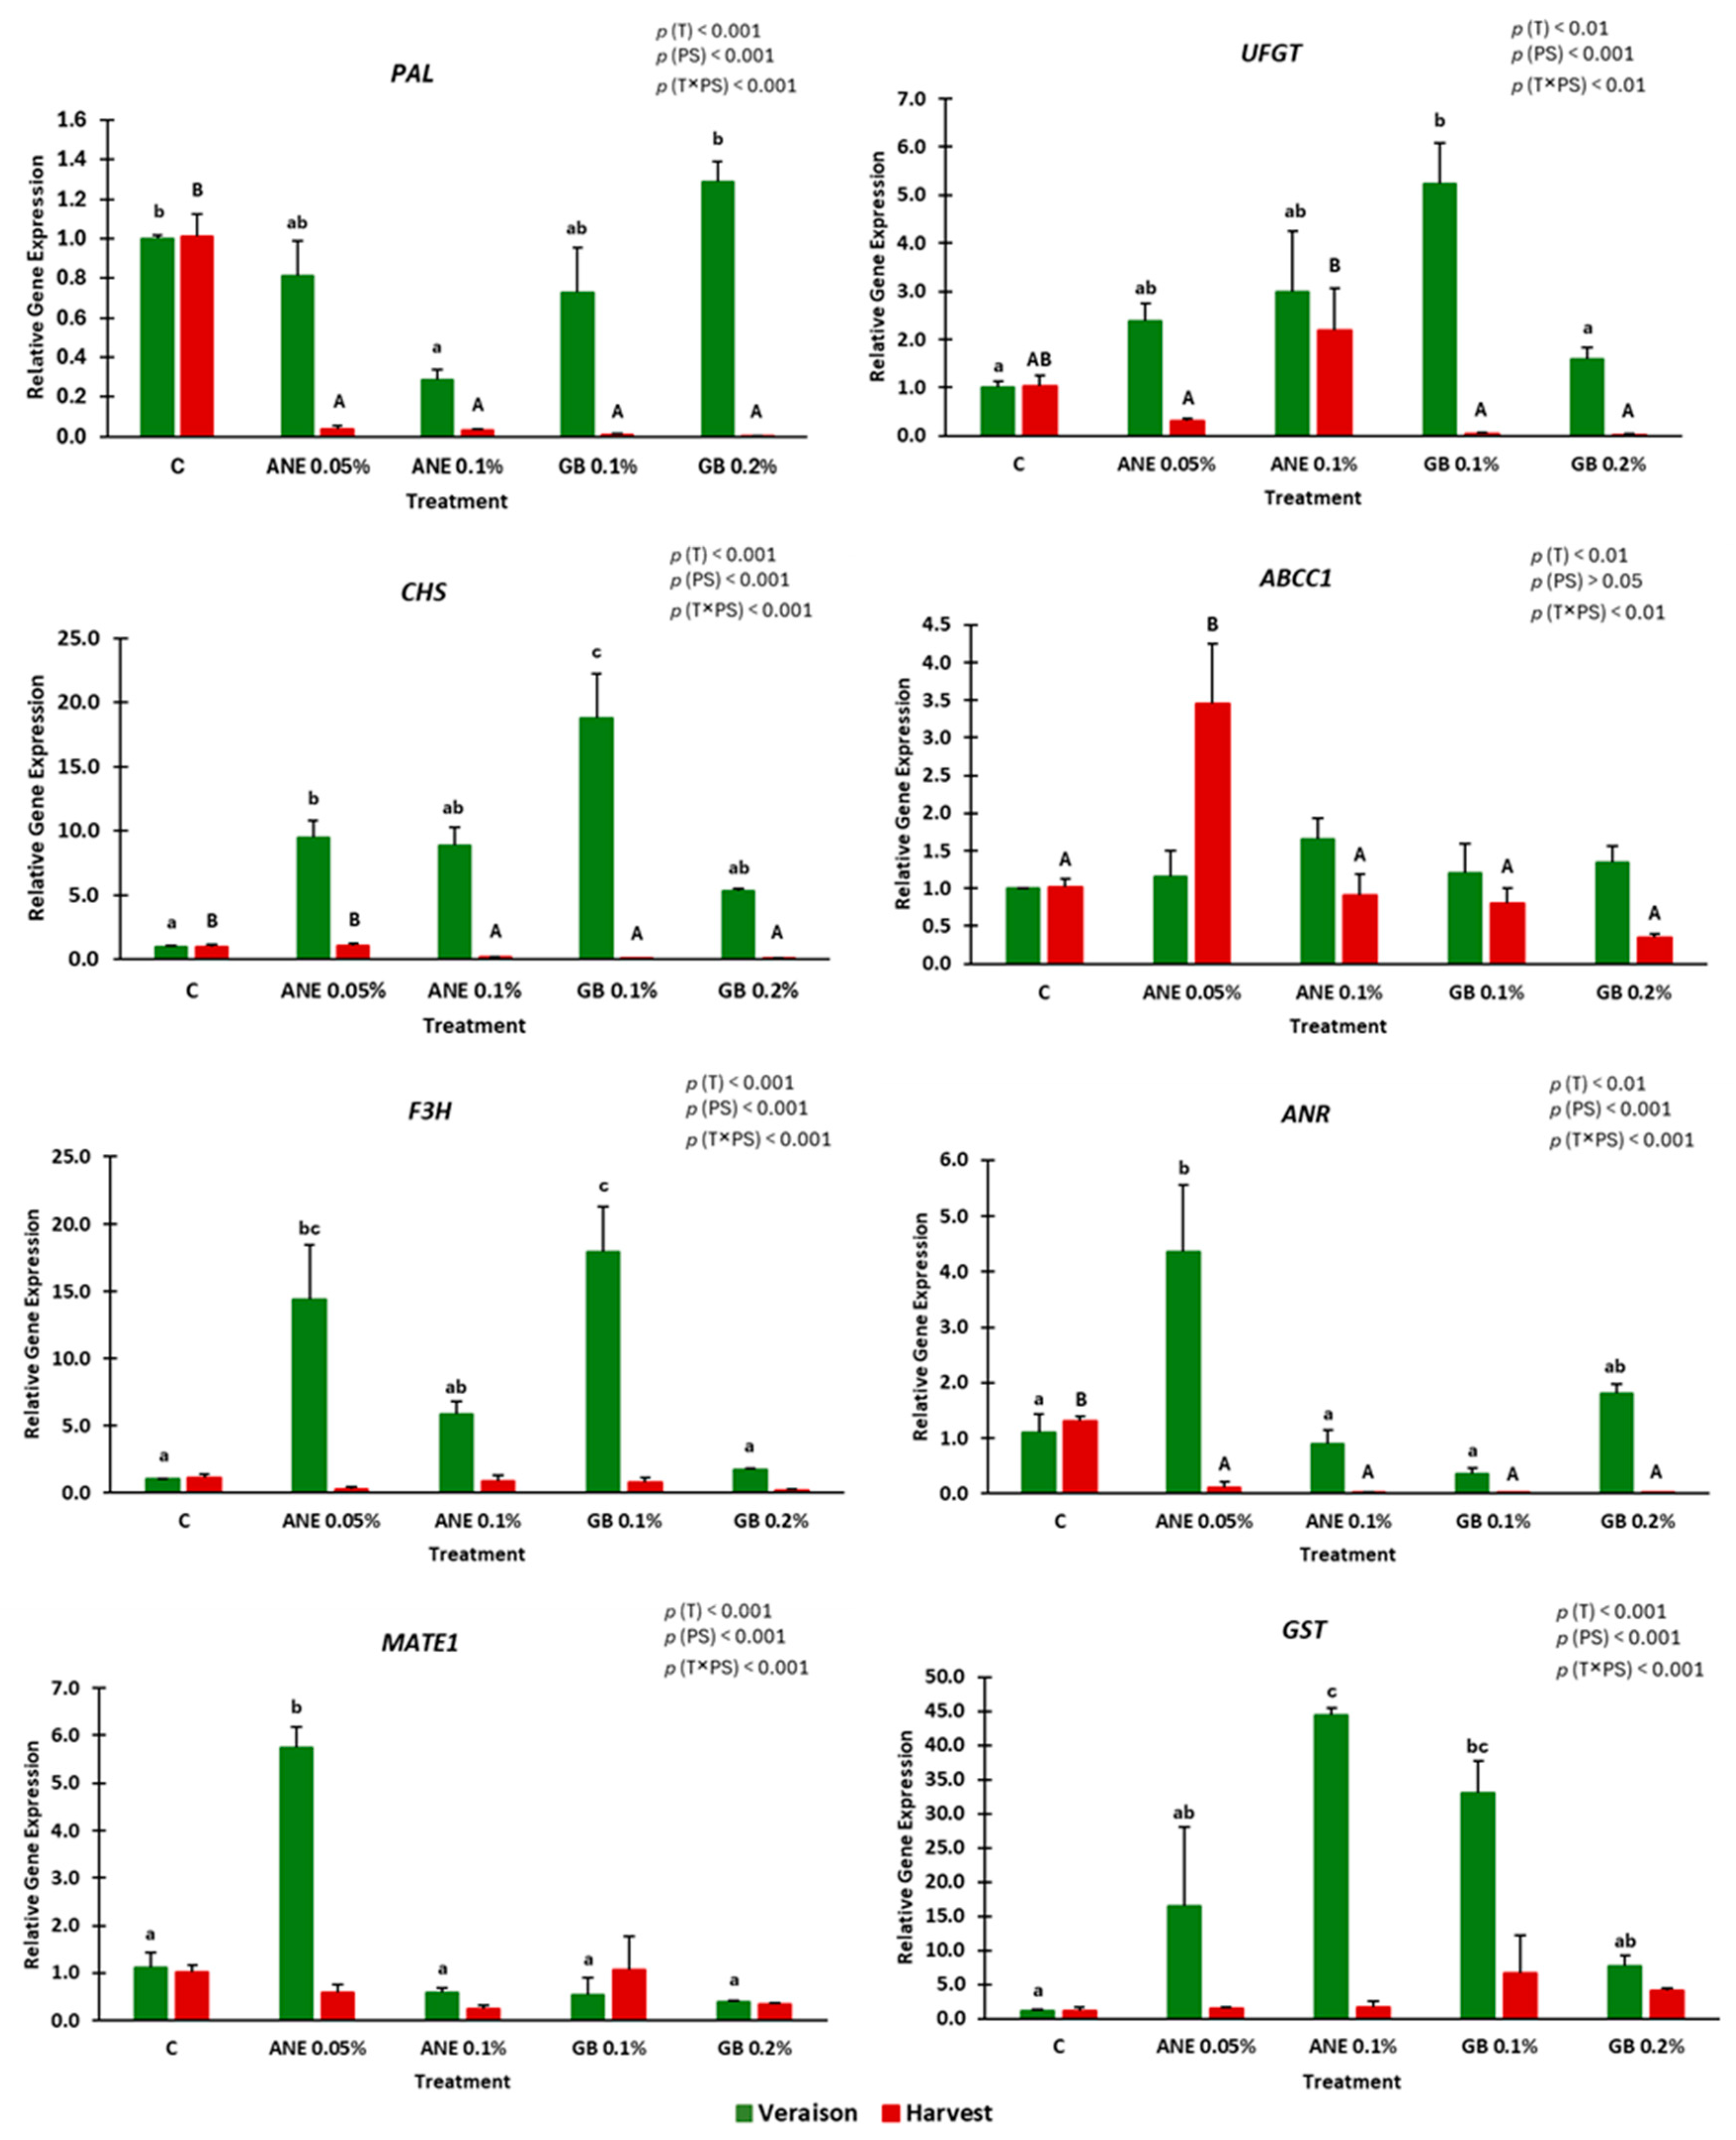
2.4. Gene Expression
3. Discussion
4. Materials and Methods
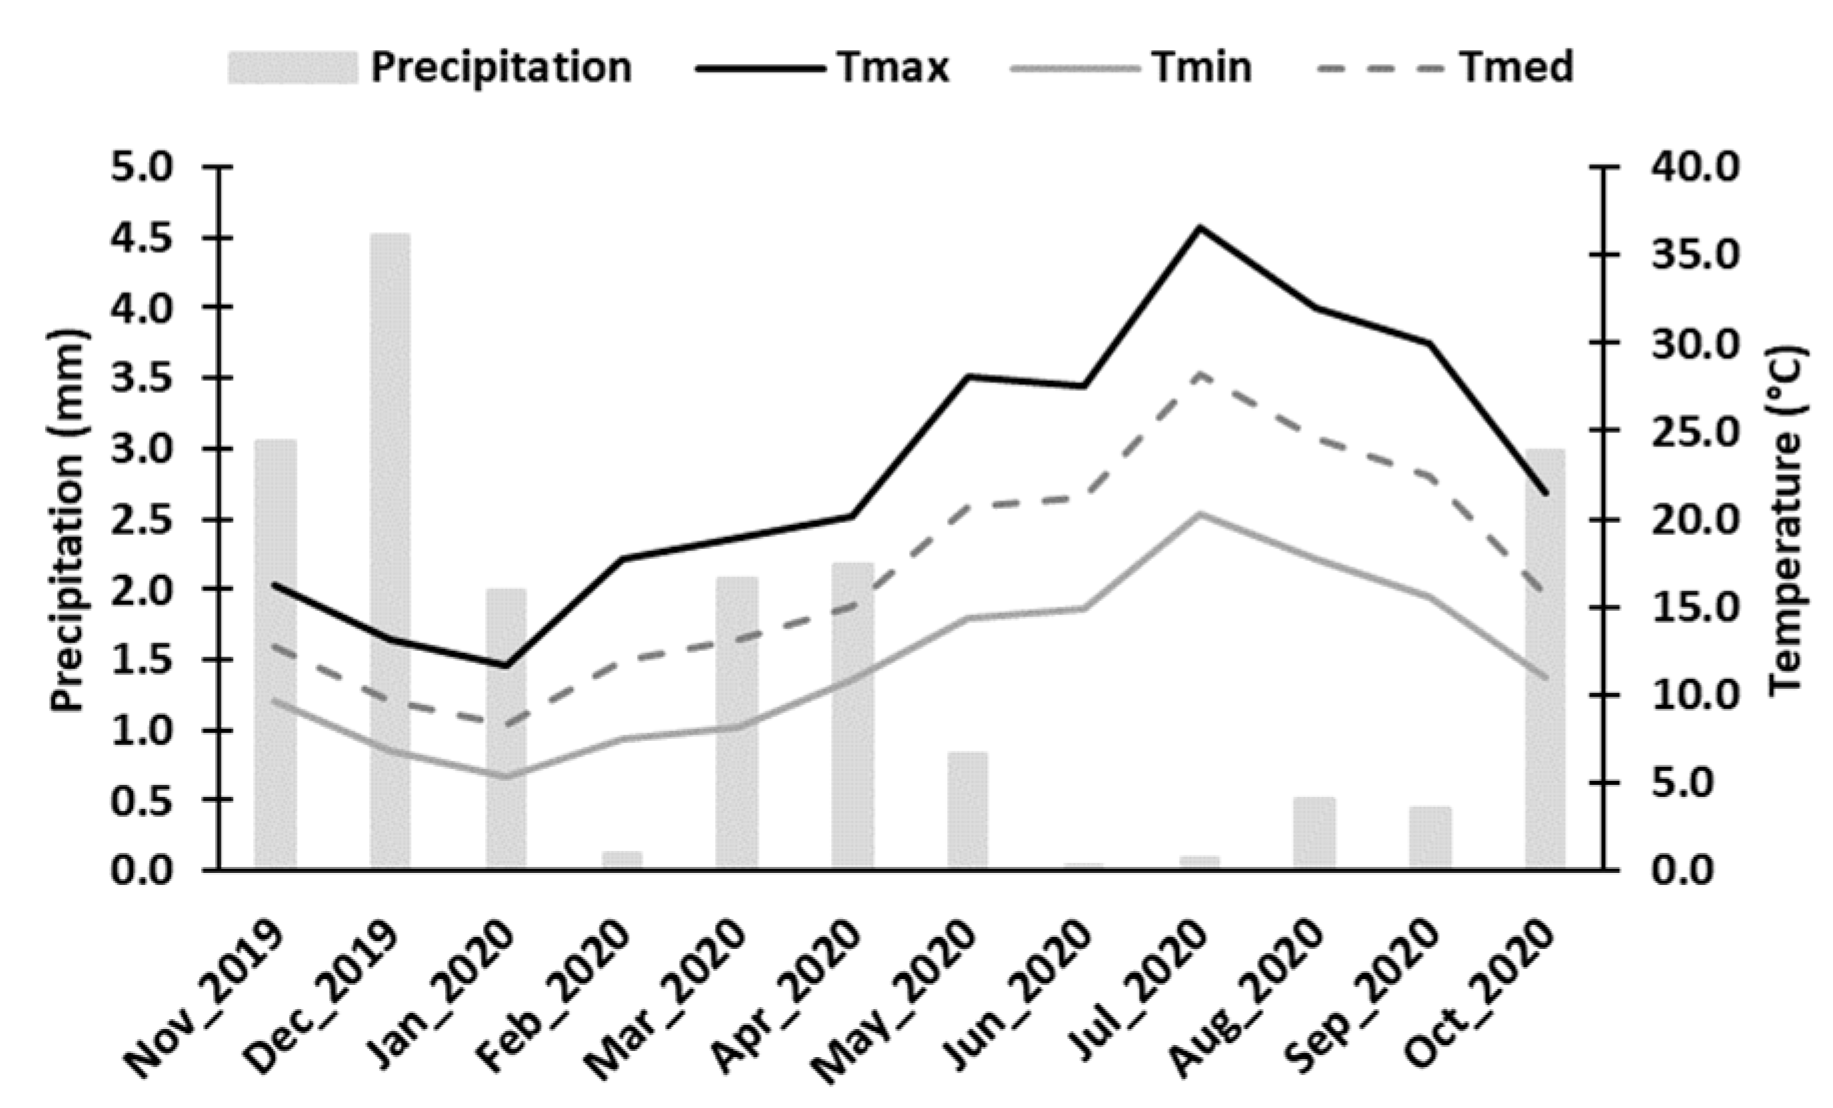
4.1. Plant Material and Sampling
4.2. Quality Assessment of Fruit
4.3. Determination of Phenolic Compounds
4.3.1. Total Phenolics
4.3.2. Flavonoids
4.3.3. Ortho-Diphenols
4.3.4. Total Anthocyanins
4.4. Antioxidant Activity Assays
4.4.1. ABTS•+ Radical-Scavenging Activity
4.4.2. DPPH Radical-Scavenging Activity
4.4.3. FRAP Assay
4.5. Total RNA Extraction, cDNA Synthesis and Quantitative Real-Time PCR
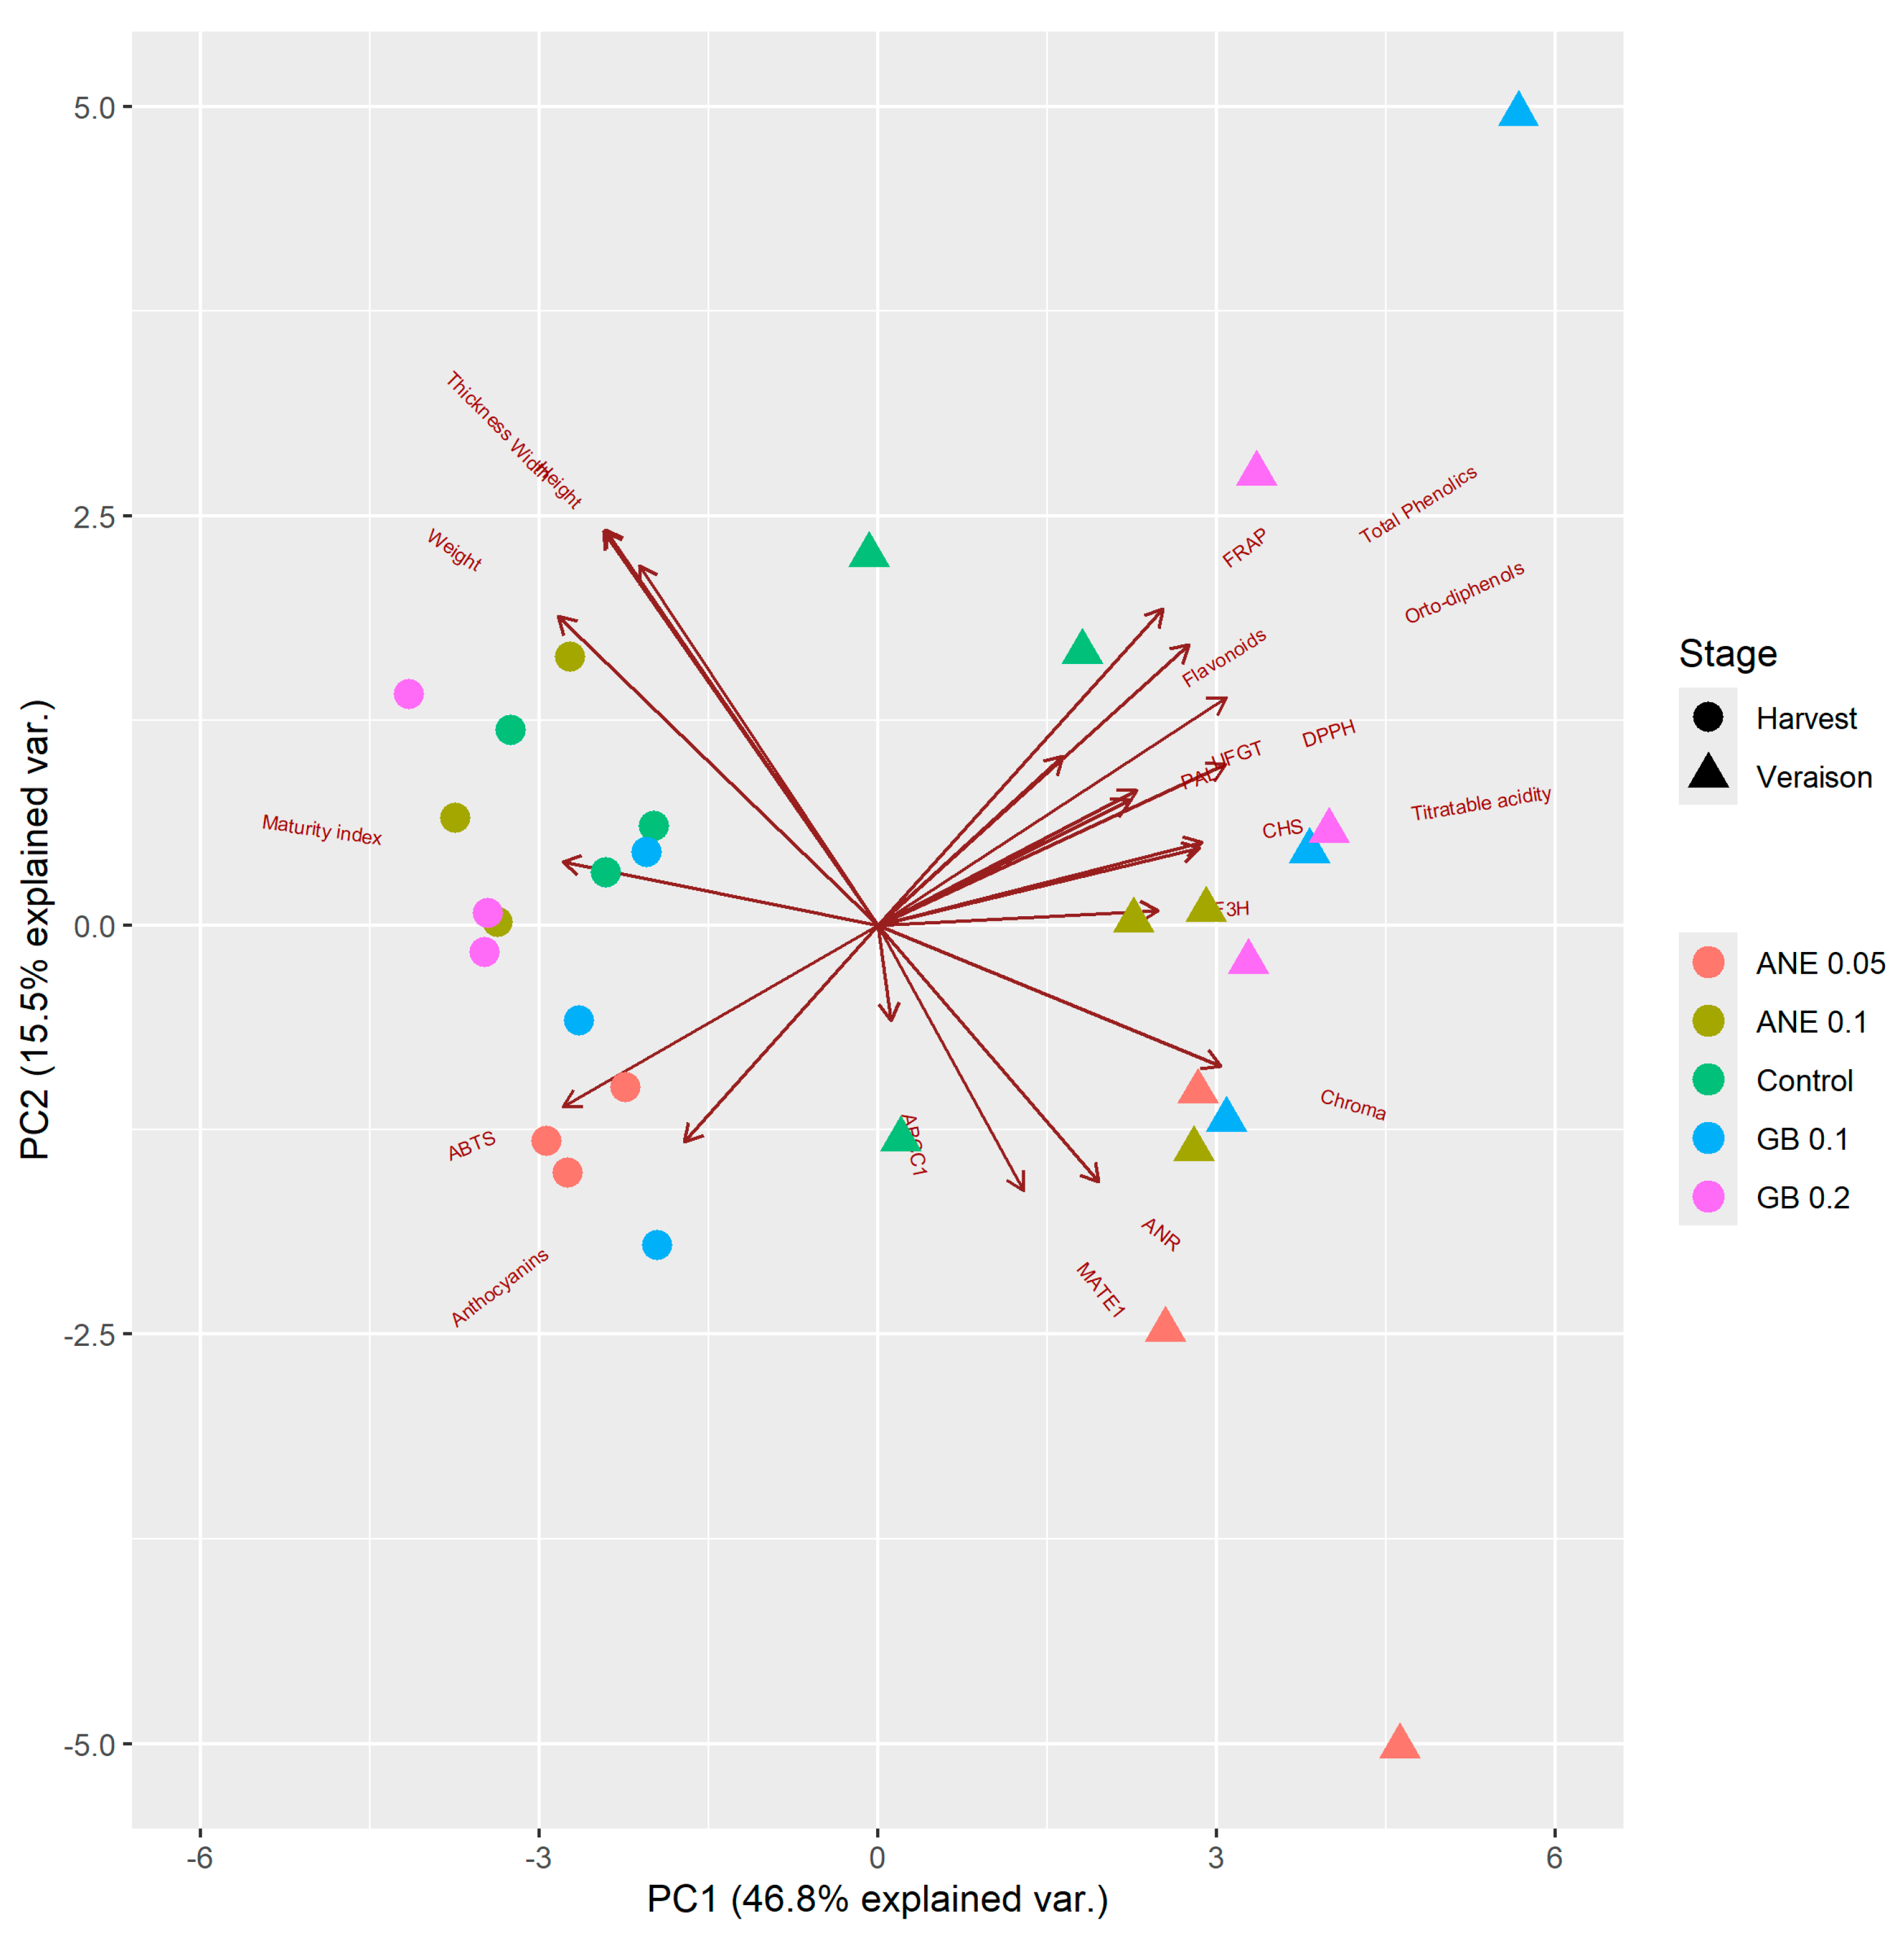
4.6. Statistical Analysis
5. Conclusions
Supplementary Materials
Author Contributions
Funding
Institutional Review Board Statement
Informed Consent Statement
Data Availability Statement
Acknowledgments
Conflicts of Interest
References
- OIV. State of the World Vine and Wine Sector 2022; Organization of Vine and Wine: Dijon, France, 2023. [Google Scholar]
- IVV. Regiões; Instituto da Vinha e do Vinho, I.P.: Lisboa. 2023. Available online: https://www.ivv.gov.pt/np4/regioes/ (accessed on 9 June 2023).
- Fraga, H.; De Cortázar Atauri, I.G.; Malheiro, A.C.; Moutinho-Pereira, J.; Santos, J.A. Viticulture in Portugal: A Review of Recent Trends and Climate Change Projections. OENOOne 2017, 51, 61–69. [Google Scholar] [CrossRef]
- Mateus, N.; Machado, J.M.; De Freitas, V. Development changes of anthocyanins in Vitis vinifera grapes grown in the Douro Valley and concentration in respective wines. J. Sci. Food Agric. 2002, 82, 1689–1695. [Google Scholar] [CrossRef]
- Conde, A.; Pimentel, D.; Neves, A.; Dinis, L.-T.; Bernardo, S.; Correia, C.M.; Gerós, H.; Moutinho-Pereira, J. Kaolin foliar application has a stimulatory effect on phenylpropanoid and flavonoid pathways in grape berries. Front. Plant Sci. 2016, 7, 1150. [Google Scholar] [CrossRef]
- Fonseca, A.; Fraga, H.; Santos, J.A. Exposure of Portuguese viticulture to weather extremes under climate change. Clim. Serv. 2023, 30, 100357. [Google Scholar] [CrossRef]
- De Sousa, A.M.; Ayub, R.A.; Viencz, T.; Botelho, R.V. Fruit set and yield of apple trees cv. Gala treated with seaweed extract of Ascophyllum nodosum and thidiazuron. Rev. Bras. Frutic. 2019, 41, 1–12. [Google Scholar] [CrossRef]
- Mousavi, S.M.; Jafari, A.; Shirmardi, M. The effect of seaweed foliar application on yield and quality of apple cv. ‘Golden Delicious’. Sci. Hortic. 2024, 323, 112529. [Google Scholar] [CrossRef]
- Cabo, S.; Morais, M.C.; Aires, A.; Carvalho, R.; Pascual-Seva, N.; Silva, A.P.; Gonçalves, B. Kaolin and seaweed-based extracts can be used as middle and long-term strategy to mitigate negative effects of climate change in physiological performance of hazelnut tree. J. Agron. Crop Sci. 2020, 206, 28–42. [Google Scholar] [CrossRef]
- Cabo, S.; Aires, A.; Carvalho, R.; Vilela, A.; Pascual-Seva, N.; Silva, A.P.; Gonçalves, B. Kaolin, Ascophyllum nodosum and salicylic acid mitigate effects of summer stress improving hazelnut quality. J. Sci. Food Agric. 2020, 101, 459–475. [Google Scholar] [CrossRef]
- Mannino, G.; Ricciardi, M.; Gatti, N.; Serio, G.; Vigliante, I.; Contartese, V.; Gentile, C.; Bertea, C.M. Changes in the Phytochemical Profile and Antioxidant Properties of Prunus persica Fruits after the Application of a Commercial Biostimulant Based on Seaweed and Yeast Extract. Int. J. Mol. Sci. 2022, 23, 15911. [Google Scholar] [CrossRef]
- Correia, S.; Queirós, F.; Ribeiro, C.; Vilela, A.; Aires, A.; Barros, A.I.; Schouten, R.; Silva, A.P.; Gonçalves, B. Effects of calcium and growth regulators on sweet cherry (Prunus avium L.) quality and sensory attributes at harvest. Sci. Hortic. 2019, 248, 231–240. [Google Scholar] [CrossRef]
- Gonçalves, B.; Morais, M.; Sequeira, A.; Ribeiro, C.; Guedes, F.; Silva, A.; Aires, A. Quality preservation of sweet cherry cv. “Staccato” by using glycine-betaine or Ascophyllum nodosum. Food Chem. 2020, 322, 126713. [Google Scholar] [CrossRef]
- Adak, N. Effects of glycine betaine concentrations on the agronomic characteristics of strawberry grown under deficit irrigation conditions. Appl. Ecol. Environ. Res. 2019, 17, 3753–3767. [Google Scholar] [CrossRef]
- Goñi, O.; Quille, P.; O’Connell, S. Ascophyllum nodosum extract biostimulants and their role in enhancing tolerance to drought stress in tomato plants. Plant Physiol. Biochem. 2018, 126, 63–73. [Google Scholar] [CrossRef]
- Frioni, T.; Sabbatini, P.; Tombesi, S.; Norrie, J.; Poni, S.; Gatti, M.; Palliotti, A. Effects of a biostimulant derived from the brown seaweed Ascophyllum nodosum on ripening dynamics and fruit quality of grapevines. Sci. Hortic. 2018, 232, 97–106. [Google Scholar] [CrossRef]
- Frioni, T.; Tombesi, S.; Quaglia, M.; Calderini, O.; Moretti, C.; Poni, S.; Gatti, M.; Moncalvo, A.; Sabbatini, P.; Berrìos, J.G.; et al. Metabolic and transcriptional changes associated with the use of Ascophyllum nodosum extracts as tools to improve the quality of wine grapes (Vitis vinifera cv. Sangiovese) and their tolerance to biotic stress. J. Sci. Food Agric. 2019, 99, 6350–6363. [Google Scholar] [CrossRef]
- Salvi, L.; Brunetti, C.; Cataldo, E.; Niccolai, A.; Centritto, M.; Ferrini, F.; Mattii, G.B. Effects of Ascophyllum nodosum extract on Vitis vinifera: Consequences on plant physiology, grape quality and secondary metabolism. Plant Physiol. Biochem. 2019, 139, 21–32. [Google Scholar] [CrossRef]
- Taskos, D.; Stamatiadis, S.; Yvin, J.C.; Jamois, F. Effects of an Ascophyllum nodosum (L.) Le Jol. extract on grapevine yield and berry composition of a Merlot vineyard. Sci. Hortic. 2019, 250, 27–32. [Google Scholar] [CrossRef]
- Baltazar, M.; Correia, S.; Guinan, K.J.; Sujeeth, N.; Bragança, R.; Gonçalves, B. Recent advances in the molecular effects of biostimulants in plants: An overview. Biomolecules 2021, 11, 1096. [Google Scholar] [CrossRef]
- Monteiro, E.; Gonçalves, B.; Cortez, I.; Castro, I. The role of biostimulants as alleviators of biotic and abiotic stresses in grapevine: A review. Plants 2022, 11, 396. [Google Scholar] [CrossRef]
- Hussain Wani, S.; Brajendra Singh, N.; Haribhushan, A.; Iqbal Mir, J. Compatible solute engineering in plants for abiotic stress tolerance—Role of glycine betaine. Curr. Genom. 2013, 14, 157–165. [Google Scholar] [CrossRef]
- Dutta, T.; Neelapu, N.R.R.; Wani, S.H.; Challa, S. Compatible solute engineering of crop plants for improved tolerance toward abiotic stresses. In Biochemical, Physiological and Molecular Avenues for Combating Abiotic Stress Tolerance in Plants; Wani, S.H., Ed.; Elsevier Inc.: Amsterdam, The Netherlands, 2018; pp. 221–254. [Google Scholar] [CrossRef]
- Denaxa, N.-K.; Tsafouros, A.; Ntanos, E.; Roussos, P.A. Role of glycine betaine in the protection of plants against environmental stresses. In Plant Stress Mitigators; Academic Press: Cambridge, MA, USA, 2023; pp. 127–158. [Google Scholar] [CrossRef]
- Le Mire, G.; Nguyen, M.L.; Fassotte, B.; Du Jardin, P.; Verheggen, F.; Delaplace, P.; Jijakli, M.H. Implementing plant biostimulants and biocontrol strategies in the agroecological management of cultivated ecosystems. A review. Biotechnol. Agron. Soc. Environ. 2016, 20, 299–313. [Google Scholar] [CrossRef]
- Gutiérrez-Gamboa, G.; Romanazzi, G.; Garde-Cerdán, T.; Pérez-Álvarez, E.P. A review of the use of biostimulants in the vineyard for improved grape and wine quality: Effects on prevention of grapevine diseases. J. Sci. Food Agric. 2019, 99, 1001–1009. [Google Scholar] [CrossRef] [PubMed]
- Bulgari, R.; Cocetta, G.; Trivellini, A.; Vernieri, P.; Ferrante, A. Biostimulants and Crop Responses: A review. Biol. Agric. Hortic. 2015, 31, 1–17. [Google Scholar] [CrossRef]
- Dinis, L.T.; Bernardo, S.; Conde, A.; Pimentel, D.; Ferreira, H.; Félix, L.; Gerós, H.; Correia, C.M.; Moutinho-Pereira, J. Kaolin exogenous application boosts antioxidant capacity and phenolic content in berries and leaves of grapevine under summer stress. J. Plant Physiol. 2016, 191, 45–53. [Google Scholar] [CrossRef] [PubMed]
- Ferrandino, A.; Lovisolo, C. Abiotic stress effects on grapevine (Vitis vinifera L.): Focus. on abscisic acid-mediated consequences on secondary metabolism and berry quality. Environ. Exp. Bot. 2014, 103, 138–147. [Google Scholar] [CrossRef]
- Koyama, R.; Roberto, S.R.; de Souza, R.T.; Borges, W.F.S.; Anderson, M.; Waterhouse, A.L.; Cantu, D.; Fidelibus, M.W.; Blanco-Ulate, B. Exogenous Abscisic Acid Promotes Anthocyanin Biosynthesis and Increased Expression of Flavonoid Synthesis Genes in Vitis vinifera × Vitis labrusca Table Grapes in a Subtropical Region. Front. Plant Sci. 2018, 9, 323. [Google Scholar] [CrossRef] [PubMed]
- Singh, R.K.; Martins, V.; Soares, B.; Castro, I.; Falco, V. Chitosan application in vineyards (Vitis vinifera L. cv. Tinto Cão) induces accumulation of anthocyanins and other phenolics in berries, mediated by modifications in the transcription of secondary metabolism genes. Int. J. Mol. Sci. 2020, 21, 306. [Google Scholar] [CrossRef] [PubMed]
- Robinson, S.P.; Bogs, J.; McDavid, D.A.J.; Hooper, L.C.; Speirs, J.; Walker, A.R. Transgenic grapevines with decreased expression of tannin synthesis genes have altered grape and wine flavonoid composition. Aust. J. Grape Wine Res. 2021, 27, 106–117. [Google Scholar] [CrossRef]
- Iqbal, N.; Ashraf, M.Y.; Ashraf, M. Influence of water stress and exogenous glycine betaine on sunflower achene weight and oil percentage. Int. J. Environ. Sci. Technol. 2005, 2, 155–160. [Google Scholar] [CrossRef]
- Metwaly, E.-S.E.; Al-Yasi, H.M.; Ali, E.F.; Farouk, H.A.; Farouk, S. Deteriorating harmful effects of drought in cucumber by spraying glycine betaine. Agriculture 2022, 12, 2166. [Google Scholar] [CrossRef]
- Taskin, S.; Ertan, E. Exogenous Applications of kaolin and glycine betaine increased the yield and quality of olive fruit and olive oil. Erwerbs-Obstbau 2022, 65, 337–346. [Google Scholar] [CrossRef]
- Monteiro, E.; Baltazar, M.; Pereira, S.; Correia, S.; Ferreira, H.; Alves, F.; Cortez, I.; Castro, I.; Gonçalves, B. Ascophyllum nodosum Extract and Glycine Betaine Preharvest Application in Grapevine: Enhancement of Berry Quality, Phytochemical Content and Antioxidant Properties. Antioxidants 2023, 12, 1835. [Google Scholar] [CrossRef]
- Campbell, J.; Sarkhosh, A.; Habibi, F.; Gajjar, P.; Ismail, A.; Tsolova, V.; El-Sharkawy, I. Evaluation of biochemical juice attributes and color-related traits in muscadine grape population. Foods 2021, 10, 1101. [Google Scholar] [CrossRef] [PubMed]
- Borghezan, M. Formation and ripening of grape and effects on the wines: Review. Ciência E Técnica Vitivinícola 2017, 32, 126–141. [Google Scholar] [CrossRef]
- Rätsep, R.; Karp, K.; Vool, E. Yield maturity parameters of hybrid grap Evine (Vitis Sp.) cultivar “Zilga”. Res. Rural Dev. 2014, 1, 44–50. [Google Scholar]
- ADVID. Boletim Ano Vitícola 2020; ADVID: Vila Real. 2020. Available online: www.advid.pt (accessed on 14 June 2023).
- Parađiković, N.; Teklić, T.; Zeljković, S.; Lisjak, M.; Špoljarević, M. Biostimulants research in some horticultural plant species—A review. Food Energy Secur. 2019, 8, e00162. [Google Scholar] [CrossRef]
- Bulgari, R.; Franzoni, G.; Ferrante, A. biostimulants application in horticultural crops under abiotic stress conditions. Agronomy 2019, 9, 306. [Google Scholar] [CrossRef]
- Delaunois, B.; Farace, G.; Jeandet, P.; Clément, C.; Baillieul, F.; Dorey, S.; Cordelier, S. Elicitors as alternative strategy to pesticides in grapevine? Current knowledge on their mode of action from controlled conditions to vineyard. Environ. Sci. Pollut. Res. 2014, 21, 4837–4846. [Google Scholar] [CrossRef] [PubMed]
- Flamini, R.; Mattivi, F.; Rosso, M.; De Arapitsas, P.; Bavaresco, L. Advanced knowledge of three important classes of grape phenolics: Anthocyanins, stilbenes and flavonols. Int. J. Mol. Sci. 2013, 14, 19651–19669. [Google Scholar] [CrossRef]
- Arakawa, O. Photoregulation of anthocyanin synthesis in apple fruit under UV-B and red light. Plant Cell Physiol. 1988, 29, 1385–1389. [Google Scholar] [CrossRef]
- Lorenz, D.H.; Eichhorn, K.W.; Bleiholder, H.; Klose, R.; Meier, U.; Weber, E. Growth stages of the grapevine: Phenological growth stages of the grapevine (Vitis vinifera L. ssp. vinifera)—Codes and descriptions according to the extended BBCH scale. Aust. J. Grape Wine Res. 1995, 1, 100–103. [Google Scholar] [CrossRef]
- Ough, C.S.; Amerine, M.A. Methods Analysis of Musts and Wines, 2nd ed.; Wiley: Hoboken, NJ, USA, 1988; ISBN 78-0-471-62757-9. [Google Scholar]
- Coombe, B.G.; Dundon, R.J.; Short, A.W.S. Indices of sugar—Acidity as ripeness criteria for winegrapes. J. Sci. Food Agric. 1980, 31, 495–502. [Google Scholar] [CrossRef]
- Singleton, V.; Rossi, J. Colorometry of total phenolics with phosphomolybdic-phosphotungstic acid reagents. Am. J. Enol. Vitic. 1965, 16, 144–158. [Google Scholar] [CrossRef]
- Dewanto, V.; Wu, X.; Adom, K.K.; Liu, R.H. Thermal processing enhances the nutritional value of tomatoes by increasing total antioxidant activity. J. Agric. Food Chem. 2002, 50, 3010–3014. [Google Scholar] [CrossRef] [PubMed]
- Gouvinhas, I.; De Almeida, J.M.; Carvalho, T.; Machado, N.; Barros, A. Discrimination and characterisation of extra virgin olive oils from three cultivars in different maturation stages using Fourier transform infrared spectroscopy in tandem with chemometrics. Food Chem. 2015, 174, 226–232. [Google Scholar] [CrossRef] [PubMed]
- Leal, C.; Costa, C.M.; Barros, A.; Gouvinhas, I. Assessing the relationship between the phenolic content and elemental composition of grape (Vitis vinifera L.) stems. Waste Biomass Valorization 2021, 12, 1313–1325. [Google Scholar] [CrossRef]
- Lee, J.; Durst, R.W.; Wrolstad, R.E.; Eisele, T.; Giusti, M.M.; Haché, J.; Hofsommer, H.; Koswig, S.; Kupina, D.A.; Kupina, S.; et al. Determination of total monomeric anthocyanin pigment content of fruit juices, beverages, natural colorants, and wines by the pH differential method: Collaborative study. J. AOAC Int. 2005, 88, 1269–1278. [Google Scholar] [CrossRef] [PubMed]
- Meng, J.-F.; Fang, Y.-L.; Qin, M.-Y.; Zhuang, X.-F.; Zhang, Z.-W. Varietal differences among the phenolic profiles and antioxidant properties of four cultivars of spine grape (Vitis davidii Foex) in Chongyi County (China). Food Chem. 2012, 134, 2049–2056. [Google Scholar] [CrossRef]
- Ali Shehat, W.; Sohail Akh, M.; Alam, T. Extraction and estimation of anthocyanin content and antioxidant activity of some common fruits. Trends Appl. Sci. Res. 2020, 15, 179–186. [Google Scholar] [CrossRef]
- Re, R.; Pellegrini, N.; Proteggente, A.; Pannala, A.; Yang, M.; Rice-Evans, C. Antioxidant activity applying an improved ABTS radical cation decolorization assay. Free Radic. Biol. Med. 1999, 26, 1231–1237. [Google Scholar] [CrossRef]
- Stratil, P.; Klejdus, B.; Kubáň, V. Determination of total content of phenolic compounds and their antioxidant activity in vegetables evaluation of spectrophotometric methods. J. Agric. Food Chem. 2006, 54, 607–616. [Google Scholar] [CrossRef] [PubMed]
- Brand-Williams, W.; Cuvelier, M.E.; Berset, C. Use of a free radical method to evaluate antioxidant activity. LWT Food Sci. Technol. 1995, 28, 25–30. [Google Scholar] [CrossRef]
- Sánchez-Moreno, C.; Larrauri, J.; Saura-Calixto, F. A procedure to measure the antiradical efficiency of polyphenols. J. Sci. Food Agric. 1998, 76, 270–276. [Google Scholar] [CrossRef]
- Siddhraju, P.; Becker, K. Antioxidant properties of various solvents extracts of total phenolic constituents from three different agroclimatic origins of drumstick tree (Moringa oleifera Lam) leaves. J. Agric. Food Chem. 2003, 51, 2144–2155. [Google Scholar] [CrossRef] [PubMed]
- Benzie, I.F.F.; Strain, J.J. The Ferric reducing ability of plasma (FRAP) as a measure of “antioxidant power”: The FRAP assay. Anal. Biochem. 1996, 239, 70–76. [Google Scholar] [CrossRef]
- Fujita, A.; Soma, N.; Goto-Yamamoto, N.; Mizuno, A.; Kiso, K.; Hashizume, K. Effect of shading on proanthocyanidin biosynthesis in the grape berry. J. Jpn. Soc. Hortic. Sci. 2007, 76, 112–119. [Google Scholar] [CrossRef]
- Livak, K.J.; Schmittgen, T.D. Analysis of relative gene expression data using real-time quantitative PCR and the 2(-Delta Delta C(T)) Method. Methods 2001, 25, 402–408. [Google Scholar] [CrossRef] [PubMed]
- Warnes, G.R.; Bolker, B.; Bonebakker, L.; Gentleman, R.; Liaw, W.H.A.; Lumley, T.; Maechler, M.; Magnusson, A.; Moeller, S.; Schwartz, M.; et al. Gplots: Various R Programming Tools for Plotting Data. 2014. Available online: https://www.scienceopen.com/book?vid=0e5d8e31-1fe4-492f-a3d8-8cd71b2b8ad9 (accessed on 9 June 2023).
- Revelle, W. psych: Procedures for Psychological, Psychometric, and Personality Research. Northwestern University, Evanston, Illinois. R package version 2.4.3. 2024. Available online: https://CRAN.R-project.org/package=psych (accessed on 9 June 2023).


Disclaimer/Publisher’s Note: The statements, opinions and data contained in all publications are solely those of the individual author(s) and contributor(s) and not of MDPI and/or the editor(s). MDPI and/or the editor(s) disclaim responsibility for any injury to people or property resulting from any ideas, methods, instructions or products referred to in the content. |
© 2024 by the authors. Licensee MDPI, Basel, Switzerland. This article is an open access article distributed under the terms and conditions of the Creative Commons Attribution (CC BY) license (https://creativecommons.org/licenses/by/4.0/).
Share and Cite
Monteiro, E.; De Lorenzis, G.; Ricciardi, V.; Baltazar, M.; Pereira, S.; Correia, S.; Ferreira, H.; Alves, F.; Cortez, I.; Gonçalves, B.; et al. Exploring Seaweed and Glycine Betaine Biostimulants for Enhanced Phenolic Content, Antioxidant Properties, and Gene Expression of Vitis vinifera cv. “Touriga Franca” Berries. Int. J. Mol. Sci. 2024, 25, 5335. https://doi.org/10.3390/ijms25105335
Monteiro E, De Lorenzis G, Ricciardi V, Baltazar M, Pereira S, Correia S, Ferreira H, Alves F, Cortez I, Gonçalves B, et al. Exploring Seaweed and Glycine Betaine Biostimulants for Enhanced Phenolic Content, Antioxidant Properties, and Gene Expression of Vitis vinifera cv. “Touriga Franca” Berries. International Journal of Molecular Sciences. 2024; 25(10):5335. https://doi.org/10.3390/ijms25105335
Chicago/Turabian StyleMonteiro, Eliana, Gabriella De Lorenzis, Valentina Ricciardi, Miguel Baltazar, Sandra Pereira, Sofia Correia, Helena Ferreira, Fernando Alves, Isabel Cortez, Berta Gonçalves, and et al. 2024. "Exploring Seaweed and Glycine Betaine Biostimulants for Enhanced Phenolic Content, Antioxidant Properties, and Gene Expression of Vitis vinifera cv. “Touriga Franca” Berries" International Journal of Molecular Sciences 25, no. 10: 5335. https://doi.org/10.3390/ijms25105335
APA StyleMonteiro, E., De Lorenzis, G., Ricciardi, V., Baltazar, M., Pereira, S., Correia, S., Ferreira, H., Alves, F., Cortez, I., Gonçalves, B., & Castro, I. (2024). Exploring Seaweed and Glycine Betaine Biostimulants for Enhanced Phenolic Content, Antioxidant Properties, and Gene Expression of Vitis vinifera cv. “Touriga Franca” Berries. International Journal of Molecular Sciences, 25(10), 5335. https://doi.org/10.3390/ijms25105335