Article

A Million-Cow Validation of a Chromosome 14 Region Interacting with All Chromosomes for Fat Percentage in U.S. Holstein Cows

1
Department of Animal Science, University of Minnesota, Saint Paul, MN 55108, USA
2
Animal Genomics and Improvement Laboratory, USDA-ARS, Beltsville, MD 20705, USA
*
Author to whom correspondence should be addressed.
Int. J. Mol. Sci. 2024, 25(1), 674; https://doi.org/10.3390/ijms25010674
Submission received: 11 December 2023 / Revised: 29 December 2023 / Accepted: 3 January 2024 / Published: 4 January 2024
(This article belongs to the Section Molecular Genetics and Genomics)

Abstract

:
A genome-wide association study (GWAS) of fat percentage (FPC) using 1,231,898 first lactation cows and 75,198 SNPs confirmed a previous result that a Chr14 region about 9.38 Mb in size (0.14–9.52 Mb) had significant inter-chromosome additive × additive (A×A) effects with all chromosomes and revealed many new such effects. This study divides this 9.38 Mb region into two sub-regions, Chr14a at 0.14–0.88 Mb (0.74 Mb in size) with 78% and Chr14b at 2.21–9.52 Mb (7.31 Mb in size) with 22% of the 2761 significant A×A effects. These two sub-regions were separated by a 1.3 Mb gap at 0.9–2.2 Mb without significant inter-chromosome A×A effects. The PPP1R16A-FOXH1-CYHR1-TONSL (PFCT) region of Chr14a (29 Kb in size) with four SNPs had the largest number of inter-chromosome A×A effects (1141 pairs) with all chromosomes, including the most significant inter-chromosome A×A effects. The SLC4A4-GC-NPFFR2 (SGN) region of Chr06, known to have highly significant additive effects for some production, fertility and health traits, specifically interacted with the PFCT region and a Chr14a region with CPSF1, ADCK5, SLC52A2, DGAT1, SMPD5 and PARP10 (CASDSP) known to have highly significant additive effects for milk production traits. The most significant effects were between an SNP in SGN and four SNPs in PFCT. The CASDSP region mostly interacted with the SGN region. In the Chr14b region, the 2.28–2.42 Mb region (138.46 Kb in size) lacking coding genes had the largest cluster of A×A effects, interacting with seventeen chromosomes. The results from this study provide high-confidence evidence towards the understanding of the genetic mechanism of FPC in Holstein cows.

1. Introduction

The fat percentage (FPC) in Holstein cattle has the strongest genetic effects among dairy traits, and the gene of diacylglycerol O-acyltransferase 1 (DGAT1) of chromosome 14 (Chr14) has been widely confirmed to contain the most significant effects of FPC [1,2,3,4,5,6,7], including the effect of the K232A variant [3,4,5] and the effect of the single-nucleotide polymorphism (SNP) marker rs109421300 (ARS-BFGL-NGS-4939) in DGAT1 [1,6]. As an example showing how much more significant the FPC additive effects are than the additive effects of other dairy traits, the log10(1/p) value as a measure of statistical significance was 5150 for FPC, and it was 1320, 820, 374 and 371 for the protein percentage, milk yield, fat yield and protein yield, respectively, from a previous large-scale genome-wide association study (GWAS) using 60,671 SNPs and 294,079 Holstein cows (2019 GWAS) [1]. Although the exact reasons for the highly significant effect of DGAT1 on FPC were not completely understood, the antagonism between milk and fat yields of DGAT1 was a likely genetic mechanism [1,8,9], and the antagonism of the most significant SNP (rs109421300) was extreme, with the lowest milk yield and the highest fat yield among all SNPs on the cattle genome [1]. In addition, a large chromosome segment (6.79 Mb in size) containing DGAT1 had highly significant effects on FPC. A conditional analysis showed that SNP effects in this region had strong linkage disequilibrium (LD) because the removal of the rs109421300 genotypic values from the phenotypic values removed 82% of the significant effects in this region. A follow-up GWAS on epistasis effects showed that this Chr14 region was also involved in the genome-wide epistasis effects of FPC.
Using the same dataset of 294,079 Holstein cows and 76,109 SNPs from the 2019 GWAS for additive effects, genome-wide epistasis tests found that the Chr14 region with the most significant additive effects for FPC interacted with all chromosomes for FPC in the form of inter-chromosome additive × additive (A×A) effects [10]. This was a unique discovery among the five production traits with significant inter-chromosome epistasis effects, including FPC, protein percentage and milk, fat and protein yields. The significant epistasis effects in this 10 Mb region were divided into two sub-regions separated by a gap region without significant inter-chromosome A×A effects, a region including DGAT1 upstream of the gap region and a region downstream of the gap region, which had over 40 coding genes but had no significant inter-chromosome A×A effects. The lack of significant inter-chromosome A×A effects in the gap region likely reflected the true status of this gap region: no A×A effects with other chromosomes. Given that both sides of this gap region had highly significant inter-chromosome A×A effects and the gap region had strong LD as shown by a previous conditional analysis [1], the lack of inter-chromosome A×A effects in the gap region was not due to the lack of LD with the two regions with significant inter-chromosome A×A effects on both sides of this gap region. Under the assumption of no A×A effects with other chromosomes, the statistical significance of this gap region provided a reference of the cut-off statistical significance to declare significant inter-chromosome A×A effects. The highest concentrations of the inter-chromosome A×A effects were in and around the PPP1R16A and CYHR1 genes upstream of the gap region and were in a noncoding region immediately downstream of the gap region. Following the 2019 GWAS and the 2021 epistasis study, the Holstein cows that can be used for GWAS surpassed one million by the end of 2022. Such a large sample size should provide high statistical confidence to establish or deny all or any of the previous findings of the 10 Mb Chr14 region interacting with all chromosomes for FPC. For this purpose, we conducted the genome-wide validation of inter-chromosome A×A effects for FPC using over one million first lactation cows in this study.

2. Results and Discussion

The genome-wide tests of inter-chromosome A×A effects for FPC using 1,231,898 first lactation cows and 75,198 SNPs essentially confirmed the previous result that the 10 Mb Chr14 region interacted with all chromosomes for FPC, confirmed the structure of this 10 Mb region and revealed many new results. This study identified 2763 pairs of significant inter-chromosome A×A effects with log10(1/p) > 32 for FPC (Figure 1, Table S1). Of these, 2761 pairs each involved the 0.14–9.52 Mb Chr14 region (9.38 Mb in size) with 107 SNPs and one of the remaining 29 chromosomes with 1050 SNPs, whereas only two pairs did not involve the Chr14 region, one pair between Chr03 and Chr05 and one pair between Chr05 and Chr20 (Figure 1a). Among the 2763 inter-chromosome A×A effects, the four most significant effects were between Chr06 and Chr14 (Figure 1b). The total number of SNPs in the 2763 SNP pairs was 1160. The circular plots of A×A effects between Chr14 and other chromosomes, as well as the Manhattan plots of the statistical significance of the A×A effects of all non-Chr14 chromosomes, are provided in Figure S1. Detailed test results, including statistical significance and estimated A×A effects and values for each of the 2763 SNP pairs, are provided in Table S1.

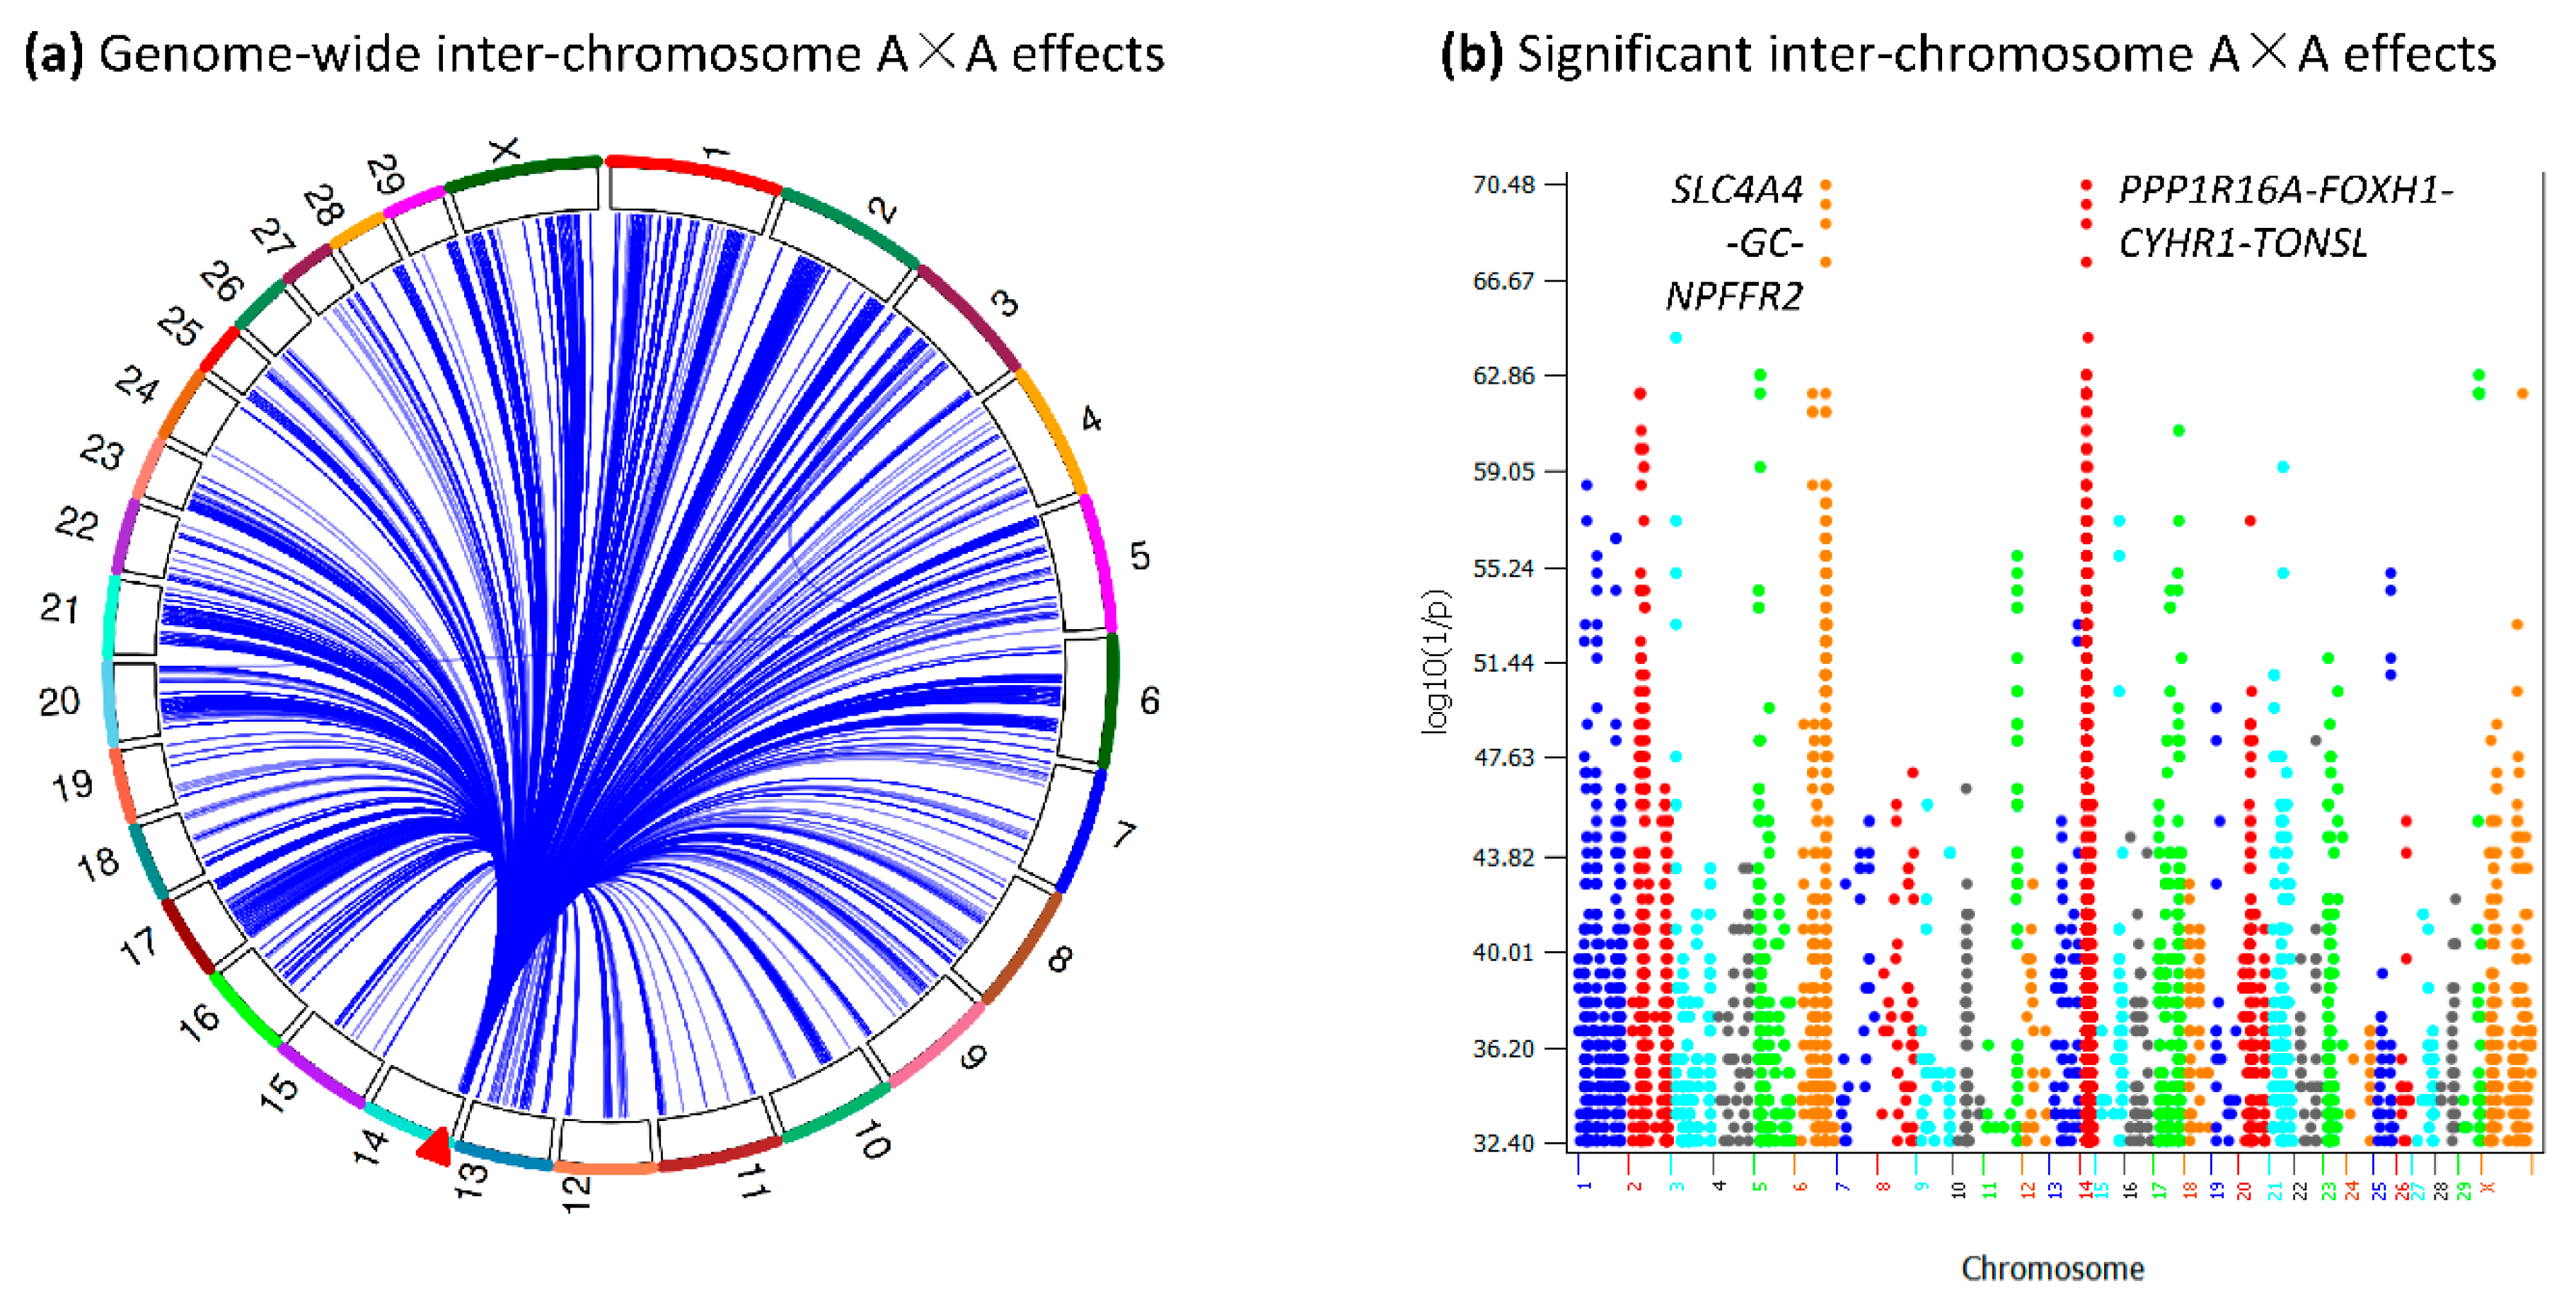
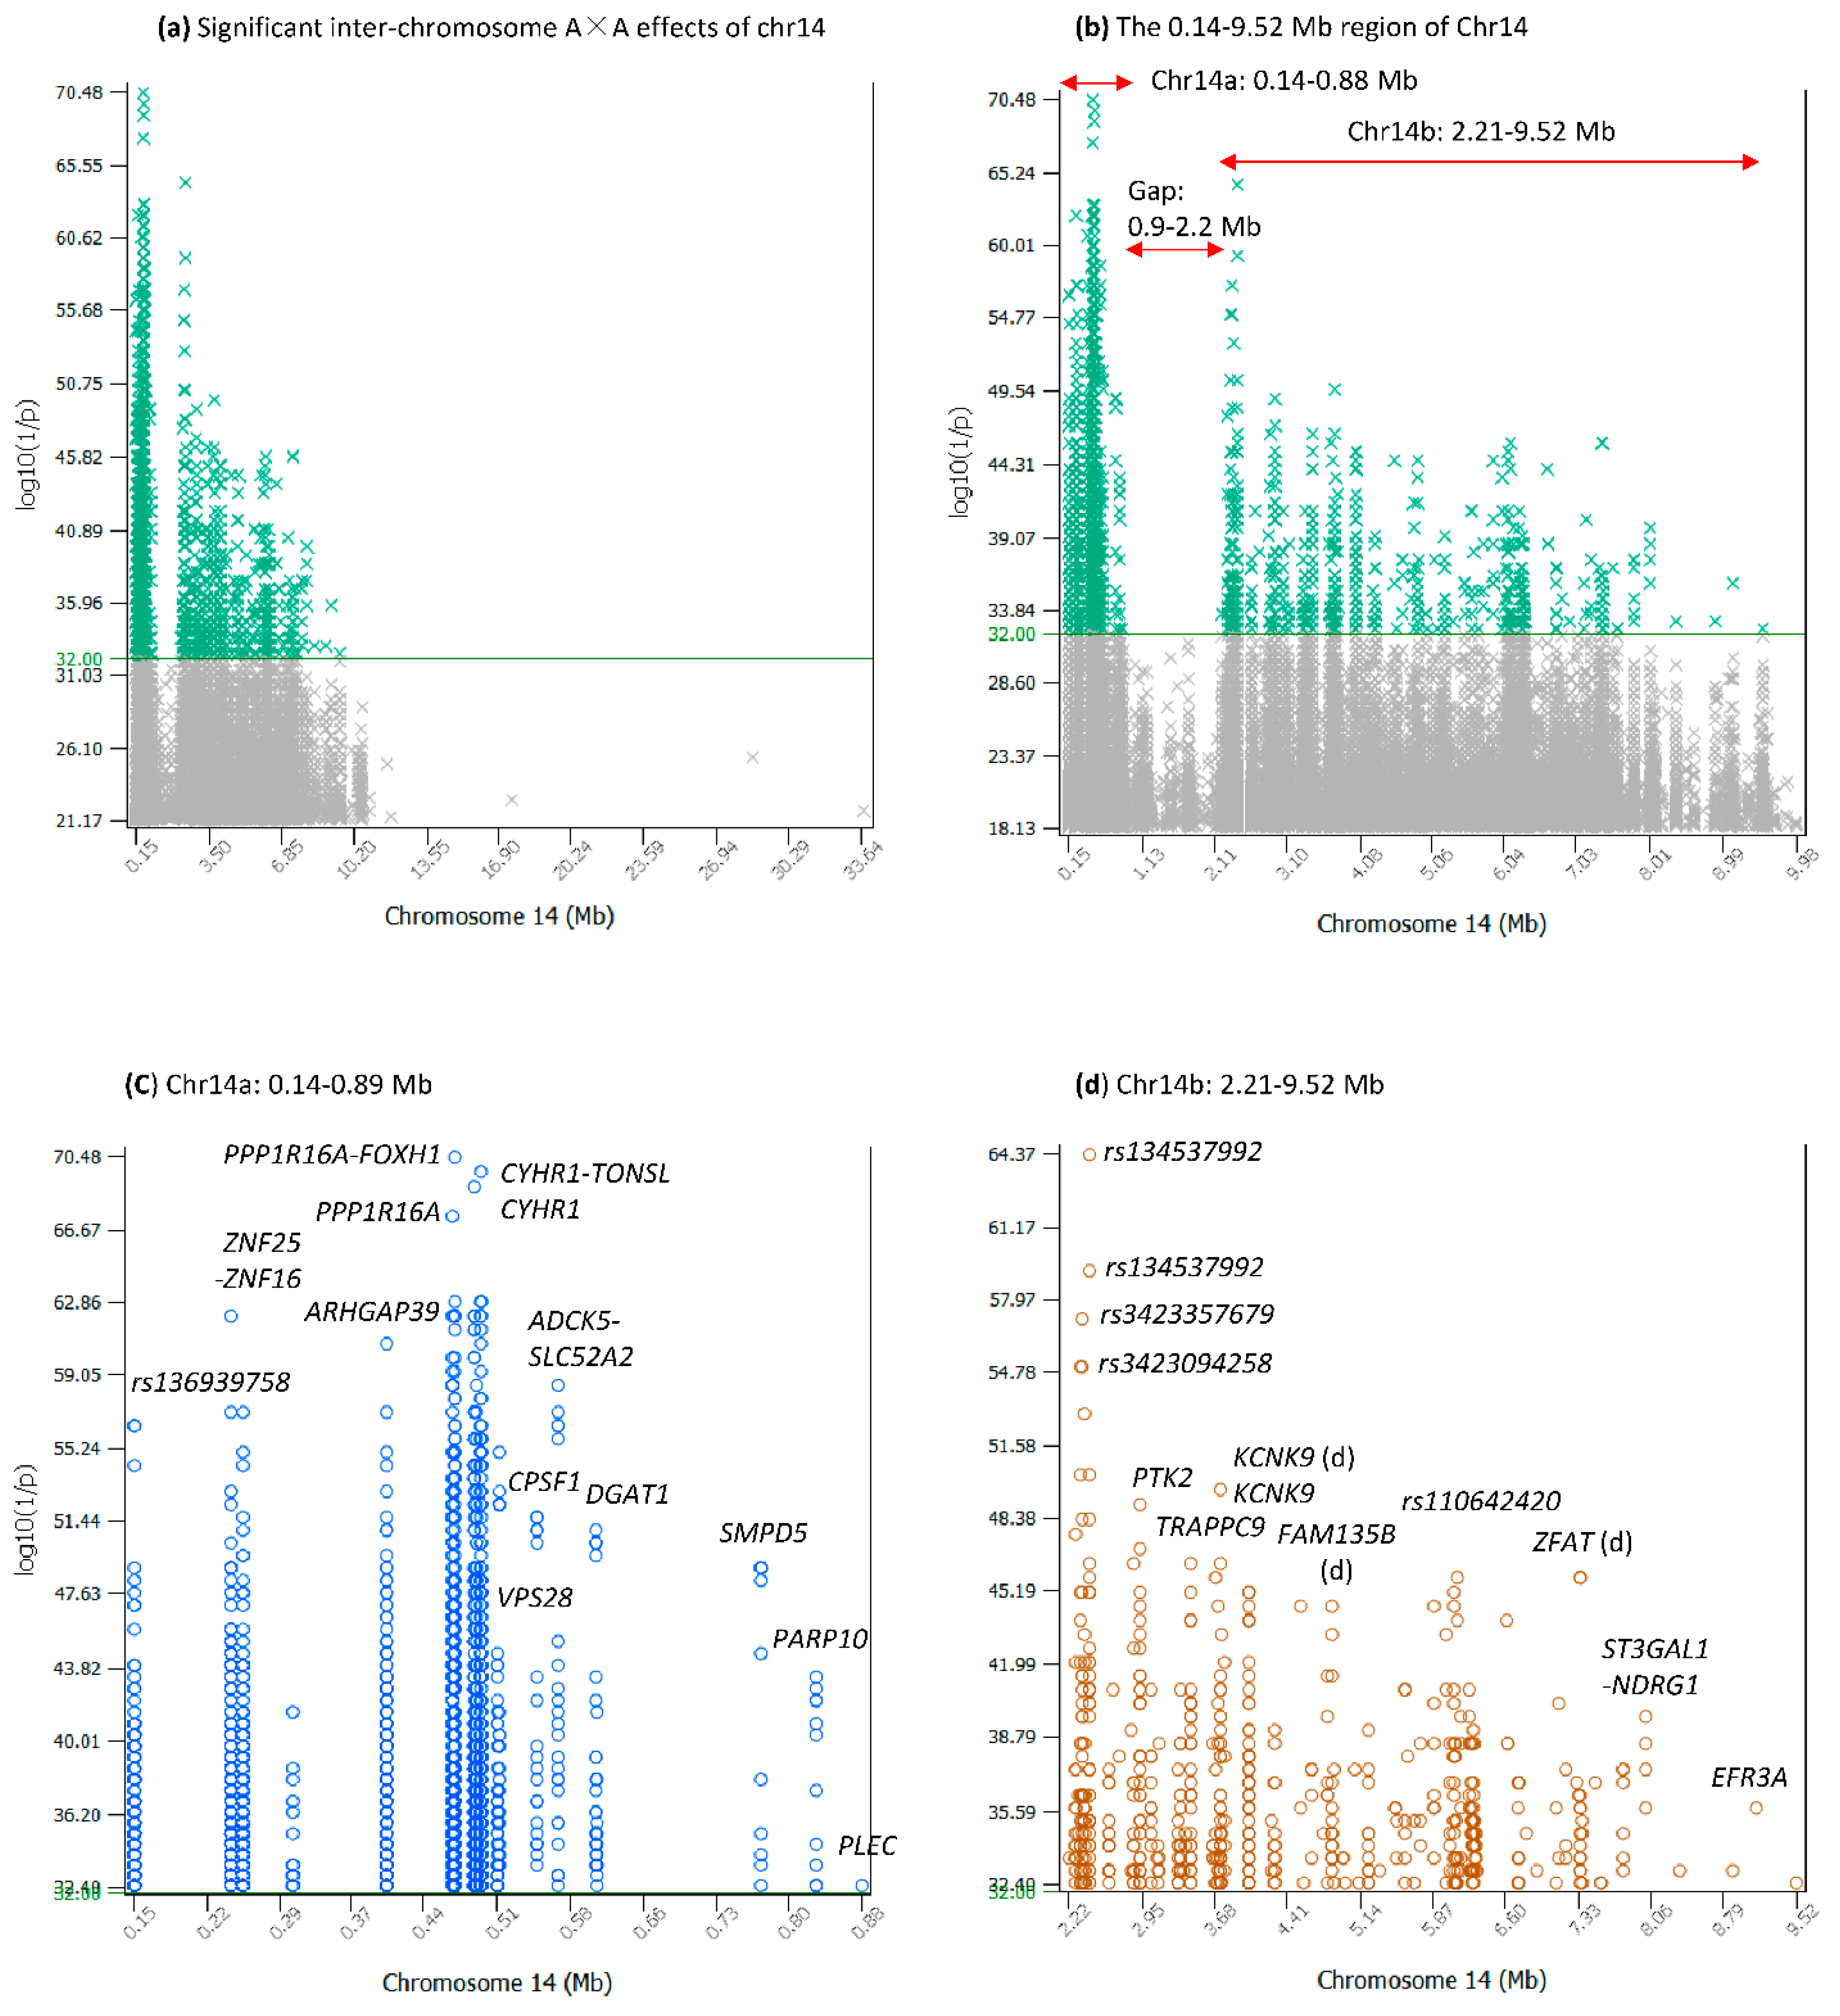
2.1. Structure of the 9.38 Mb Chr14 Region Interacting with All Chromosomes for FPC

The significant inter-chromosome A×A effects in the 9.38 Mb Chr14 region (Figure 2a) were in two sub-regions that we named Chr14a and Chr14b, where Chr14a was the 0.14–0.88 Mb region (0.74 Mb in size) with 19 SNPs [11], and Chr14b was the 2.21–9.52 Mb region (7.31 Mb in size) with 88 SNPs [12]. These two sub-regions were separated by a 1.3 Mb gap at 0.9–2.2 Mb, without significant inter-chromosome A×A effects with log10(1/p) > 32 (Figure 2b) but with over 40 coding genes [13]. The Chr14a region had the largest number of significant inter-chromosome A×A effects, 2148 out of the 2761 pairs or 78%, interacting with all the remaining chromosomes, and the Chr14b region had 613 of the 2761 pairs or 22%, interacting with all the remaining chromosomes except Chr24 (Table S1). Details of Chr14a and Chr14b are described below.

2.2. Inter-Chromosome A×A Effects of Chr14a

The Chr14a region was a gene-dense area with at least 46 coding genes [11], including the 15 genes shown in Figure 2c, which shows multiple locations with large clusters of inter-chromosome A×A effects. An SNP upstream of LOC789384 (rs136939758) was the upstream boundary of Chr14a with 139 inter-chromosome A×A effects. An SNP in PLEC with one of the lowest log10(1/p) values (32.40) was the downstream boundary of Chr14a.
Two regions within Chr14a were particularly interesting: the PPP1R16A-FOXH1-CYHR1-TONSL (PFCT) region and the CPSF1-ADCK5-SLC52A2-DGAT1-SMPD5-PARP10 (CASDSP) region. The PFCT region was only 29 Kb in size with four SNPs, but had the largest number of inter-chromosome A×A effects (1141 pairs) with all chromosomes, including the most significant inter-chromosome A×A effects (Figure 1b and Figure 2c, Table 1). The CASDSP region was 280 Kb in size, with six SNPs. Unlike PFCT, which interacted with all chromosomes, CASDPS mainly (42 out of 98 pairs) interacted with the SLC4A4-GC-NPFFR2 (SGN) region of Chr06 (86.75–87.40 Mb). The epistasis effects between the SGN region of Chr06 and the PFCT and CASDSP regions of Chr14 are an important new discovery in this study.

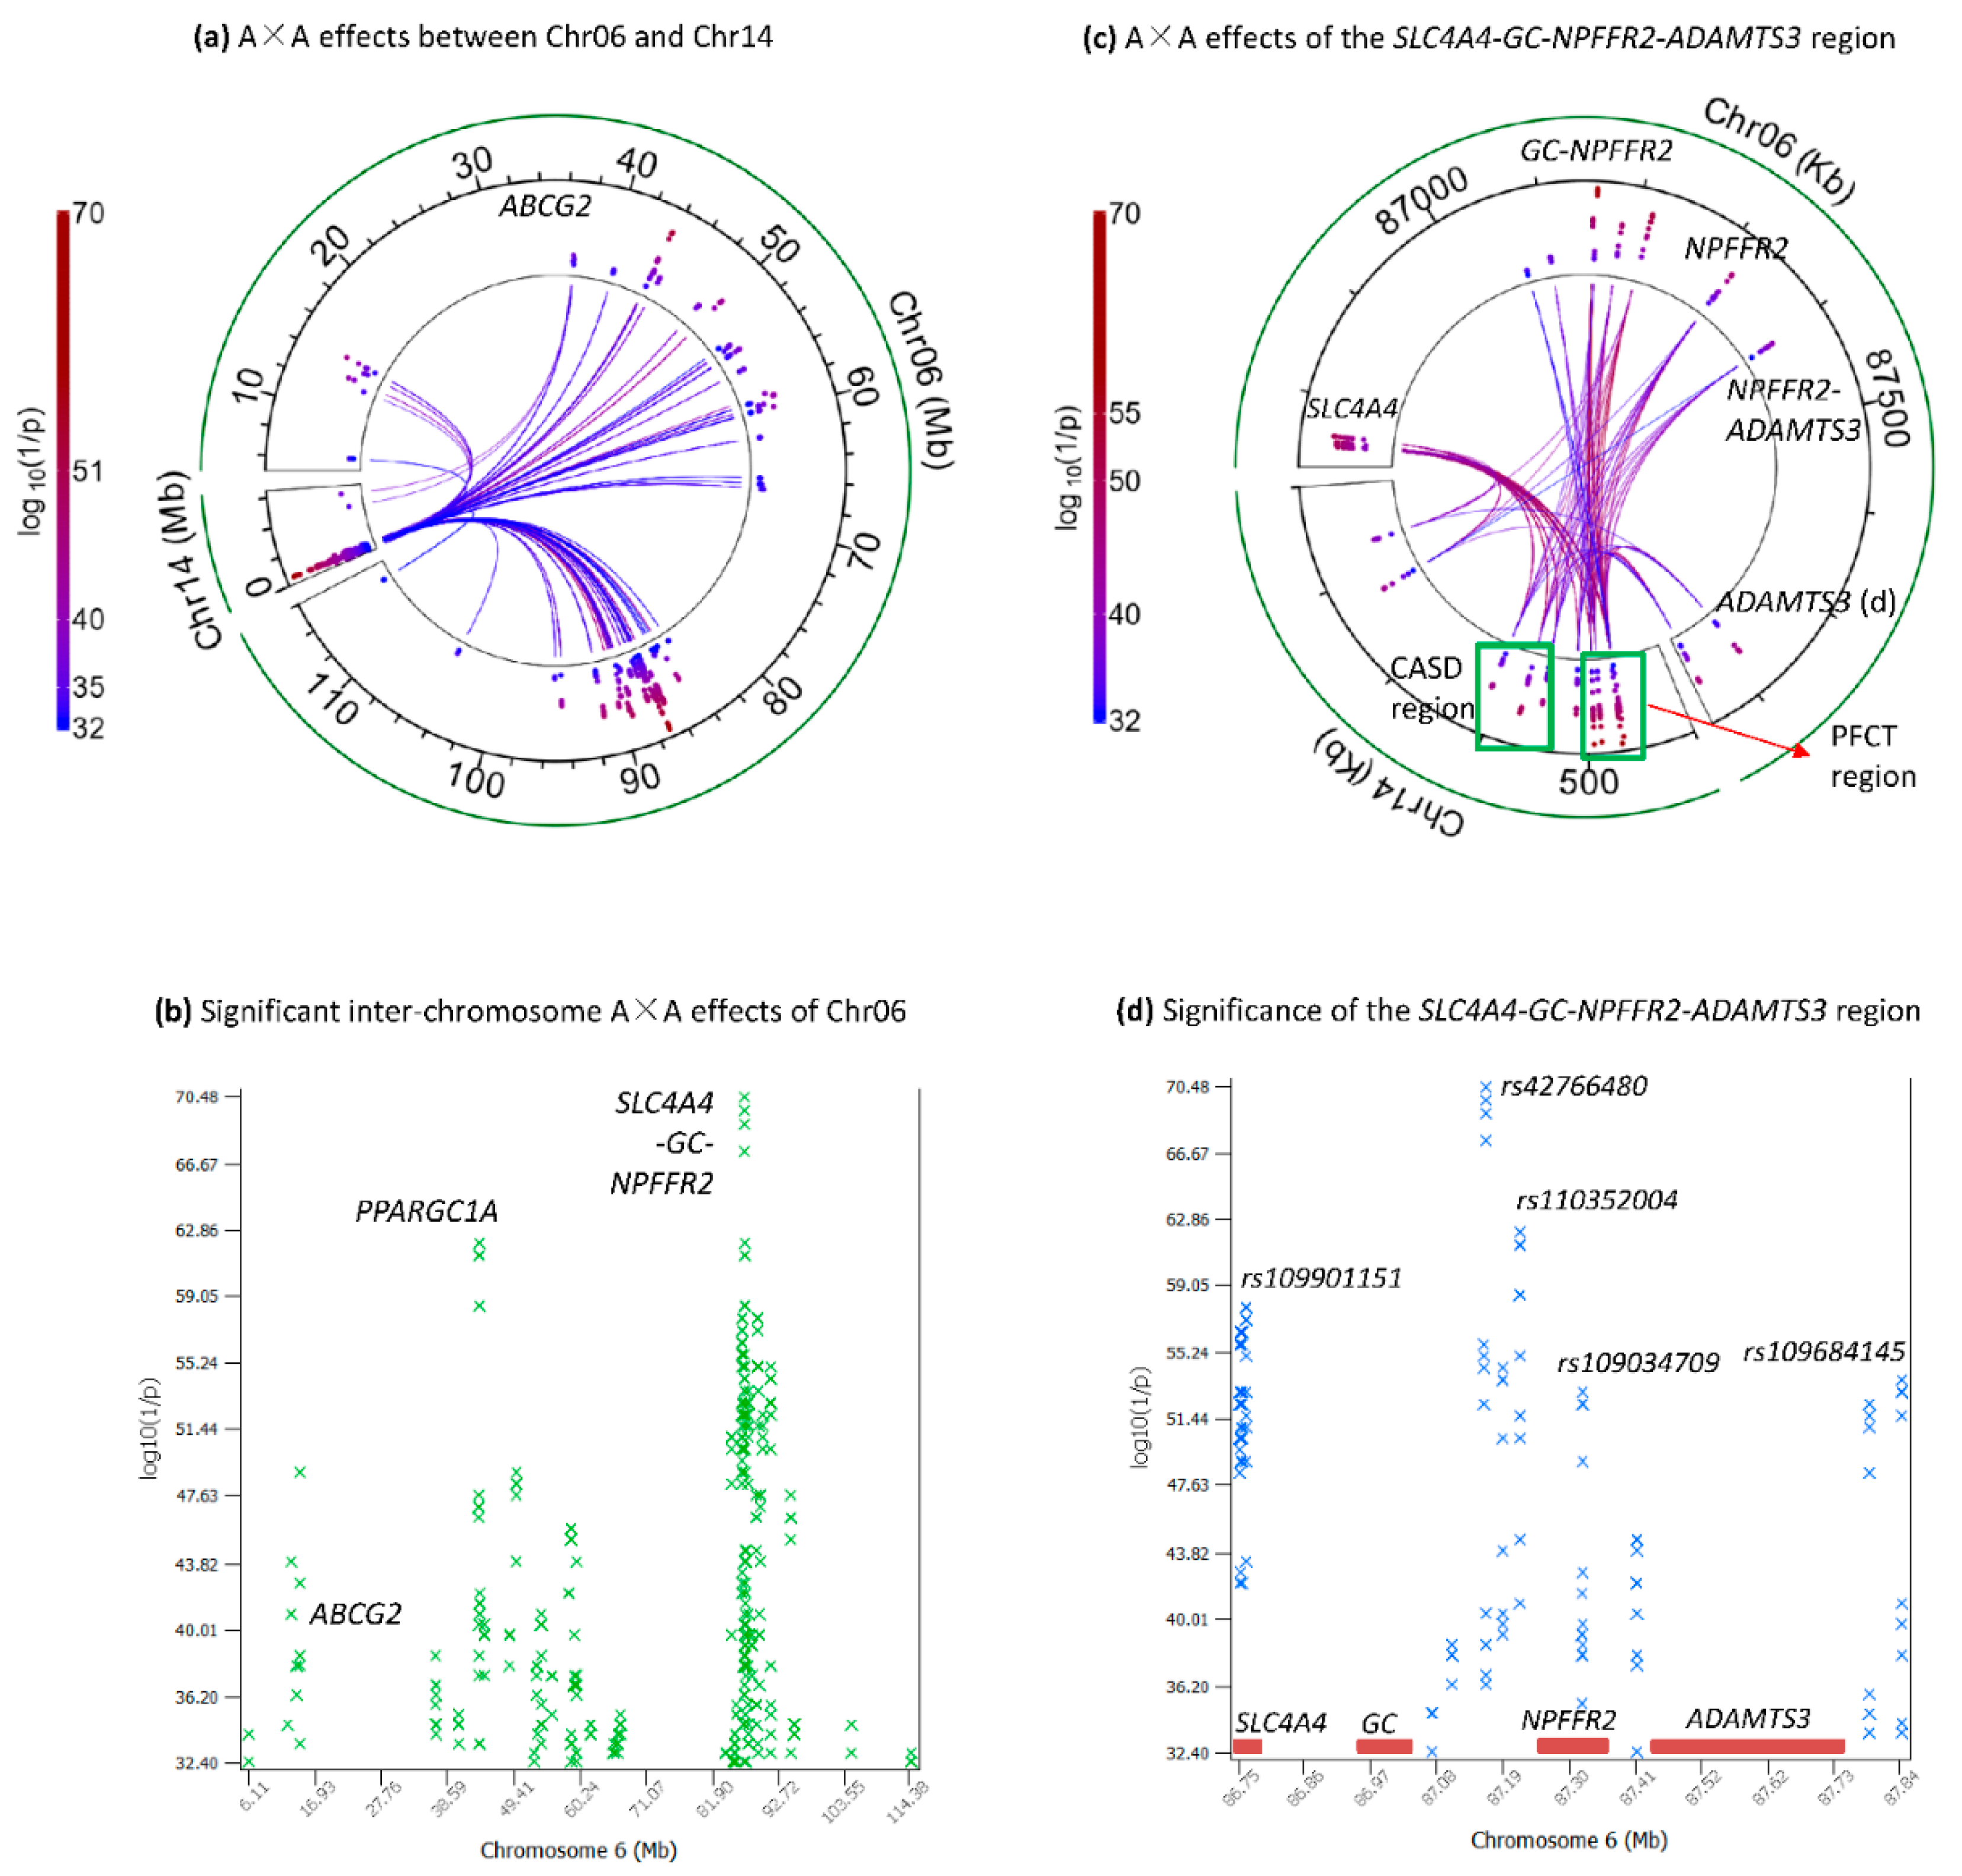
2.3. Inter-Chromosome A×A Effects between Chr06 and Chr14a

The significant inter-chromosome A×A effects of Chr06 (314 effects) were distributed in the 6.11–114.38 Mb region (Figure 3a,b; Table S1). However, Chr06 nearly exclusively interacted with Chr14a, with 312 of the 314 significant inter-chromosome A×A effects between Chr06 and Chr14a. Only two A×A effects involved Chr14b, between an SNP in the ABCG2 gene of Chr06 and two SNPs in Chr14b (Figure 3a,b; Table S1), noting that ABCG2 had significant effect on milk yield [1]. Although the 312 pairs between Chr06 and Chr14a were distributed in the 6.11–114.38 Mb region, the A×A effects between Chr14a and the SGN region of chr06 were most interesting because the Chr14a and SGN regions were two of the most important regions affecting milk production, and the SGN region also had highly significant effects on somatic cell score, daughter pregnancy rate and cow conception rate [1,2,14,15,16,17].
The PFCT region had four SNPs each interacting with the same eleven SNPs in SGN, and the CPSF1-ADCK5-SLC52A2-DGAT1 (CASD) region had three SNPs each interacting with the same nine SNPs in SGN (Figure 3c, Table S1). The SLC4A4 gene had ten significant SNPs and four of these ten SNPs in the 10.65 Kb tail region (86751807–86762457 bp), i.e., 2.5% of the gene interacted with both the PFCT and CASD regions of Chr14a, noting that the size of SLC4A4 was 427.295 Kb. The GC gene had no significant inter-chromosome A×A effects for FPC. The GC-NPFFR2 region had seven significant SNPs and two of these seven SNPs interacted with the PFCT region (Table 1). The top four most significant inter-chromosome A×A effects were between an SNP in GC-NPFFR2 (rs42766480) of Chr06 and four SNPs in PFCT, rs110984572 in PPP1R16A-FOXH1 (#1), rs137472016 in CYHR1-TONSL (#2), rs137727465 in CYHR1 (#3) and rs10914637 in PPP1R16A (#4) (Table 1; Figure 3c,d). These results showed that rs42766480 likely had a major role in the interactions with the PFCT region. However, this SNP was not ranked high (highest ranking #742) among the A×A effects between the SGN and CASD regions. The most significant inter-chromosome A×A effect between CASD and SGN was between rs211309638 in ADCK5-SLC52A2 and rs110352004 in GC-NPFFR2, with a ranking of #37 among all effects. Other than this SNP, the effect rankings of SNPs in CPSF1, DGAT1 and SMPD5 were in the range of #153–#393 (Table 2), less significant than those of the PFCT region (ranking #1–#66, Table 1).
The most important feature of PFCT was that this small 29 Kb region of Chr14a interacted with all chromosomes. The most important feature of CASD was that this region mainly interacted with the SGN region of Chr06. The most important feature of the Chr06 inter-chromosome A×A effects was that the SGN region only interacted with Chr14a, including the PCFT and CASD regions. These results of Chr14a and the SGN region of Chr06 were particularly interesting because Chr14a and the SGN region of Chr06 were two of the most significant regions for milk production traits and the SGN region also was highly significant for somatic cell score and two fertility traits (daughter pregnancy rate and cow conception rate) [1,14].

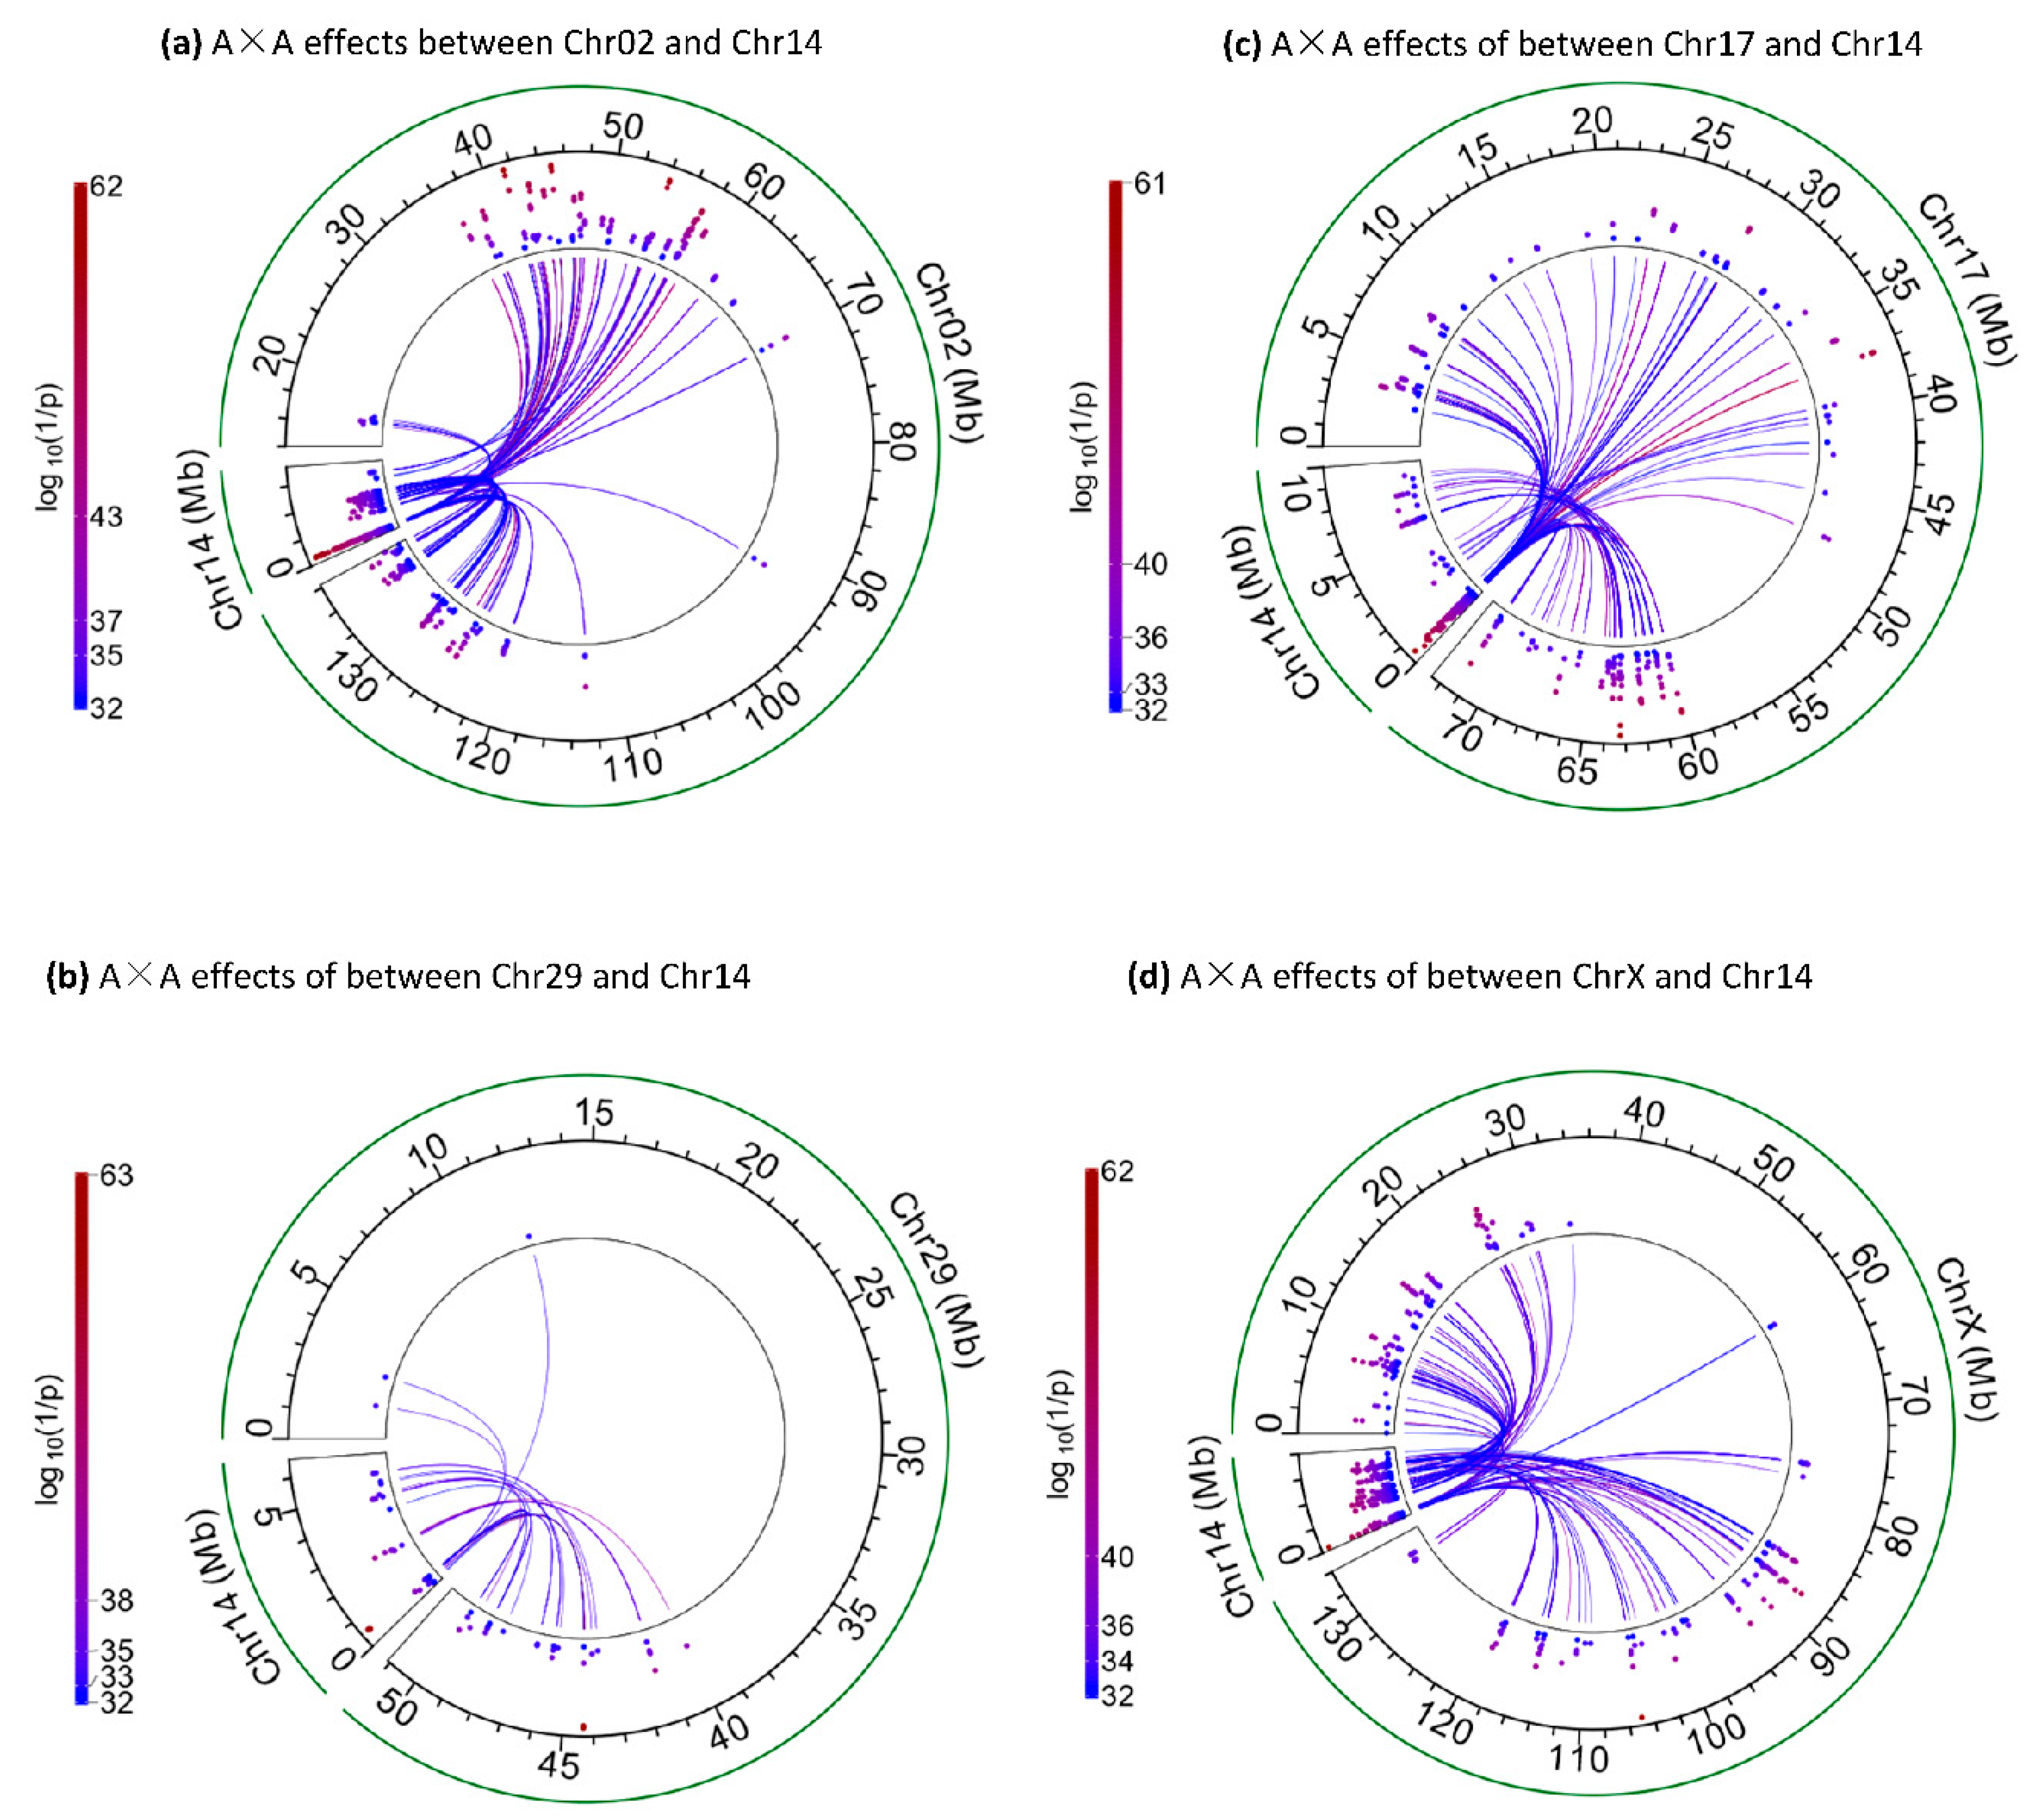
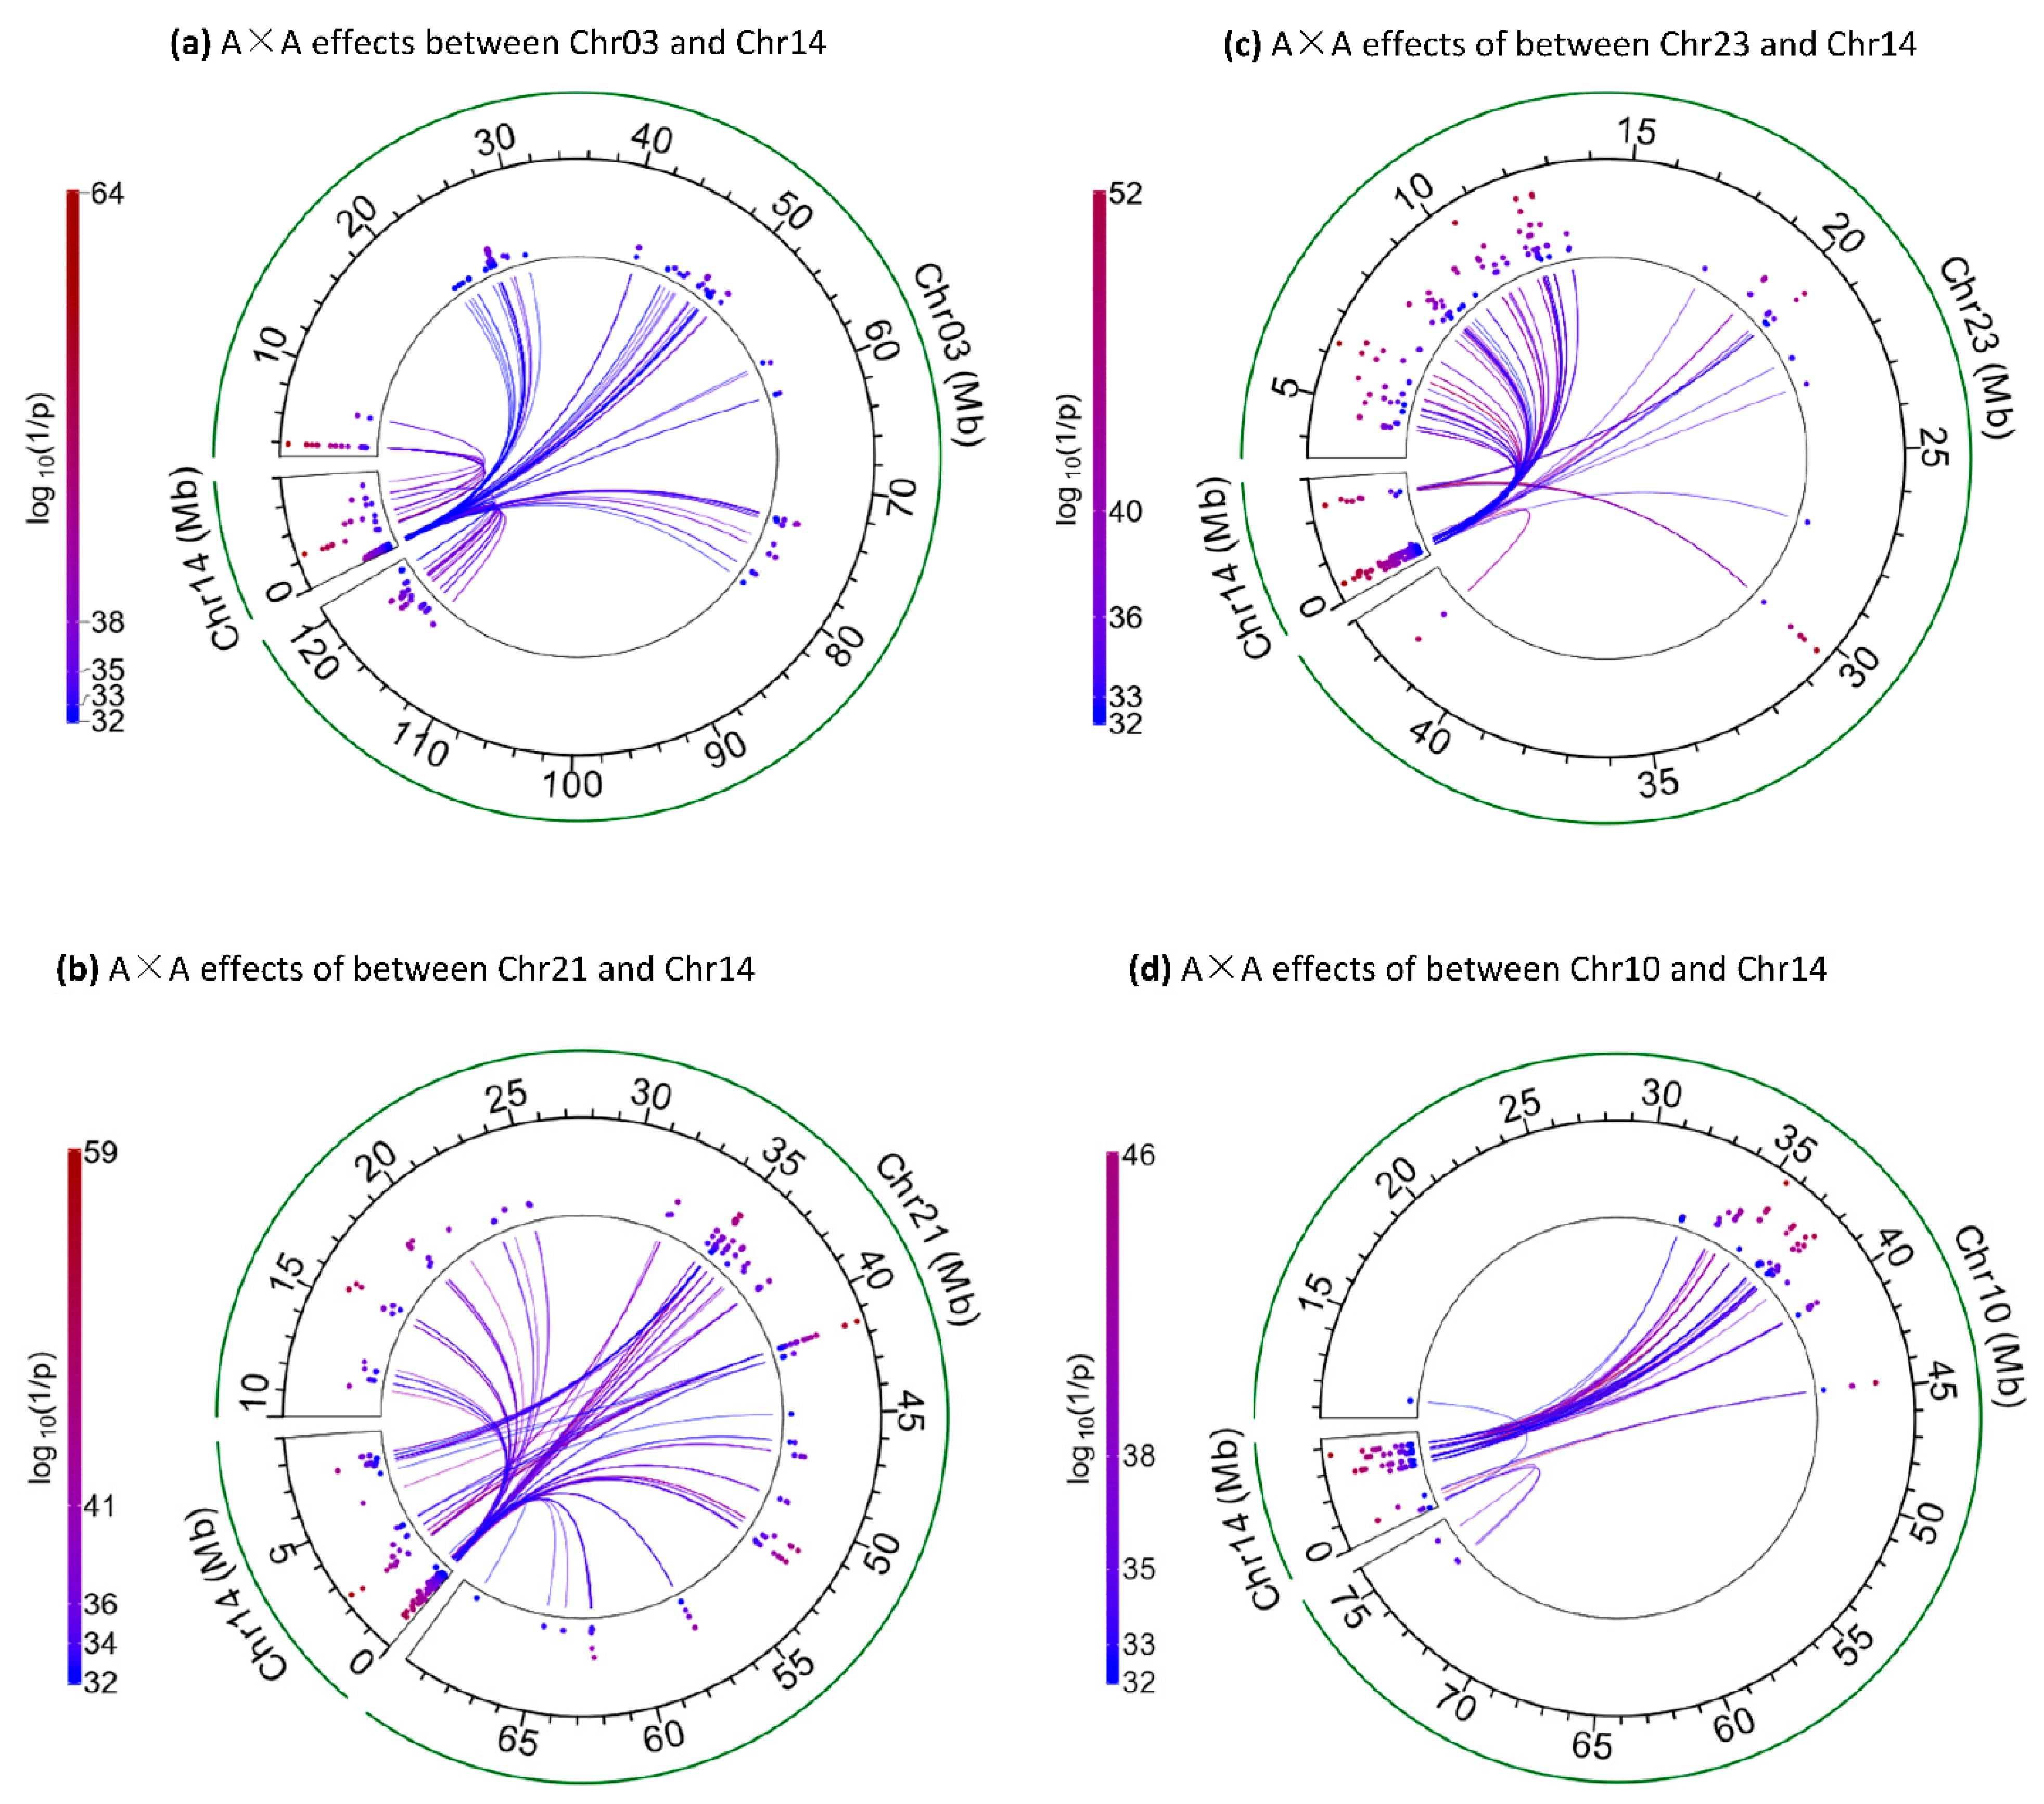
2.4. Other Inter-Chromosome A×A Effects of Chr14a

The Chr14a region had other highly significant inter-chromosome A×A effects, in addition to those with the SGN region of Chr06, including those with Chr02, Chr05, Chr17, Chr29 and ChrX (Table 3, Figure 4). An SNP in LOC789384 (rs109208977), an SNP between ZNF250 and ZNF16 (rs110508680) and an SNP in ARHGAP39 each had a large cluster of inter-chromosome A×A effects, with 260, 195 and 231 inter-chromosome A×A effects, respectively (Figure 2c, Table S1). Of the 20 highly significant effects not involving the SGN region of Chr06 (Table 3), 18 involved SNPs in the PCFT region, further showing a major role of the PCFT region in the inter-chromosome A×A effects for FPC.

2.5. Inter-Chromosome A×A Effects of Chr14b

The Chr14b region about 7.31 Mb in size (Figure 2b,d) [12] was nearly ten times as large as Chr14a (0.74 Mb in size) and had multiple locations with large clusters of inter-chromosome A×A effects. This region was divided into two sub-regions for convenience in describing the results: the 2.28–2.42 Mb region (138.46 Kb in size) as ‘Chr14b1’ and the remaining 7.17 Mb region as ‘Chr14b2’, with Chr14b1 accounting for 2% and Chr14b2 for 98% of Chr14b.
The Chr14b1 region had six significant SNPs in noncoding regions with two uncharacterized coding genes (LOC112449593, LOC112449592) and TRNAC-GCA [18]. These six SNPs had the largest number of inter-chromosome A×A effects (119 pairs) in Chr14b, involving seventeen chromosomes (chromosomes 2, 3, 4, 8, 12, 13, 16, 17, 18, 20, 21, 23, 25, 26, 28, 29, X) (Table S1). The most significant inter-chromosome A×A effect of Chr14b (log10(1/p) = 64.37, #5 ranking) was between rs134537992 in Chr14b1 and rs42368654 about 96.6 Kb downstream of the LMX1A gene of Chr03 (Figure 5a, Table 4). This SNP of Chr03 interacted with 14 SNPs in Chr14b, two SNPs immediately downstream of this SNP interacted with an SNP in KCNK9 in Chr14b2, and two other SNPs interacted with an SNP downstream of the FAM135B gene in Chr14b2. All the other Chr03 SNPs (96 total) interacted with Chr14a (Figure 5a, Table S1). Although nearly the entire Chr03 interacted with Chr14a, the small region interacting with Chr14b1 had the most significant effect of Chr03. Other than the Chr03 region near LMX1A, the most significant effect of Chr14b1 was with Chr21 and Chr23 (Figure 5b,c; Table 4), noting that Chr23 almost interacted with Chr14a only, except for the inter-chromosome A×A effects with Chr14b1 (Figure 5c).
Based on the limited gene information in Chr14b1, two alternative hypotheses for the inter-chromosome A×A effects of the six SNPs in the Chr14b1 region could be made: (1) the noncoding sequences in the Chr14b1 region had biological functions in the form of interactions with other chromosomes for FPC, and (2) any or all LOC112449593, LOC112449592 and TRNAC-GCA genes were responsible for the interactions between the six SNPs in the Chr14b1 region and the seventeen chromosomes due to LD with the significant SNPs. Hypothesis (1) should be the most likely reason for the interactions involving the six SNPs and implies major biological functions of the noncoding regions in the Chr14b1 region in the form of inter-chromosome A×A effects for FPC. Hypothesis (2) implies linked effects of the six SNPs through LD with any or all LOC112449593, LOC112449592 and TRNAC-GCA genes. However, this hypothesis of linked effects was unlikely because the inter-chromosome A×A effects for FPC were unlikely affected in a significant way by LD with causal genes, as shown by the 1.3 Mb gap region of Chr14 (Figure 2b), which had at least 40 coding genes but no significant inter-chromosome A×A effects with log10(1/p) > 32.
The Chr14b2 region had significant inter-chromosome A×A effects mostly in or near four genes, PTK2, TRAPPC9, KCNK9 and FAM135B (Figure 2d, Table 5). The PTK2 gene interacted with eight chromosomes (chromosomes 2, 5, 10, 11, 16, 17, 19, 31), TRAPPC9 with eight chromosomes (chromosomes 2, 5, 10, 11, 17, 20, 28, 31) and KCNK9 with eleven chromosomes (chromosomes 2, 3, 4, 5, 8, 10, 19, 20, 21, 28, 31). This Chr14b2 region had many inter-chromosome A×A effects with ChrX (Figure 4d), which also interacted with Chr14a and Chr14b1. Chr10 almost exclusively interacted with Chr14b2 (Figure 5d). Of the 55 inter-chromosome A×A effects of Chr14b, only six effects were between Chr14a and four SNPs of Chr10, including those between an SNP in GNG2 of Chr10 and three SNPs in DGAT1, PARP10 and PLEC of Chr14a, and between an SNP in LOC789384 of Chr14a and three SNPs of Chr10 (Figure S1, Table S1). The remaining 49 inter-chromosome A×A effects of Chr14b2, except one, were in or near PTK2, TRAPPC9, KCNK9 and GPR20 (Table S1).

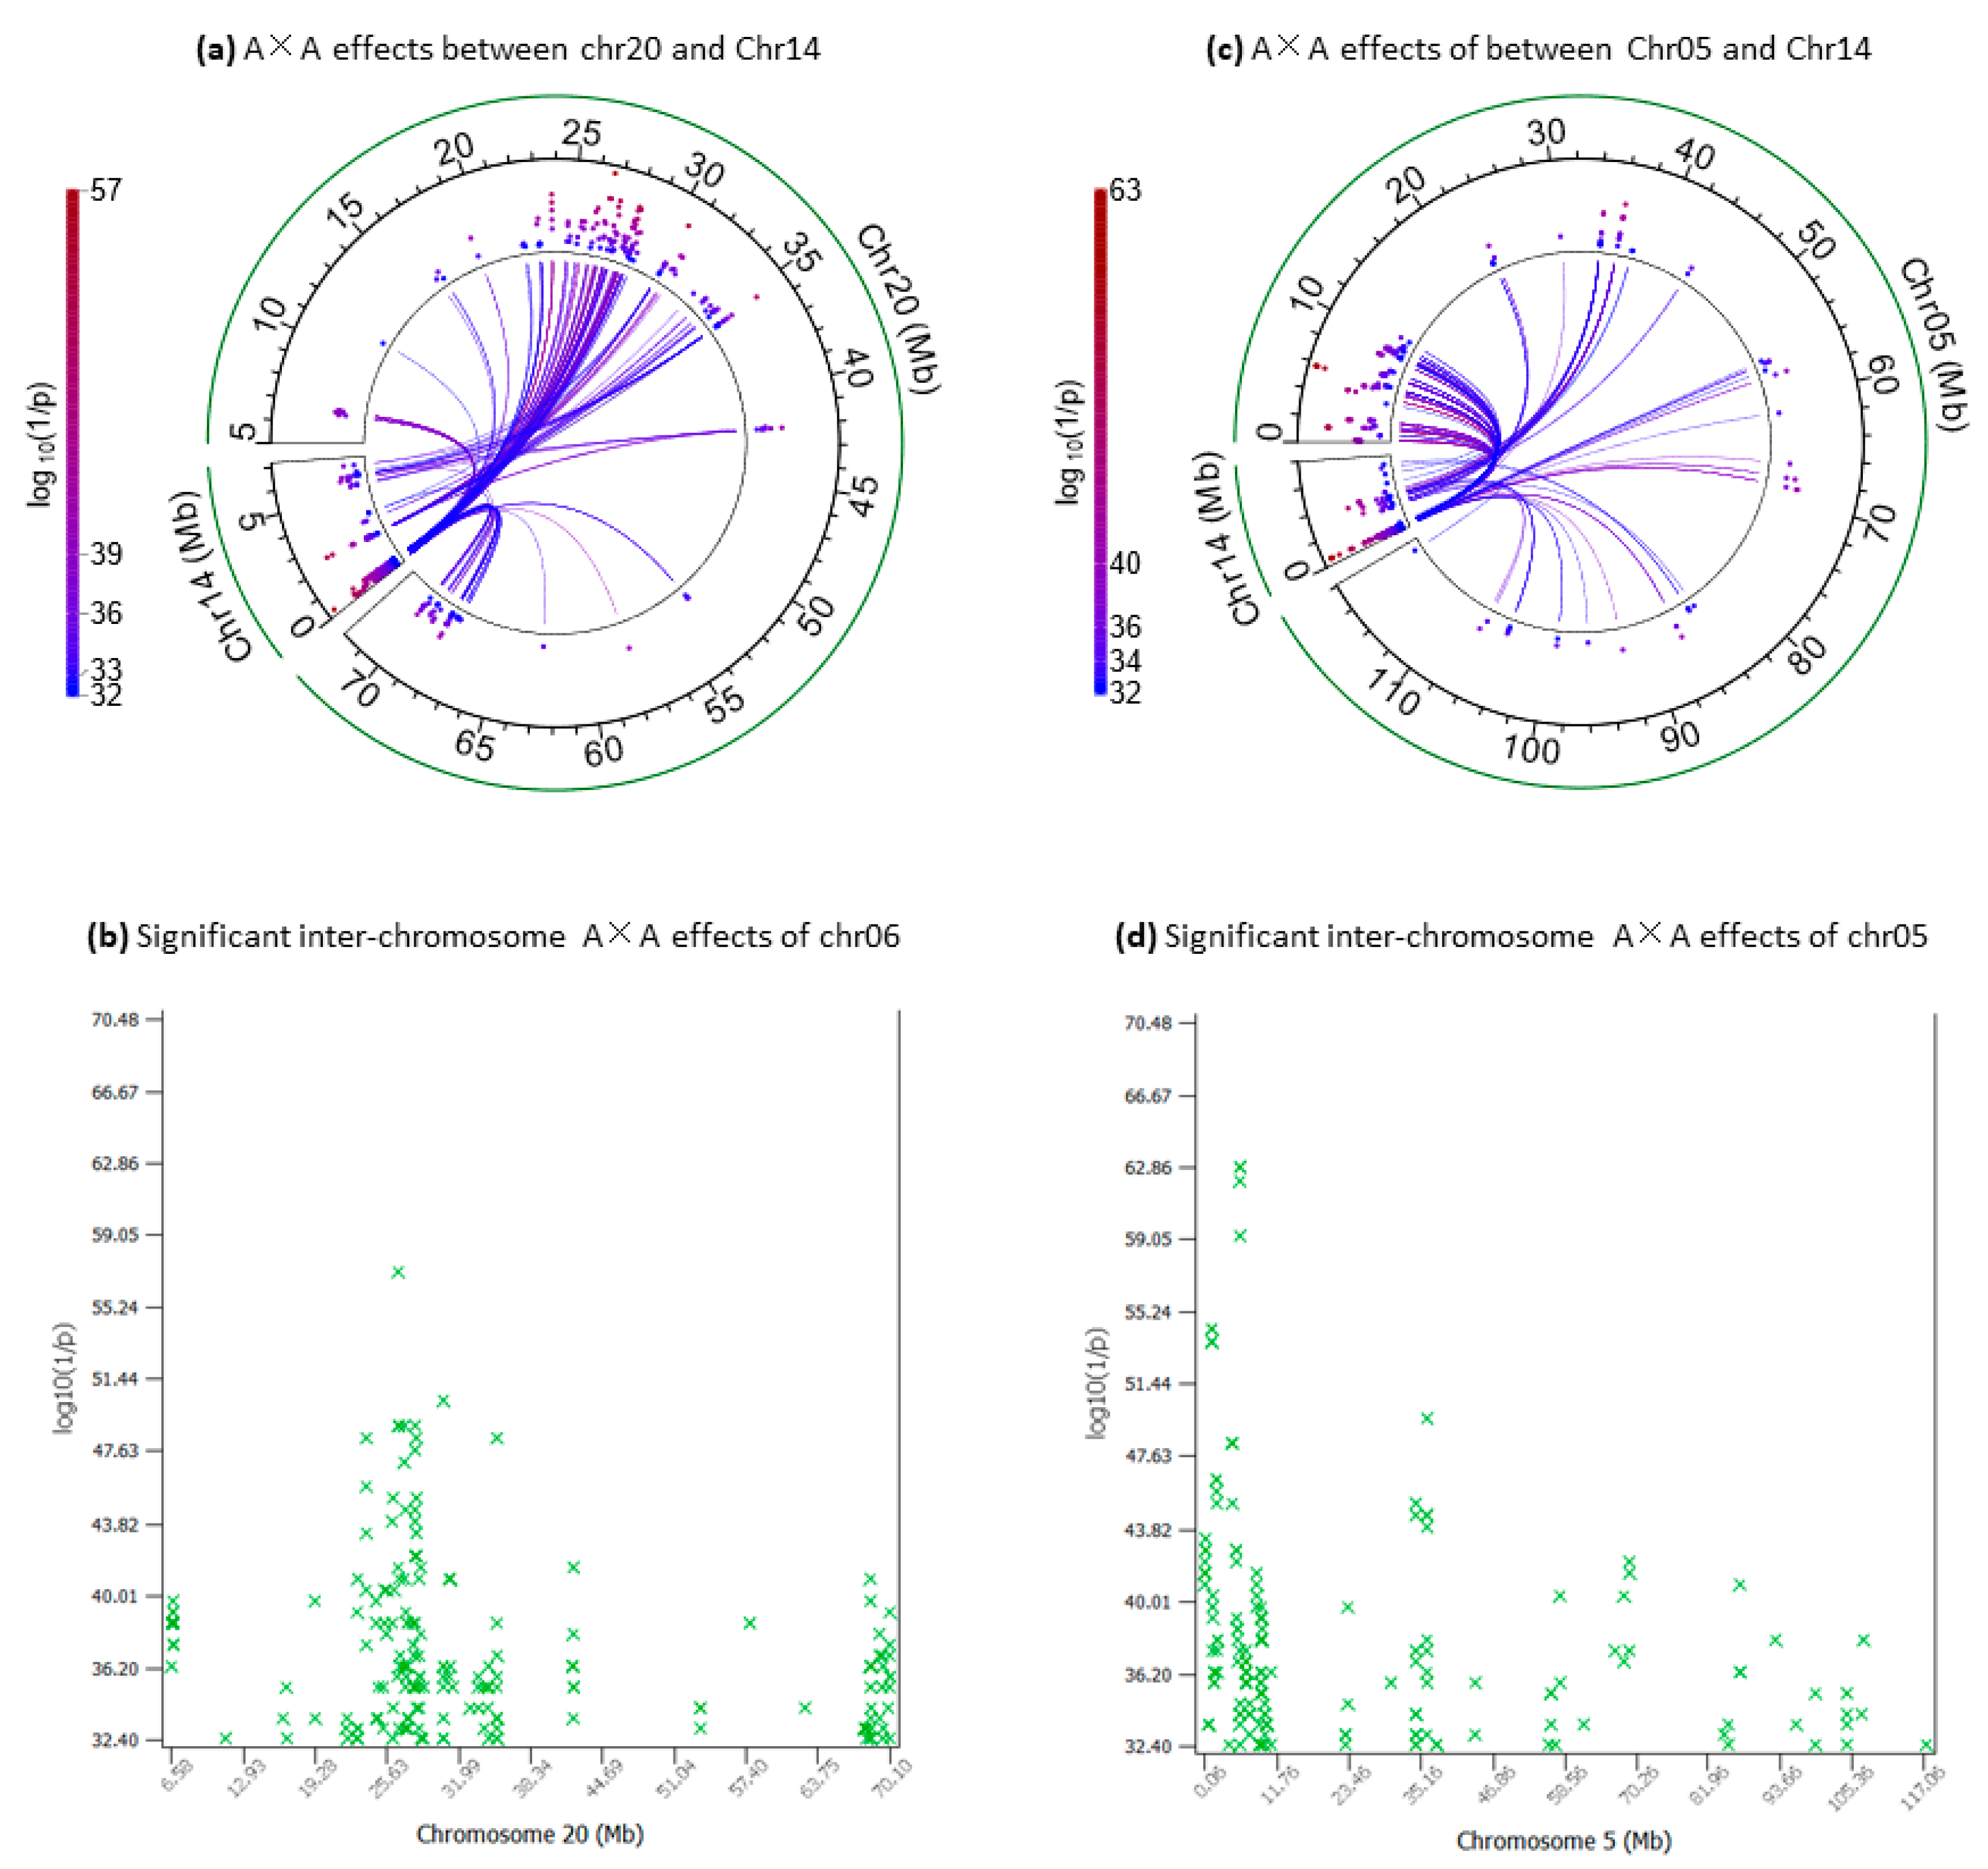
2.6. Inter-Chromosome A×A Effects of Chr20 and Chr05 Interacting with Chr14

Chr20 and Chr05, along with Chr14 and Chr06, also had highly significant additive effects for milk production traits. Therefore, it was of interest to determine whether the Chr20 and Chr05 regions affecting milk production traits also interacted with the Chr14 region for FPC.
The inter-chromosome A×A effects of Chr20 covered a large distance of 63.52 Mb (6.58–70.10 Mb). Chr14a interacted with the 6.58–28.8 Mb region (mostly the 20–28 Mb region) and Chr14b with the 30.61–42.14 Mb region, whereas both Chr14a and Chr14b interacted with the remaining regions of Chr20 (Figure 6a). The most significant inter-chromosome A×A effect of Chr20 (log10(1/p) = 57.12) was that between rs136653182 about 332 Kb downstream of the ITGA1 gene of Chr20 and rs109208977 in LOC789384 of Chr14a (Figure 6a, Table 6). The 20–28 Mb region of Chr20 interacting with Chr14a was near the location with the most significant effects of Chr20 at 31–33 Mb. In contrast, the 30.61–42.14 Mb region of Chr20 interacting with Chr14b had the most significant effects for milk yield among Chr20 SNPs. In particular, the NNT gene had highly significant effects for milk yield and had an SNP interacting with two SNPs in the Chr14b1 region that had the largest cluster of inter-chromosome A×A effects of Chr14b (Figure 4b, Table 3). The most significant A×A effect in the 30.61–42.14 Mb region of Chr20 was that between rs133536911 about 10.59 Kb downstream of the FGF10 gene of Chr20 and rs134537992 in Chr14b1, and rs133536911 also interacted with four other SNPs of Chr14b (Table S1). These results showed that the inter-chromosome A×A effects between Chr20 and the Chr14 region involved the Chr20 region with highly significant effects for milk yield.
The inter-chromosome A×A effects of Chr05 were mostly in the 0.5–10.8 Mb region interacting with Chr14a (Figure 4c, Table 3). The most significant SNP of chr05 was an intergenic SNP (rs109208465) about 71.13 Kb upstream of the BBS10 gene that interacted with six SNPs in PFCT (log10(1/p) = 59.25–62.89) and four SNPs in CASD and SMPD5 (log10(1/p) = 32.40–34.56) of Chr14a. However, the 0.5–10.8 Mb Chr05 region did not have highly significant effects for milk and fat yields or FPC [1]. The MGST1-SLC15A5 region (93.51–93.63 Mb) of Chr05 had highly significant additive effects on fat yield and FPC but this region did not interact with Chr14a or Chr14b for FPC. The SNP closest to the MGST1-SLC15A5 region was rs134855280 at 92.59 Mb, which had a significant inter-chromosome A×A effect with an SNP in LOC789384 of Chr14a. It was interesting that an SNP in EPS8 about 701 Kb downstream of the MGST1-SLC15A5 region had inter-chromosome A×A effects with an SNP in Chr03 and an SNP in Chr20, and these two inter-chromosome A×A effects were the only ones not involving Chr14a or Chr14b (Table S1), noting that EPS8 had highly significant additive effects for FPC. The 23–44 Mb region had significant SNP additive effects for milk and fat yields, and this large region interacted with both Chr14a and Chr14b for FPC (Table S1).

2.7. Patterns of A×A Epistasis Effects

The A×A values of the four allelic combinations (AB, Ab, aB, ab) of each pair of loci typically had large absolute values for the most positive and negative allelic combinations. Let AC1, AC2, AC3 and AC4 represent the four allelic combinations from the most positive combination to most negative combination and let aa1-aa4 represent the A×A values of AC1-AC4, where ‘AC’ stands for ‘allelic combination’. Then, AC1 and AC4 had the largest absolute A×A values, whereas AC2 and AC3 had considerably smaller absolute A×A values than those of AC1 and AC4 (Table S1, Table 7 and Table 8). Consequently, the size of the A×A effect of two loci as a contrast of aa1-aa4 (Equations (1) and (2) in Materials and Methods) was mostly determined by the A×A values of AC1 and AC4. Therefore, the discussion of A×A patterns focused on the A×A values of AC1 and AC4, which had two patterns: (1) the two A×A values involved the same chr14 allele and two non-Chr14 alleles such as the 1_1 allelic combination for AC1 and 1_2 allelic combination for AC4, and (2) the A×A values involved two chr14 alleles and the same non-Chr14 allele, such as 1_1 for AC1 and 2_1 for AC4. Most Chr14a A×A values (1554 out of 2148, or 72%) had pattern (1), whereas most Chr14b A×A values (346 out of 613, or 56%) had pattern (2). It was interesting that no AC1 and AC4 of any SNP pair involved completely different alleles, such as 1_1 for AC1 and 2_2 for AC4, or 1_2 for AC1 and 2_1 for AC4.
Table 7 shows examples of the Chr14a A×A values where the AC1 and AC4 of each SNP pair had the same Chr14a allele and two different non-Chr14 alleles. SNP rs109421300 of DGAT1 should be a highly recognizable SNP because this SNP had the most significant effects for all five production traits: milk, fat and protein yields and fat and protein percentages. Allele 1 of rs109421300 had an extreme antagonism between fat yield and milk and protein yields, with the most positive effect for fat yield and FPC and most negative effects for milk and protein yields [1]. In this study, allele 1 of rs109421300 was the common Chr14a allele of AC1 and AC4 for all nine pairs of A×A values, and each of the nine SNPs in the SGN region of Chr06 had both alleles in AC1 and AC4. The AC1 and AC4 for seven of the nine SNP pairs had similar absolute values, indicating that these AC1 and AC4 were approximately symmetric. The combination of allele 1 of rs109421300 with a Chr06 allele was positive (aa1, Table 7), whereas the combination of allele 1 of rs109421300 with the alternative Chr06 allele of each Chr06 SNP was negative (aa4, Table 7). The other A×A values of Chr14a had similar patterns. The results of Table 7 indicate that one allele of a Chr14a SNP interacted with both alleles of a non-Chr14 SNP for most of the significant SNP pairs involving Chr14a.
Table 8 shows examples of the Chr14b A×A values where the AC1 and AC4 of each SNP pair had the same non-Chr14 allele and two different Chr14b alleles. Allele 1 of SNP rs42368654 downstream of LMX1A of Chr03 was the common allele of AC1 and AC4 with five SNPs of Chr14b1.The size of AC1 was 2–5 times as large as that of AC4 for the five A×A values, indicating that the interaction between allele 1 of rs42368654 of Chr03 and one Chr14b1 was the main contributor of the five A×A values. Of the twenty SNP pairs in Table 8, the size of AC1 was larger than that of AC4 for eighteen pairs, AC4 was larger than AC1 for two pairs, and AC1 and AC2 had approximately the same sizes for two pairs.

3. Materials and Methods

3.1. Holstein Population and SNP Data

The Holstein population in this study had 1,231,898 first lactation cows with phenotypic observations of fat percentage (FPC) and genotypes of 78,964 original and imputed SNPs. The SNP genotypes were from 32 SNP chips with various densities and were imputed to 78,964 SNPs via the FindHap algorithm [19] as a routine procedure for genomic evaluation by the Council on Dairy Cattle Breeding (CDCB) [20]. The phenotypic values used in the GWAS analysis were the phenotypic residuals after removing fixed non-genetic effects available from the December 2022 U.S. Holstein genomic evaluation by the CDCB. Basic statistics of the cows and phenotypic data of FPC are given in Table S2. With the requirement of a 0.05 minor allele frequency, the number of SNPs for the GWAS analysis was 75,198 SNPs. A strict criterion of log10(1/p) > 32 was used to declare the statistical significance of any inter-chromosome epistasis effect. This requirement ensured that any significant effect had better statistical significance than that of the highest statistical significance of log10(1/p) = 32 shown in Figure 2a,b. The log10(1/p) > 32 requirement was stricter than the requirement of log10(1/p) > 12 for the Bonferroni correction with 0.05 genome-wide false positives. The SNP and gene positions were those from the ARS-UCD1.3 cattle genome assembly [21]. Genes containing or in the proximity of highly significant effects were identified as candidate genes affecting FPC.

3.2. GWAS Analysis

The A×A value of each of the four allelic combinations (AB, Ab, aB, ab) of two loci was calculated as the deviation of the mean of the allelic combination from the population mean and the additive values of the two alleles in the allelic combination [22,23]:
( aa ) ik = μ ik μ a i a k
where ( aa ) ik = A×A value of allelic combination of the i th allele of locus 1 (A or a allele) and the k th allele of locus 2 (B or b allele), μ ik = the mean of the genotypic values with allelic combination of the i th allele of locus 1 (A or a allele) and the k th allele of locus 2 (B or b allele), μ = the population mean of genotypic values, a i = μ i μ (i = A or a) = additive value of i th allele of locus 1 (A or a allele), a k = μ k μ (k = B or b) = additive value of the k th allele of locus 2 (B or b allele), μ i = the mean of genotypic values with the i th allele of locus 1 (A or a allele), and μ k = the mean of genotypic values with the k th allele of locus 2 (B or b allele).
The A×A effect of two loci was calculated as a contrast of the four A×A values and this contrast was further expressed as the A×A contrast of the nine genotypic values for epistasis testing [24]:
α α = [ ( aa ) A B ( aa ) A b ] [ ( aa ) a B ( aa ) a b ]         = [ ( aa ) A B ( aa ) a B ] [ ( aa ) A b ( aa ) a b ]         = ( μ A B μ A b ) ( μ a B μ a b )         = ( μ A B μ a B ) ( μ A b μ a b )         =   L a × a = s a × a g
where α α = A×A effect of the two loci as a contrast of the four A×A values of the four allelic combinations of the two loci; ( aa ) A B , ( aa ) A b , ( aa ) a B and ( aa ) a b are the four A×A values of the four allelic combinations of A B , A b , a B and a b , respectively, defined by Equation (1); μ A B = the mean of genotypic values with the A B allelic combination, μ A b = the mean of genotypic values with the A b allelic combination, μ a B = the mean of genotypic values with the a B allelic combination, μ a b = the mean of genotypic values with the a b allelic combination; g = column vector of the nine SNP genotypic values of the two loci: g A A B B , g A A B b , g A A b b , g A a B B , g A a B b , g A a b b , g a a B B , g a a B b , g a a b b ; s a × a = row vector of the A×A contrast coefficients of nine SNP genotypic values; and   L a × a = A×A effect of the two loci as a contrast of the nine SNP genotypic values. In the absence of allelic interactions between the two loci, the A×A effect of Equation (2) is expected to be null because each A×A value is expected to be null. In the presence of an allele × allele interaction between the two loci, the [ ( aa ) A B ( aa ) A b ] [ ( aa ) a B ( aa ) a b ] definition of the A×A effect indicates that the allelic difference of locus 2 changes in the presence of the two different alleles of locus 1, whereas the [ ( aa ) A B ( aa ) a B ] [ ( aa ) A b ( aa ) a b ] definition of A×A effect indicates that the allelic difference of locus 1 changes in the presence of the two different alleles of locus 2. Therefore, a significant A×A effect expressed as L a × a = s a × a g indicates the presence of an allele × allele interaction between the two loci due to the equivalence between this expression and any of the other four expressions in Equation (2).
The GWAS analysis of A×A effects used an approximate generalized least squares (AGLS) method. The AGLS method combines the least squares (LS) tests implemented by EPISNP1mpi [25,26] with the estimated breeding values from routine genetic evaluation using the entire U.S. Holstein population. The statistical model was
y = μ I + X g g + Z a + e = X b + Z a + e
where y = column vector of phenotypic deviation after removing fixed nongenetic effects such as heard-year-season (termed as ‘yield deviation’ for any trait) using a standard procedure for the CDCB/USDA genetic and genomic evaluation; µ = common mean; I = identity matrix; g = column vector of genotypic values; X g = model matrix of g; b = ( μ ,   g ) , X = ( I ,   X g ) ; a = column vector of additive polygenic values; Z = model matrix of a; and e = column vector of random residuals. The first and second moments of Equation (3) are E ( y ) = X b and var ( y ) = V = Z G Z + R = σ a 2 Z A Z + σ e 2 I , where σ a 2 = additive variance, A = additive relationship matrix and σ e 2 = residual variance. The problem of estimating the b vector that includes SNP genotypic values in Equation (3) is the requirement of inverting the V if the generalized least squares (GLS) method is used, or inverting the A matrix and the coefficient matrix of the mixed model equations (MME) if the MME method is used [27]. However, both V and MME could not be inverted for our sample size. To avoid inverting these large matrices, the GWAS used the method of approximate GLS (AGLS), which replaces the polygenic additive values (a) with the best linear unbiased prediction based on pedigree relationships [1]. The AGLS method is based on the following results:
b ^ = ( X V 1 X ) X V 1 y
b ^ = ( X R 1 X ) ( X R 1 y X R 1 Z a ^ )         = ( X X ) X ( y Z a ^ ) = ( X X ) X y *
where y * = y Z a ^ and a ^ is the best linear unbiased prediction (BLUP) of a. Equation (4) is the GLS solution, and Equation (5) is the MME solution of b. These two equations yield identical results, and b ^ from either equation is termed the best linear unbiased estimator (BLUE) [27]. If a ^ is known, the LS version of BLUE given by Equation (5) is computationally efficient relative to the GLS of Equation (4), requiring the V inverse, or the joint MME solutions of b ^ and a ^ , requiring the inverse of the coefficient matrix of the MME. The AGLS method uses two approximations. The first approximation is to use a ˜ from routine genetic evaluation as an approximation of a ^ in Equation (5):
b ^ = ( X X ) X ( y Z a ˜ ) = ( X X ) X y *
where y * = y Z a ˜ , and a ˜ is the column vector of 2(PTA), with PTA being the predicted transmission ability from the routine genetic evaluation. Equation (6) achieves the benefit of sample stratification correction from mixed models using pedigree relationships without the computing difficulty of inverting V or A. The second approximation of the AGLS approach is the t-test using the LS rather than the GLS formula of the t-statistic, to avoid using the V inverse in the GLS formula. The significance tests for A×A SNP effects used the t-tests of the A×A contrast of the estimated two-locus SNP genotypic values [24,25]:
t a × a = | L a × a | var ( L a × a ) = | s a × a g ^ | v s a × a ( X X ) gg s a × a
where L a × a = A×A contrast of the nine genotypic values defined by Equation (1); var ( L a × a ) = standard deviation of L a × a ; s a × a = row vector of A×A contrast coefficients; v 2 = ( y X b ^ ) ( y X b ^ ) / ( n k ) = estimated residual variance; g ^ = column vector of the AGLS estimates of the nine SNP genotypic values of the two loci; and ( X X ) gg = submatrix of ( X X ) corresponding to g ^ .

4. Conclusions

This GWAS using over 1.2 million Holstein cows confirmed that a Chr14 region about 9.38 Mb region in size had significant inter-chromosome additive × additive (A×A) effects with all chromosomes for FPC in two sub-regions separated by a gap region without significant inter-chromosome A×A effects. Inside this 9.38 Mb region, a 0.75 Mb region known to have highly significant additive effects of FPC had most of the inter-chromosome A×A effects, including those with a Chr06 region that was known to have highly significant additive effects for some production, reproduction and health traits. This GWAS using an unprecedentedly large sample provides high-confidence evidence that FPC is affected by genome-wide allele × allele interactions centered in the 9.38 Mb Chr14 region.

Supplementary Materials

The supporting information can be downloaded at: https://www.mdpi.com/article/10.3390/ijms25010674/s1.

Author Contributions

Y.D. conceived this study. D.P. conducted the data analysis. Z.L., H.B.Z., P.M.V. and C.P.V.T. contributed to data work and manuscript reviews. Z.L. provided software code for inter-chromosome specific epistasis tests. Y.D. and D.P. prepared the manuscript. All authors have read and agreed to the published version of the manuscript.

Funding

This research was supported by the National Institutes of Health’s National Human Genome Research Institute, grant R01HG012425, as part of the NSF/NIH Enabling Discovery through GEnomics (EDGE) Program; grant 2020-67015-31133 from the USDA National Institute of Food and Agriculture; and project MIN-16-144 of the Agricultural Experiment Station at the University of Minnesota. The funders had no role in the study design, data collection and analysis, decision to publish or preparation of the manuscript.

Institutional Review Board Statement

Ethical review and approval were waived because this study used existing data only and did not involve the use of live animals.

Informed Consent Statement

Not applicable.

Data Availability Statement

The original genotype data are owned by third parties and maintained by the Council on Dairy Cattle Breeding (CDCB). A request to the CDCB is necessary to obtain data access for research, which may be sent to João Dürr, CDCB Chief Executive Officer ([email protected]). All other relevant data are available in the manuscript and Supplementary Materials.

Acknowledgments

Members of the Council on Dairy Cattle Breeding (CDCB) and the Cooperative Dairy DNA Repository (CDDR) are acknowledged for providing the dairy genomic evaluation data. The Ceres and Atlas high-performance computing systems of USDA-ARS were used for the data analysis. Steven Schroeder and Ransom Baldwin are acknowledged for their help in using the USDA-ARS computing facilities. The use of the USDA-ARS computers by this research was supported by USDA-ARS projects 8042-31000-002-00-D and 8042-31000-001-00-D.

Conflicts of Interest

The authors declare no conflicts of interest.

References

  1. Jiang, J.; Ma, L.; Prakapenka, D.; VanRaden, P.M.; Cole, J.B.; Da, Y. A large-scale genome-wide association study in US Holstein cattle. Front. Genet. 2019, 10, 412. [Google Scholar] [CrossRef] [PubMed]
  2. Jiang, J.; Cole, J.B.; Freebern, E.; Da, Y.; VanRaden, P.M.; Ma, L. Functional annotation and Bayesian fine-mapping reveals candidate genes for important agronomic traits in Holstein bulls. Commun. Biol. 2019, 2, 212. [Google Scholar] [CrossRef]
  3. Grisart, B.; Farnir, F.; Karim, L.; Cambisano, N.; Kim, J.-J.; Kvasz, A.; Mni, M.; Simon, P.; Frère, J.-M.; Coppieters, W. Genetic and functional confirmation of the causality of the DGAT1 K232A quantitative trait nucleotide in affecting milk yield and composition. Proc. Natl. Acad. Sci. USA 2004, 101, 2398–2403. [Google Scholar] [CrossRef] [PubMed]
  4. Spelman, R.; Ford, C.; McElhinney, P.; Gregory, G.; Snell, R. Characterization of the DGAT1 gene in the New Zealand dairy population. J. Dairy Sci. 2002, 85, 3514–3517. [Google Scholar] [CrossRef] [PubMed]
  5. Schennink, A.; Stoop, W.M.; Visker, M.W.; Heck, J.M.; Bovenhuis, H.; Van Der Poel, J.J.; Van Valenberg, H.J.; Van Arendonk, J.A. DGAT1 underlies large genetic variation in milk-fat composition of dairy cows. Anim. Genet. 2007, 38, 467–473. [Google Scholar] [CrossRef]
  6. Cole, J.B.; Wiggans, G.R.; Ma, L.; Sonstegard, T.S.; Lawlor, T.J.; Crooker, B.A.; Van Tassell, C.P.; Yang, J.; Wang, S.; Matukumalli, L.K.; et al. Genome-wide association analysis of thirty one production, health, reproduction and body conformation traits in contemporary US Holstein cows. BMC Genom. 2011, 12, 408. [Google Scholar] [CrossRef]
  7. Ma, L.; Wiggans, G.R.; Wang, S.; Sonstegard, T.S.; Yang, J.; Crooker, B.A.; Cole, J.B.; Van Tassell, C.P.; Lawlor, T.J.; Da, Y. Effect of sample stratification on dairy GWAS results. BMC Genom. 2012, 13, 536. [Google Scholar] [CrossRef] [PubMed]
  8. Thaller, G.; Kramer, W.; Winter, A.; Kaupe, B.; Erhardt, G.; Fries, R. Effects of DGAT1 variants on milk production traits in German cattle breeds. J. Anim. Sci. 2003, 81, 1911–1918. [Google Scholar] [CrossRef] [PubMed]
  9. Barbosa da Silva, M.V.G.; Sonstegard, T.S.; Thallman, R.M.; Connor, E.E.; Schnabel, R.D.; Van Tassell, C.P. Characterization of DGAT1 allelic effects in a sample of North American Holstein cattle. Anim. Biotechnol. 2010, 21, 88–99. [Google Scholar] [CrossRef] [PubMed]
  10. Prakapenka, D.; Liang, Z.; Jiang, J.; Ma, L.; Da, Y. A Large-scale genome-wide association study of epistasis effects of production traits and daughter pregnancy rate in US Holstein cattle. Genes 2021, 12, 1089. [Google Scholar] [CrossRef] [PubMed]
  11. Chr14a. Ensembl Genome Browzer 109. Available online: https://useast.ensembl.org/Bos_taurus/Location/Overview?r=14:146715-890000;db=core (accessed on 5 December 2023).
  12. Chr14b. Ensembl Genome Browzer 109. Available online: https://useast.ensembl.org/Bos_taurus/Location/Overview?r=14:2216794-9519745;db=core (accessed on 5 December 2023).
  13. Chr14 Gap Region. Ensembl Genome Browzer 109. Available online: https://useast.ensembl.org/Bos_taurus/Location/Overview?r=14:900000-2216794;db=core (accessed on 5 December 2023).
  14. Liang, Z.; Prakapenka, D.; VanRaden, P.M.; Jiang, J.; Ma, L.; Da, Y. A Million-Cow Genome-Wide Association Study of Three Fertility Traits in US Holstein Cows. Int. J. Mol. Sci. 2023, 24, 10496. [Google Scholar] [CrossRef] [PubMed]
  15. Prakapenka, D.; Liang, Z.; Da, Y. Genome-wide association study of age at first calving in US Holstein cows. Int. J. Mol. Sci. 2023, 24, 7109. [Google Scholar] [CrossRef] [PubMed]
  16. Freebern, E.; Santos, D.J.; Fang, L.; Jiang, J.; Parker Gaddis, K.L.; Liu, G.E.; VanRaden, P.M.; Maltecca, C.; Cole, J.B.; Ma, L. GWAS and fine-mapping of livability and six disease traits in Holstein cattle. BMC Genom. 2020, 21, 41. [Google Scholar] [CrossRef] [PubMed]
  17. Gaddis, K.P.; Null, D.; Cole, J. Explorations in genome-wide association studies and network analyses with dairy cattle fertility traits. J. Dairy Sci. 2016, 99, 6420–6435. [Google Scholar] [CrossRef] [PubMed]
  18. Chr14b1 Region from NCBI. The National Center for Biotechnology Information. Available online: https://www.ncbi.nlm.nih.gov/genome/gdv/browser/genome/?chr=14&from=2282659&to=2421119&id=GCF_002263795.2 (accessed on 5 December 2023).
  19. VanRaden, P.M.; Sun, C.; O’Connell, J.R. Fast imputation using medium or low-coverage sequence data. BMC Genet. 2015, 16, 82. [Google Scholar] [CrossRef] [PubMed]
  20. CDCB. Genomic Evaluations. Available online: https://uscdcb.com/genomic-evaluations/ (accessed on 5 December 2023).
  21. National Library of Medicine (NCBI). Available online: https://www.ncbi.nlm.nih.gov/genome/82?genome_assembly_id=1850378 (accessed on 5 December 2023).
  22. Kempthorne, O. The correlation between relatives in a random mating population. Proc. R. Soc. Lond. Ser. B-Biol. Sci. 1954, 143, 103–113. [Google Scholar] [CrossRef] [PubMed]
  23. Kempthorne, O. An Introduction to Genetic Statistics; Wiley: New York, NY, USA, 1957. [Google Scholar]
  24. Mao, Y.; London, N.R.; Ma, L.; Dvorkin, D.; Da, Y. Detection of SNP epistasis effects of quantitative traits using an extended Kempthorne model. Physiol. Genom. 2006, 28, 46–52. [Google Scholar] [CrossRef] [PubMed]
  25. Ma, L.; Runesha, H.B.; Dvorkin, D.; Garbe, J.; Da, Y. Parallel and serial computing tools for testing single-locus and epistatic SNP effects of quantitative traits in genome-wide association studies. BMC Bioinform. 2008, 9, 315. [Google Scholar] [CrossRef] [PubMed]
  26. Weeks, N.T.; Luecke, G.R.; Groth, B.M.; Kraeva, M.; Ma, L.; Kramer, L.M.; Koltes, J.E.; Reecy, J.M. High-performance epistasis detection in quantitative trait GWAS. Int. J. High Perform. Comput. Appl. 2016, 32, 1094342016658110. [Google Scholar] [CrossRef]
  27. Henderson, C. Applications of Linear Models in Animal Breeding; University of Guelph: Guelph, ON, Canada, 1984. [Google Scholar]
Figure 1. Significant inter-chromosome A×A effects of FPC (log10(1/p) > 32). (a) The 0.14–9.52 Mb region of Chr14 (marked by the red arrow) had significant inter-chromosome A×A effects with all chromosomes. (b) Significant inter-chromosome A×A effects of each chromosome.
Ijms 25 00674 g001
Figure 2. Inter-chromosome A×A effects of Chr14. (a) Significant inter-chromosome A×A effects of Chr14 among the top 50,000 pairs of inter-chromosome A×A effects. Effects with log10(1/p) > 32 were considered statistically significant. (b) Inter-chromosome A×A effects of the 0.14–9.52 Mb region with two sub-regions of Chr14a and Chr14b that were separated by a 1.3 Mb gap region. Effects with log10(1/p) > 32 were considered statistically significant. (c) Inter-chromosome A×A effects of Chr14a with log10(1/p) > 32. (d) Inter-chromosome A×A effects of Chr14b with log10(1/p) > 32.
Ijms 25 00674 g002
Figure 3. Significant inter-chromosome A×A effects of FPC between Chr14a and Chr06 with log10(1/p) > 32. (a) Inter-chromosome A×A effects of Chr06. (b) Inter-chromosome A×A effects between Chr14a and the SGN region Chr06. (c) Manhattan plot of statistical significance of inter-chromosome A×A effects of Chr06. (d) Manhattan plot of statistical significance of inter-chromosome A×A effects between Chr14a and the SGN region Chr06.
Ijms 25 00674 g003
Figure 4. Examples of significant inter-chromosome A×A effects of Chr14 for FPC with log10(1/p) > 32. (a) Inter-chromosome A×A effects of Chr02. (b) Inter-chromosome A×A effects of Chr29. (c) Inter-chromosome A×A effects of Chr17. (d) Inter-chromosome A×A effects of ChrX.
Ijms 25 00674 g004
Figure 5. Inter-chromosome A×A effects of Chr03 and Chr10 for FPC. (a) Inter-chromosome A×A effects between Chr03 and Chr14. (b) Inter-chromosome A×A effects between Chr21 and Chr14. (c) Inter-chromosome A×A effects between Chr23 and Chr14. (d) Inter-chromosome A×A effects between Chr10 and Chr14.
Ijms 25 00674 g005
Figure 6. Inter-chromosome A×A effects of Chr20 and Chr05 for FPC. (a) Inter-chromosome A×A effects between Chr20 and Chr14. (b) Manhattan plot of statistical significance of inter-chromosome A×A effects of Chr20. (c) Inter-chromosome A×A effects between Chr05 and Chr14. (d) Manhattan plot of statistical significance of inter-chromosome A×A effects of Chr05.
Ijms 25 00674 g006
Table 1. Inter-chromosome A×A effects between four SNPs in the PFCT region of Chr14a and six SNPs in SLC4A4- NPFFR2 of Chr06.
SNP-1Chr-1Pos-1Gene-1SNP-2Chr-2Pos-2Gene-2Effectlog10(1/p)Rank
rs10914637114465742PPP1R16Ars42766480687156735GC-NPFFR20.006267.394
rs10914637114465742PPP1R16Ars110352004687213962GC-NPFFR2−0.005858.5335
rs11098457214468124PPP1R16A-FOXH1rs137302420686751807SLC4A4−0.005855.7259
rs11098457214468124PPP1R16A-FOXH1rs109512265686753255SLC4A40.005856.4253
rs11098457214468124PPP1R16A-FOXH1rs110953922686755896SLC4A40.005856.4254
rs11098457214468124PPP1R16A-FOXH1rs109901151686762457SLC4A40.005857.8238
rs11098457214468124PPP1R16A-FOXH1rs42766480687156735GC-NPFFR2−0.006470.481
rs11098457214468124PPP1R16A-FOXH1rs110352004687213962GC-NPFFR20.006062.1512
rs13772746514487527CYHR1rs137302420686751807SLC4A40.005755.7261
rs13772746514487527CYHR1rs109901151686762457SLC4A4−0.005757.1246
rs13772746514487527CYHR1rs42766480687156735GC-NPFFR20.006368.923
rs13772746514487527CYHR1rs110352004687213962GC-NPFFR2−0.005961.4221
rs13747201614494621CYHR1-TONSLrs137302420686751807SLC4A4−0.005855.7266
rs13747201614494621CYHR1-TONSLrs109512265686753255SLC4A40.005856.4255
rs13747201614494621CYHR1-TONSLrs110953922686755896SLC4A40.005856.4256
rs13747201614494621CYHR1-TONSLrs109901151686762457SLC4A40.005857.8240
rs13747201614494621CYHR1-TONSLrs42766480687156735GC-NPFFR2−0.006469.702
rs13747201614494621CYHR1-TONSLrs110352004687213962GC-NPFFR20.006061.4222
Pos is the chromosome position of the SNP.
Table 2. Inter-chromosome A×A effects between four SNPs in CASDS region of Chr14a and the SGN region of Chr06.
SNP-1Chr-1Pos-1Gene-1SNP-2Chr-2Pos-2Gene-2Effectlog10(1/p)Rank
rs13443244214550784CPSF1rs137302420686751807SLC4A4−0.005650.30178
rs13443244214550784CPSF1rs109512265686753255SLC4A40.005650.96164
rs13443244214550784CPSF1rs110953922686755896SLC4A40.005650.96165
rs13443244214550784CPSF1rs109901151686762457SLC4A40.005551.63153
rs13443244214550784CPSF1rs110352004687213962GC-NPFFR20.005551.63154
rs21130963814572120ADCK5-SLC52A2rs137302420686751807SLC4A4−0.005955.7268
rs21130963814572120ADCK5-SLC52A2rs109512265686753255SLC4A40.005956.4257
rs21130963814572120ADCK5-SLC52A2rs110953922686755896SLC4A40.005956.4258
rs21130963814572120ADCK5-SLC52A2rs109901151686762457SLC4A40.005957.1249
rs21130963814572120ADCK5-SLC52A2rs110352004687213962GC-NPFFR20.006058.5337
rs10942130014609870DGAT1rs137302420686751807SLC4A40.005549.64191
rs10942130014609870DGAT1rs109512265686753255SLC4A4−0.005650.30179
rs10942130014609870DGAT1rs110953922686755896SLC4A4−0.005550.30180
rs10942130014609870DGAT1rs109901151686762457SLC4A4−0.005550.96166
rs10942130014609870DGAT1rs110352004687213962GC-NPFFR2−0.005550.30181
rs13554965114775260SMPD5rs137302420686751807SLC4A4−0.005448.33240
rs13554965114775260SMPD5rs109512265686753255SLC4A40.005448.98211
rs13554965114775260SMPD5rs110953922686755896SLC4A40.005448.98212
rs13554965114775260SMPD5rs109901151686762457SLC4A40.005348.98213
rs13554965114775260SMPD5rs110352004687213962GC-NPFFR20.005144.52393
Pos is the chromosome position of the SNP.
Table 3. Top inter-chromosome A×A effects of the Chr14 excluding those with the SGN region of Chr06.
SNP-1Chr-1Pos-1Gene-1SNP-2Chr-2Pos-2Gene-2Effectlog10(1/p)Rank
rs11098457214468124PPP1R16A-FOXH1rs10920846555756462PHLDA1-BBS100.00662.896
rs13747201614494621CYHR1-TONSLrs10920846555756462PHLDA1-BBS100.00662.897
rs13747201614494621CYHR1-TONSLrs1092103912944322319KLC20.01362.898
rs11098457214468124PPP1R16A-FOXH1rs43304498241451308KCNJ3-GALNT130.00962.159
rs13772746514487527CYHR1rs43304498241451308KCNJ3-GALNT13−0.00962.1510
rs13747201614494621CYHR1-TONSLrs43304498241451308KCNJ3-GALNT130.00962.1511
rs13772746514487527CYHR1rs10920846555756462PHLDA1-BBS10−0.00662.1512
rs13747201614494621CYHR1-TONSLrs41596003643758146PPARGC1A0.00662.1513
rs10914637114465742PPP1R16Ars1092103912944322319KLC2−0.01362.1515
rs11098457214468124PPP1R16A-FOXH1rs1092103912944322319KLC20.01362.1516
rs13772746514487527CYHR1rs1092103912944322319KLC2−0.01362.1517
rs10920897714243959LOC789384rs13421223331105004567ENSBTAG000000458670.00662.1518
rs11098457214468124PPP1R16A-FOXH1rs41596003643758146PPARGC1A0.00661.4219
rs13772746514487527CYHR1rs41596003643758146PPARGC1A−0.00661.4220
rs13747201614494621CYHR1-TONSLrs41615143244981402RBM43(d)−0.00860.6923
rs13658000314399818ARHGAP39rs1370597691763245988C12orf76 (u)0.00560.6924
rs10914637114465742PPP1R16Ars43304498241451308KCNJ3-GALNT13−0.00959.9725
rs11098457214468124PPP1R16A-FOXH1rs41615143244981402RBM43(d)−0.00859.9726
rs13772746514487527CYHR1rs41615143244981402RBM43(d)0.00859.9727
rs13772746514487527CYHR1rs109961025254049623KYNU-5S-rRNA0.01059.9728
Pos is the chromosome position of the SNP.
Table 4. Top 20 inter-chromosome A×A effects of the Chr14b1 region.
SNP-1Chr-1Pos-1Gene-1SNP-2Chr-2Pos-2Gene-2Effectlog10(1/p)Rank
rs3423093141142282659Chr14b1rs4236865433924620LMX1A (d)0.019147.69264
rs3423094258142330431Chr14b1rs4236865433924620LMX1A (d)−0.018255.0381
rs3423094258142330431Chr14b1rs419818502141462728SCFD1-COCH−0.012645.14359
rs3423094258142330431Chr14b1rs1097878162330347149ZSCAN12−0.027250.30182
rs3423357679142350879Chr14b1rs4236865433924620LMX1A (d)0.017857.1250
rs3423357679142350879Chr14b1rs419818502141462728SCFD1-COCH0.013255.0382
rs3423357679142350879Chr14b1rs1097878162330347149ZSCAN120.024845.14360
rs3423357679142350879Chr14b1rs135435373316923026bta-mir-2285bj-1 (u)0.008048.33241
rs136475864142372575Chr14b1rs4236865433924620LMX1A (d)0.016152.97126
rs134537992142421119Chr14b1rs433198122112888145DOCK10−0.013645.14361
rs134537992142421119Chr14b1rs4236865433924620LMX1A (d)0.018764.375
rs134537992142421119Chr14b1rs109376678856181140TLE4(d)−0.013745.14362
rs134537992142421119Chr14b1rs109489404856297348TLE4(d)−0.013845.77328
rs134537992142421119Chr14b1rs1335369112030612345FGF10 (d)0.014450.30183
rs134537992142421119Chr14b1rs419405942035354207FYB1-RICTOR0.014048.33242
rs134537992142421119Chr14b1rs419818502141462728SCFD1-COCH0.013659.2532
rs134537992142421119Chr14b1rs1097878162330347149ZSCAN120.025046.41304
rs134537992142421119Chr14b1rs1092772632941499833LOC522784−0.013545.14363
rs134537992142421119Chr14b1rs135435373316923026bta-mir-2285bj-1 (u)0.007745.14364
rs41661929146113669Chr14b2rs1363877413187757884CLCN5−0.004945.77330
Pos is the chromosome position of the SNP. Chr31 is the nonrecombining region of ChrX.
Table 5. Top 20 inter-chromosome A×A effects of the Chr14b2 region.
SNP-1Chr-1Pos-1Gene-1SNP-2Chr-2Pos-2Gene-2Effectlog10(1/p)Rank
rs132788949142867641PTK2(no rs number)3125156387blank−0.005346.41305
rs41624797142929132PTK2(no rs number)3125156387blank0.005448.98214
rs41624797142929132PTK2rs1355423793124950173blank−0.005147.04283
rs41624797142929132PTK2rs41626477319512588TENM10.004845.14365
rs41624797142929132PTK2rs110945141536089282TMEM1170.006244.52394
rs41624797142929132PTK2rs1108815592133918945TAS1R2-PAX70.004743.90446
rs55617160143439565TRAPPC9(no rs number)3125156387blank0.005246.41306
rs55617160143439565TRAPPC9rs1355423793124950173blank−0.005045.14366
rs55617160143439565TRAPPC9rs110945141536089282TMEM1170.006243.90447
rs55617160143439565TRAPPC9rs41626477319512588TENM10.004843.90448
rs135838690143687442KCNK9rs4236865433924620LMX1A (d)0.015145.77329
rs110822835143710917KCNK9rs110945141536089282TMEM1170.006244.52395
rs110143087143738219KCNK9 (d)rs110945141536089282TMEM1170.006549.64192
rs110143087143738219KCNK9 (d)rs1335523241035535274GPR176−0.007146.41307
rs110281272144021974KCNK9 (d)rs42477574534302710SCAF11−0.005645.14367
rs110281272144021974KCNK9 (d)rs1363877413187757884CLCN50.005045.14368
rs110281272144021974KCNK9 (d)rs1361570413187819894CLCN5 (d)0.004945.14369
rs110281272144021974KCNK9 (d)rs42477555534282642SCAF110.005644.52396
rs110979942144543775FAM135Brs10912744316161911645S-rRNA (d)−0.010044.52397
rs42306021144858211FAM135B (d)rs13554288331114523882blank0.007344.52398
Pos is the chromosome position of the SNP. Chr31 is the nonrecombining region of ChrX.
Table 6. Top inter-chromosome A×A effects of the Chr05 and Chr20.
SNP-1Chr-1Pos-1Gene-1SNP-2Chr-2Pos-2Gene-2Effectlog10(1/p)Rank
rs11098457214468124PPP1R16A-FOXH1rs10920846555756462PHLDA1-BBS100.006162.896
rs13747201614494621CYHR1-TONSLrs10920846555756462PHLDA1-BBS100.006162.897
rs13772746514487527CYHR1rs10920846555756462PHLDA1-BBS10−0.006062.1512
rs10914637114465742PPP1R16Ars10920846555756462PHLDA1-BBS10−0.005959.2531
rs13772746514487527CYHR1rs13744451251183045LGR50.005754.3489
rs13747201614494621CYHR1-TONSLrs13744451251183045LGR5−0.005754.3490
rs10914637114465742PPP1R16Ars13744451251183045LGR50.005653.65102
rs11098457214468124PPP1R16A-FOXH1rs13744451251183045LGR5−0.005653.65103
rs110143087143738219KCNK9 (d)rs110945141536089282TMEM1170.006549.64188
rs11098457214468124PPP1R16A-FOXH1rs10970675754507251KCNC2−0.005448.33219
rs10920897714243959ZNF250rs1366531822026615565ITGA1 (d)0.005957.1250
rs134537992142421119blankrs1335369112030612345FGF10 (d)0.014450.30181
rs13693975814146715OR10AG83 (u)rs1366531822026615565ITGA1 (d)0.005548.98209
rs10920897714243959ZNF250rs1338624502026701720ITGA1 (d)−0.005048.98210
rs10920897714243959ZNF250rs1353334782027147364blank0.005248.98211
rs10920897714243959ZNF250rs1360758412028123462U6-PARP8−0.005248.98212
rs10996851514490055CYHR1rs1352368092023802929MTREX0.005148.33238
rs13693975814146715U6-OR10AG83rs290244192028231492U6-PARP8−0.005448.33239
rs134537992142421119blankrs419405942035354207FYB1-RICTOR0.014048.33240
rs13693975814146715OR10AG83 (u)rs1329376082028111718PARP8 (u)−0.005547.69258
Pos is the chromosome position of the SNP.
Table 7. Patterns of A×A epistasis effects between Chr14a and the SGN region of Chr06.
SNP-1Gene-1SNP-2Gene-2AC1aa1AC2aa2AC3aa3AC4aa4
rs109146371PPP1R16Ars42766480GC-NPFFR21_10.00452_10.00062_2−0.00071_2−0.0030
rs109146371PPP1R16Ars110352004GC-NPFFR21_20.00342_20.00032_1−0.00051_1−0.0031
rs110984572PPP1R16A-FOXH1rs42766480GC-NPFFR22_10.00461_10.00061_2−0.00072_2−0.0031
rs110984572PPP1R16A-FOXH1rs110352004GC-NPFFR22_20.00351_20.00031_1−0.00052_1−0.0032
rs110984572PPP1R16A-FOXH1rs109901151SLC4A42_20.00341_20.00031_1−0.00052_1−0.0031
rs137727465CYHR1rs42766480GC-NPFFR21_10.00462_10.00062_2−0.00071_2−0.0031
rs137727465CYHR1rs110352004GC-NPFFR21_20.00352_20.00032_1−0.00051_1−0.0032
rs137727465CYHR1rs109901151SLC4A41_20.00342_20.00032_1−0.00051_1−0.0031
rs137472016CYHR1-TONSLrs42766480GC-NPFFR22_10.00461_10.00061_2−0.00072_2−0.0031
rs137472016CYHR1-TONSLrs110352004GC-NPFFR22_20.00351_20.00031_1−0.00052_1−0.0032
rs137472016CYHR1-TONSLrs109901151SLC4A42_20.00341_20.00031_1−0.00052_1−0.0031
rs211309638ADCK5-SLC52A2rs110352004GC-NPFFR22_20.00361_20.00041_1−0.00062_1−0.0034
rs109421300DGAT1rs109901151SLC4A41_20.00362_20.00052_1−0.00081_1−0.0032
rs109421300DGAT1rs109512265SLC4A41_20.00362_20.00052_1−0.00081_1−0.0033
rs109421300DGAT1rs110953922SLC4A41_20.00362_20.00052_1−0.00081_1−0.0033
rs109421300DGAT1rs110352004GC-NPFFR21_20.00362_20.00062_1−0.00091_1−0.0033
rs109421300DGAT1rs137302420SLC4A41_10.00362_10.00052_2−0.00081_2−0.0033
rs109421300DGAT1rs110434046GC-NPFFR21_20.00322_20.00062_1−0.00151_1−0.0039
rs109421300DGAT1rs137844449NPFFR21_20.00382_20.00042_1−0.00031_1−0.0018
rs109421300DGAT1rs109034709NPFFR21_20.00322_20.00062_1−0.00151_1−0.0038
AC1–AC4 are the four allelic combinations of the two loci, and aa1–aa4 are the A×A epistasis values of AC1–AC4.
Table 8. Patterns of A×A epistasis effects of Chr14b.
SNP-1Gene-1SNP-2Gene-2AC1aa1AC2aa2AC3aa3AC4aa4
rs134537992Chr14b1rs42368654LMX1A (d)1_10.01242_20.00011_2−0.00072_1−0.0055
rs3423357679Chr14b1rs42368654LMX1A (d)1_10.01202_20.00011_2−0.00072_1−0.0050
rs3423094258Chr14b1rs42368654LMX1A (d)2_10.01141_20.00012_2−0.00081_1−0.0059
rs136475864Chr14b1rs42368654LMX1A (d)1_10.01162_20.00001_2−0.00062_1−0.0038
rs3423093141Chr14b1rs42368654LMX1A (d)1_10.01502_20.00011_2−0.00112_1−0.0030
rs135838690KCNK9rs42368654LMX1A (d)1_10.01032_20.00011_2−0.00052_1−0.0043
rs134537992Chr14b1rs41981850SCFD1-COCH1_10.00942_20.00011_2−0.00092_1−0.0032
rs3423357679Chr14b1rs41981850SCFD1-COCH1_10.00942_20.00011_2−0.00092_1−0.0028
rs134537992Chr14b1rs133536911FGF10_U61_10.01002_20.00011_2−0.00072_1−0.0037
rs3423094258Chr14b1rs109787816ZSCAN122_10.01721_20.00012_2−0.00061_1−0.0094
rs134537992Chr14b1rs109787816ZSCAN121_10.01622_20.00011_2−0.00052_1−0.0083
rs110143087KCNK9 (d)rs110945141TMEM1172_20.00371_10.00042_1−0.00071_2−0.0018
rs134537992Chr14b1rs41940594FYB1_RICTOR1_10.00992_20.00011_2−0.00072_1−0.0033
rs3423357679Chr14b1rs135435373bta-mir-2285bj-1 (u)1_10.00512_20.00022_1−0.00101_2−0.0017
rs41624797PTK2rs135542379blank2_10.00161_20.00071_1−0.00032_2−0.0025
rs110143087KCNK9 (d)rs133552324GPR1762_10.00481_20.00022_2−0.00061_1−0.0016
rs134537992Chr14b1rs109489404blank1_20.00942_10.00011_1−0.00082_2−0.0035
rs134539615ZFAT (d)rs29016827STXBP61_20.00162_10.00081_1−0.00092_2−0.0015
rs134539615ZFAT (d)rs109853041STXBP61_20.00162_10.00091_1−0.00092_2−0.0015
rs41661929blankrs136387741CLCN51_20.00122_10.00122_2−0.00081_1−0.0018
AC1–AC4 are the four allelic combinations of the two loci, and aa1–aa4 are the A×A epistasis values of AC1–AC4.
Disclaimer/Publisher’s Note: The statements, opinions and data contained in all publications are solely those of the individual author(s) and contributor(s) and not of MDPI and/or the editor(s). MDPI and/or the editor(s) disclaim responsibility for any injury to people or property resulting from any ideas, methods, instructions or products referred to in the content.

