1. Introduction
As companion animals, dogs inhabit the same environment as humans and are exposed to the same carcinogenic factors [
1,
2]. In fact, environmental toxins, old age, and obesity are common carcinogenic factors in both humans and dogs [
3]. Therefore, canine spontaneous tumors are an ideal model for human tumor research [
4]. Canine mammary tumors are the most common type of tumor in female dogs, accounting for ~25–42% of all canine tumors, of which ~50% are malignant [
5]. As dogs age, canine mammary tumors become more prevalent, and traditional surgical and chemotherapeutic approaches often cause tumor cells to develop resistance, negatively impacting prognosis [
6]. Therefore, there is an urgent need to find and develop new drugs to treat canine mammary tumors.
Epidermal growth factor receptor (EGFR) is a member of the epidermal growth factor receptor family and comprises an extracellular ligand-binding region, a transmembrane region, and an intracellular kinase region [
7]. It is widely distributed on the surface of mammalian cells and has an important role in physiological processes, including the growth, proliferation, and differentiation of cancer cells [
8]. Thus, alterations in the structure or expression of EGFR can lead to tumorigenesis [
9]. The EGFR–STAT3–PD-L1 pathway has an important role in cancer growth and metastasis, and inhibiting its expression can effectively reduce cancer migration and invasion [
10]. Research into PD-L1 is a hot topic in oncology, particularly for the treatment of breast cancer [
11]. Inhibition of different types of lung cancer cells by preventing PD-L1 expression can be achieved by reducing the mitochondrial membrane potential to induce apoptosis in these cells [
12]. In addition to lung cancer cells, PD-L1 also shows higher expression on the surface of some types of breast cancer cells, providing a possible potential treatment target.
There is increasing interest in the use of botanical compounds as anti-cancer agents because of their potential tumor cell selectivity and cytotoxicity, as well as fewer side effects [
13]. Isorhamnetin (ISO)’s chemical formula is 3,5,7-trihydroxy-2-(4-hydroxy-3-methoxyphenyl)-4
H-chromen-4-one (
Figure 1A); it is a flavonoid extracted from fruits, vegetables, and tea leaves, and it is also widely found in plants such as Ginkgo biloba and Sichuan dome [
14]. The molecular weight of ISO is 316.2623, and it is in the state of a light yellow needle-like crystal. It is used for cough, indigestion, abdominal pain, bruises and swelling, cardiovascular diseases, and hemorrhage. Also, its use for the prevention or treatment of colon cancers has been previously reported [
15]. However, further investigations are required to gain a better understanding of the possible antitumor properties of ISO, given that its direct cellular targets and biological impacts remain largely unknown. In this study, we investigated the anti-tumor activity of ISO in canine mammary tumor cells, murine breast tumor cells, and nude mouse models. We identified EGFR as a direct target of ISO, suggesting that ISO could be utilized against EGFR-related pathologies, including cancer.
3. Discussion
The increased life expectancy of dogs as a result of improved nutrition and vaccine use is one of the reasons for the high incidence of canine cancer [
16]. Canine mammary tumors are the most common tumor in unsterilized female dogs, with an annual incidence of ~198/100,000 [
17]. Cancer is also the health issue of greatest concern to dog owners [
18].
There is a growing body of literature reporting how ISO, an active ingredient of traditional Chinese medicine, induces apoptosis in various human cancer cells [
19]. By analyzing the active ingredients in Guiqi Baizhu, Ling et al. found that active ingredients, such as ISO, had potential therapeutic efficacy in cancer treatment [
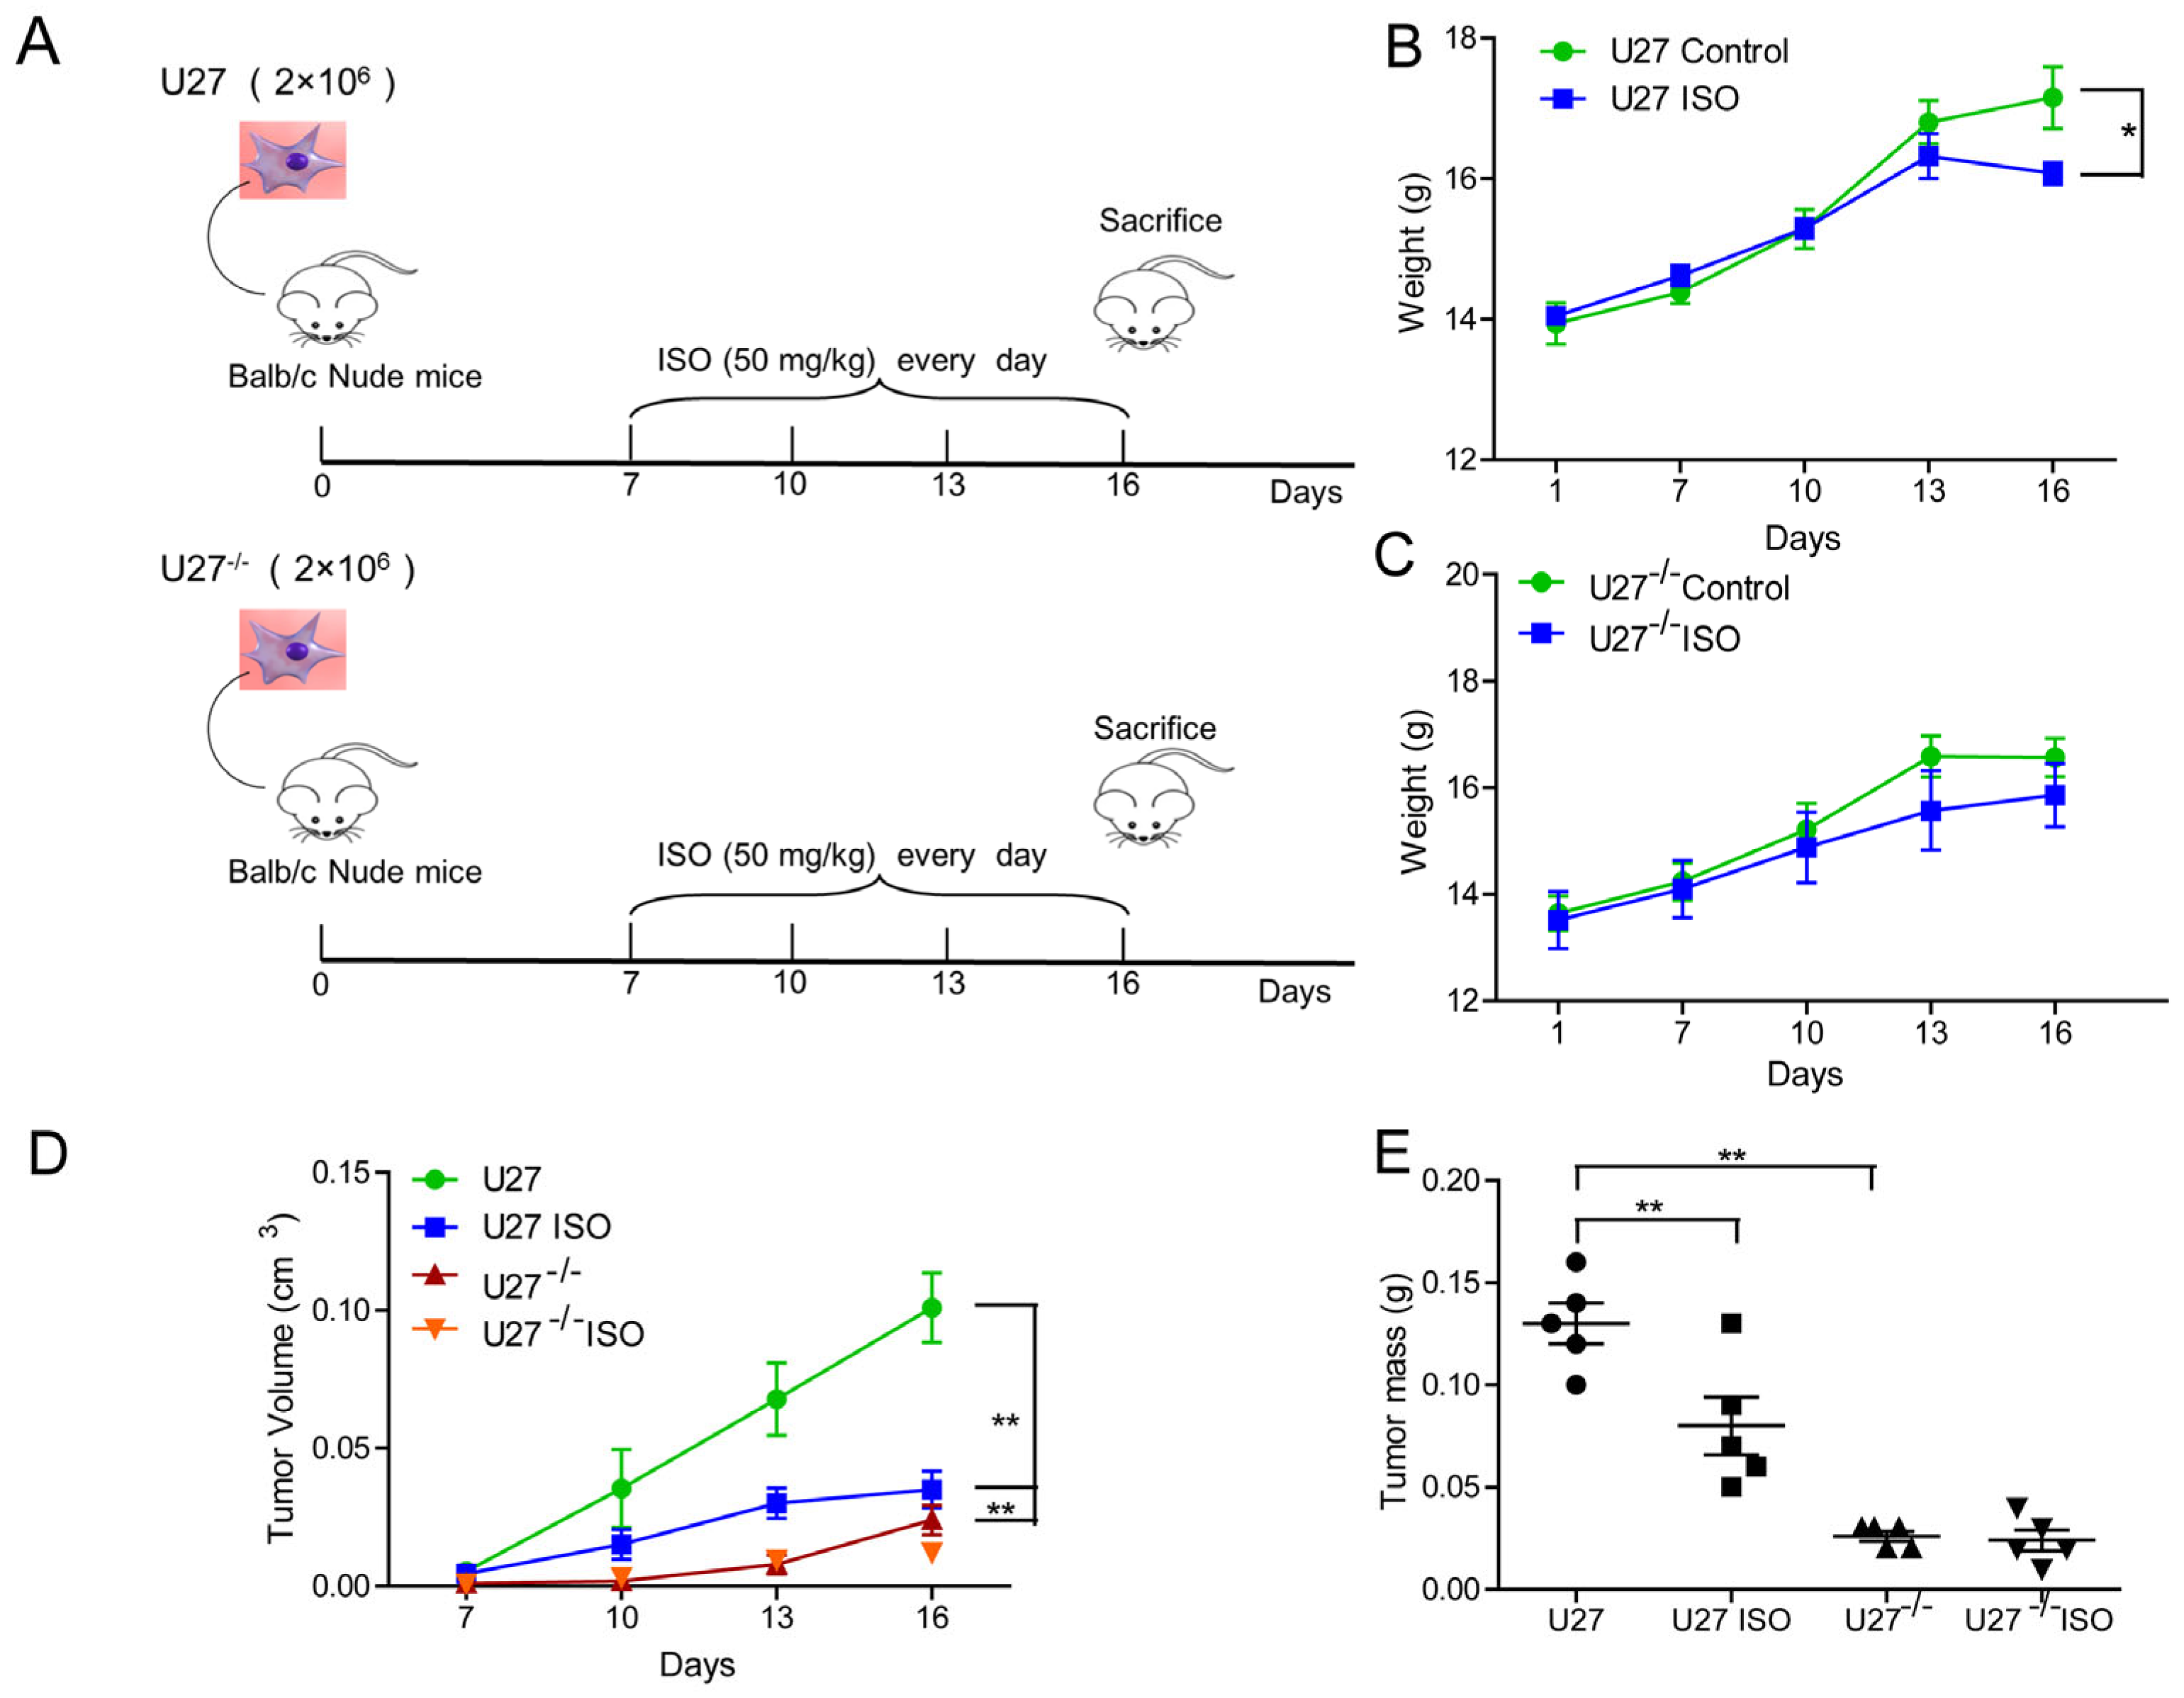
20]. However, no studies of the use of ISO against canine mammary tumors have been reported. Therefore, the current study analyzed the ability of ISO to induce canine mammary tumor cell damage. As expected, ISO showed robust inhibition of tumor growth in both nude mice and BALB/c mice, increasing the survival of tumor-bearing mice. In an in vivo trial, when U27
−/− cells were used in the same numbers as U27 cells to establish a mouse mammary cancer model, U27
−/−-induced tumor growth was slower, which was consistent with the results of slow cancer growth in hormonal mice with LSD1 deletion [
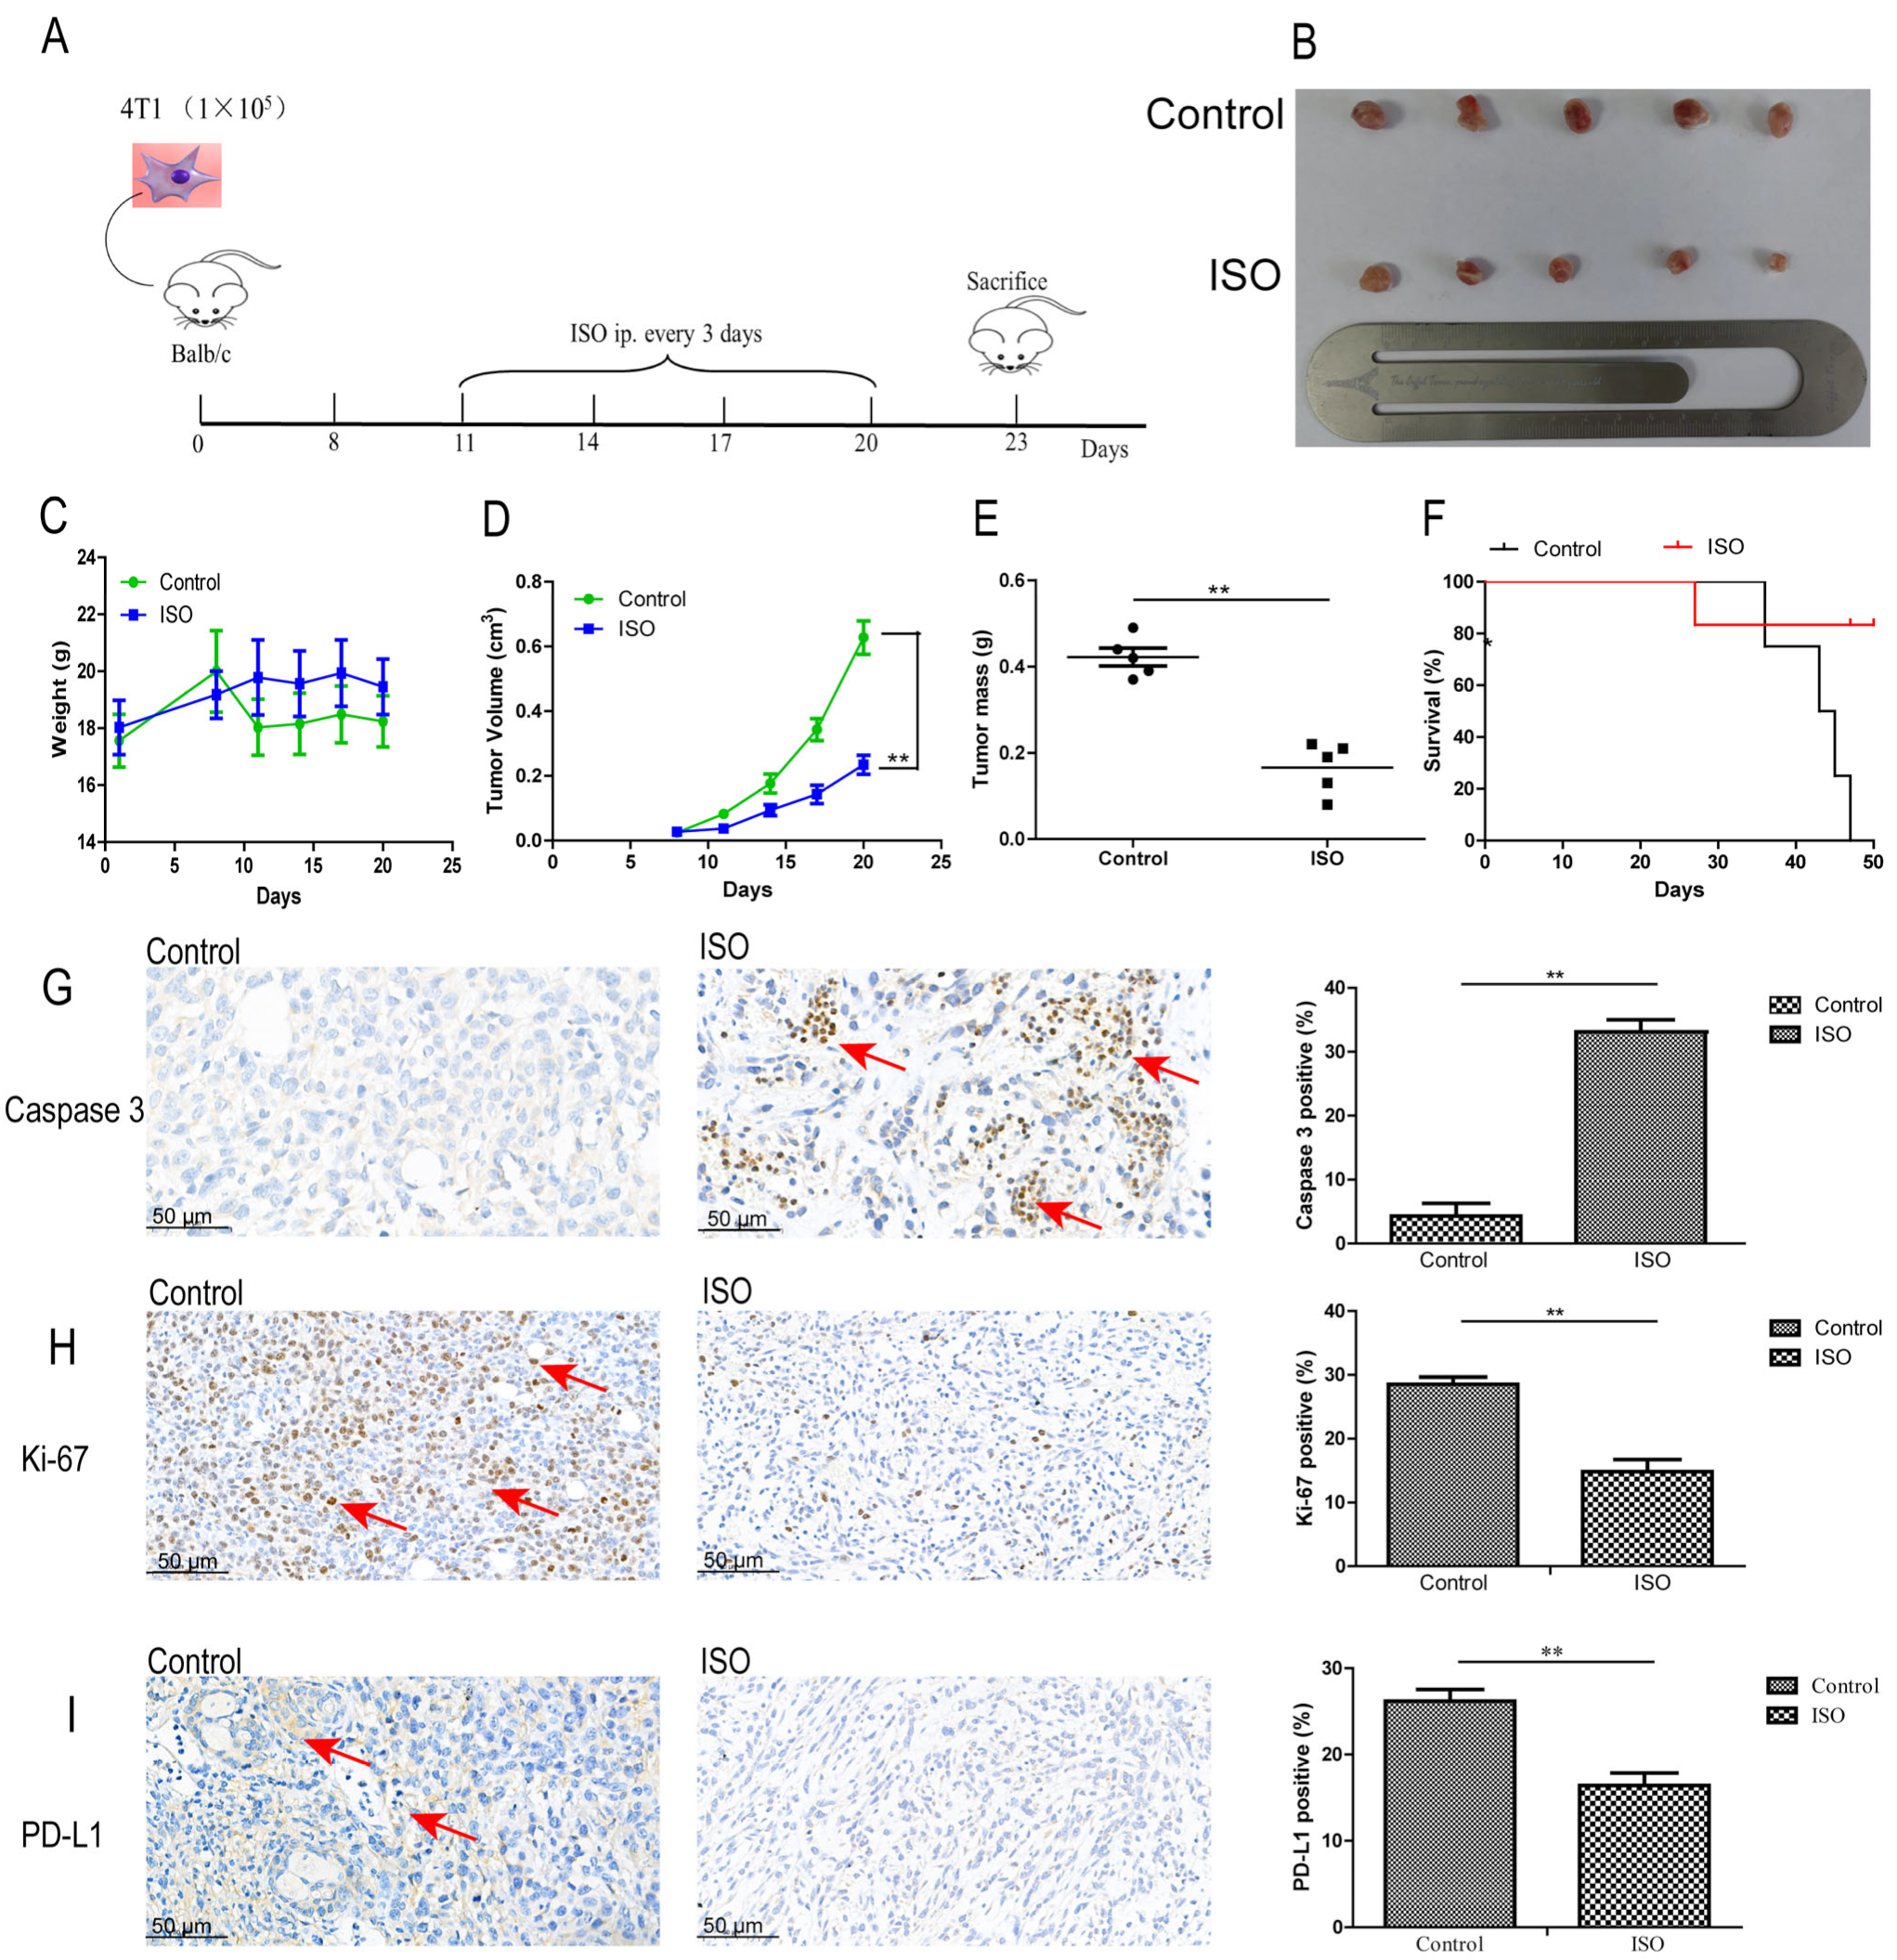
21]. In investigating the effect of ISO on BALB/c mice with mammary tumors, because the mice have an intact immune system, the anti-cancer effects in response to treatment with ISO were more prominent in terms of inhibiting PD-L1 and Ki-67 and promoting caspase3 expression, based on ICH results.
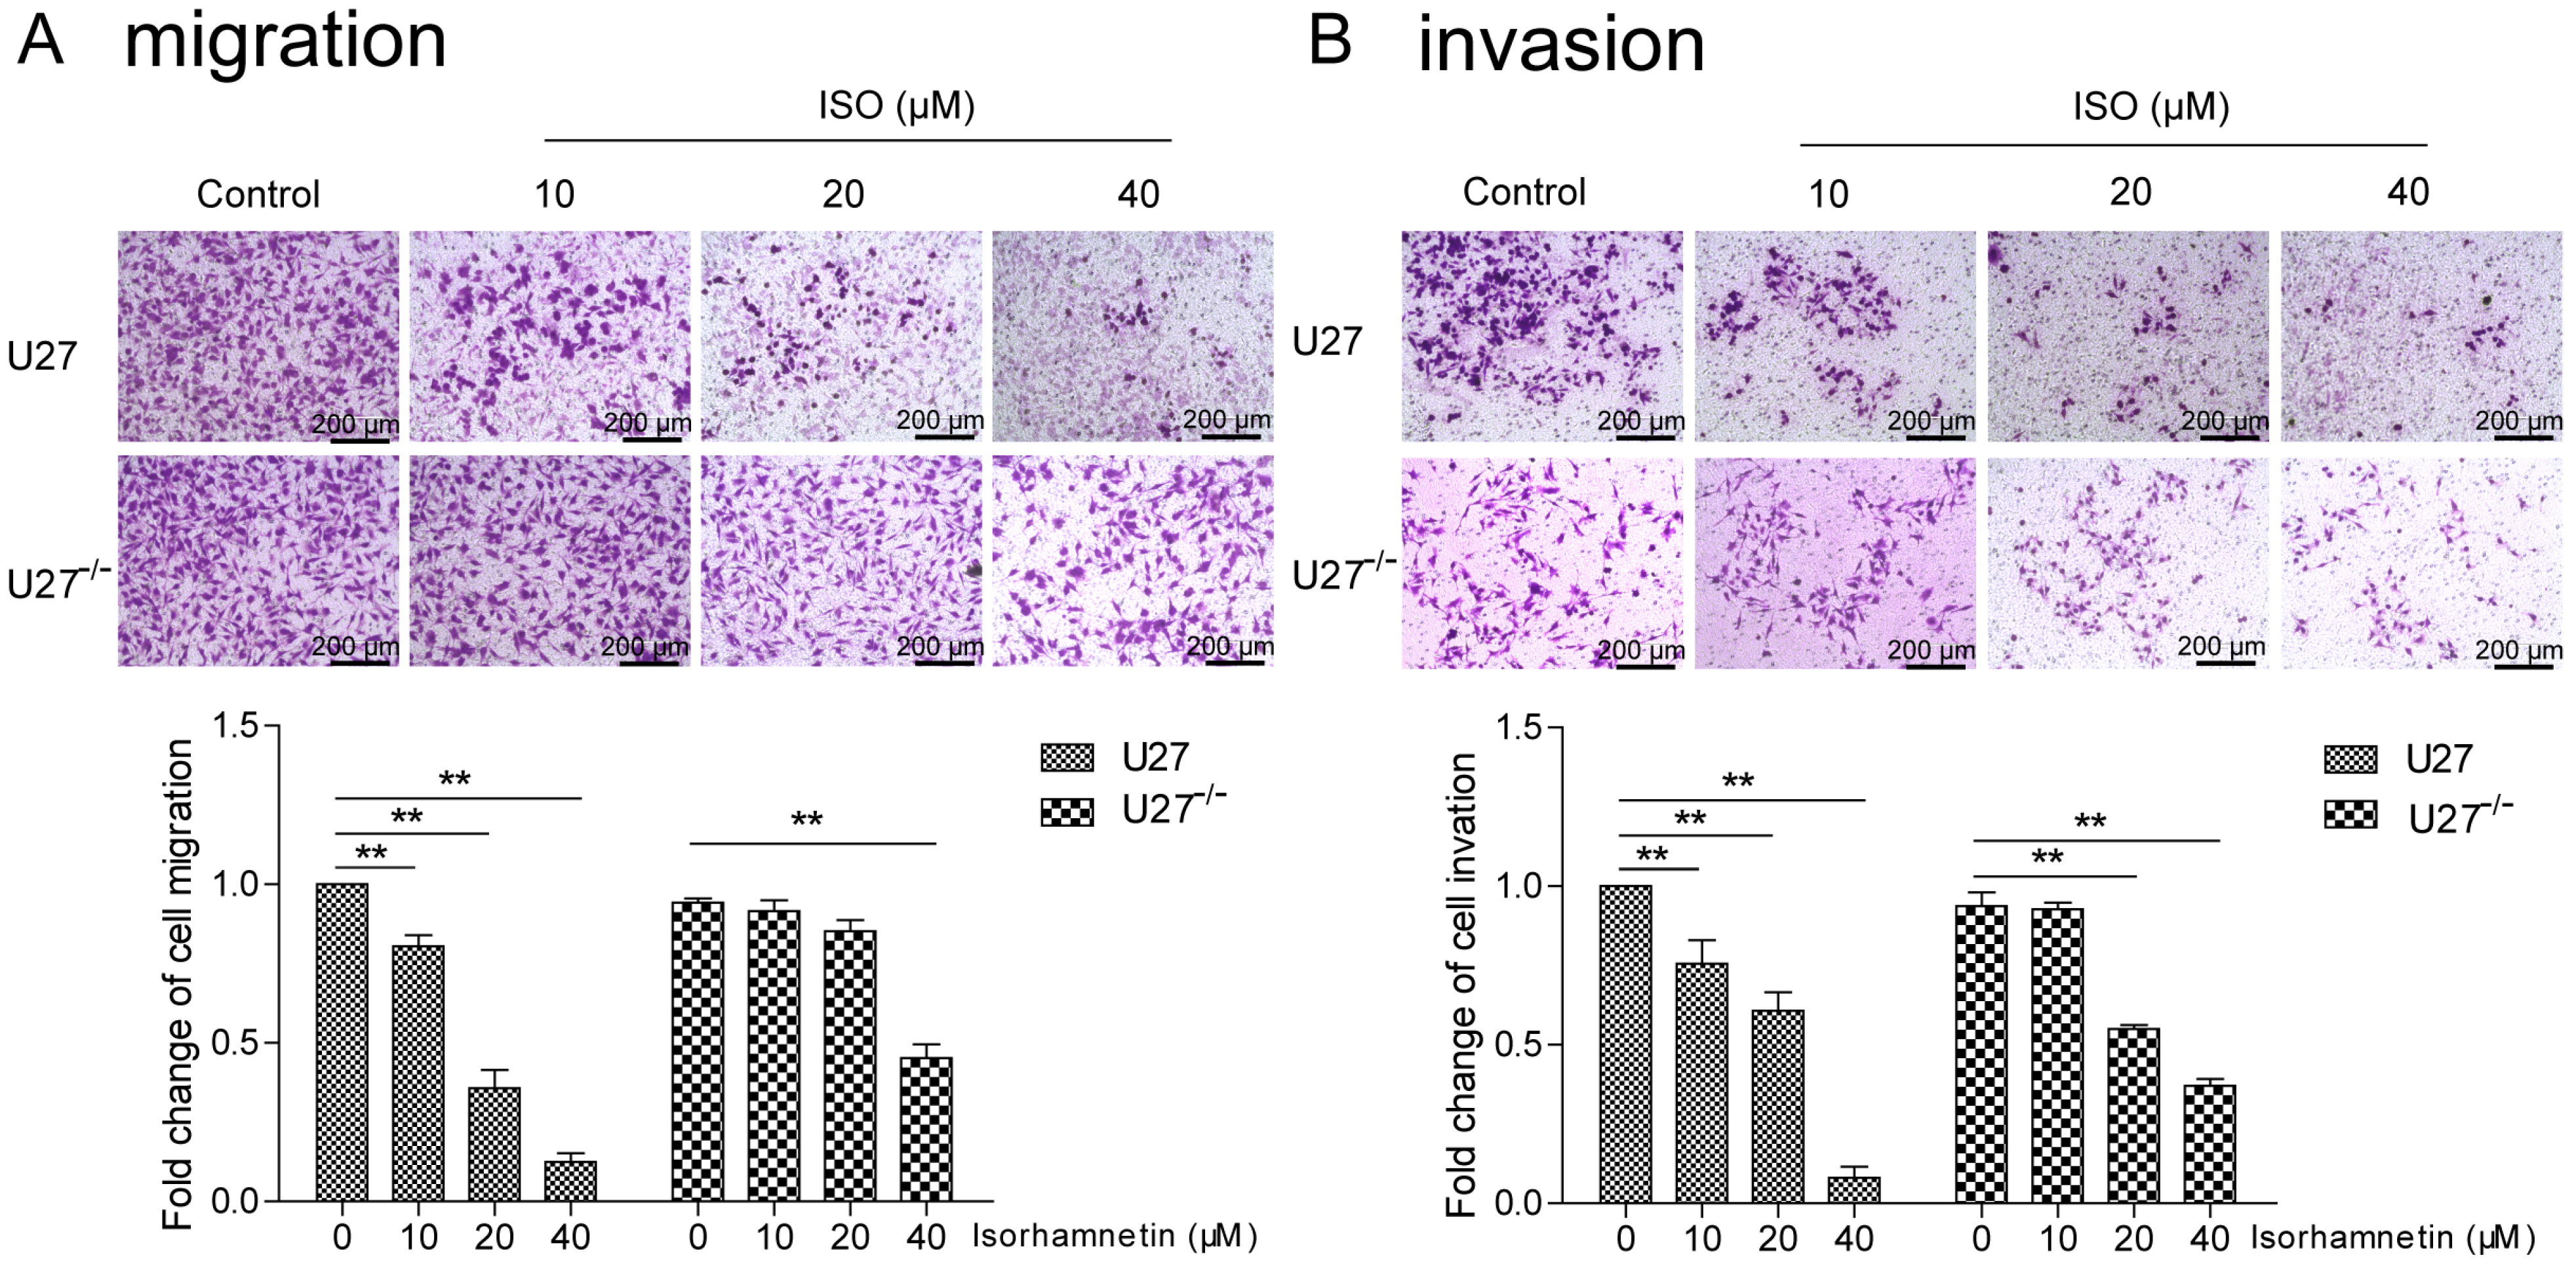
U27 cells have strong migratory and invasive abilities. The U27
−/− cells constructed with knockdown of PD-L1 exhibited slow cell growth and reduced cell migration and invasion ability. ISO inhibited the migration and invasion ability of U27 cells, but the sensitivity of U27
−/− cells to ISO was decreased, suggesting that ISO regulates PD-L1 expression in cells to induce cell damage. Interestingly, despite the knockdown of PD-L1 in U27
−/− cells, a shallow band was still detected on Western blot, similar to findings reported previously [
22]. This might be because the primary antibody (only found in mice and rabbits) was not specific enough, and there is no monoclonal antibody specifically for canine PD-L1, an issue that needs to be resolved in future work. We have found that in many studies, the protein is still expressed at a low level after knockdown. This situation exists in a wide range; for example, after knocking down the gene in hepatitis B virus S gene [
23], chicken liver cancer cell lines LMH
VNN1 gene [
24], and early rat embryos
ISCA1 gene [
25], the expression of knockdown proteins can still be detected by Western blot. This may be related to the efficiency of CRISPR/Cas9 knockdown, and we considered a 30% or more reduction in gene expression to be a successful knockdown. In this experiment, the gene expression after knockdown was 34.6% of the wild type, and we consider the knockdown to be successful.
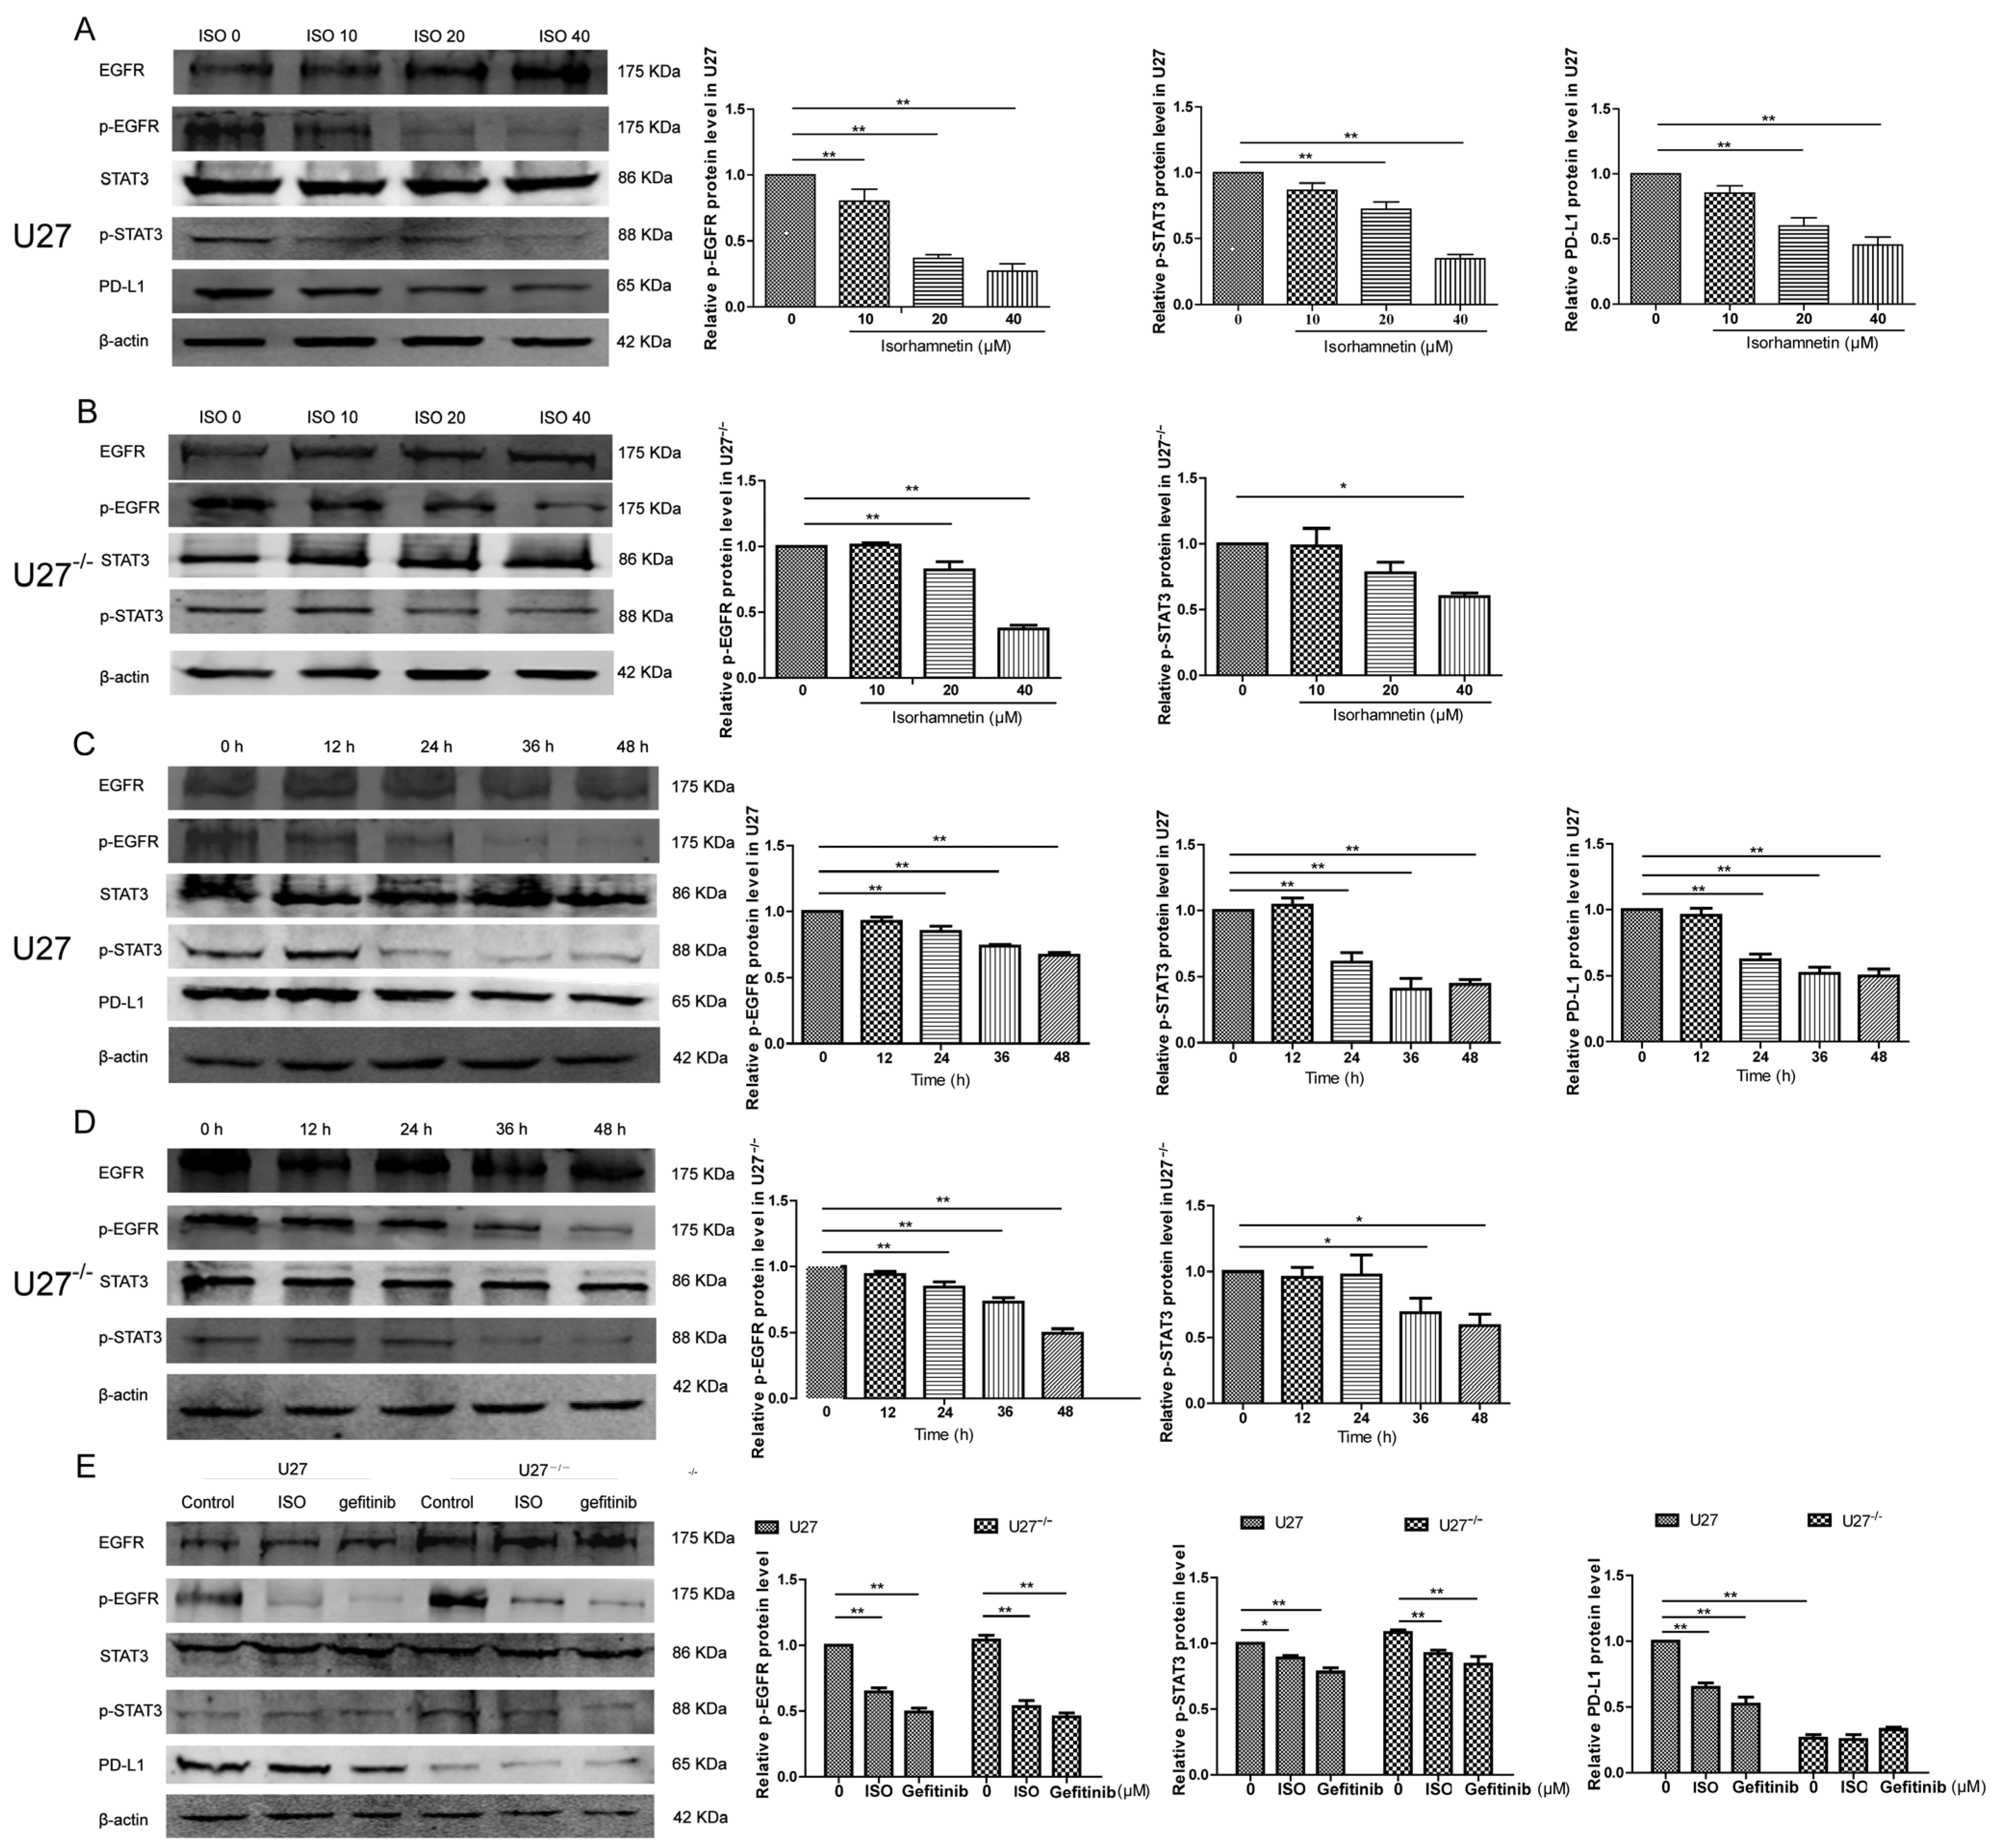
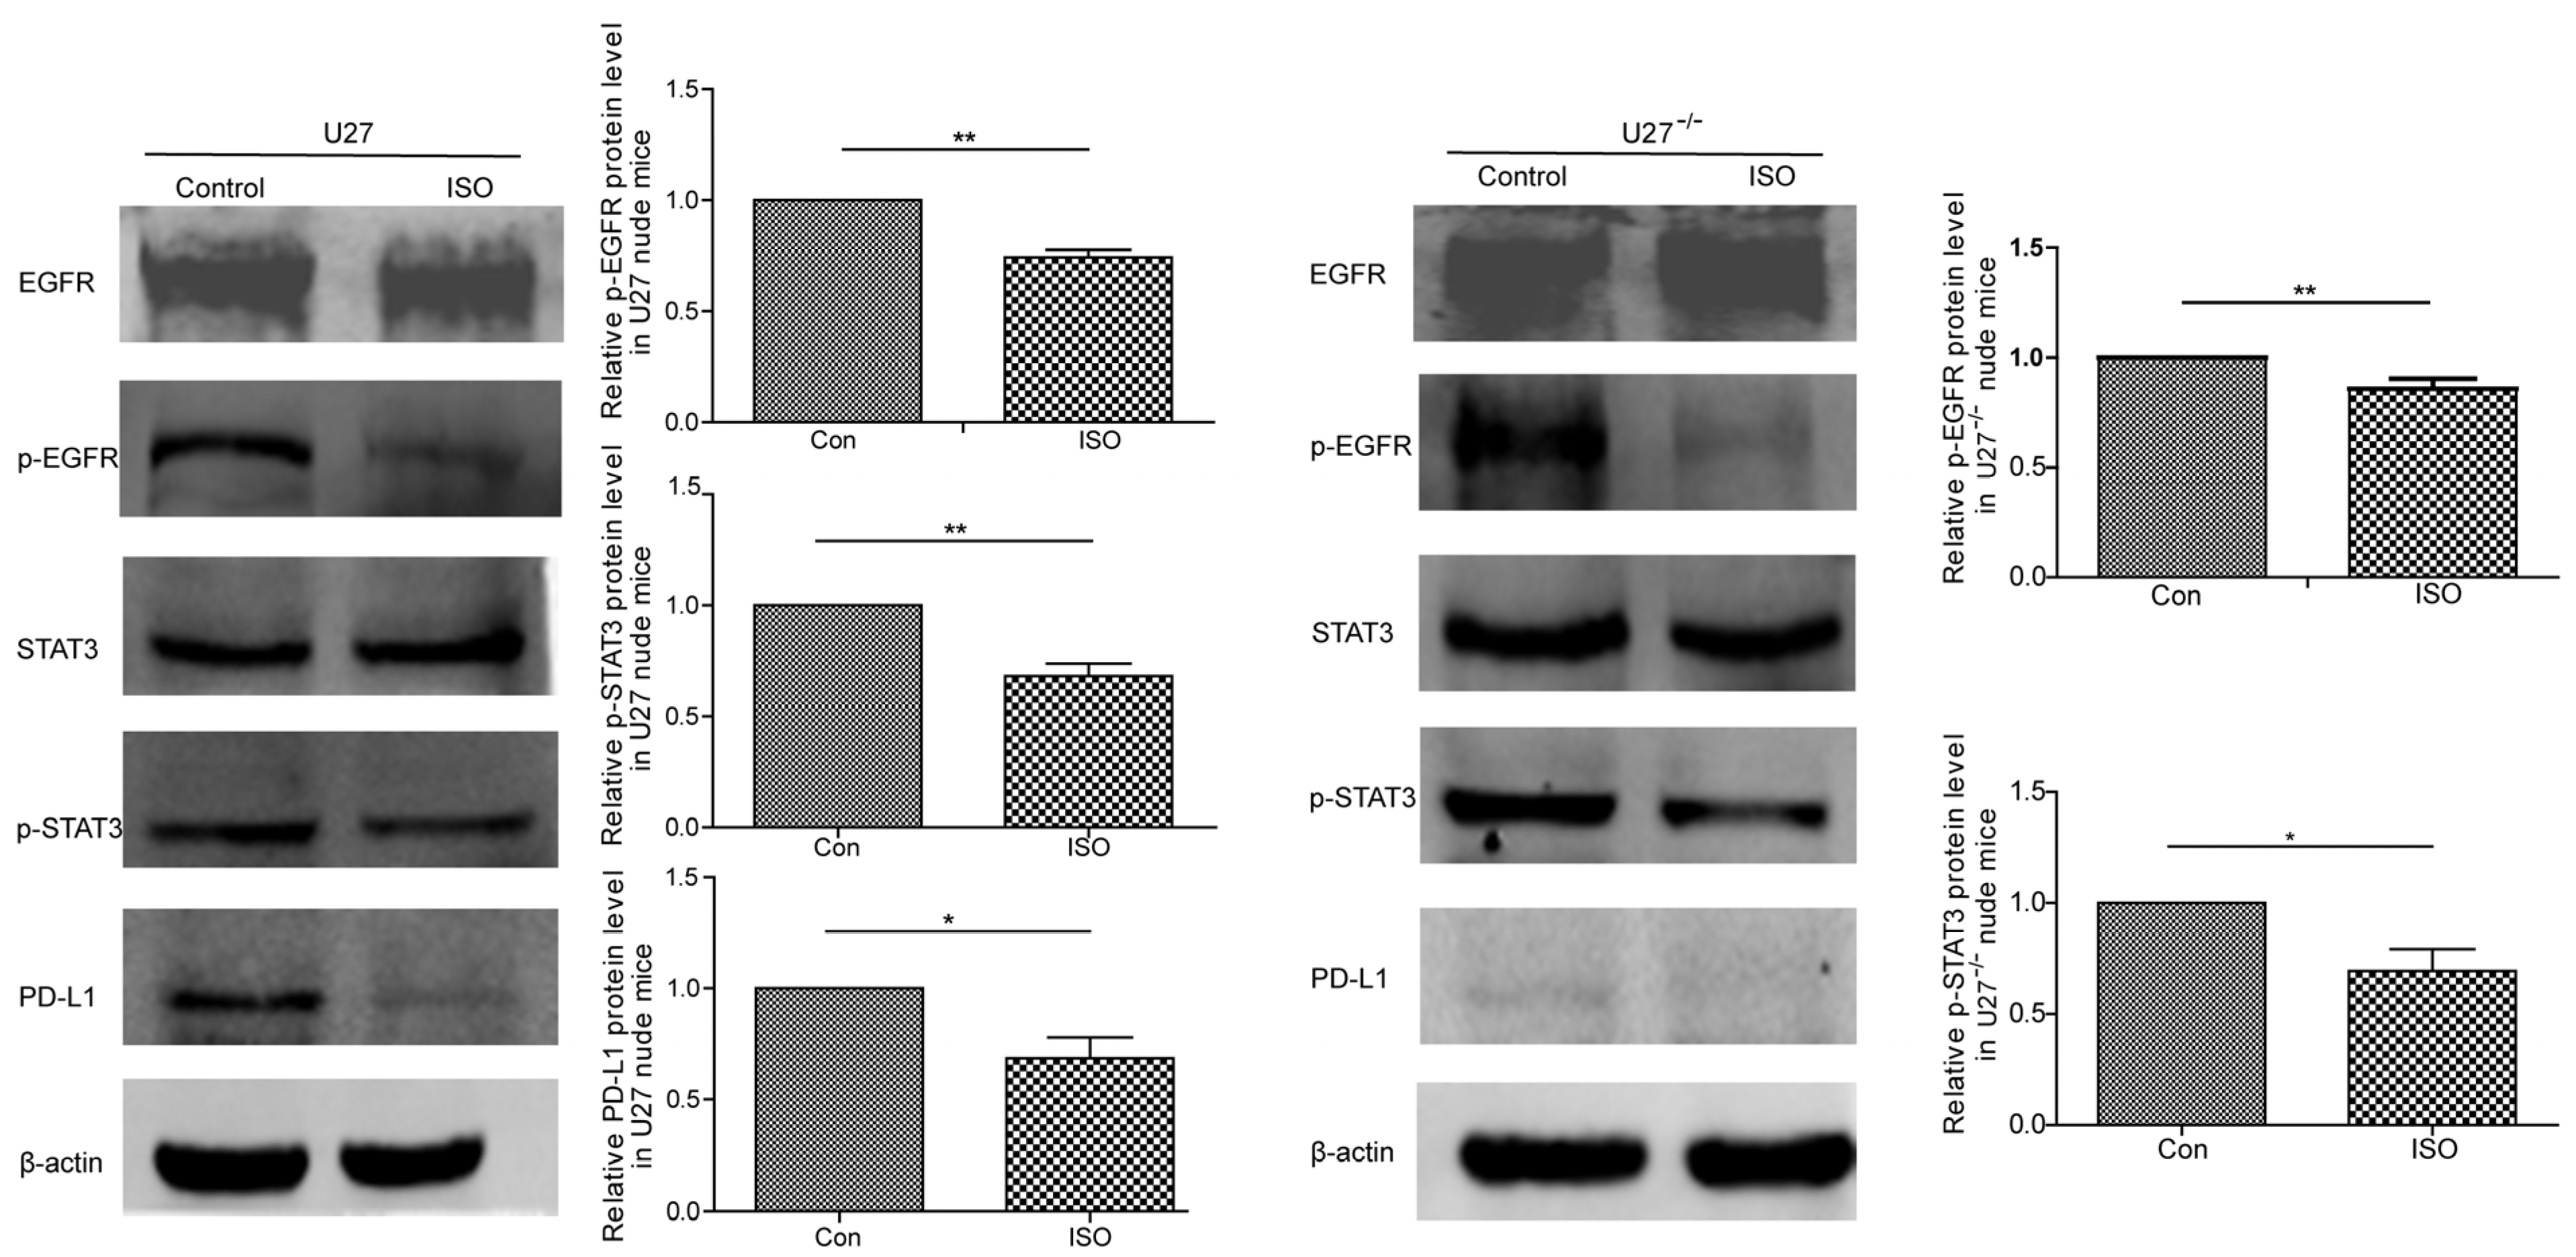
The EGFR-STAT3 signaling pathway is involved in cancer development [
26,
27]. In addition, STAT3 is an important initiator of the expression of PD-L1 and has been shown to be involved in cancer proliferation [
28,
29]. In the present study, ISO induced U27 cell injury by downregulating the EGFR–STAT3–PD-L1 signaling pathway, consistent with the results of adding gefitinib (an EGFR inhibitor). In U27
−/− cells, the sensitivity of protein expression was reduced, consistent with the results of Lu et al. [
10], indicating that ISO could inhibit the metastasis and growth of human colon cancer cells by modulating the PD-L1 pathway. Interestingly, we detected two phosphorylation sites of STAT3 (Ser727 and Tyr706), although only the phosphorylation signal of the former site was observed, indicating that ISO acts by phosphorylating Ser727, which was consistent with the findings of Zhang et al. [
30] and Balic et al. [
31].
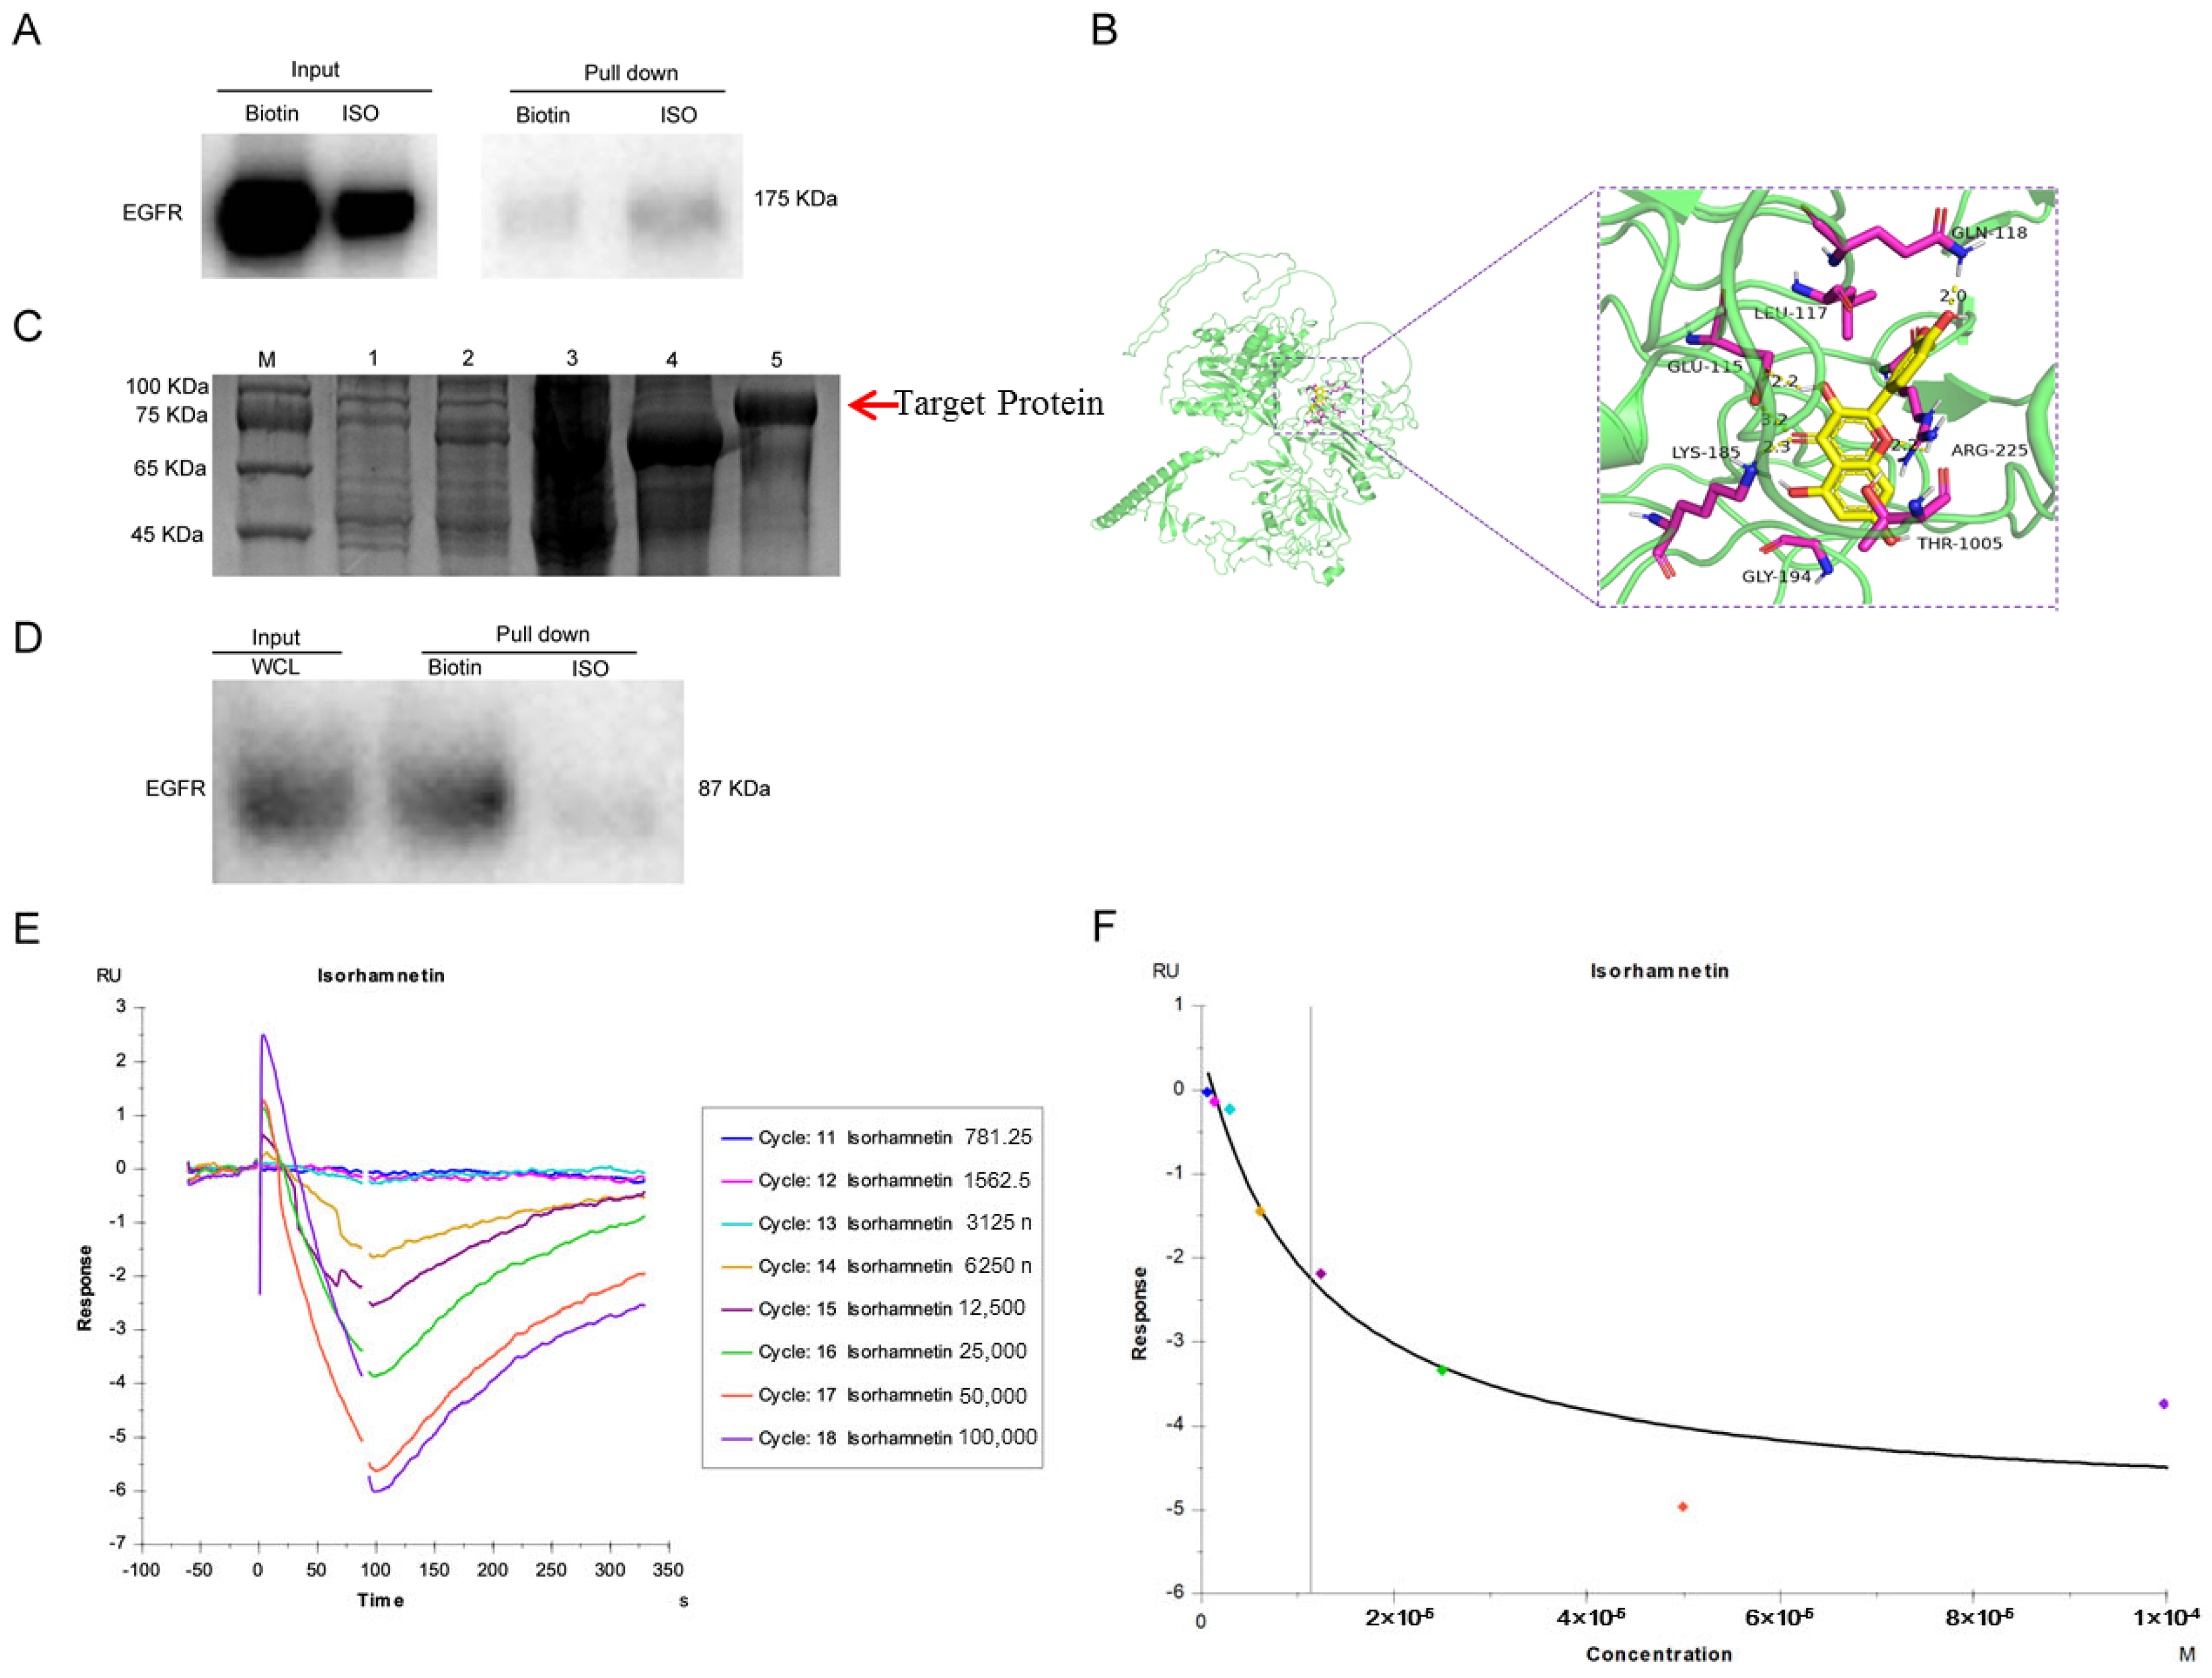
Pull-down assay results of ISO-treated U27 cells showed that EGFR can bind to ISO, suggesting that ISO acts on EGFR to induce cell injury. Reports showed that ISO directly binds to estrogen receptor 1 (ESR1) to suppress ovarian cancer [
32]. Li et al. reported that ISO inhibited gastric cancer by targeting HER-2 and PD-L1 [
20]. We did not detect these target proteins in the current study, although EGFR is a very important biomarker in cancers. In addition, this result was consistent with the most enriched pathway in the GO and KEGG analyses.
SPR results again confirmed EGFR as the direct target of ISO. Interestingly, our results were negative SPR signals; we confirmed that the result was not produced by the nonspecific binding of the reference channel but rather by the test channel of the coupled protein after the action of ISO. For example, this might result from a change in the conformation of the protein after the action of ISO, leading to a change in its hydrated membrane morphology and a reduction in its mass, which was consistent with the findings of Bonnet et al. [
33] and Pons et al. [
34]. The recombinant canine EGFR comprises 629 amino acids and has a predicted molecular mass of 69.8 kDa. The apparent molecular mass of the protein was ~87.2 kDa in SDS-PAGE under reducing conditions. The reason for the larger molecular weight of the protein might be that urea breaks the hydrogen bonds and hydrophobic interactions between proteins, loosening the molecular structure [
35].
4. Materials and Methods
4.1. Cell Culture
U27 (canine mammary tumor cells) and 4T1 (murine breast tumor cells) cell lines were cultured in Roswell Park Memorial Institute-1640 medium (Roswell Park Memorial Institute, (RPMI-1640), VivaCell, Shanghai, China) supplemented with 10% fetal bovine serum (FBS, VivaCell, Shanghai, China) and 1% penicillin/streptomycin (VivaCell). Cells were incubated at 37 °C in a humidified incubator containing 5% CO2.
Gefitinib (Med Chem Express (MCE), ZD1839, South Brunswick, NJ, USA), a potent EGFR inhibitor, was used to inhibit EGFR phosphorylation. In the control group, cells were treated with 0.1% DMSO, whereas the inhibitor group was treated with gefitinib (10 μM). Both co-culture treatments were maintained for 12 h.
4.2. CRISPR/Cas9-Mediated CD274 Knockout
Deletion of
CD274 in U27 cell lines was accomplished by Cyagen (Guangzhou, China). Briefly, the third exon gRNA of canine CD274 gene was designed and synthesized according to online websites “
http://tools.genome-engineering.org (accessed on 20 April 2021)”. Sequence was synthesized by Beijing Liuhe Huada Gene Technology Co., Ltd. (Beijing, China). Then, gRNA concentration was adjusted to 2 μg/μL and stored at −20 °C. sgRNA (22.5 pmol), Cas9 protein (7.5 pmol), and phosphate-buffered saline (PBS) buffer were added in a DNase/RNase-free 1.5 mL centrifuge tube to a total volume of 7 μL. It was named RNP mixture and incubated at room temperature for 10 min. Next, HDRT (2 μg (dsDNA)) was added and incubated at room temperature for 2 min. Then, U27 cells (4 × 10
6/μL) were mixed with the RNP mixture and performed electroporation on the Neon
TM electroporator (MPK5000, Invitrogen, Waltham, MA, USA). Electroporation parameters (for U27 cells voltage: 1200 V; time: 10 ms; pulse: 3 pulses). The completed electroporation sample was transferred to a 12-well plate, and one sample was placed into one well. Cells were incubated at a humidified CO
2 incubator at 37 °C.
When cells were grown into clusters, the cells were digested with EDTA-free trypsin (Solarbio, Beijing, China) and inoculated in 96-well plates until there was only one cell in the well, which was a monoclonal well. The monoclonal wells were cultivated for 14 days. Monoclonal cells with CRISPR/Cas9-mediated
CD274 deletion were obtained using PCR (
Table S2). Finally, Sanger sequencing and Western Blot were used to verify the homozygotes (
Figure S1).
4.3. Chemical Concentration Screening
ISO was purchased from Shanghai Tauto Biotech Co., Ltd. (Shanghai, China) with a purity of ≥98%. ISO was aliquoted at a concentration of 30 mM in DMSO and stored at −20 °C until use. Drug concentration screening was estimated by using the CCK-8 assay (CK001-500T, LABLEAD Inc., Beijing, China). Briefly, 10
4 cells were seeded in 96-well plates with 100 μL RPMI-1640 medium in each well. After 24 h cultivation, 0, 40, 80, 160, and 320 μM of ISO in basic medium were added. After 48 h of co-culture, each well was incubated with 10 μL CCK-8 solution for 2 h away from light before measuring the absorbance at 450 nm using a PerkinElmer’s EnSpire Multilabel Plate Reader (PerkinElmer, Wellesley, MA, USA). ISO-biotin (B-ISO) was synthesized by Wayen Biotechnologies (Shanghai, China) for pull-down assays (
Figure S2).
4.4. Cell Viability Assay
To investigate their growth velocity, U27 and U27−/− cells were cultured in 6-well plates at a density of 5 × 10³ cells per well. After 48 h of incubation, cells from three wells were removed, digested with trypsin, and then centrifuged at 1000× g for 10 min. The supernatant was then removed, and fresh medium was added to resuspend the cells to form a single-cell suspension. Then, 10 μL of cell suspension was absorbed and added to a blood cell counting plate for counting under a microscope (CKX41, Olympus Corporation, Tokyo, Japan). Samples were taken every 24 h for 6 days, and a cell growth curve was plotted with the resulting data. The experiment was performed in triplicate.
4.5. Migration and Invasion Assays
CMT-U27 cells (2 × 10³ cells/insert) were seeded into the upper chamber (8 μm, Corning Inc., Corning, NY, USA) of 24-well Transwell plates (Corning) in media containing different concentrations of ISO (0, 10, 20, and 40 µM). For the invasion assay, the upper chambers were coated with Matrigel (BD Biosciences, San Jose, CA, USA), and 600 µL of complete medium was added to the lower chambers. After incubating for 48 h, the initial medium and Matrigel were discarded. The cells that settled at the bottom of the chamber were monitored after Crystal Violet staining for 3 min and washing with PBS. Five fields per well were randomly chosen, and the cells were counted using an inverted microscope at 20× magnification (Olympus IX53/DP80, Tokyo, Japan). The experiment was performed in triplicate.
4.6. TUNEL Assay
For TUNEL assays, to determine ISO-induced cell apoptosis, CMT-U27 cells (2 × 10³ cells/insert) were seeded into 24-well Transwell plates (Corning) in media containing either different concentrations of ISO (0, 10, 20, and 40 µM) for 48 h or gefitinib (10 µM) for 12 h. The cells were fixed with 4% paraformaldehyde for 30 min, and then PBS was added containing 0.3% Triton X-100. The TUNEL detection solution was then incubated in the dark for 60 min at 37 °C. The cells were washed three times with PBS, after which the plates were sealed with anti-fluorescence burst sealing solution and observed under a fluorescence microscope (CKX41, Olympus Corporation, Tokyo, Japan).
4.7. JC-1 Assay
For JC-1 assays, to investigate whether ISO impacted the mitochondrial membrane potential, CMT-U27 cells (2 × 10³ cells/insert) were seeded into 6-well Transwell plates (Corning) in media containing either different concentrations of ISO (0, 10, 20, and 40 µM) for 48 h or gefitinib (10 µM) for 12 h. CCCP (10 mM) provided in the JC-1 kit (C2003S, Beyotime, Shanghai, China) was used to dilute the cell culture medium to 10 µM, and the cells were left for 20 min as a positive control. The cells were incubated for 20 min at 37 °C in a cell incubator before being washed twice with JC-1 staining buffer. Finally, 2 mL of cell culture solution was added to a cell incubator, and cells were observed under a fluorescence microscope.
4.8. Immunofluorescence Assay
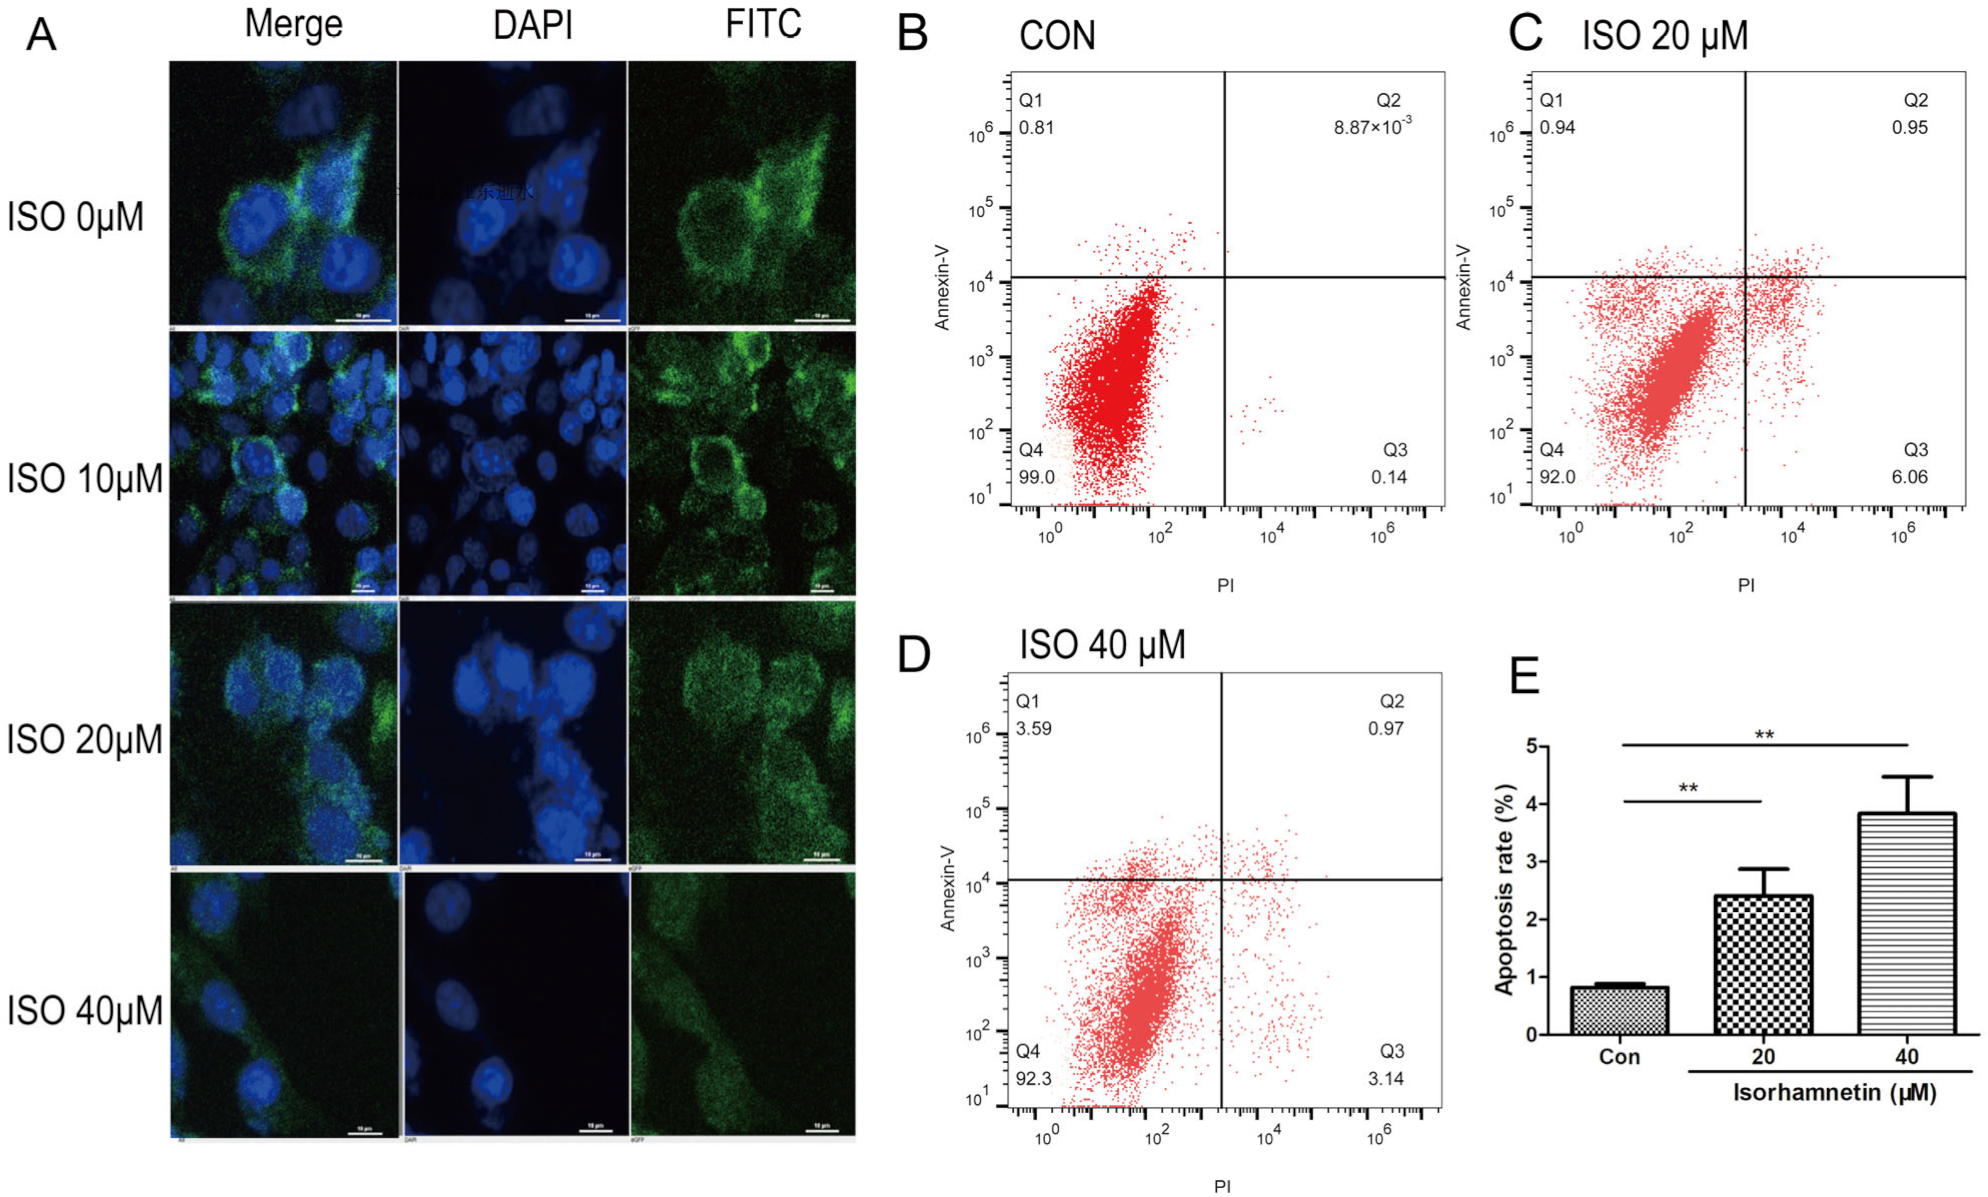
Polyline (Solarbio, P8141) pretreated coverslips, which were embedded in 24-well plates, were seeded with U27 cells at a density of 1 × 10⁴ cells per well. PD-L1 was diluted to 1 µg/mL as the primary antibody (Thermo Fisher Scientific, Waltham, MA, USA; 14-5983-82). After treatment with different concentrations of ISO (0, 10, 20, and 40 µM) for 48 h, cells were treated with acetone:methanol (1:1) for 20 min. PD-L1 was used to stain cells for 16 h at 4 °C. Cells were then washed with PBS and cultured with secondary antibodies (1 µg/mL FITC goat anti-mouse IgG; Abcam, Cambridge, UK; ab6785) for 1 h. Finally, cells were washed with PBS and incubated with DAPI (BD Transduction Laboratories, Franklin Lakes, NJ, USA) and then examined under a fluorescence microscope (CKX41).
4.9. Annexin V-FITC/PI Double Staining Assay
U27 cells (2 × 10⁵ cells/well/mL) were seeded in 6-well plates, and basic medium containing ISO (20 and 40 μM) was added to each well. Annexin V-FITC/PI Apoptosis Detection Kit (Invitrogen, USA)was used to detect the level of cell apoptosis. After 48 h, the medium was collected, and adherent cells were removed using EDTA-free trypsin (Solarbio, Beijing, China). Samples were centrifuged at 1000× g for 5 min at 4 °C. Next, samples were incubated with Annexin V-FITC solution in the dark for 15 min at 25 °C. Then, propidium iodine (PI) solution was added and incubated for 5 min in the dark. FACSVerse flow cytometer25 (FCM, BD Biosciences, San Jose, CA, USA) was used to analyze the number of apoptotic cells, and FlowJo v10.7 software (Tree Star, Woodburn, OR, USA) was used to determine the apoptotic ratio. Quadrant 1 represents early apoptosis, quadrant 2 represents late apoptotic cells, quadrant 3 represents necrotic cells, and quadrant 4 represents live cells. The apoptosis rate was calculated as the sum of the percentages of cells in quadrant 1 section and quadrant 2 section.
4.10. Animal Studies
All animal procedures were performed following the Guidelines for Care and Use of Laboratory Animals of Beijing Municipal Academy of Agriculture and Forestry and approved by the Animal Care and Use Committee of the Institute of Animal Husbandry and Veterinary Medicine (approval number: IHVM11-2302-5).
For murine xenotransplantation models, a cell suspension of 107 U27 cells or 107 U27−/− cells in 0.2 mL PBS was inoculated subcutaneously into the left mammary fat pads of 20 5-week-old female BALB/SCID nude mice. Tumors were visible after ~7 days. Mice were randomly separated into the control group (0.9% normal saline) and ISO group (50 mg/kg); the latter were injected with ISO three times a day for nine days.
To develop murine immunocompetent allograft mammary tumor models, a cell suspension of 10
5 4T1 cells in 0.1 mL PBS was inoculated subcutaneously into the left mammary fat pads of 10 5-week-old female BALB/c mice. Once the tumor was visible, the ISO group was injected with 50 mg/kg ISO intraperitoneally every 3 days for 12 days, and the control group was injected with 0.9% normal saline. Body weight and tumor volume were measured every 2 days. Tumor volume was determined by using Equation (1):
At the end of the experiment, the mice were sacrificed, and each group of tumors was excised, weighed, and prepared for further experiments.
For the survival assay, 4T1 cells (1 × 10⁴) were injected into the left fat pad of 12 5-week-old female BALB/c mice. Once tumors were visible, mice were randomly separated into two groups (six mice/group) and received intraperitoneal administration of ISO (50 mg/kg) or 0.9% normal saline every 3 days. The mice were observed daily until their death. The experiment ended once all the mice in the control group had died. One-way analysis of variance (ANOVA) was used for comparisons between different groups.
4.11. Western Blotting
U27 and U27
−/− cells (5 × 10
5 cells) were treated with different concentrations of ISO (0, 10, 20, and 40 µM) for 48 h and then used for protein extraction. Whole-protein extraction of U27, U27
−/−, and tumor tissues from sacrificed mice was performed using RIPA lysis buffer (MCE, HY-K1001) and a 10% protease inhibitor cocktail (MCE, HY-K0010). A BCA Protein Assay Kit (Beyotime, P0012) was used to determine protein concentrations. SDS-PAGE was used to separate lysate proteins and transfer proteins to PVDF membranes, which were then incubated with primary antibodies against EGFR (1:1000, Cell Signaling Technology, Danvers, MA, USA; #4267), p-EGFR (1:1000, Cell Signaling Technology, #3777T), STAT3 (1:1000, Cell Signaling Technology, #9139), p-STAT3(1:1000, phosphor S727, Abcam, ab30647), p-STAT3 (1:1000, phosphor Y705, ab76315), PD-L1 (1:1000, Thermo Fisher Scientific, 14-5983-82), and β-actin (1:1000, Invitrogen, MA1-140) [
36] overnight at 4 °C. Primary antibodies were diluted in a ratio of 1:1000. Secondary antibodies were IRDye 800CW goat anti-mouse IgG (H + L), (926-32210, LI-COR) or IRDye 800CW goat anti-rabbit IgG (H + L), (926-32211, LI-COR) at a dilution of 1:15,000, and membranes were incubated with the secondary antibodies for 1 h. The antigens were then visualized with the Odyssey infrared imaging system (LI-COR Biosciences, Lincoln, NE, USA). β-actin was used as a loading control. The relative density of protein bands in each blot was measured using the ImageJ program (version 1.51j8, National Institutes of Health, Bethesda, MD, USA).
4.12. Drug Toxicity Assay
4T1 was inoculated into ten 5-week-old female BALB/c mice subcutaneously, as described in
Section 4.10 After injection with ISO (100 mg/kg) or 0.9% normal saline for 20 days, BALB/c mice were sacrificed. The organs were dissected, fixed in 4% paraformaldehyde, and then dehydrated and embedded in paraffin. Samples were then cut into 4 µm thick sections and stained with hematoxylin and eosin (H&E). The slides were observed under a light microscope (Nikon, Tokyo, Japan).
4.13. Immunohistochemical Staining
For immunohistochemical (IHC) analysis, U27 cell xenograft tumors, U27−/− cell xenograft tumors, and 4T1-induced tumors were prepared in 3 µm samples. Tumors were assessed with primary antibodies at a concentration of 1 µg/mL for Ki-67 (Abcam, ab16667), cleaved caspase3 (Cell Signaling Technology, # 9661), and PD-L1 (Thermo Fisher Scientific, 14-5983-82). Deparaffinized samples were placed in a PT module with EDTA buffer solution (pH 8.0) (Master Diagnostica, São Paulo, Brazil; MAD-004072R/D). The specimens were incubated with primary antibodies for 16 h at 4 °C and with secondary antibodies (ZSGB-BIO, Beijing, China) for 1 h at room temperature. Subsequently, 3,3′-diaminobenzidine tetrahydrochloride (ZSGB-BIO, China) was used to visualize antibody binding. Sections were observed under a light microscope (Olympus), and the number of positive cells was quantified by ImageJ software. The sample was considered positive for ki-67, cleaved caspase3, and PD-L1 if >10% of tumor cells were positive for antibody binding.
4.14. Construction of EGFR Expression Vectors
The sequence encoding the EGFR domain (amino acid residues Met1–Ser618) from domestic dog Canis lupus familiaris was cloned into the NdeI and XhoI sites of pET-28a (+) plasmids (GE Healthcare, Boston, MA, USA). Plasmids were then transfected into BL21 cells named Pet28a-EGFR-Bl21 (CWBIO, Beijing, China). Expression of His-EGFR recombinant protein was induced by isopropyl-β-D-thiogalactopyranoside for 4 h at 37 °C.
4.15. Protein Purification
Under ice bath conditions, Pet28a-EGFR-Bl21 bacteria were broken by ultrasonic waves (power 60%, ultrasound 5 s, rest 5 s, 30 min). The solution was then centrifuged at 12,000× g for 30 min, and the supernatant was then collected and precipitated. SDS-Page electrophoresis was performed by adding SDS loading buffer.
The bacterial precipitate recovered after ultrasonic centrifugation was washed with 2M urea and then 1% TritonX-100 (0.1 M PBS, pH 7.4) three times. Inclusion bodies were incubated with 8M urea on ice overnight so that they dissolved completely. The resulting solution was centrifuged at 12,000× g for 30 min to remove any insoluble impurities. The remaining protein was collected and stored at −80 °C until use. Proteins were quantified with the BCA protein assay kit (Pierce, Rockford, Rockford, IL, USA).
4.16. Predicted Binding Sites of EGFR and ISO
The 3D structure of ISO in SDF format was downloaded from PubChem and then imported into ChemBio3D Ultra 14.0 for energy minimization. The minimum RMS gradient was set to 0.001, and the small molecule was saved as a mol2 file. The optimized small molecule was then imported into AutodockTools-1.5.6 for hydrogenation, charge calculation, charge assignment, and rotatable key setting and saved as a “pdbqt” file. Then, the protein was imported into Pymol 2.3.0 to remove protein crystalline water and original ligands. The EGFR structure was imported into AutoDocktools (v1.5.6) for hydrogenation, charge calculation, charge assignment, and specification of atom types and was then saved as a “pdbqt” file. The protein-binding sites were predicted using POCASA 1.1 and docked using AutoDock Vina1.1.2 with protein-related parameters set to the following: center_x = −5.3; center_y = −0.3; center_z = 9.6; search space: size_x: 60; size_y: 60; size_z: 60 (the spacing of each grid point was 0.375 Å), and exhaustiveness: 10; the remaining parameters were set by default.
4.17. Streptavidin–Biotin Affinity Pull-Down Assay
Cell lysis buffer containing a 1% protease inhibitor cocktail was used to lyse CMT-U27 cells. The cell lysates were cultivated with free biotin (MedChemExpress, MCE, South Brunswick, NJ, USA) or ISO-biotin (5 mM) for 5 h at 4 °C. Then, prewashed streptavidin agarose beads (Yeasen Biotech, Shanghai, China) were added and incubated overnight at 4 °C with rotation. Elution buffer was used to wash the beads three times, and then denatured protein was detected by SDS-PAGE and enzymes by trypsin overnight at 37 °C. After the enzymatic polypeptides were collected, the proteins were analyzed using mass spectrometry (MS, BGI, Beijing, China).
The differential proteins obtained from the comparison of control and ISO groups were subjected to Gene Ontology (GO) and Kyoto Encyclopedia of Genes and Genomes (KEGG) Pathway analyses. These were performed at two levels (bioinformatic annotation and analysis) to better understand the functional properties of these proteins and their relevance to the study target so that more relevant proteins could be selected for further research.
4.18. ISO and EGFR Surface Plasmon Resonance Assay
Sensor NTA chip was used to immobilize histidine-tagged proteins for surface plasmon resonance (SPR) assays. To do so, 5 mM NiCl2 flowed through the surface of the chip test channel at a flow rate of 30 μL/min for 120 s. After the target EGFR was captured by the divalent nickel ion in the analysis buffer, the protein was injected into the chip and was diluted to 20 μg/mL. The flow rate was set to 10 μL/min for 240 s to capture EGFR protein.
The binding properties of EGFR to ISO were initially determined and evaluated manually. The highest concentration of EGFR used was 100 μM, and nine concentrations were established to form a twofold gradient dilution: 0, 0.78125, 1.5625, 3.125, 6.25, 12.5, 25, 50, and 100 μM. The experiments were run in multiple cycles. The data were fitted using BIAcore T200 analysis software v3.2 (GE Biacore, Boston, MA, USA) using a 1:1 Langmuir binding model, and the steady-state fitting methods were used to determine the KD value.
4.19. Statistical Analysis
All data were expressed by GraphPad Prism 8.0 (San Diego, CA, USA) and are shown as means ± standard deviation (SD). An unpaired Student’s t-test and one-way analysis of variance (ANOVA) were used for comparisons between two different groups or larger numbers of groups. A log-rank test was used for the contrast of survival curves. p-values < 0.05 were considered to be statistically significant.


 ,
, 