
Lipid Metabolism Regulators Are the Possible Determinant for Characteristics of Myopic Human Scleral Stroma Fibroblasts (HSSFs)


 , and
, and
Abstract
:1. Introduction
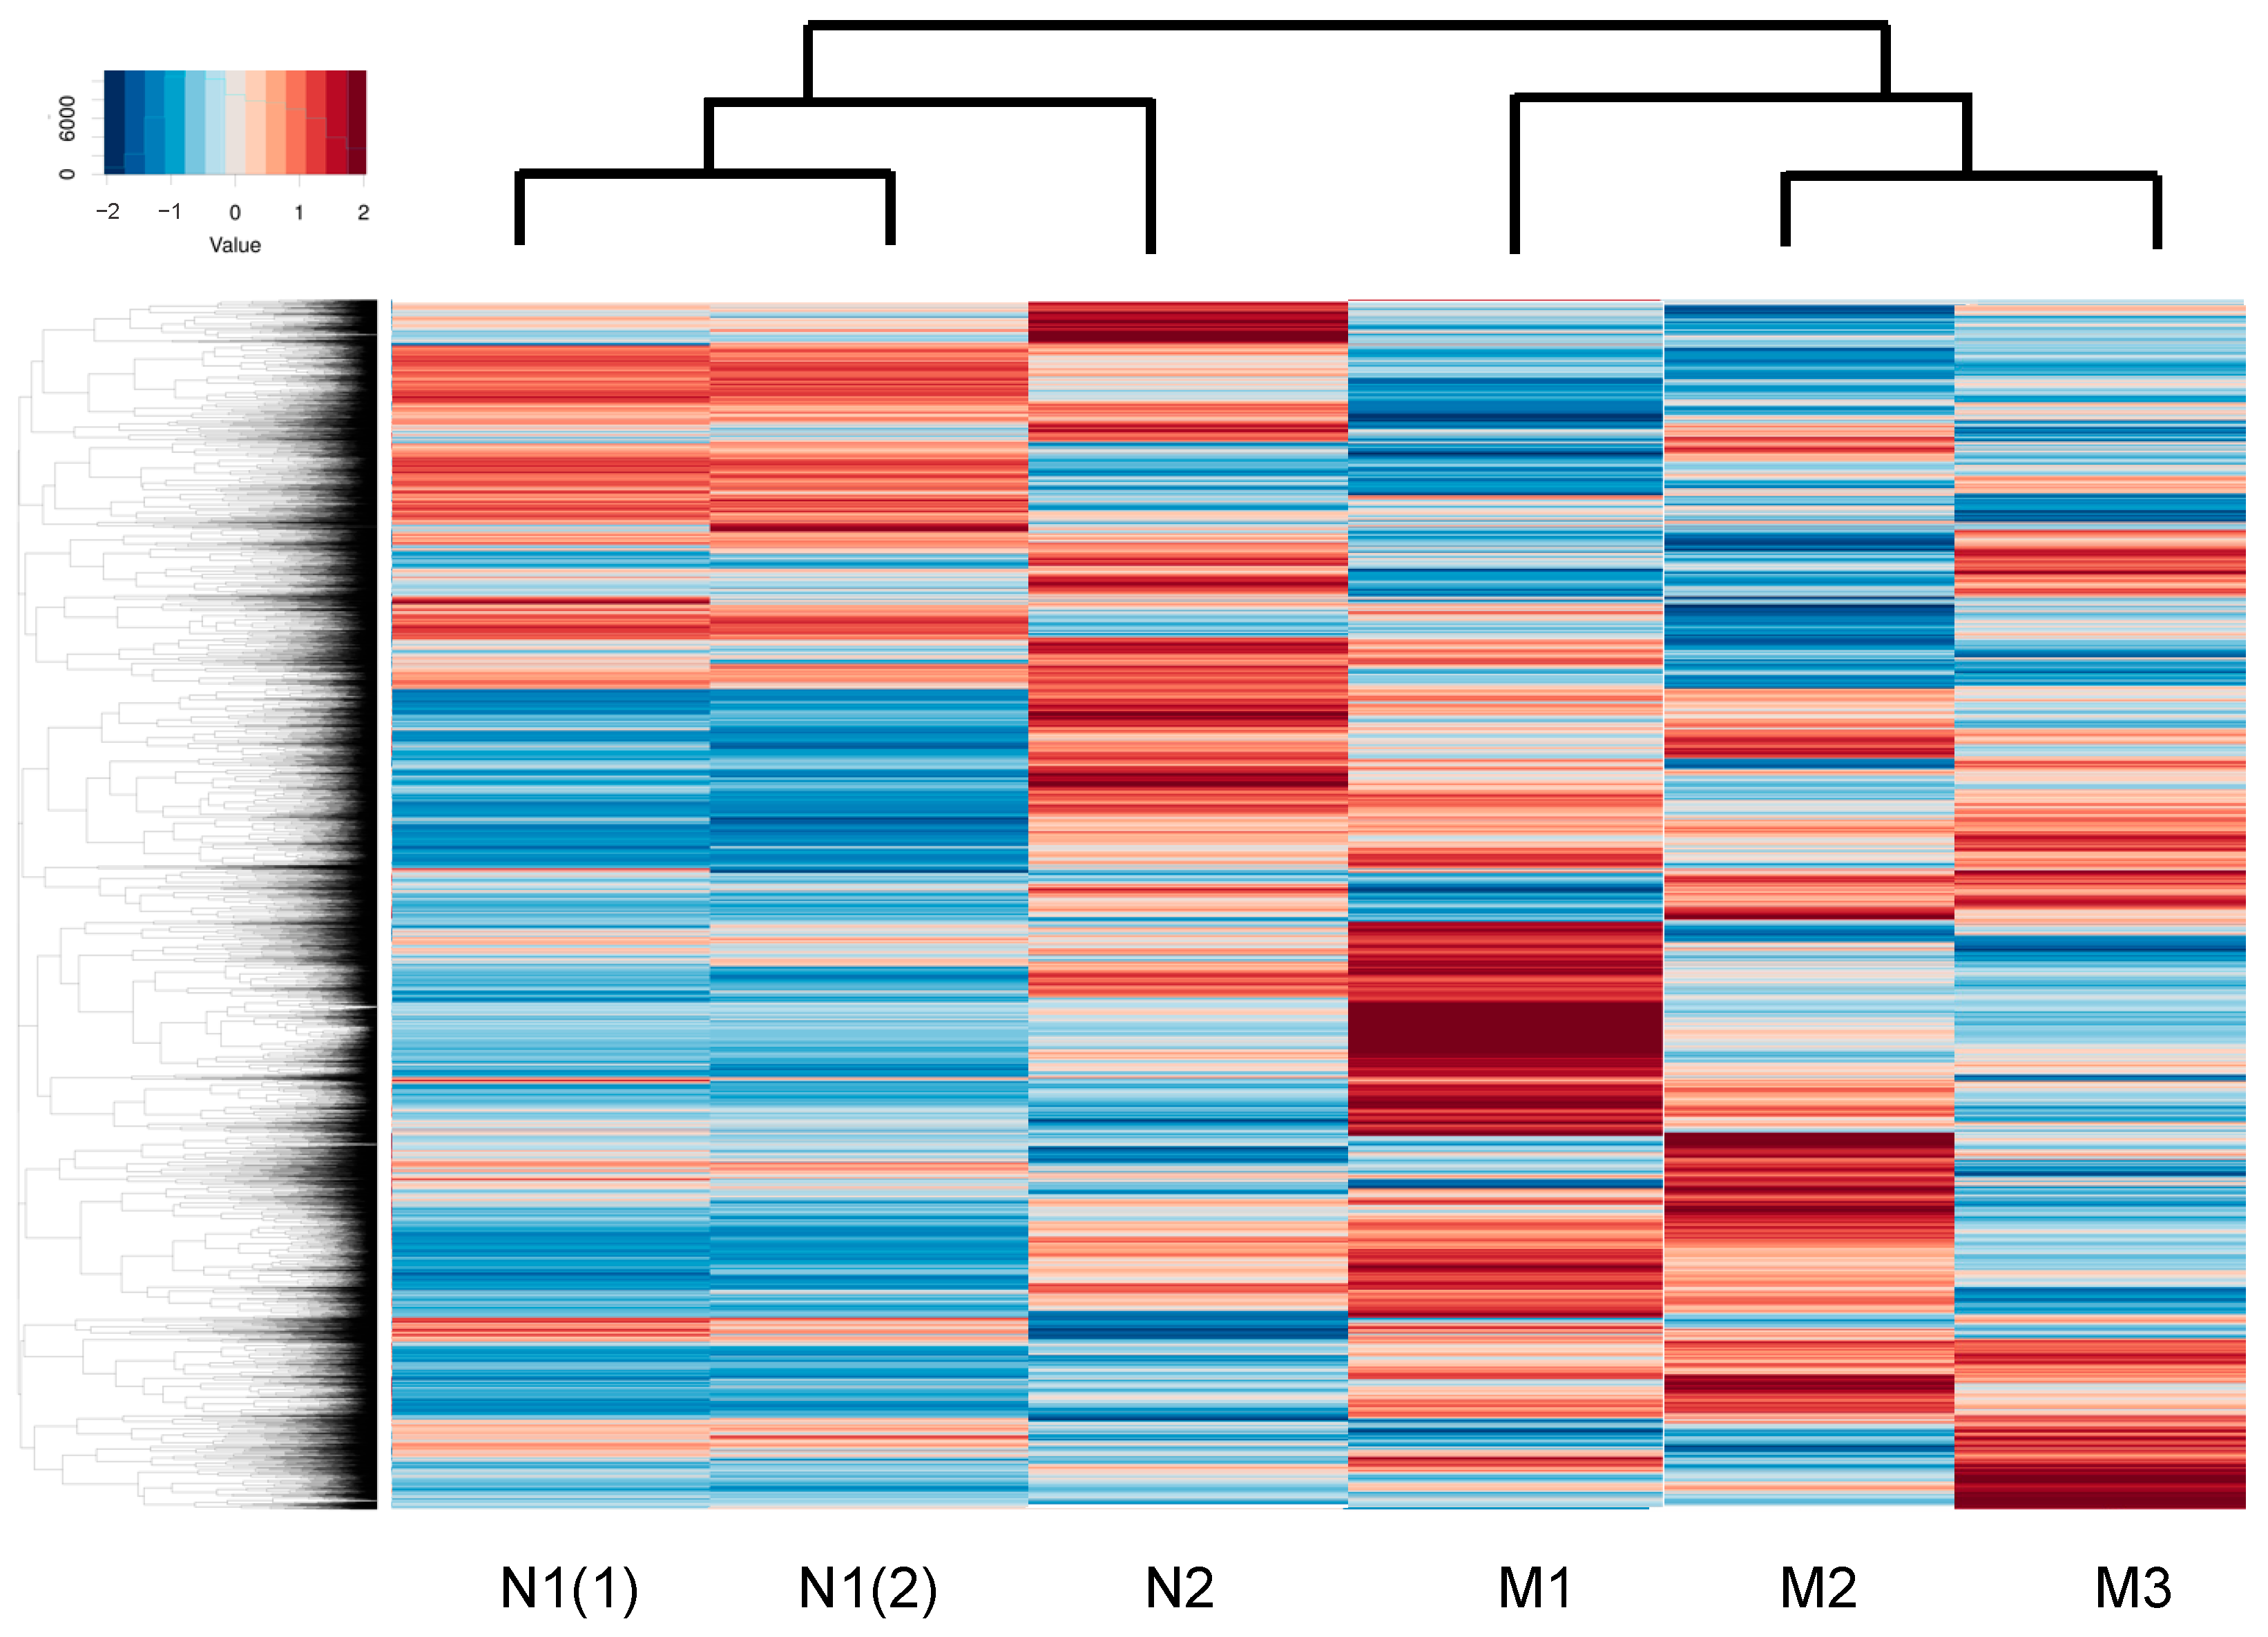
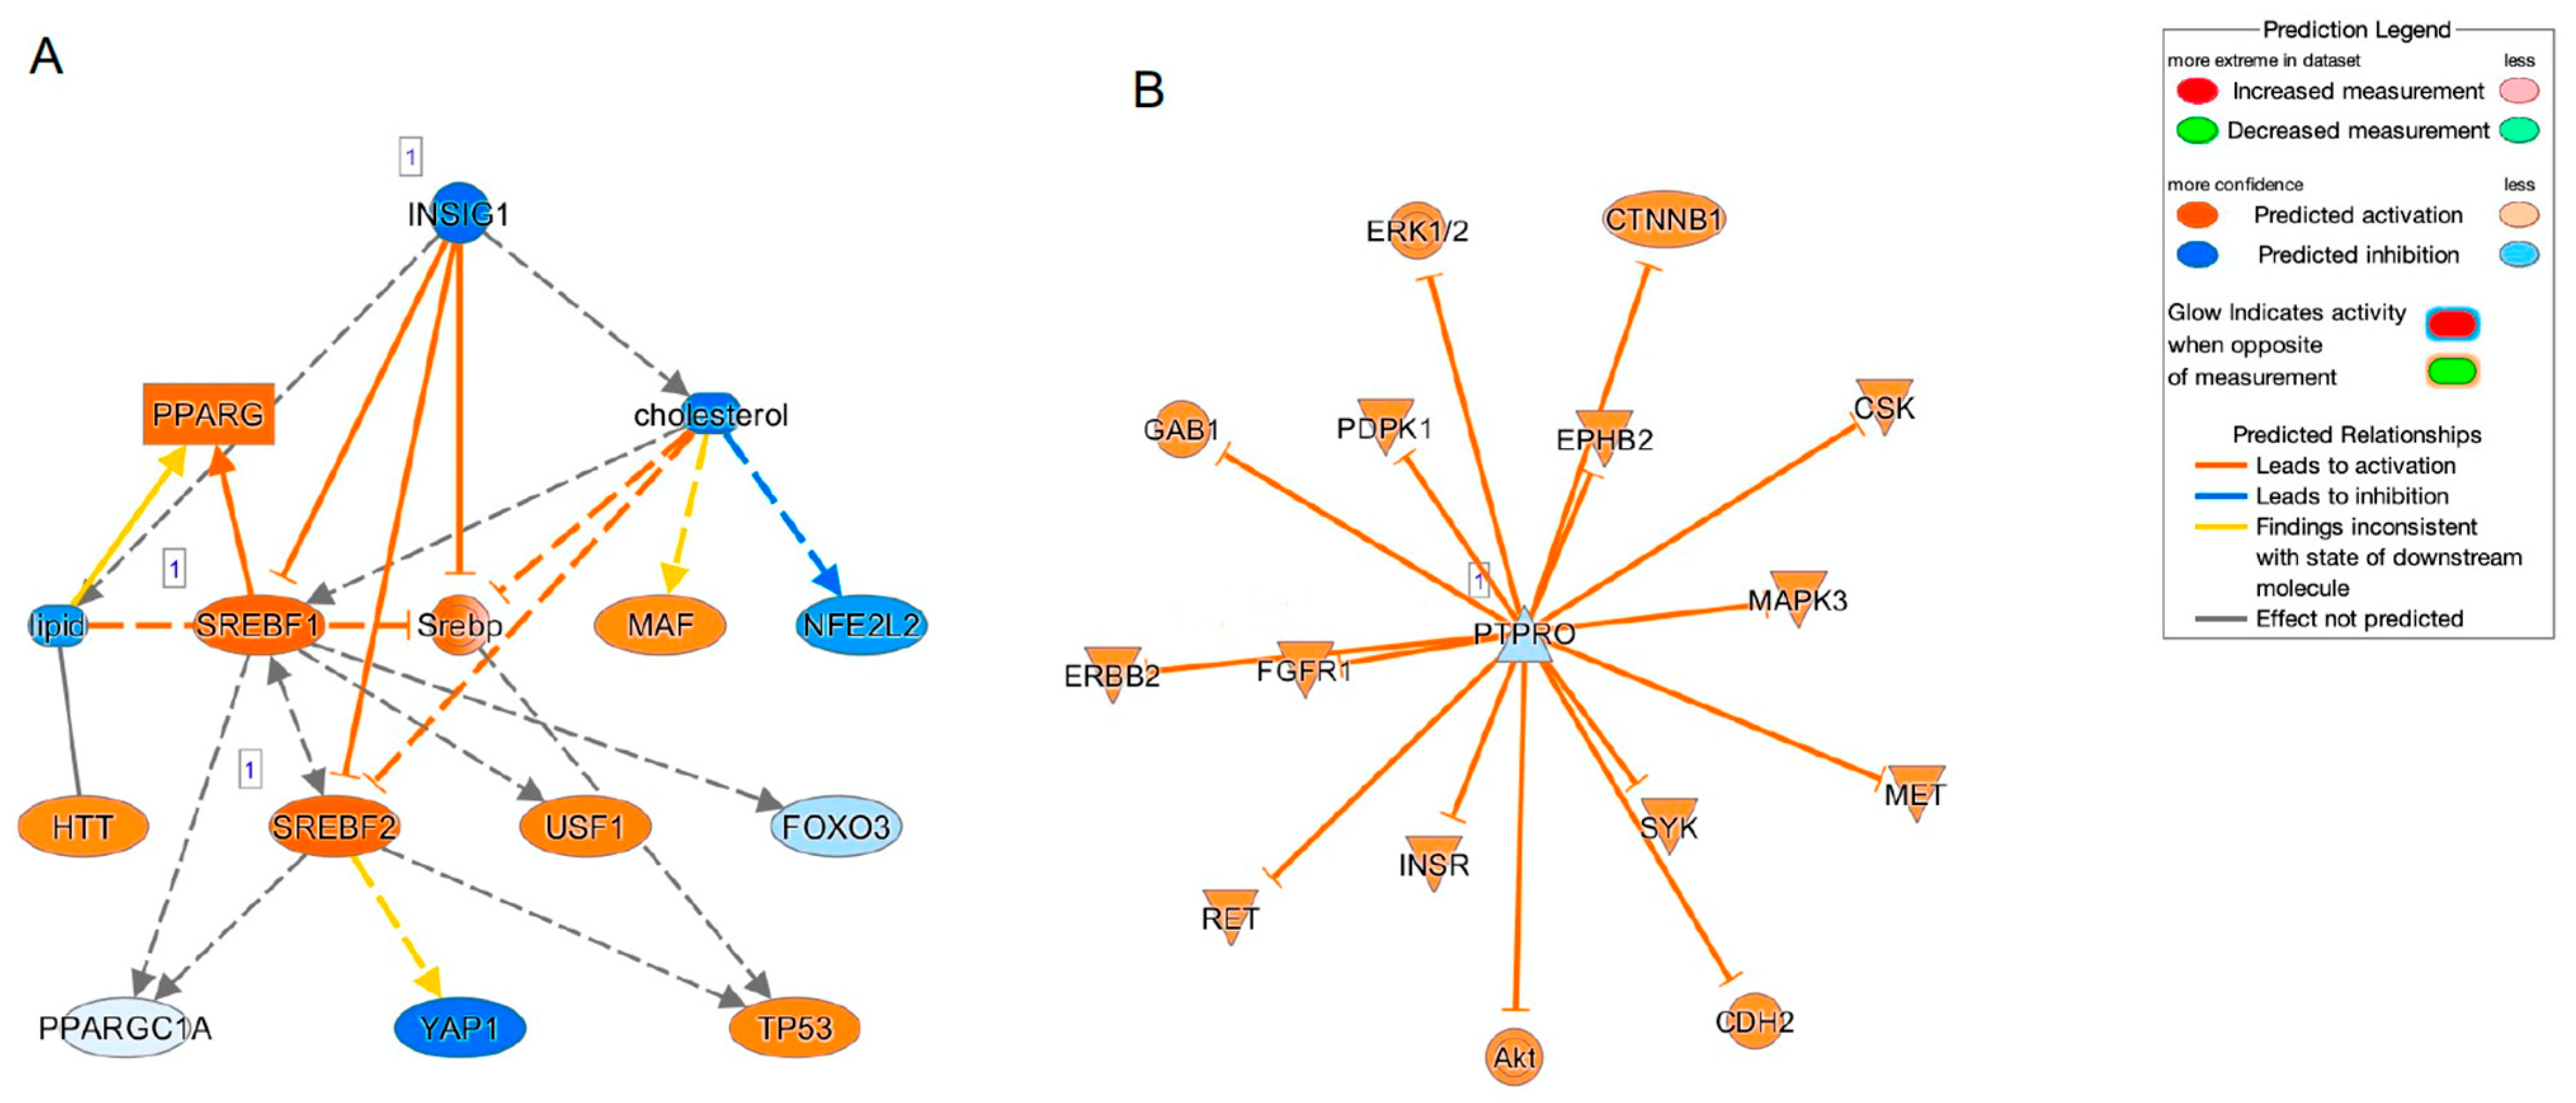
2. Results
3. Discussion
4. Materials and Methods
4.1. Preparation of HSSFs
4.2. Measurements of Mitochondrial Respiration and Glycolytic Functions in 2D Cultured HSSF Cells
4.3. RNA Sequencing Analysis and Estimation of Possible Biological Functions
4.4. Other Analytical Methods
Supplementary Materials
Author Contributions
Funding
Institutional Review Board Statement
Informed Consent Statement
Data Availability Statement
Conflicts of Interest
References
- Fricke, T.R.; Jong, M.; Naidoo, K.S.; Sankaridurg, P.; Naduvilath, T.J.; Ho, S.M.; Wong, T.Y.; Resnikoff, S. Global prevalence of visual impairment associated with myopic macular degeneration and temporal trends from 2000 through 2050: Systematic review, meta-analysis and modelling. Br. J. Ophthalmol. 2018, 102, 855–862. [Google Scholar] [CrossRef] [PubMed]
- Morgan, I.G.; French, A.N.; Ashby, R.S.; Guo, X.; Ding, X.; He, M.; Rose, K.A. The epidemics of myopia: Aetiology and prevention. Prog. Retin. Eye Res. 2018, 62, 134–149. [Google Scholar] [CrossRef] [PubMed]
- Han, X.; Liu, C.; Chen, Y.; He, M. Myopia prediction: A systematic review. Eye 2022, 36, 921–929. [Google Scholar] [CrossRef] [PubMed]
- Ohno-Matsui, K.; Wu, P.C.; Yamashiro, K.; Vutipongsatorn, K.; Fang, Y.; Cheung, C.M.G.; Lai, T.Y.Y.; Ikuno, Y.; Cohen, S.Y.; Gaudric, A.; et al. IMI Pathologic Myopia. Investig. Ophthalmol. Vis. Sci. 2021, 62, 5. [Google Scholar] [CrossRef] [PubMed]
- Ohno-Matsui, K. Proposed classification of posterior staphylomas based on analyses of eye shape by three-dimensional magnetic resonance imaging and wide-field fundus imaging. Ophthalmology 2014, 121, 1798–1809. [Google Scholar] [CrossRef] [PubMed]
- Boote, C.; Sigal, I.A.; Grytz, R.; Hua, Y.; Nguyen, T.D.; Girard, M.J.A. Scleral structure and biomechanics. Prog. Retin. Eye Res. 2020, 74, 100773. [Google Scholar] [CrossRef] [PubMed]
- McBrien, N.A.; Gentle, A. Role of the sclera in the development and pathological complications of myopia. Prog. Retin. Eye Res. 2003, 22, 307–338. [Google Scholar] [CrossRef]
- Metlapally, R.; Wildsoet, C.F. Scleral Mechanisms Underlying Ocular Growth and Myopia. Prog. Mol. Biol. Transl. Sci. 2015, 134, 241–248. [Google Scholar] [CrossRef]
- Harper, A.R.; Summers, J.A. The dynamic sclera: Extracellular matrix remodeling in normal ocular growth and myopia development. Exp. Eye Res. 2015, 133, 100–111. [Google Scholar] [CrossRef]
- Rada, J.A.; Shelton, S.; Norton, T.T. The sclera and myopia. Exp. Eye Res. 2006, 82, 185–200. [Google Scholar] [CrossRef]
- Gentle, A.; Liu, Y.; Martin, J.E.; Conti, G.L.; McBrien, N.A. Collagen gene expression and the altered accumulation of scleral collagen during the development of high myopia. J. Biol. Chem. 2003, 278, 16587–16594. [Google Scholar] [CrossRef] [PubMed]
- Keeley, F.W.; Morin, J.D.; Vesely, S. Characterization of collagen from normal human sclera. Exp. Eye Res. 1984, 39, 533–542. [Google Scholar] [CrossRef] [PubMed]
- Larsen, J.S. The sagittal growth of the eye. IV. Ultrasonic measurement of the axial length of the eye from birth to puberty. Acta Ophthalmol. 1971, 49, 873–886. [Google Scholar] [CrossRef] [PubMed]
- Zadnik, K.; Satariano, W.A.; Mutti, D.O.; Sholtz, R.I.; Adams, A.J. The effect of parental history of myopia on children’s eye size. JAMA 1994, 271, 1323–1327. [Google Scholar] [CrossRef] [PubMed]
- Curtin, B.J. The posterior staphyloma of pathologic myopia. Trans. Am. Ophthalmol. Soc. 1977, 75, 67–86. [Google Scholar] [PubMed]
- Avetisov, E.S.; Savitskaya, N.F.; Vinetskaya, M.I.; Iomdina, E.N. A study of biochemical and biomechanical qualities of normal and myopic eye sclera in humans of different age groups. Metab. Pediatr. Syst. Ophthalmol. 1983, 7, 183–188. [Google Scholar] [PubMed]
- Rada, J.A.; Nickla, D.L.; Troilo, D. Decreased proteoglycan synthesis associated with form deprivation myopia in mature primate eyes. Investig. Ophthalmol. Vis. Sci. 2000, 41, 2050–2058. [Google Scholar]
- Siegwart, J.T., Jr.; Norton, T.T. Selective regulation of MMP and TIMP mRNA levels in tree shrew sclera during minus lens compensation and recovery. Investig. Ophthalmol. Vis. Sci. 2005, 46, 3484–3492. [Google Scholar] [CrossRef]
- Liu, H.H.; Kenning, M.S.; Jobling, A.I.; McBrien, N.A.; Gentle, A. Reduced Scleral TIMP-2 Expression Is Associated With Myopia Development: TIMP-2 Supplementation Stabilizes Scleral Biomarkers of Myopia and Limits Myopia Development. Investig. Ophthalmol. Vis. Sci. 2017, 58, 1971–1981. [Google Scholar] [CrossRef]
- Hikage, F.; Atkins, S.; Kahana, A.; Smith, T.J.; Chun, T.H. HIF2A-LOX Pathway Promotes Fibrotic Tissue Remodeling in Thyroid-Associated Orbitopathy. Endocrinology 2019, 160, 20–35. [Google Scholar] [CrossRef]
- Itoh, K.; Hikage, F.; Ida, Y.; Ohguro, H. Prostaglandin F2α Agonists Negatively Modulate the Size of 3D Organoids from Primary Human Orbital Fibroblasts. Investig. Ophthalmol. Vis. Sci. 2020, 61, 13. [Google Scholar] [CrossRef] [PubMed]
- Itoh, K.; Ida, Y.; Ohguro, H.; Hikage, F. Prostaglandin F2α agonists induced enhancement in collagen1 expression is involved in the pathogenesis of the deepening of upper eyelid sulcus. Sci. Rep. 2021, 11, 9002. [Google Scholar] [CrossRef] [PubMed]
- Ota, C.; Ida, Y.; Ohguro, H.; Hikage, F. ROCK inhibitors beneficially alter the spatial configuration of TGFβ2-treated 3D organoids from a human trabecular meshwork (HTM). Sci. Rep. 2020, 10, 20292. [Google Scholar] [CrossRef] [PubMed]
- Katayama, H.; Furuhashi, M.; Umetsu, A.; Hikage, F.; Watanabe, M.; Ohguro, H.; Ida, Y. Modulation of the Physical Properties of 3D Spheroids Derived from Human Scleral Stroma Fibroblasts (HSSFs) with Different Axial Lengths Obtained from Surgical Patients. Curr. Issues Mol. Biol. 2021, 43, 1715–1725. [Google Scholar] [CrossRef] [PubMed]
- Yokoyama, C.; Wang, X.; Briggs, M.R.; Admon, A.; Wu, J.; Hua, X.; Goldstein, J.L.; Brown, M.S. SREBP-1, a basic-helix-loop-helix-leucine zipper protein that controls transcription of the low density lipoprotein receptor gene. Cell 1993, 75, 187–197. [Google Scholar] [CrossRef]
- Tontonoz, P.; Kim, J.B.; Graves, R.A.; Spiegelman, B.M. ADD1: A novel helix-loop-helix transcription factor associated with adipocyte determination and differentiation. Mol. Cell. Biol. 1993, 13, 4753–4759. [Google Scholar] [CrossRef] [PubMed]
- Horton, J.D.; Goldstein, J.L.; Brown, M.S. SREBPs: Activators of the complete program of cholesterol and fatty acid synthesis in the liver. J. Clin. Investig. 2002, 109, 1125–1131. [Google Scholar] [CrossRef] [PubMed]
- Horton, J.D.; Shimomura, I.; Brown, M.S.; Hammer, R.E.; Goldstein, J.L.; Shimano, H. Activation of cholesterol synthesis in preference to fatty acid synthesis in liver and adipose tissue of transgenic mice overproducing sterol regulatory element-binding protein-2. J. Clin. Investig. 1998, 101, 2331–2339. [Google Scholar] [CrossRef]
- Shimano, H.; Horton, J.D.; Shimomura, I.; Hammer, R.E.; Brown, M.S.; Goldstein, J.L. Isoform 1c of sterol regulatory element binding protein is less active than isoform 1a in livers of transgenic mice and in cultured cells. J. Clin. Investig. 1997, 99, 846–854. [Google Scholar] [CrossRef]
- Hua, X.; Nohturfft, A.; Goldstein, J.L.; Brown, M.S. Sterol resistance in CHO cells traced to point mutation in SREBP cleavage-activating protein. Cell 1996, 87, 415–426. [Google Scholar] [CrossRef]
- Rawson, R.B.; Zelenski, N.G.; Nijhawan, D.; Ye, J.; Sakai, J.; Hasan, M.T.; Chang, T.Y.; Brown, M.S.; Goldstein, J.L. Complementation cloning of S2P, a gene encoding a putative metalloprotease required for intramembrane cleavage of SREBPs. Mol. Cell 1997, 1, 47–57. [Google Scholar] [CrossRef] [PubMed]
- Sakai, J.; Rawson, R.B.; Espenshade, P.J.; Cheng, D.; Seegmiller, A.C.; Goldstein, J.L.; Brown, M.S. Molecular identification of the sterol-regulated luminal protease that cleaves SREBPs and controls lipid composition of animal cells. Mol. Cell 1998, 2, 505–514. [Google Scholar] [CrossRef] [PubMed]
- Yang, T.; Espenshade, P.J.; Wright, M.E.; Yabe, D.; Gong, Y.; Aebersold, R.; Goldstein, J.L.; Brown, M.S. Crucial step in cholesterol homeostasis: Sterols promote binding of SCAP to INSIG-1, a membrane protein that facilitates retention of SREBPs in ER. Cell 2002, 110, 489–500. [Google Scholar] [CrossRef] [PubMed]
- Yabe, D.; Brown, M.S.; Goldstein, J.L. Insig-2, a second endoplasmic reticulum protein that binds SCAP and blocks export of sterol regulatory element-binding proteins. Proc. Natl. Acad. Sci. USA 2002, 99, 12753–12758. [Google Scholar] [CrossRef] [PubMed]
- Smith, T.M.; Gilliland, K.; Clawson, G.A.; Thiboutot, D. IGF-1 induces SREBP-1 expression and lipogenesis in SEB-1 sebocytes via activation of the phosphoinositide 3-kinase/Akt pathway. J. Investig. Dermatol. 2008, 128, 1286–1293. [Google Scholar] [CrossRef] [PubMed]
- Dai, W.; Xiang, W.; Han, L.; Yuan, Z.; Wang, R.; Ma, Y.; Yang, Y.; Cai, S.; Xu, Y.; Mo, S.; et al. PTPRO represses colorectal cancer tumorigenesis and progression by reprogramming fatty acid metabolism. Cancer Commun. 2022, 42, 848–867. [Google Scholar] [CrossRef] [PubMed]
- Shin, S.; Zhou, H.; He, C.; Wei, Y.; Wang, Y.; Shingu, T.; Zeng, A.; Wang, S.; Zhou, X.; Li, H.; et al. Qki activates Srebp2-mediated cholesterol biosynthesis for maintenance of eye lens transparency. Nat. Commun. 2021, 12, 3005. [Google Scholar] [CrossRef] [PubMed]
- Weetman, A.P. Graves’ disease. N. Engl. J. Med. 2000, 343, 1236–1248. [Google Scholar] [CrossRef]
- Park, M.; Kim, J.Y.; Kang, J.M.; Lee, H.J.; Banga, J.P.; Kim, G.J.; Lew, H. PRL-1 overexpressed placenta-derived mesenchymal stem cells suppress adipogenesis in Graves’ ophthalmopathy through SREBP2/HMGCR pathway. Stem Cell Res. Ther. 2021, 12, 304. [Google Scholar] [CrossRef]
- Werner, H. The IGF1 Signaling Pathway: From Basic Concepts to Therapeutic Opportunities. Int. J. Mol. Sci. 2023, 24, 14882. [Google Scholar] [CrossRef]
- Ritchey, E.R.; Zelinka, C.P.; Tang, J.; Liu, J.; Fischer, A.J. The combination of IGF1 and FGF2 and the induction of excessive ocular growth and extreme myopia. Exp. Eye Res. 2012, 99, 1–16. [Google Scholar] [CrossRef] [PubMed]
- Penha, A.M.; Schaeffel, F.; Feldkaemper, M. Insulin, insulin-like growth factor-1, insulin receptor, and insulin-like growth factor-1 receptor expression in the chick eye and their regulation with imposed myopic or hyperopic defocus. Mol. Vis. 2011, 17, 1436–1448. [Google Scholar] [PubMed]
- Young, T.L.; Ronan, S.M.; Alvear, A.B.; Wildenberg, S.C.; Oetting, W.S.; Atwood, L.D.; Wilkin, D.J.; King, R.A. A second locus for familial high myopia maps to chromosome 12q. Am. J. Hum. Genet. 1998, 63, 1419–1424. [Google Scholar] [CrossRef] [PubMed]
- Guo, L.; Du, X.; Lu, C.; Zhang, W.H. Association between Insulin-Like Growth Factor 1 Gene rs12423791 or rs6214 Polymorphisms and High Myopia: A Meta-Analysis. PLoS ONE 2015, 10, e0129707. [Google Scholar] [CrossRef] [PubMed]
- Metlapally, R.; Ki, C.S.; Li, Y.J.; Tran-Viet, K.N.; Abbott, D.; Malecaze, F.; Calvas, P.; Mackey, D.A.; Rosenberg, T.; Paget, S.; et al. Genetic association of insulin-like growth factor-1 polymorphisms with high-grade myopia in an international family cohort. Investig. Ophthalmol. Vis. Sci. 2010, 51, 4476–4479. [Google Scholar] [CrossRef] [PubMed]
- Zhuang, W.; Yang, P.; Li, Z.; Sheng, X.; Zhao, J.; Li, S.; Yang, X.; Xiang, W.; Rong, W.; Liu, Y.; et al. Association of insulin-like growth factor-1 polymorphisms with high myopia in the Chinese population. Mol. Vis. 2012, 18, 634–644. [Google Scholar] [PubMed]
- Miyake, M.; Yamashiro, K.; Nakanishi, H.; Nakata, I.; Akagi-Kurashige, Y.; Tsujikawa, A.; Moriyama, M.; Ohno-Matsui, K.; Mochizuki, M.; Yamada, R.; et al. Insulin-like growth factor 1 is not associated with high myopia in a large Japanese cohort. Mol. Vis. 2013, 19, 1074–1081. [Google Scholar] [PubMed]
- Yoshida, M.; Meguro, A.; Yoshino, A.; Nomura, N.; Okada, E.; Mizuki, N. Association study of IGF1 polymorphisms with susceptibility to high myopia in a Japanese population. Clin. Ophthalmol. 2013, 7, 2057–2062. [Google Scholar] [CrossRef]
- Meng, B.; Wang, K.; Huang, Y.; Wang, Y. The G allele of the IGF1 rs2162679 SNP is a potential protective factor for any myopia: Updated systematic review and meta-analysis. PLoS ONE 2022, 17, e0271809. [Google Scholar] [CrossRef]
- Mai, S.; Zhu, X.; Wan, E.Y.C.; Wu, S.; Yonathan, J.N.; Wang, J.; Li, Y.; Ma, J.Y.W.; Zuo, B.; Tse, D.Y.; et al. Postnatal eye size in mice is controlled by SREBP2-mediated transcriptional repression of Lrp2 and Bmp2. Development 2022, 149, dev200633. [Google Scholar] [CrossRef]
- Kammoun, H.L.; Chabanon, H.; Hainault, I.; Luquet, S.; Magnan, C.; Koike, T.; Ferré, P.; Foufelle, F. GRP78 expression inhibits insulin and ER stress-induced SREBP-1c activation and reduces hepatic steatosis in mice. J. Clin. Investig. 2009, 119, 1201–1215. [Google Scholar] [CrossRef] [PubMed]
- Usui, M.; Yamaguchi, S.; Tanji, Y.; Tominaga, R.; Ishigaki, Y.; Fukumoto, M.; Katagiri, H.; Mori, K.; Oka, Y.; Ishihara, H. Atf6α-null mice are glucose intolerant due to pancreatic β-cell failure on a high-fat diet but partially resistant to diet-induced insulin resistance. Metab. Clin. Exp. 2012, 61, 1118–1128. [Google Scholar] [CrossRef] [PubMed]
- Zhang, K.; Wang, S.; Malhotra, J.; Hassler, J.R.; Back, S.H.; Wang, G.; Chang, L.; Xu, W.; Miao, H.; Leonardi, R.; et al. The unfolded protein response transducer IRE1α prevents ER stress-induced hepatic steatosis. EMBO J. 2011, 30, 1357–1375. [Google Scholar] [CrossRef] [PubMed]
- Kobayashi, M.; Fujii, N.; Narita, T.; Higami, Y. SREBP-1c-Dependent Metabolic Remodeling of White Adipose Tissue by Caloric Restriction. Int. J. Mol. Sci. 2018, 19, 3335. [Google Scholar] [CrossRef] [PubMed]
- Rui, L. Energy metabolism in the liver. Compr. Physiol. 2014, 4, 177–197. [Google Scholar] [CrossRef] [PubMed]
- Xing, S.; Jiang, S.; Wang, S.; Lin, P.; Sun, H.; Peng, H.; Yang, J.; Kong, H.; Wang, S.; Bai, Q.; et al. Association of mitochondrial DNA variation with high myopia in a Han Chinese population. Mol. Genet. Genom. MGG 2023, 298, 1059–1071. [Google Scholar] [CrossRef] [PubMed]
- Li, F.F.; Zhu, M.C.; Shao, Y.L.; Lu, F.; Yi, Q.Y.; Huang, X.F. Causal Relationships Between Glycemic Traits and Myopia. Investig. Ophthalmol. Vis. Sci. 2023, 64, 7. [Google Scholar] [CrossRef]
- Færch, L.; Juul, A.; Pedersen-Bjergaard, U.; Thorsteinsson, B. Association of IGF1 with glycemic control and occurrence of severe hypoglycemia in patients with type 1 diabetes mellitus. Endocr. Connect. 2012, 1, 31–36. [Google Scholar] [CrossRef]
- Lian, P.; Zhao, X.; Song, H.; Tanumiharjo, S.; Chen, J.; Wang, T.; Chen, S.; Lu, L. Metabolic characterization of human intraocular fluid in patients with pathological myopia. Exp. Eye Res. 2022, 222, 109184. [Google Scholar] [CrossRef]
- Wang, Y.X.; Pan, Z.; Xue, C.C.; Xie, H.; Wu, X.; Jonas, J.B. Macular outer nuclear layer, ellipsoid zone and outer photoreceptor segment band thickness, axial length and other determinants. Sci. Rep. 2023, 13, 5386. [Google Scholar] [CrossRef]
- Miyagi, H.; Jalilian, I.; Murphy, C.J.; Thomasy, S.M. Modulation of human corneal stromal cell differentiation by hepatocyte growth factor and substratum compliance. Exp. Eye Res. 2018, 176, 235–242. [Google Scholar] [CrossRef]
- Endo, K.; Sato, T.; Umetsu, A.; Watanabe, M.; Hikage, F.; Ida, Y.; Ohguro, H.; Furuhashi, M. 3D culture induction of adipogenic differentiation in 3T3-L1 preadipocytes exhibits adipocyte-specific molecular expression patterns and metabolic functions. Heliyon 2023, 9, e20713. [Google Scholar] [CrossRef] [PubMed]
- Ohguro, H.; Watanabe, M.; Sato, T.; Hikage, F.; Furuhashi, M.; Okura, M.; Hida, T.; Uhara, H. 3D Spheroid Configurations Are Possible Indictors for Evaluating the Pathophysiology of Melanoma Cell Lines. Cells 2023, 12, 759. [Google Scholar] [CrossRef] [PubMed]
- Ichioka, H.; Hirohashi, Y.; Sato, T.; Furuhashi, M.; Watanabe, M.; Ida, Y.; Hikage, F.; Torigoe, T.; Ohguro, H. G-Protein-Coupled Receptors Mediate Modulations of Cell Viability and Drug Sensitivity by Aberrantly Expressed Recoverin 3 within A549 Cells. Int. J. Mol. Sci. 2023, 24, 771. [Google Scholar] [CrossRef] [PubMed]
- Kim, D.; Langmead, B.; Salzberg, S.L. HISAT: A fast spliced aligner with low memory requirements. Nat. Methods 2015, 12, 357–360. [Google Scholar] [CrossRef] [PubMed]
- Zhu, Y.; Zhou, Y.; Jiang, H.; Chen, Z.; Lu, B. Analysis of core genes for colorectal cancer prognosis based on immune and stromal scores. PeerJ 2021, 9, e12452. [Google Scholar] [CrossRef] [PubMed]
- Krämer, A.; Green, J.; Pollard, J., Jr.; Tugendreich, S. Causal analysis approaches in Ingenuity Pathway Analysis. Bioinformatics 2014, 30, 523–530. [Google Scholar] [CrossRef] [PubMed]
- Ohguro, H.; Ida, Y.; Hikage, F.; Umetsu, A.; Ichioka, H.; Watanabe, M.; Furuhashi, M. STAT3 Is the Master Regulator for the Forming of 3D Spheroids of 3T3-L1 Preadipocytes. Cells 2022, 11, 300. [Google Scholar] [CrossRef] [PubMed]


| HSSF | Axial Length (mm) | Age (Years Old), Gender |
|---|---|---|
| N1 | 22.8 | 69, female |
| N2 | 25.94 | 74, male |
| M1 | 27.5 | 69, female |
| M2 | 27.27 | 68, male |
| M3 | 30.15 | 67, female |
| Expr Log Ratio ↑ | Expr Log Ratio ↓ | ||
|---|---|---|---|
| Molecules | Value | Molecules | Value |
| HLA-DRB1 | 7.85 | TGFA | −5.87 |
| ROR2 | 6.72 | MYH2 | −5.72 |
| TNFSF11 | 5.65 | ZPLD1 | −5.66 |
| PRKG2 | 4.12 | GAD1 | −5.28 |
| DMKN | 3.96 | SLITRK1 | −5.13 |
| COLCA2 | 3.82 | HAS1 | −5.06 |
| SBSN | 3.8 | PTPRZ1 | −4.78 |
| SULT1C2 | 3.14 | INA | −4.22 |
| TNNT1 | 3.11 | CCDC190 | −4.18 |
| EFNB3 | 3.08 | EFHD1 | −4.14 |
| Name | p-Value |
|---|---|
| superpathway of cholesterol biosynthesis | 1.85 × 10⁻¹³ |
| cholesterol biosynthesis I | 1.61 × 10⁻⁸ |
| cholesterol biosynthesis II (via 24,25-dihydrolanosterol) | 1.61 × 10⁻⁸ |
| cholesterol biosynthesis III (via desmosterol) | 1.61 × 10⁻⁸ |
| superpathway of geranylgeranyldiphosphate biosynthesis (via mevalonate) | 5.62 × 10⁻⁶ |
| ID | Associated Network Functions | Score |
|---|---|---|
| 1 | Connective tissue disorders, hereditary disorder, organismal injury and abnormalities | 42 |
| 2 | post-translational modification, vitamin and mineral metabolism, auditory disease | 40 |
| 3 | developmental disorder, neurological disease, organismal injury and abnormalities | 38 |
| 4 | lipid metabolism, small molecule biochemistry, cellular movement | 35 |
| 5 | cell morphology, cellular movement, nervous system development and function | 29 |
| Up-Stream Regulator | Expr Fold Change | Molecular Type | Activation Z-Score |
|---|---|---|---|
| SREBF2 | 1.115 | transcription regulator | 3.352 |
| SREBF1 | 1.268 | transcription regulator | 3.574 |
| INSIG1 | 2.513 | other | −3.724 |
| IGF1 | 1.385 | growth factor | 1.041 |
| Causal Network Regulator | |||
| SREBF2 | 1.115 | transcription regulator | 3.402 |
| PTPRO | −1.63 | phosphatase | −0.271 |
Disclaimer/Publisher’s Note: The statements, opinions and data contained in all publications are solely those of the individual author(s) and contributor(s) and not of MDPI and/or the editor(s). MDPI and/or the editor(s) disclaim responsibility for any injury to people or property resulting from any ideas, methods, instructions or products referred to in the content. |
© 2023 by the authors. Licensee MDPI, Basel, Switzerland. This article is an open access article distributed under the terms and conditions of the Creative Commons Attribution (CC BY) license (https://creativecommons.org/licenses/by/4.0/).
Share and Cite
Ohguro, H.; Umetsu, A.; Sato, T.; Furuhashi, M.; Watanabe, M. Lipid Metabolism Regulators Are the Possible Determinant for Characteristics of Myopic Human Scleral Stroma Fibroblasts (HSSFs). Int. J. Mol. Sci. 2024, 25, 501. https://doi.org/10.3390/ijms25010501
Ohguro H, Umetsu A, Sato T, Furuhashi M, Watanabe M. Lipid Metabolism Regulators Are the Possible Determinant for Characteristics of Myopic Human Scleral Stroma Fibroblasts (HSSFs). International Journal of Molecular Sciences. 2024; 25(1):501. https://doi.org/10.3390/ijms25010501
Chicago/Turabian StyleOhguro, Hiroshi, Araya Umetsu, Tatsuya Sato, Masato Furuhashi, and Megumi Watanabe. 2024. "Lipid Metabolism Regulators Are the Possible Determinant for Characteristics of Myopic Human Scleral Stroma Fibroblasts (HSSFs)" International Journal of Molecular Sciences 25, no. 1: 501. https://doi.org/10.3390/ijms25010501
APA StyleOhguro, H., Umetsu, A., Sato, T., Furuhashi, M., & Watanabe, M. (2024). Lipid Metabolism Regulators Are the Possible Determinant for Characteristics of Myopic Human Scleral Stroma Fibroblasts (HSSFs). International Journal of Molecular Sciences, 25(1), 501. https://doi.org/10.3390/ijms25010501