
Phylogeny and Evolution of Cocconeiopsis (Cocconeidaceae) as Revealed by Complete Chloroplast and Mitochondrial Genomes


Abstract
:1. Introduction
2. Results
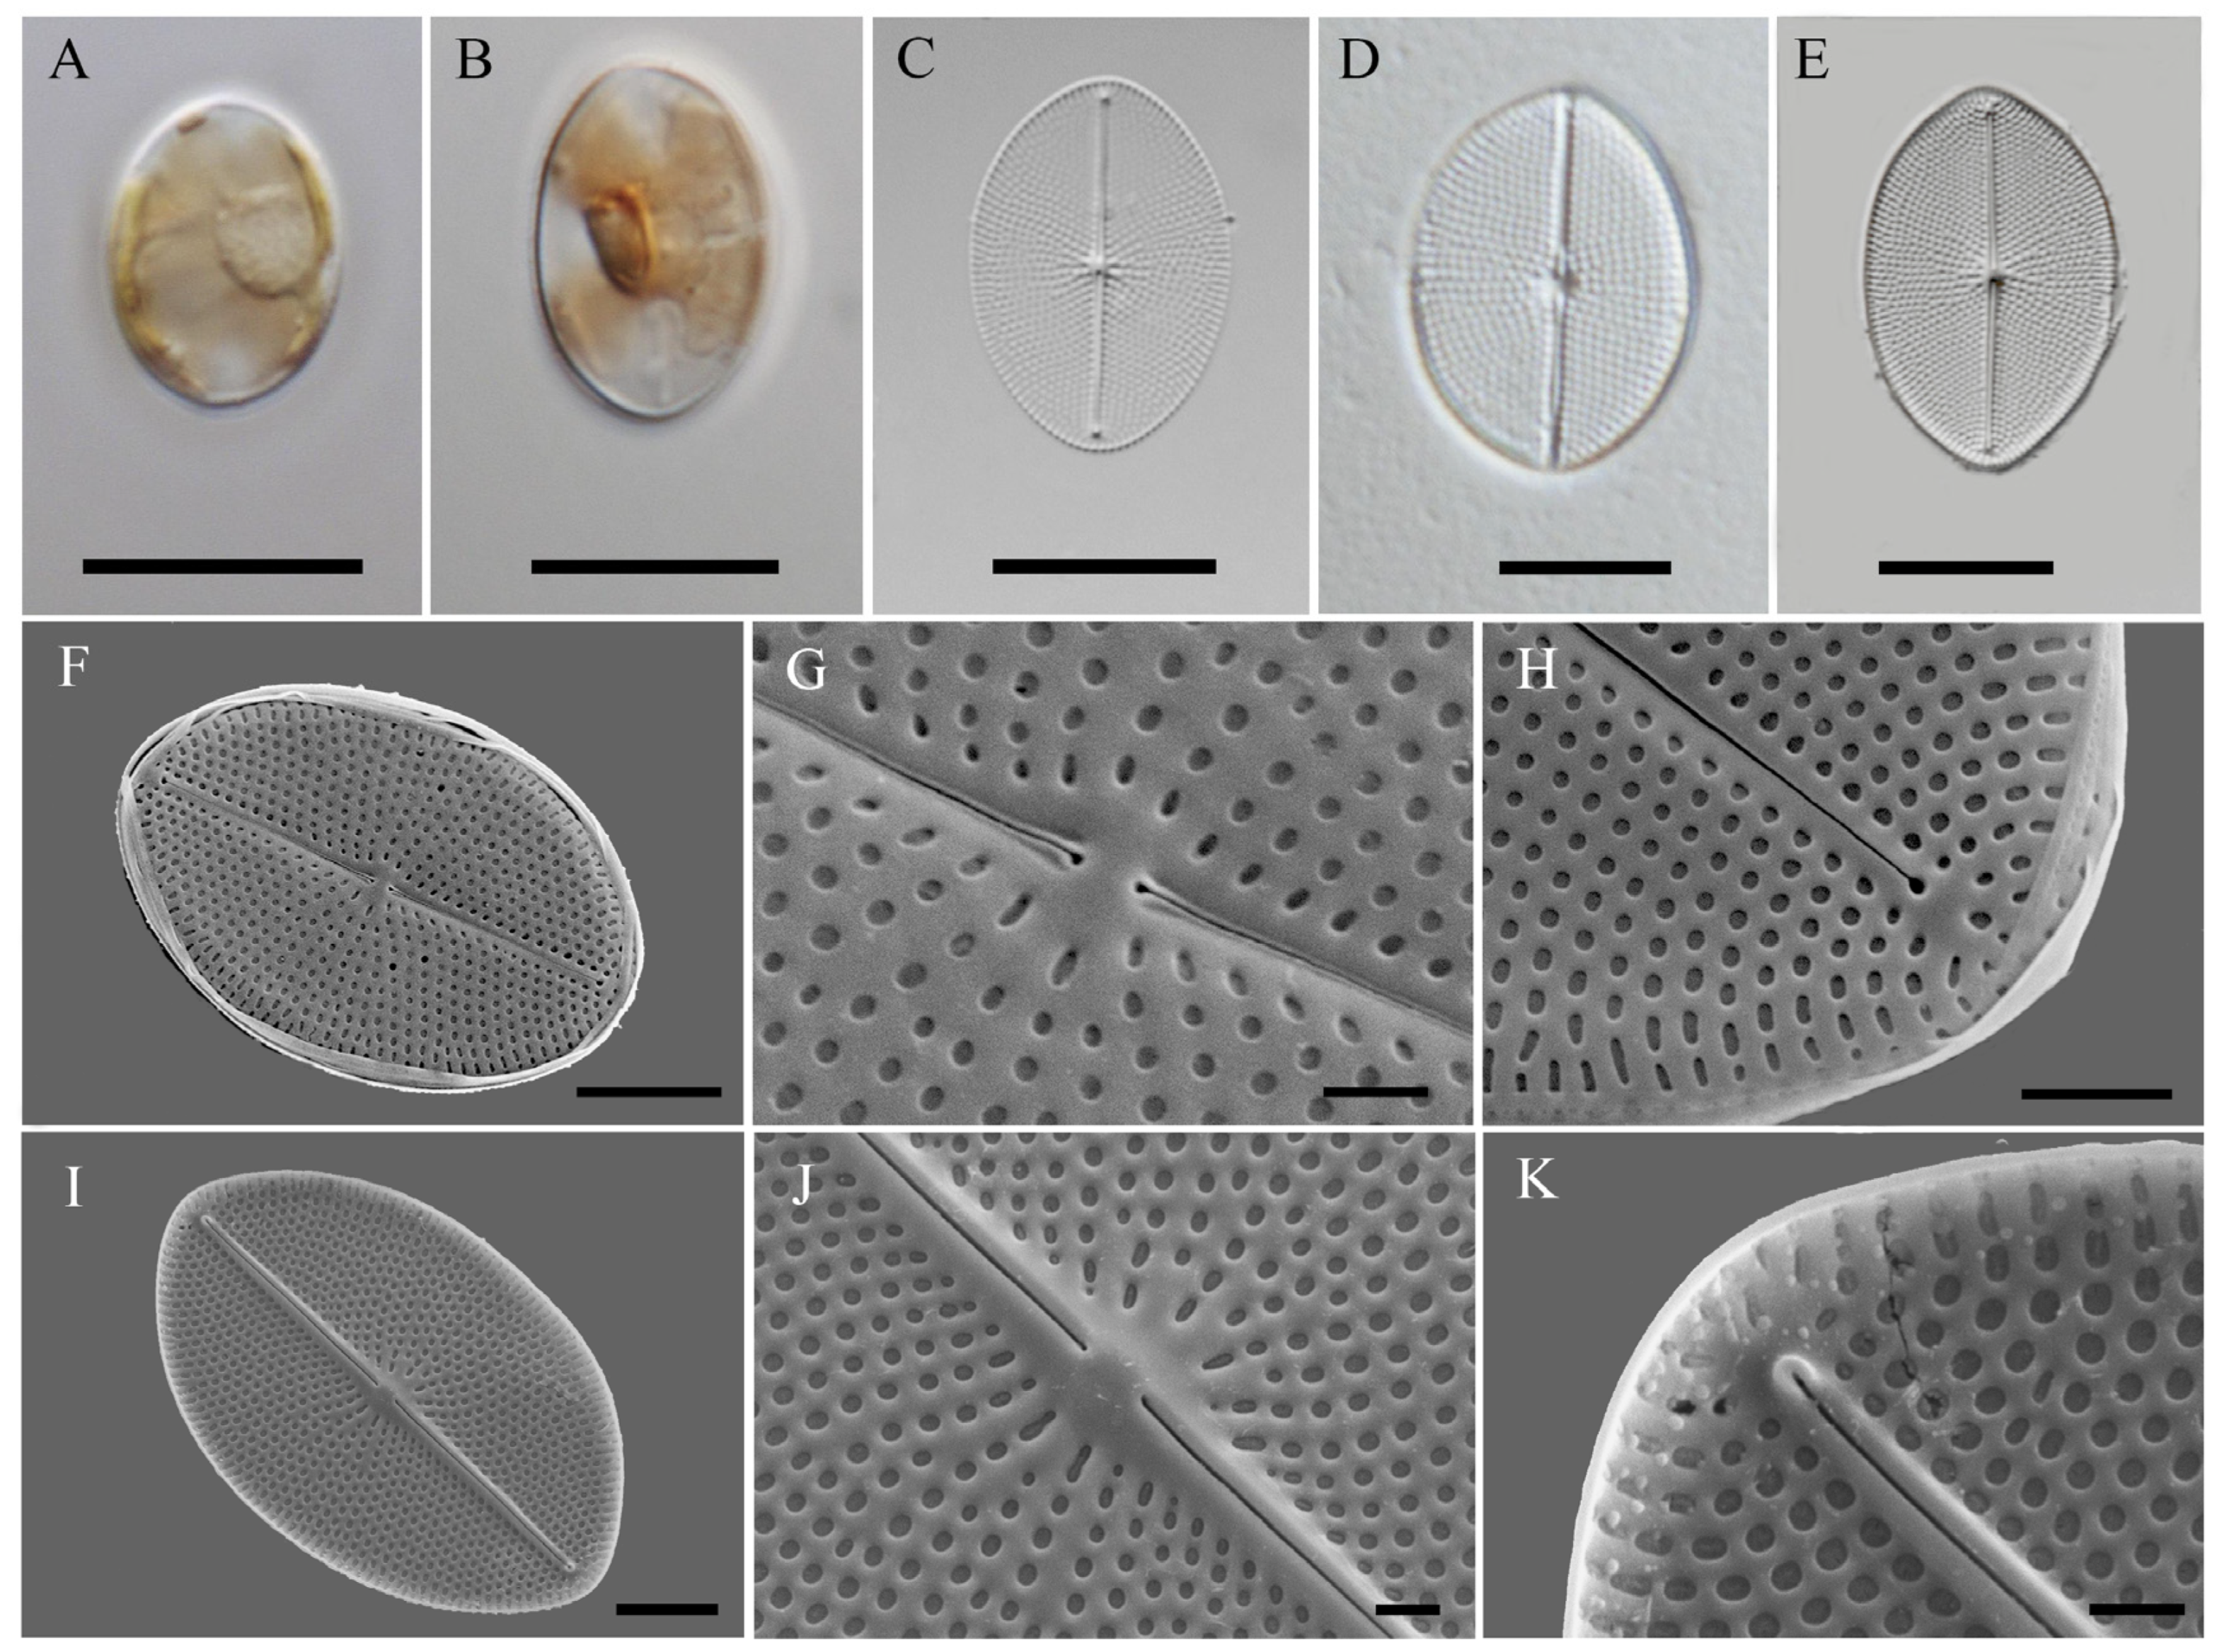
2.1. Morphology
2.2. General Characterization of C. kantsiensis Plastid Genome
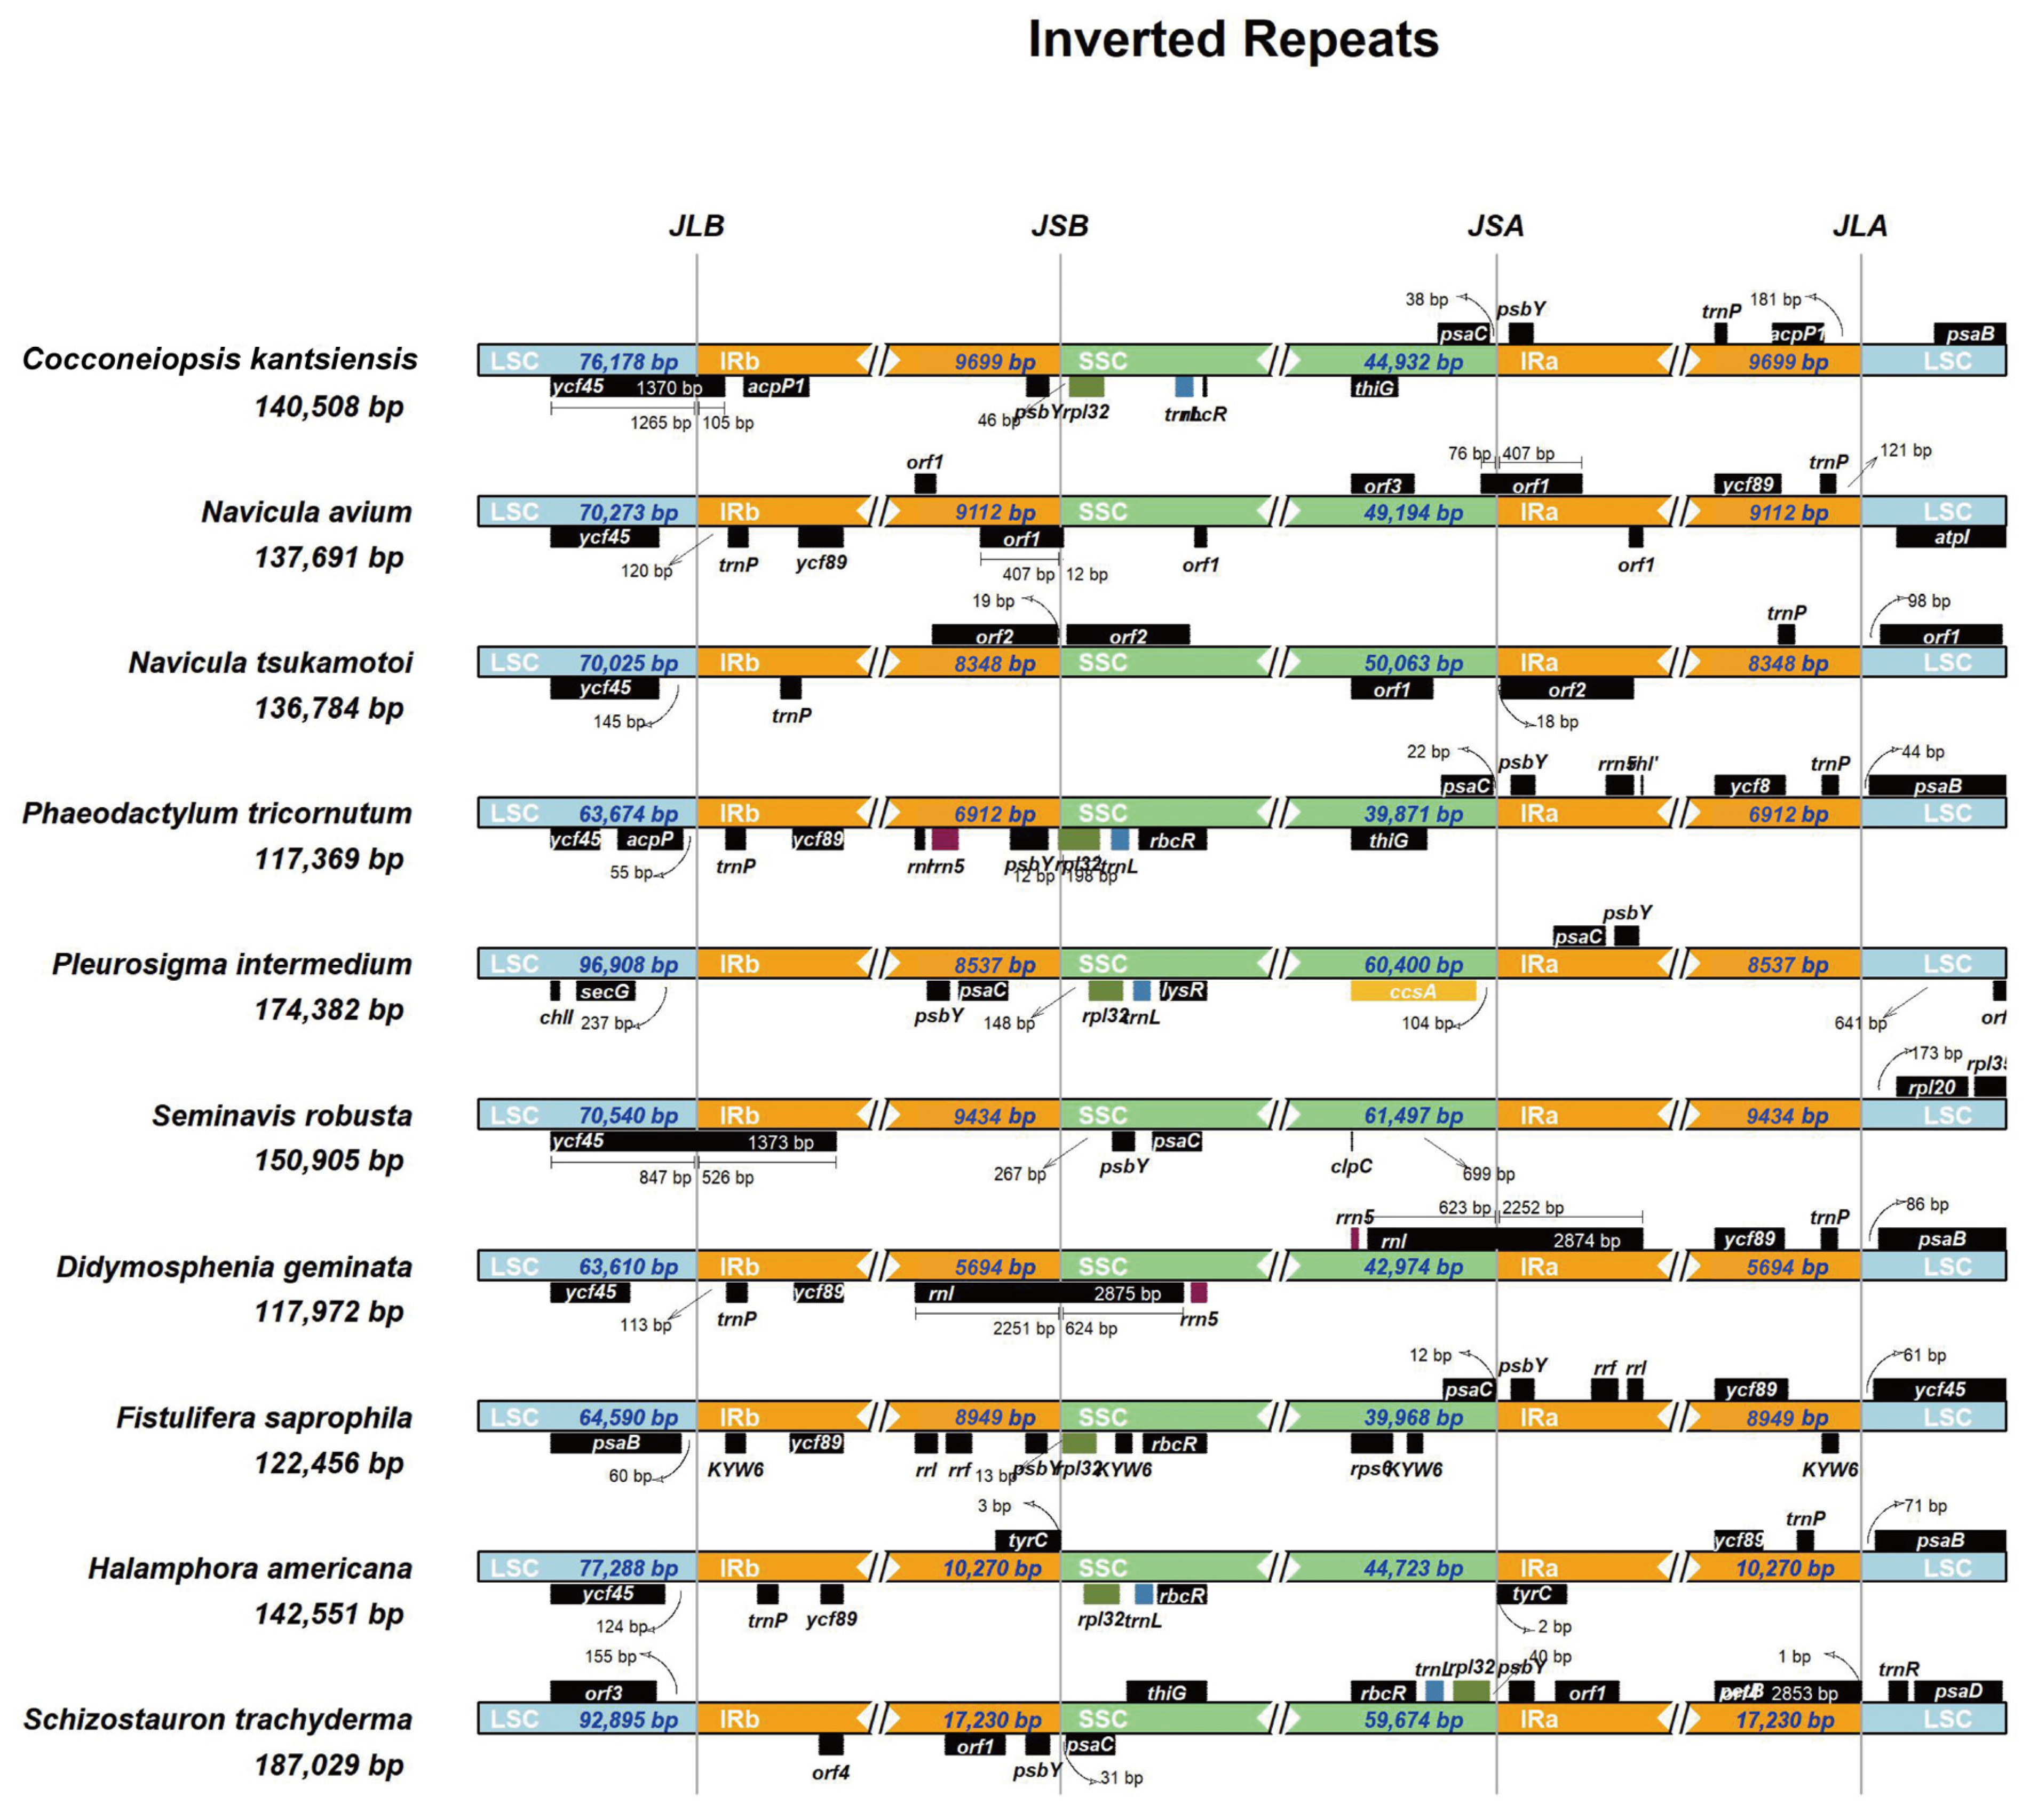
2.3. Comparative Analysis of C. kantsiensis Plastid Genome
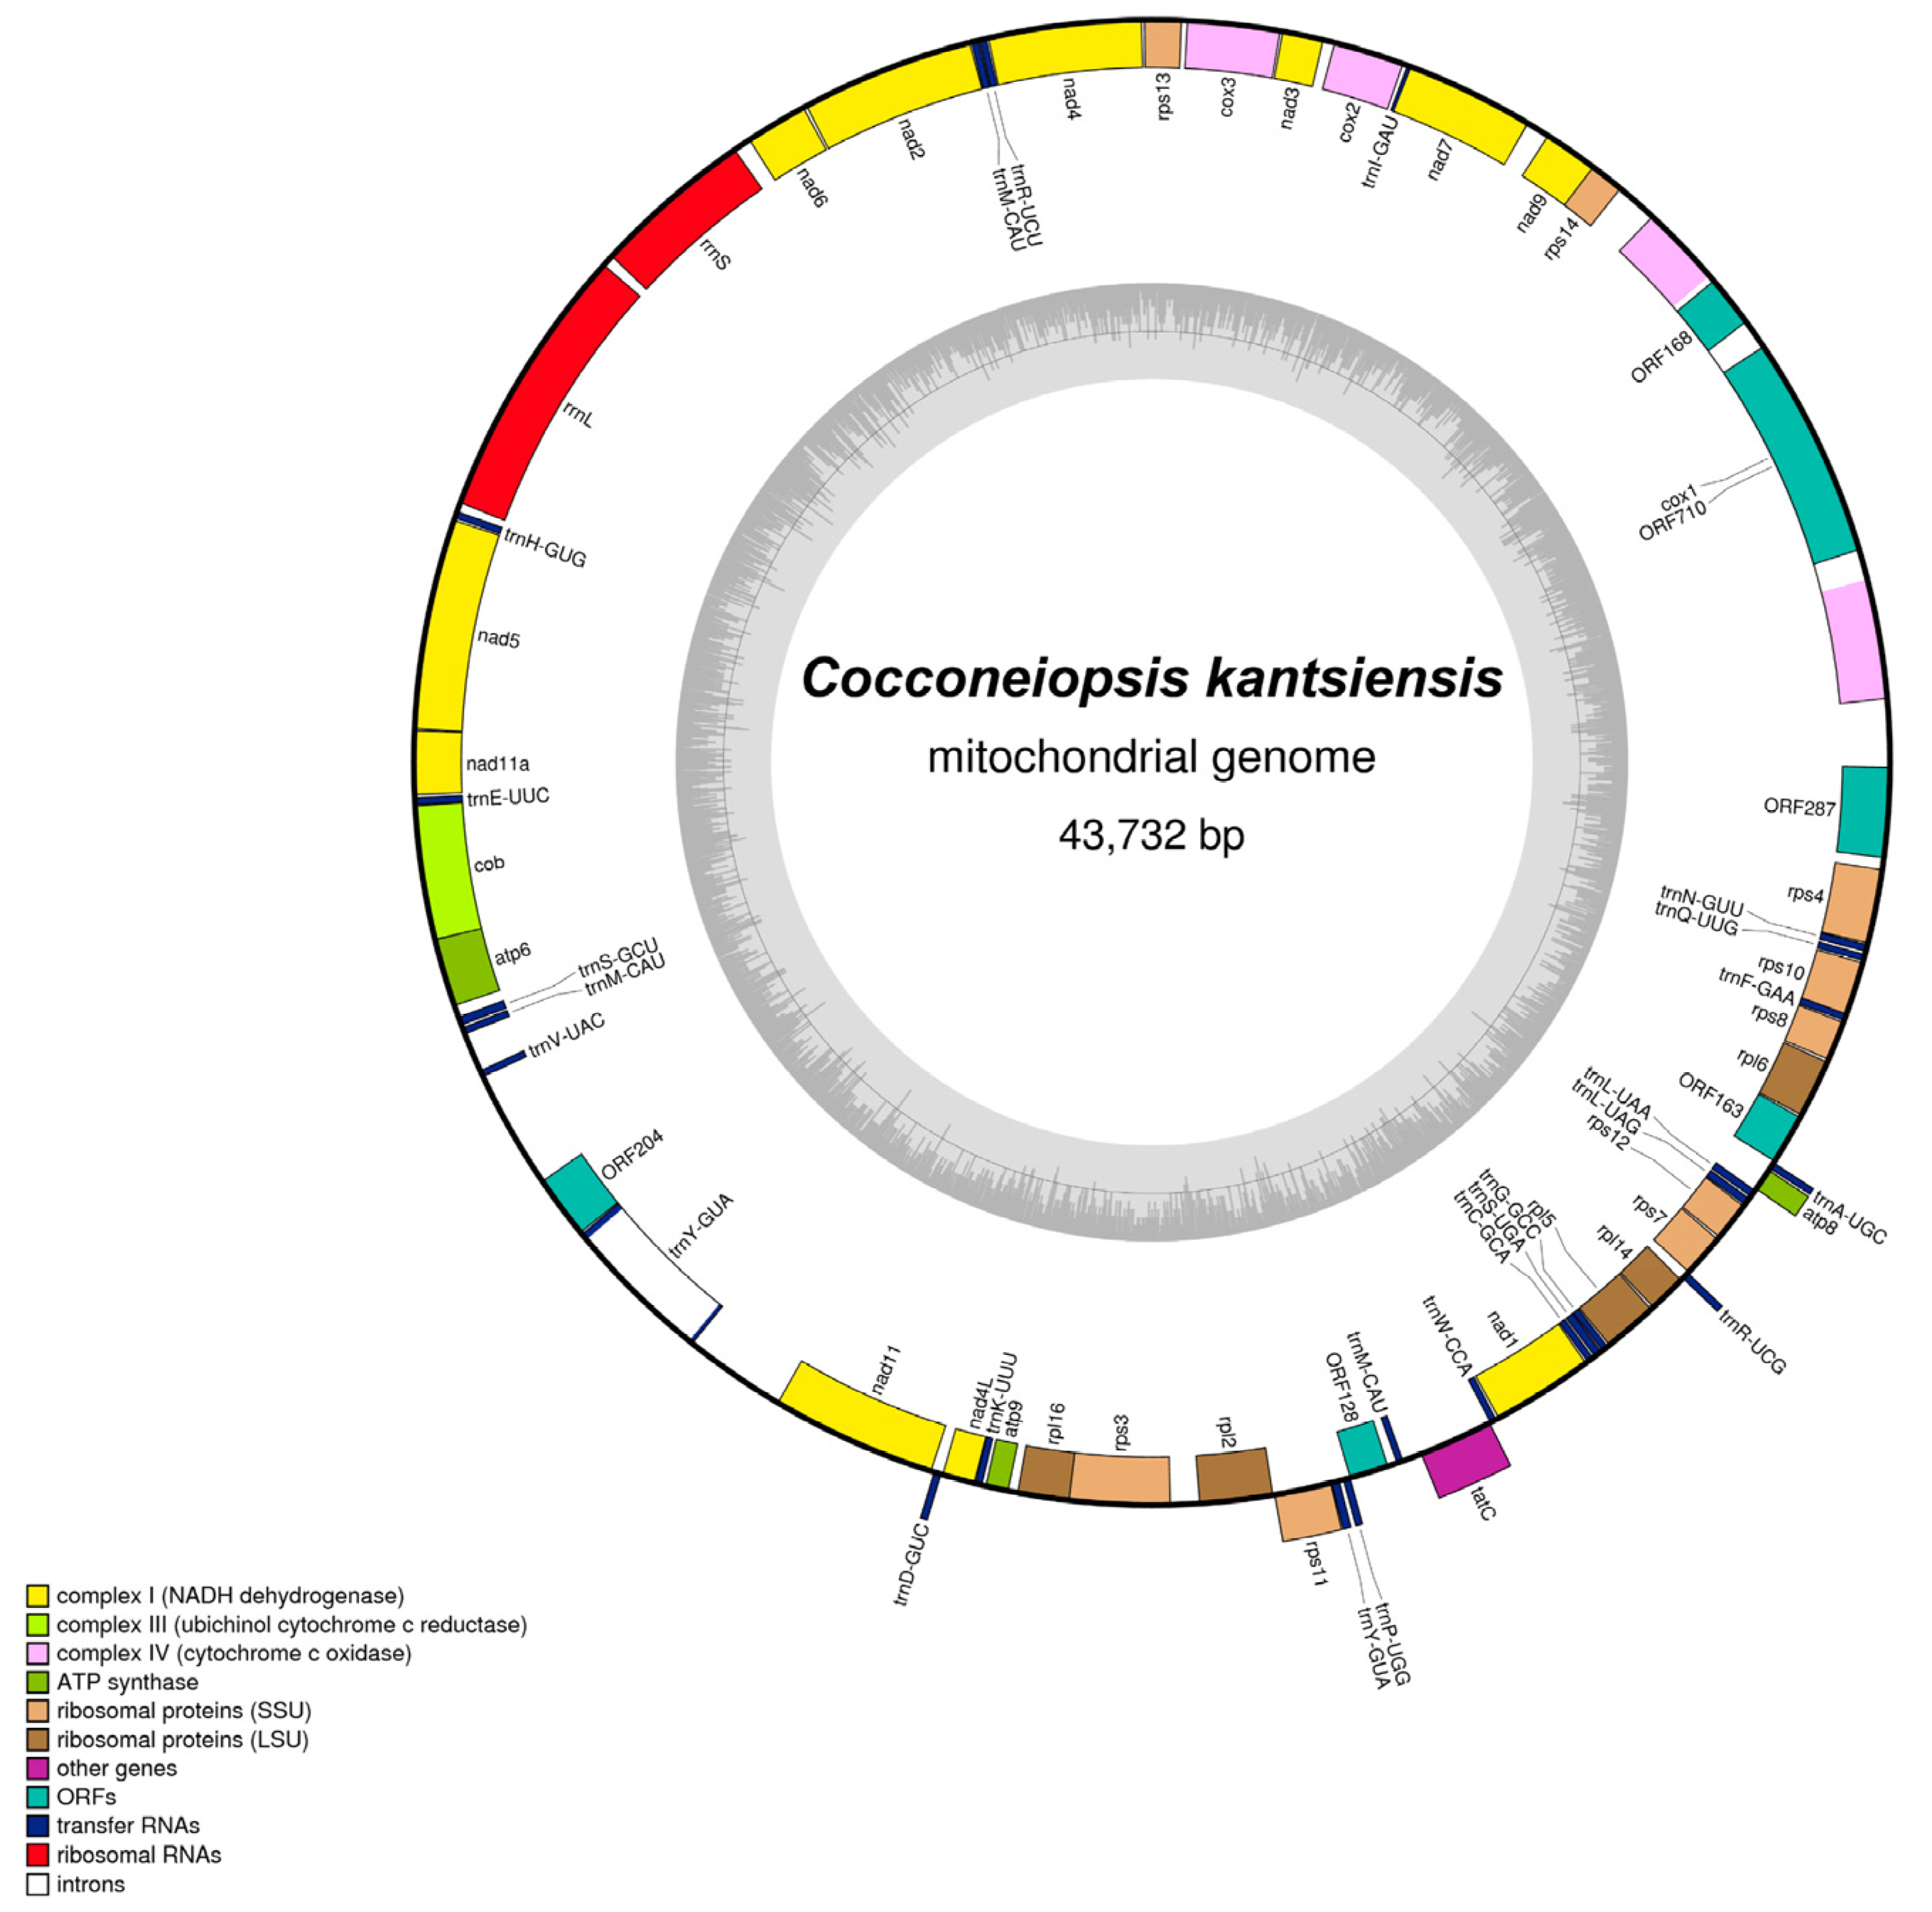
2.4. General Characterization of C. kantsiensis Mitochondrial Genome
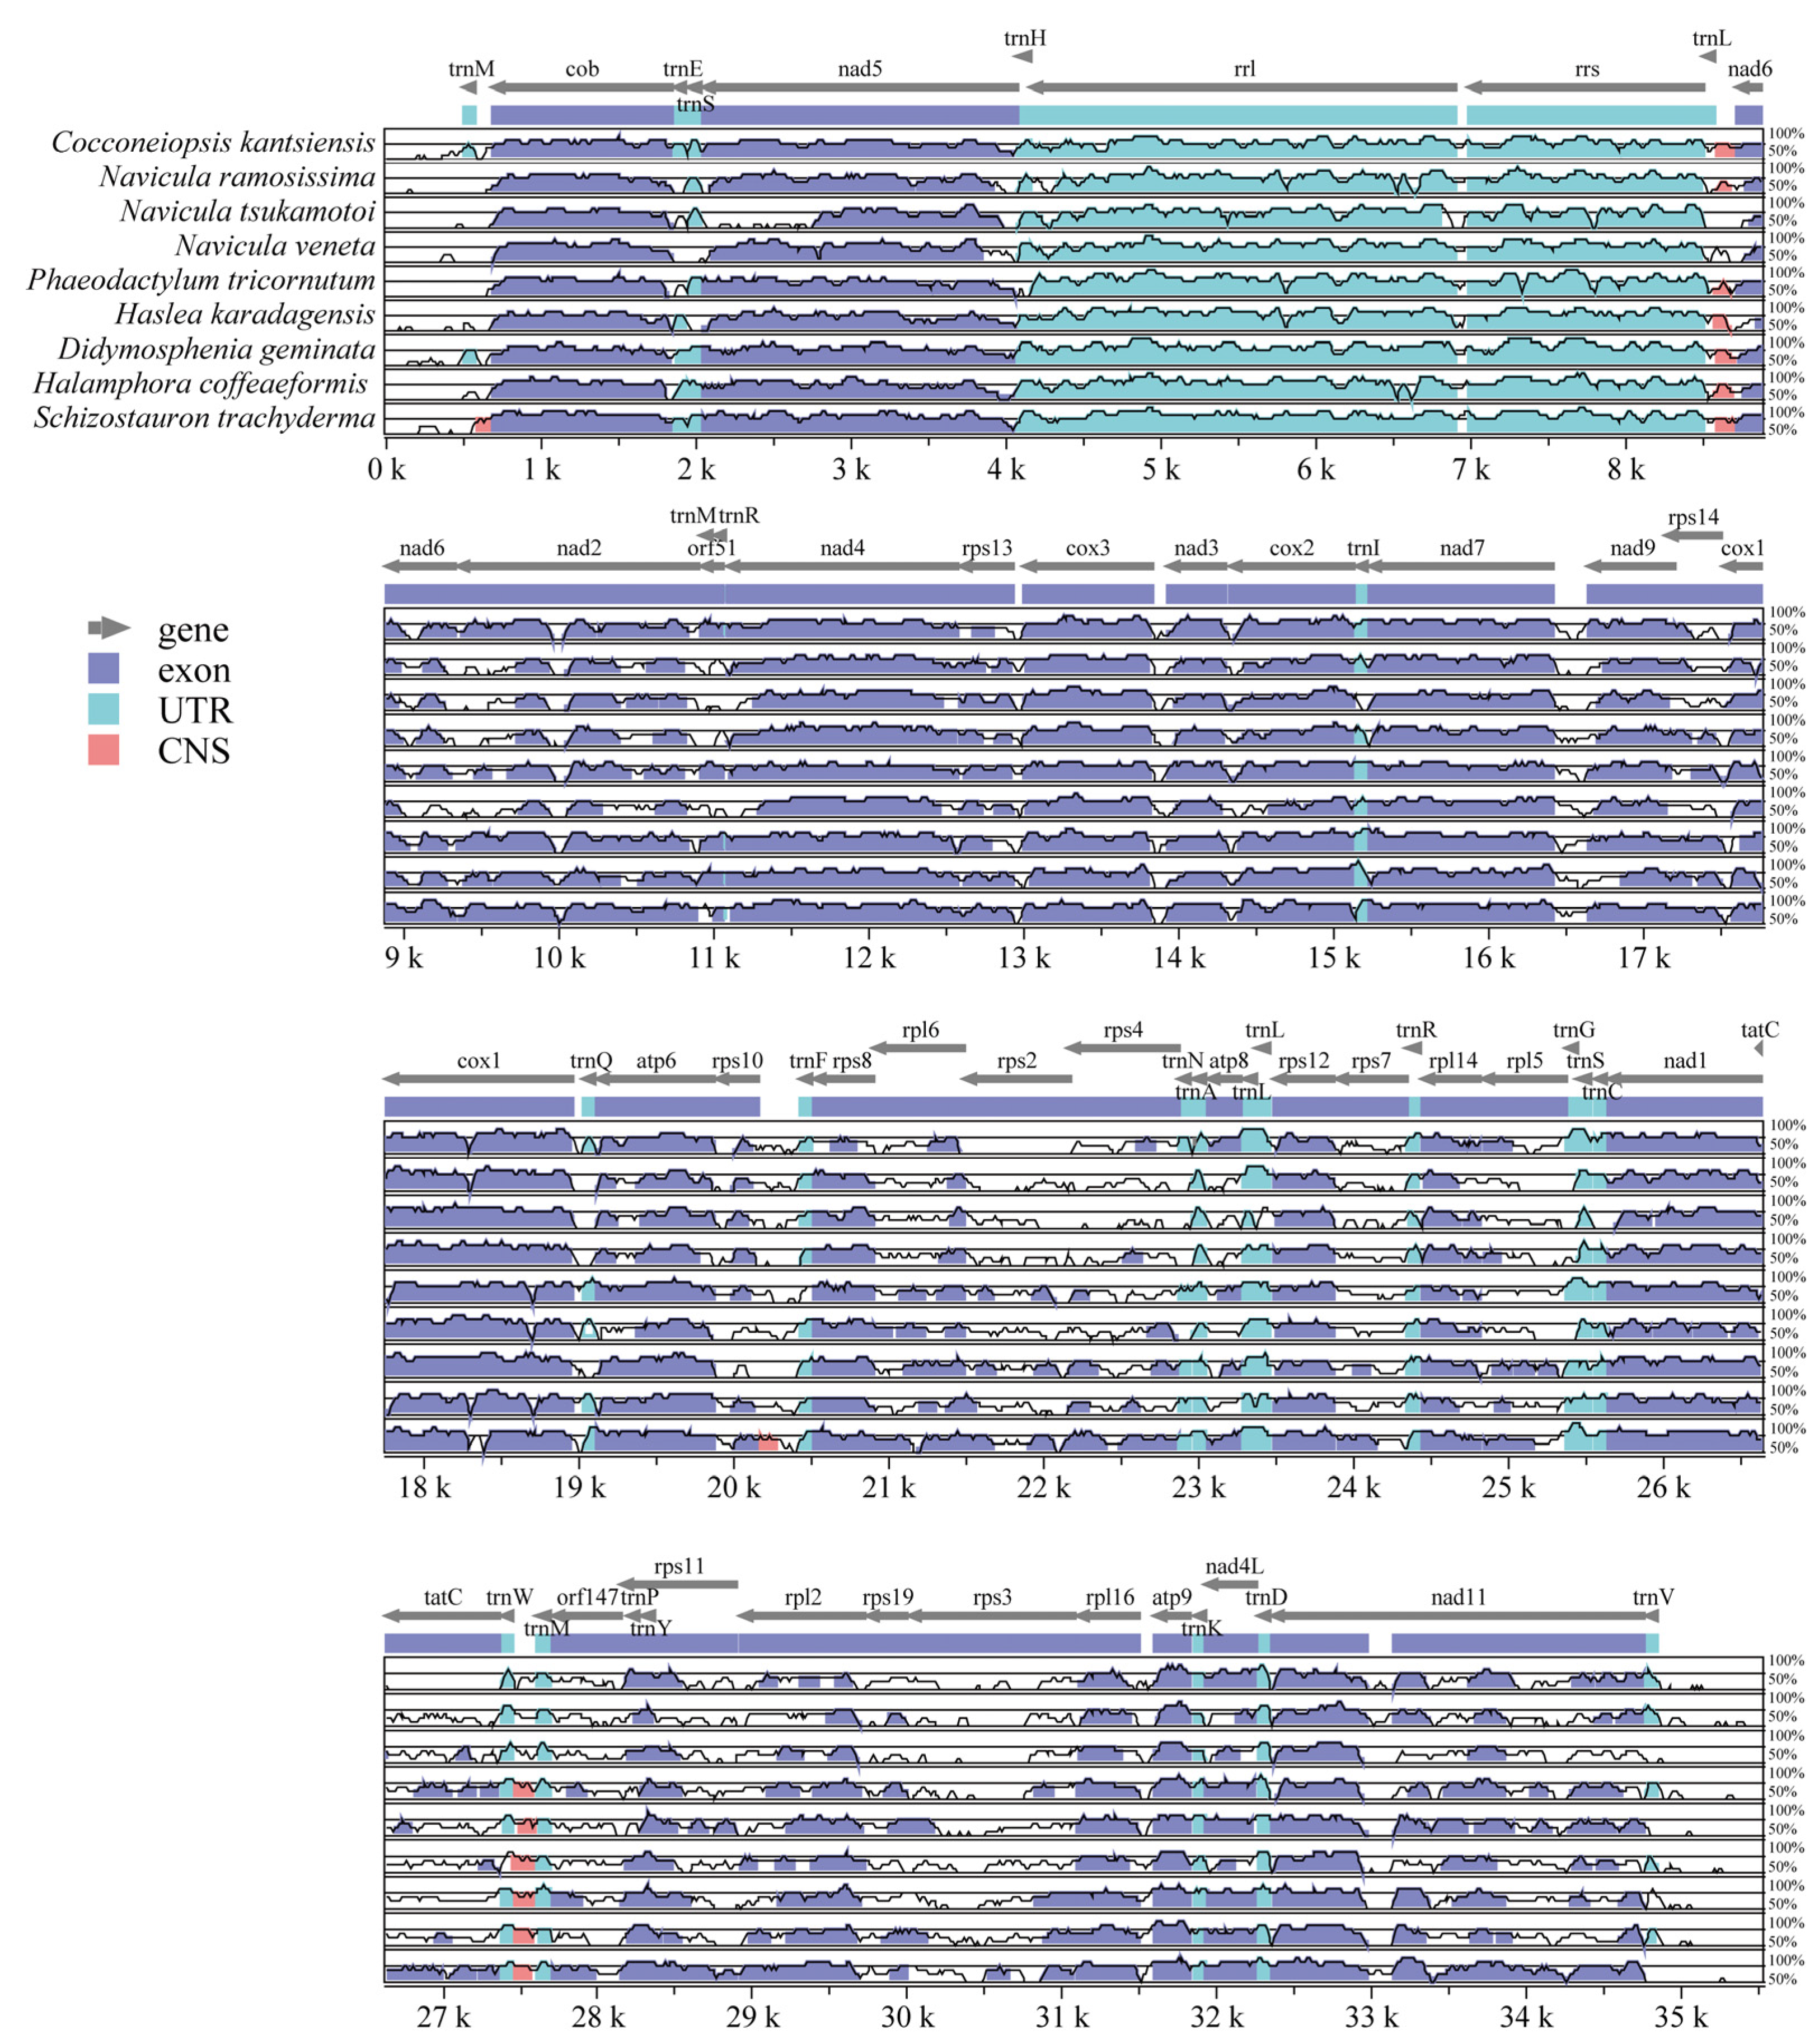
2.5. Comparative Analysis of C. kantsiensis Mitochondrial Genome
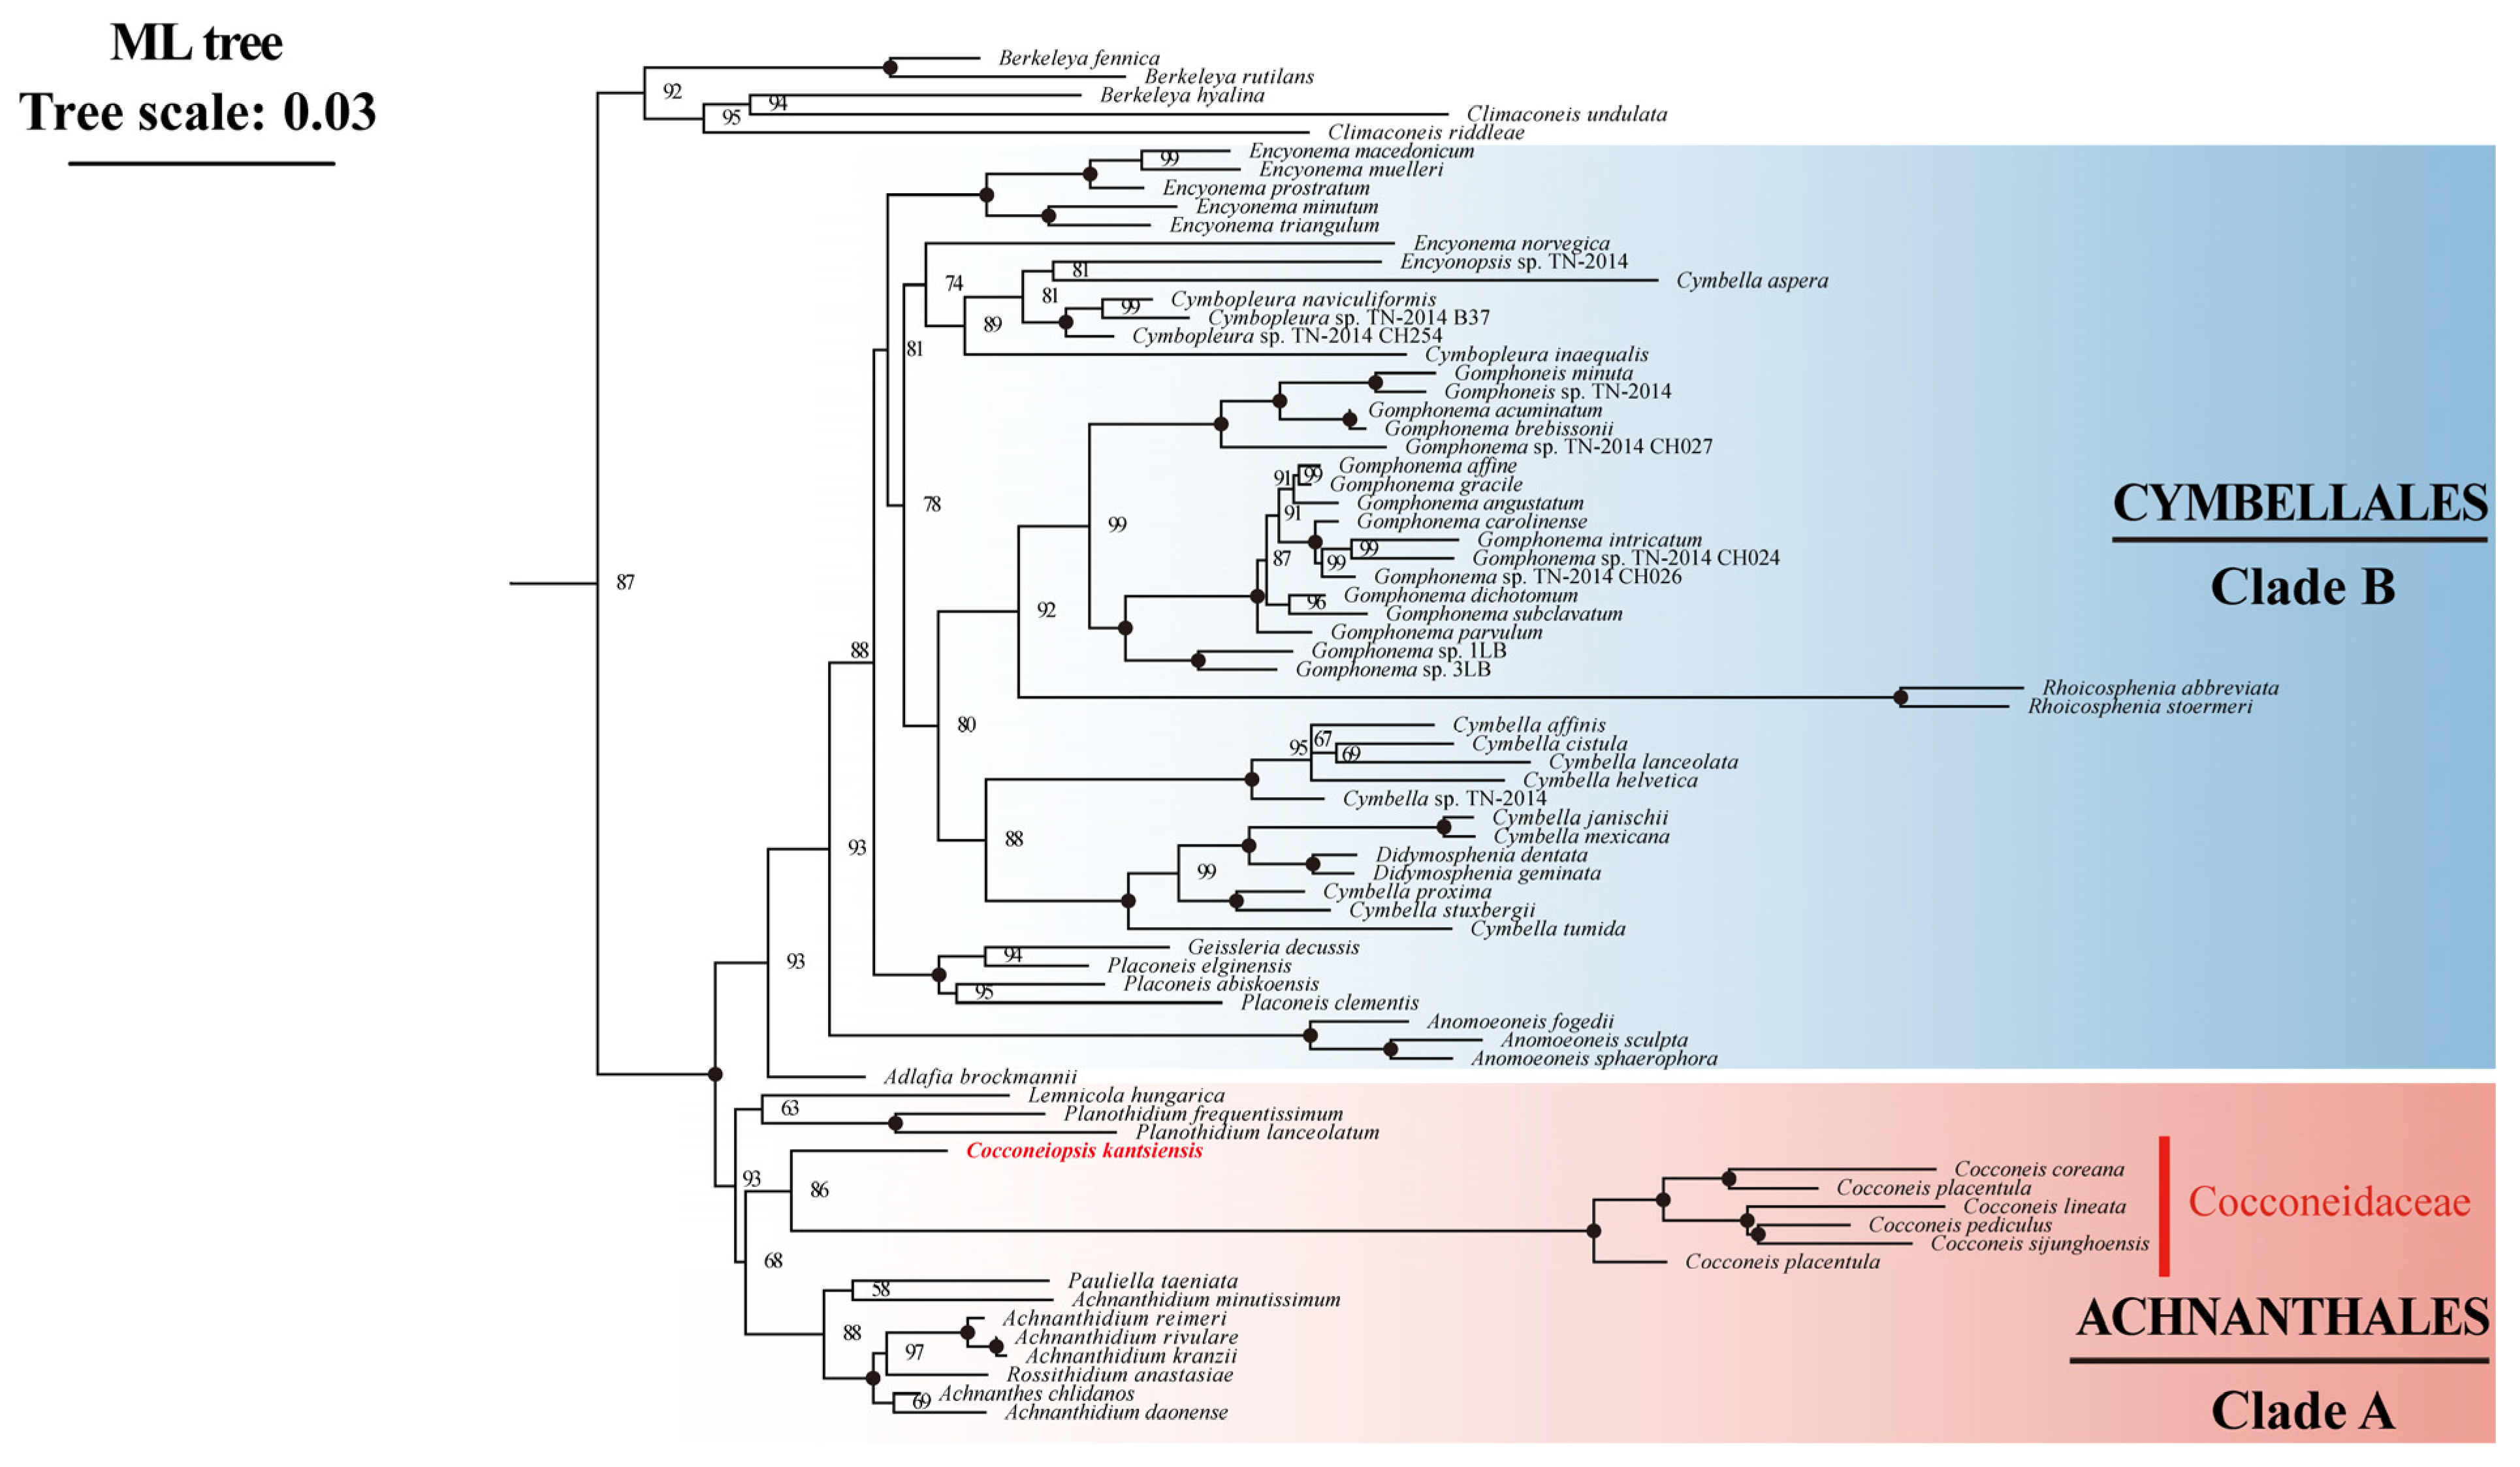
2.6. Phylogenetic Analysis of C. kantsiensis Plastid and Mitochondrial Genome
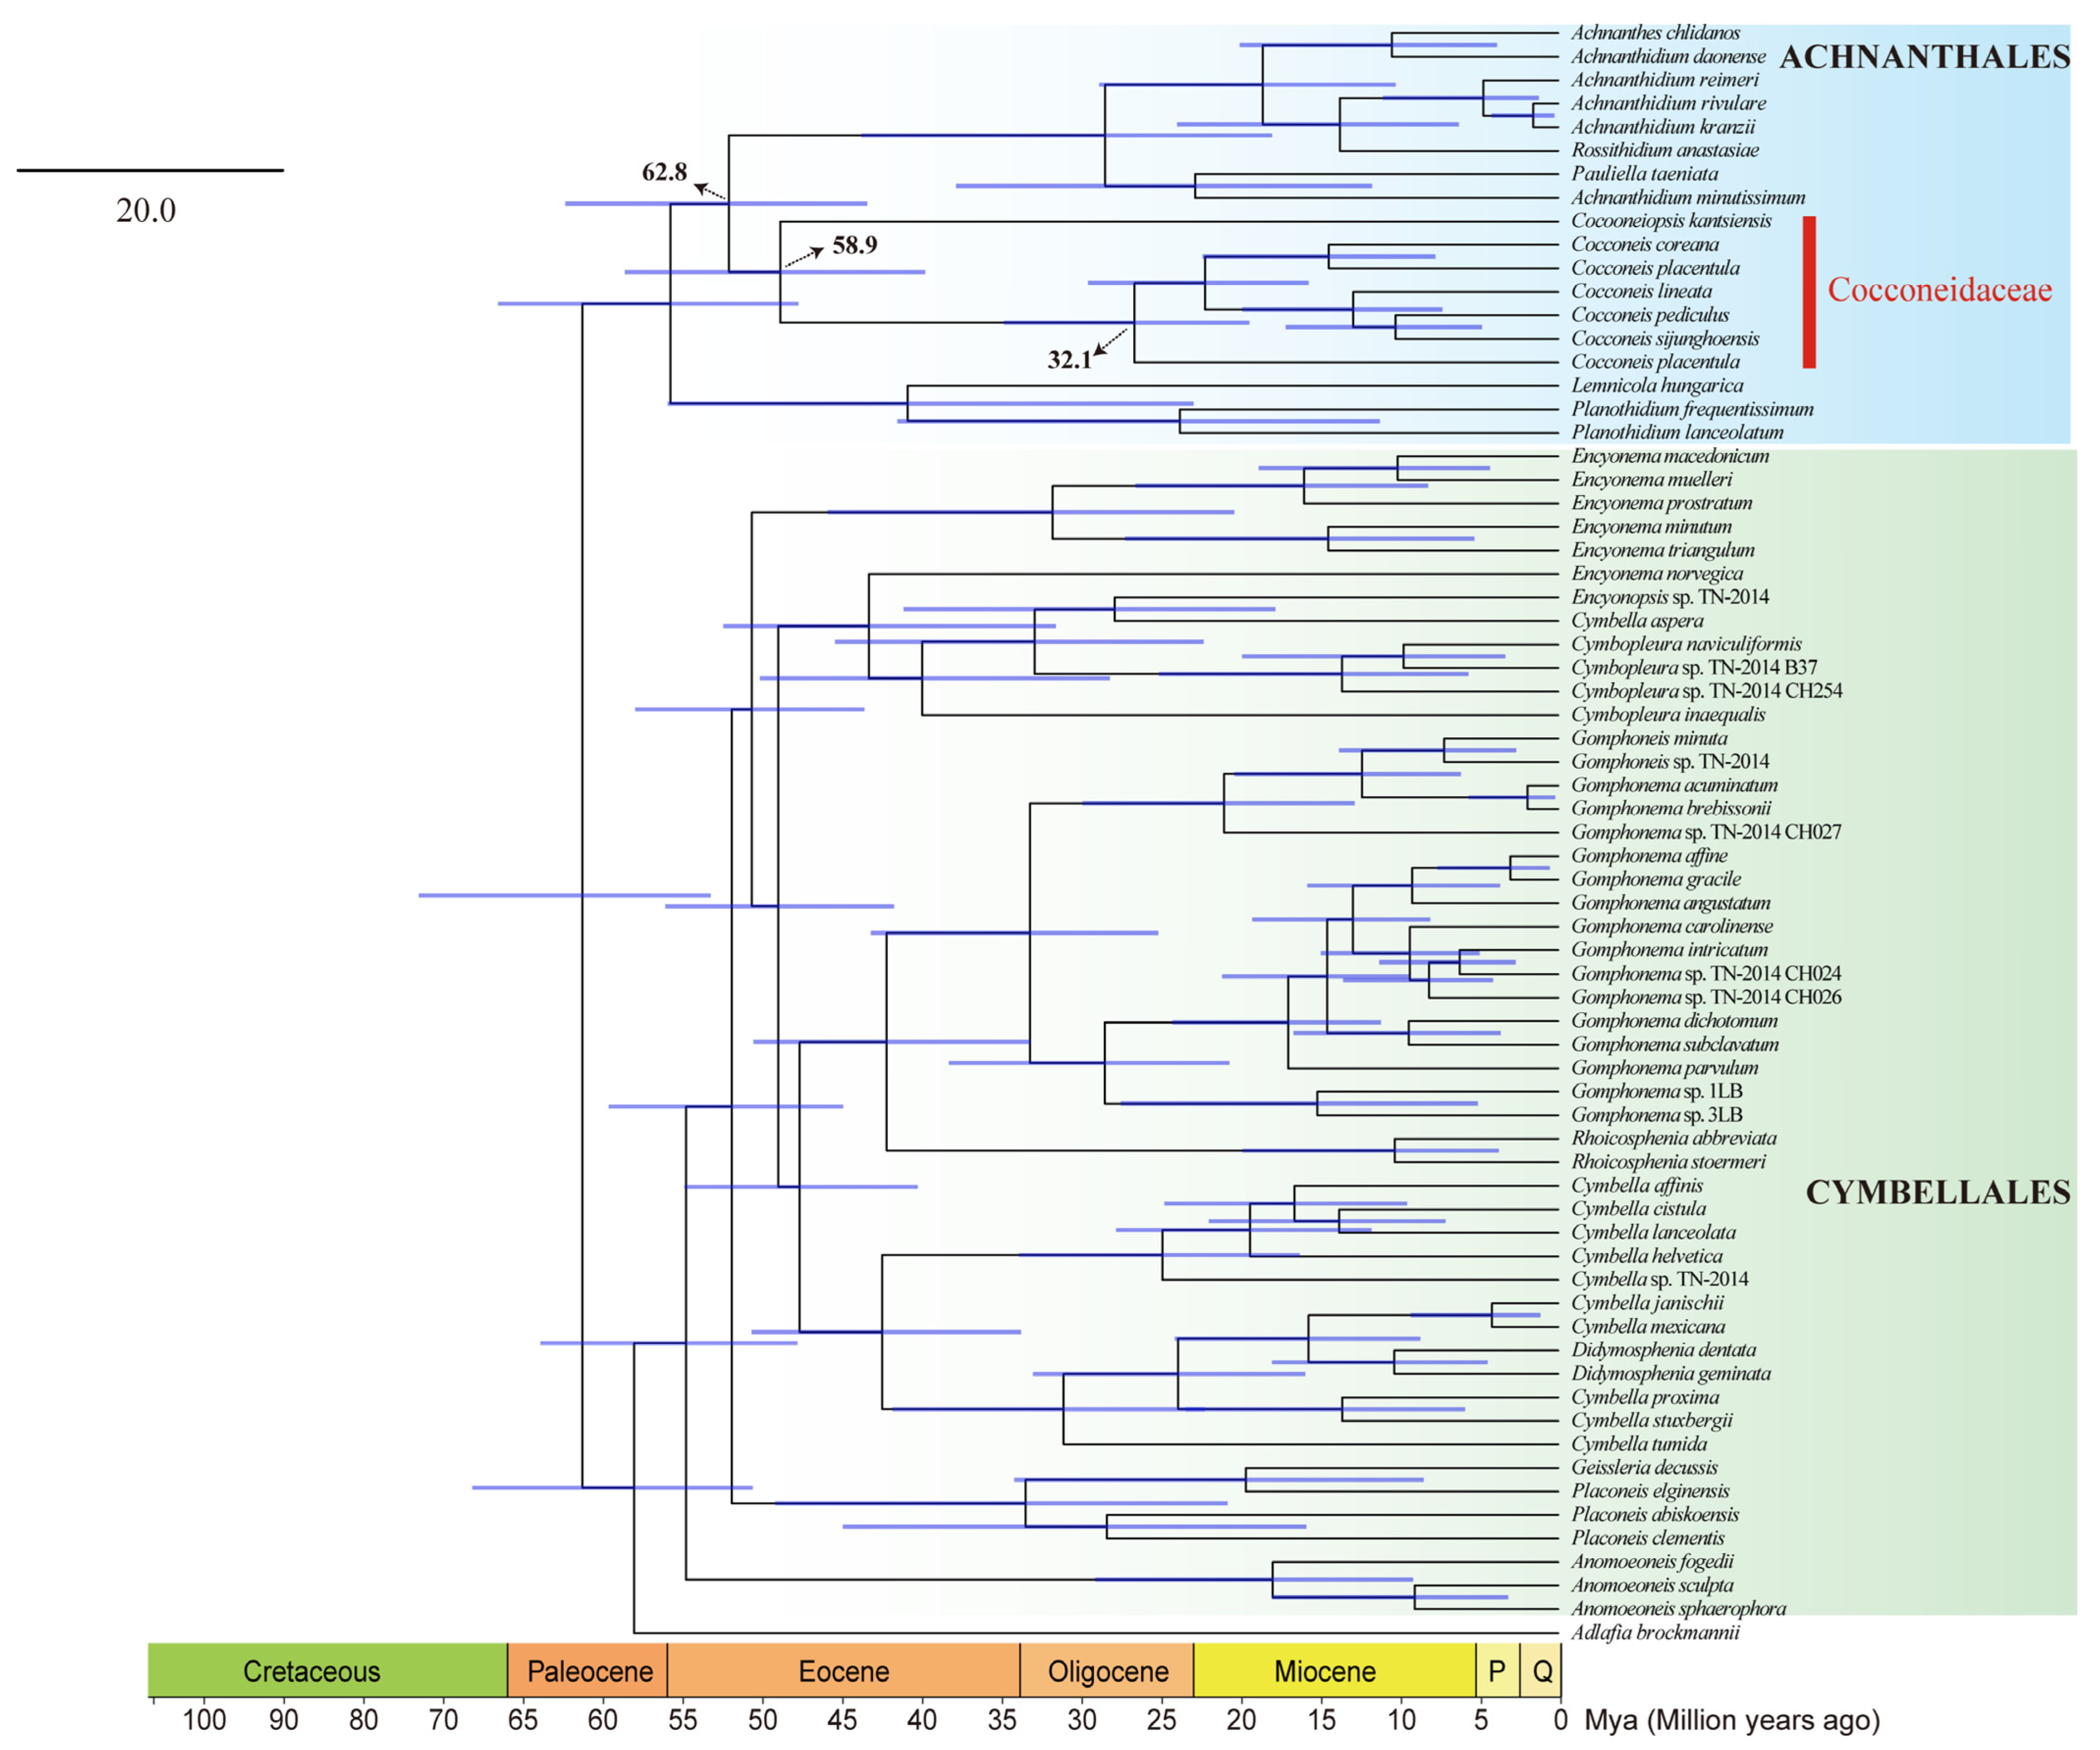
2.7. Phylogenetic Analysis and Divergence Time Estimation Based on a Two-Gene Dataset
3. Discussion
4. Materials and Methods
4.1. Sampling, Cultivation, and Morphological Observation
4.2. DNA Extraction and Sequencing
4.3. Organelle Genome Assembly and Annotation
4.4. Phylogenetic Analysis and Divergence Time Estimation
5. Conclusions
Supplementary Materials
Author Contributions
Funding
Institutional Review Board Statement
Informed Consent Statement
Data Availability Statement
Acknowledgments
Conflicts of Interest
References
- Andrzej, W.; Ditmar, L.B.H.M. Diatom Flora of Marine Coasts I. Iconographia Diatomologica 7: 925 pp. Koeltz Sci. Knigstein; A.R.G. Gantner Verlag: Ruggell, Germany, 2000. [Google Scholar]
- Riaux-Gobin, C.; Witkowski, A. Small-sized and discoid species of the genus Cocconeiopsis (Bacillariophyta) on Holothuria atra (Juan de Nova, Mozambique Channel). Phytotaxa 2012, 54, 43–58. [Google Scholar] [CrossRef]
- M.D. Guiry in Guiry, M.D.G., G.M. 17 February 2020. AlgaeBase. World-Wide Electronic Publication, National University of Ireland, Galway. Available online: https://www.algaebase.org (accessed on 27 August 2023).
- Cox, E. Coscinodiscophyceae, Mediophyceae, Fragilariophyceae, Bacillariophyceae (Diatoms). In Syllabus of Plant Families. Adolf Engler’s Syllabus der Pflanzenfamilien. 2/1 Photoautotrophic Eukaryotic Algae; Frey, W., Ed.; Borntraeger Science Publishers: Stuttgart, Germany, 2015; pp. 64–103. [Google Scholar]
- Li, H.; Leavengood, J.M., Jr.; Chapman, E.G.; Burkhardt, D.; Song, F.; Jiang, P.; Liu, J.; Zhou, X.; Cai, W. Mitochondrial phylogenomics of Hemiptera reveals adaptive innovations driving the diversification of true bugs. Proc. R. Soc. B Biol. Sci. 2017, 284, 20171223. [Google Scholar] [CrossRef]
- Salvato, P.; Simonato, M.; Battisti, A.; Negrisolo, E. The complete mitochondrial genome of the bag-shelter moth Ochrogaster lunifer (Lepidoptera, Notodontidae). BMC Genom. 2008, 9, 331. [Google Scholar] [CrossRef]
- Ren, T.; Aou, X.; Tian, R.; Li, Z.; Peng, C.; He, X. Complete Chloroplast Genome of Cnidium monnieri (Apiaceae) and Comparisons with Other Tribe Selineae Species. Diversity 2022, 14, 323. [Google Scholar] [CrossRef]
- Kowallik, K.V.; Stoebe, B.; Schaffran, I.; Kroth-Pancic, P.; Freier, U. The chloroplast genome of a chlorophylla+c–containing alga, Odontella sinensis. Plant Mol. Biol. Report. 1995, 13, 336–342. [Google Scholar] [CrossRef]
- Oudot-Le Secq, M.-P.; Grimwood, J.; Shapiro, H.; Armbrust, E.V.; Bowler, C.; Green, B.R. Chloroplast genomes of the diatoms Phaeodactylum tricornutum and Thalassiosira pseudonana: Comparison with other plastid genomes of the red lineage. Mol. Genet. Genom. 2007, 277, 427–439. [Google Scholar] [CrossRef]
- Oudot-Le Secq, M.-P.; Green, B.R. Complex repeat structures and novel features in the mitochondrial genomes of the diatoms Phaeodactylum tricornutum and Thalassiosira pseudonana. Gene 2011, 476, 20–26. [Google Scholar] [CrossRef]
- Górecka, E.; Gastineau, R.; Davidovich, N.A.; Davidovich, O.I.; Ashworth, M.P.; Sabir, J.S.; Lemieux, C.; Turmel, M.; Witkowski, A. Mitochondrial and plastid genomes of the monoraphid diatom Schizostauron trachyderma. Int. J. Mol. Sci. 2021, 22, 11139. [Google Scholar] [CrossRef] [PubMed]
- Qian, J.; Song, J.; Gao, H.; Zhu, Y.; Xu, J.; Pang, X.; Yao, H.; Sun, C.; Li, X.e.; Li, C. The complete chloroplast genome sequence of the medicinal plant Salvia miltiorrhiza. PLoS ONE 2013, 8, e57607. [Google Scholar] [CrossRef] [PubMed]
- Wang, Y.; Wang, J.; Chen, Y.; Liu, S.; Zhao, Y.; Chen, N. Comparative Analysis of Bacillariophyceae Chloroplast Genomes Uncovers Extensive Genome Rearrangements Associated with Speciation. Int. J. Environ. Res. Public Health 2022, 19, 10024. [Google Scholar] [CrossRef] [PubMed]
- Brembu, T.; Winge, P.; Tooming-Klunderud, A.; Nederbragt, A.J.; Jakobsen, K.S.; Bones, A.M. The chloroplast genome of the diatom Seminavis robusta: New features introduced through multiple mechanisms of horizontal gene transfer. Mar. Genom. 2014, 16, 17–27. [Google Scholar] [CrossRef] [PubMed]
- Ruck, E.C.; Nakov, T.; Jansen, R.K.; Theriot, E.C.; Alverson, A.J. Serial gene losses and foreign DNA underlie size and sequence variation in the plastid genomes of diatoms. Genome Biol. Evol. 2014, 6, 644–654. [Google Scholar] [CrossRef] [PubMed]
- Gastineau, R.; Hamedi, C.; Hamed, M.B.B.; Abi-Ayad, S.-M.E.-A.; Bąk, M.; Lemieux, C.; Turmel, M.; Dobosz, S.; Wróbel, R.J.; Kierzek, A. Morphological and molecular identification reveals that waters from an isolated oasis in Tamanrasset (extreme South of Algerian Sahara) are colonized by opportunistic and pollution–tolerant diatom species. Ecol. Indic. 2021, 121, 107104. [Google Scholar] [CrossRef]
- Hamsher, S.E.; Keepers, K.G.; Pogoda, C.S.; Stepanek, J.G.; Kane, N.C.; Kociolek, J.P. Extensive chloroplast genome rearrangement amongst three closely related Halamphora spp. (Bacillariophyceae), and evidence for rapid evolution as compared to land plants. PLoS ONE 2019, 14, e0217824. [Google Scholar] [CrossRef] [PubMed]
- Pogoda, C.S.; Keepers, K.G.; Hamsher, S.E.; Stepanek, J.G.; Kane, N.C.; Kociolek, J.P. Comparative analysis of the mitochondrial genomes of six newly sequenced diatoms reveals group II introns in the barcoding region of cox1. Mitochondrial DNA Part A 2019, 30, 43–51. [Google Scholar] [CrossRef] [PubMed]
- Villain, A.; Kojadinovic, M.; Puppo, C.; Prioretti, L.; Hubert, P.; Zhang, Y.; Grégori, G.; Roulet, A.; Roques, C.; Claverie, J.-M. Complete mitochondrial genome sequence of the freshwater diatom Asterionella formosa. Mitochondrial DNA Part B 2017, 2, 97–98. [Google Scholar] [CrossRef] [PubMed]
- An, S.M.; Noh, J.H.; Lee, H.R.; Choi, D.H.; Lee, J.H.; Yang, E.C. Complete mitochondrial genome of biraphid benthic diatom, Navicula ramosissima (Naviculales, Bacillariophyceae). Mitochondrial DNA Part B 2016, 1, 549–550. [Google Scholar] [CrossRef] [PubMed]
- Wang, Y.; Liu, S.; Wang, J.; Yao, Y.; Chen, Y.; Xu, Q.; Zhao, Z.; Chen, N. Diatom Biodiversity and Speciation Revealed by Comparative Analysis of Mitochondrial Genomes. Front. Plant Sci. 2022, 13, 749982. [Google Scholar] [CrossRef]
- Aunins, A.W.; Hamilton, D.; King, T.L. The complete mitochondrial genome of the stalk-forming diatom Didymosphenia geminata. Mitochondrial DNA Part B 2018, 3, 676–677. [Google Scholar] [CrossRef]
- Sims, P.A.; Mann, D.G.; Medlin, L.K. Evolution of the diatoms: Insights from fossil, biological and molecular data. Phycologia 2006, 45, 361–402. [Google Scholar] [CrossRef]
- Stepanek, J.G.; Kociolek, J.P. Molecular Phylogeny of Amphora sensu lato (Bacillariophyta): An Investigation into the Monophyly and Classification of the Amphoroid Diatoms. Protist 2014, 165, 177–195. [Google Scholar] [CrossRef] [PubMed]
- Gastineau, R.; Li, C.; Ashworth, M.P.; Witkowski, A.; Turmel, M.; Gorecka, E.; Frankovich, T.A.; Wachnicka, A.; Lobban, C.S.; Theriot, E.C. A new insight into Amicula, a genus of tiny marine benthic diatoms with the description of two new tropical species and the largest mitogenome known for a stramenopile. Front. Mar. Sci. 2022, 9, 941506. [Google Scholar] [CrossRef]
- Goulding, S.E.; Wolfe, K.; Olmstead, R.; Morden, C. Ebb and flow of the chloroplast inverted repeat. Mol. Gen. Genet. MGG 1996, 252, 195–206. [Google Scholar] [CrossRef] [PubMed]
- Yu, M.; Ashworth, M.P.; Hajrah, N.H.; Khiyami, M.A.; Sabir, M.J.; Alhebshi, A.M.; Al-Malki, A.L.; Sabir, J.S.; Theriot, E.C.; Jansen, R.K. Evolution of the plastid genomes in diatoms. In Advances in Botanical Research; Elsevier: Amsterdam, The Netherlands, 2018; Volume 85, pp. 129–155. [Google Scholar]
- Gastineau, R.; Davidovich, N.A.; Davidovich, O.I.; Lemieux, C.; Turmel, M.; Wróbel, R.J.; Witkowski, A. Extreme enlargement of the inverted repeat region in the plastid genomes of diatoms from the genus Climaconeis. Int. J. Mol. Sci. 2021, 22, 7155. [Google Scholar] [CrossRef] [PubMed]
- Falkowski, P.G.; Katz, M.E.; Knoll, A.H.; Quigg, A.; Raven, J.A.; Schofield, O.; Taylor, F. The evolution of modern eukaryotic phytoplankton. Science 2004, 305, 354–360. [Google Scholar] [CrossRef] [PubMed]
- Round, F.E.; Crawford, R.M.; Mann, D.G. Diatoms: Biology and Morphology of the Genera; Cambridge University Press: Cambridge, UK, 1990. [Google Scholar]
- Simonsen, R. The diatom system: Ideas on phylogeny. Bacillaria 1979, 2, 9. [Google Scholar]
- Mann, D.G. Structure, life history and systematics of Rhoicosphenia (Bacillariophyta). I. The Vegetative Cell of rh. Curvata 1. J. Phycol. 1982, 18, 162–176. [Google Scholar]
- Trobajo, R.; Mann, D.G. A rapid cleaning method for diatoms. Diatom Res. 2019, 34, 115–124. [Google Scholar] [CrossRef]
- Du, F.-C.; Li, Y.-H.; Xu, K.-D. Morphology and molecular phylogeny of Pleurosigma pacificum sp. nov.(Pleurosigmataceae), a new tropical pelagic species from the Western Pacific Ocean. PhytoKeys 2023, 227, 99. [Google Scholar] [CrossRef]
- Alverson, A.J.; Jansen, R.K.; Theriot, E.C. Bridging the Rubicon: Phylogenetic analysis reveals repeated colonizations of marine and fresh waters by thalassiosiroid diatoms. Mol. Phylogenetics Evol. 2007, 45, 193–210. [Google Scholar] [CrossRef]
- Medlin, L.; Elwood, H.J.; Stickel, S.; Sogin, M.L. The characterization of enzymatically amplified eukaryotic 16S-like rRNA-coding regions. Gene 1988, 71, 491–499. [Google Scholar] [CrossRef]
- Edgar, S.M.; Theriot, E.C. Phylogeny of Aulacoseira (Bacillariophyta) based on molecules and morphology 1. J. Phycol. 2004, 40, 772–788. [Google Scholar] [CrossRef]
- Ruck, E.C.; Theriot, E.C. Origin and evolution of the canal raphe system in diatoms. Protist 2011, 162, 723–737. [Google Scholar] [CrossRef]
- Bolger, A.M.; Lohse, M.; Usadel, B. Trimmomatic: A flexible trimmer for Illumina sequence data. Bioinformatics 2014, 30, 2114–2120. [Google Scholar] [CrossRef]
- Bankevich, A.; Nurk, S.; Antipov, D.; Gurevich, A.A.; Dvorkin, M.; Kulikov, A.S.; Lesin, V.M.; Nikolenko, S.I.; Pham, S.; Prjibelski, A.D. SPAdes: A new genome assembly algorithm and its applications to single-cell sequencing. J. Comput. Biol. 2012, 19, 455–477. [Google Scholar] [CrossRef]
- Tillich, M.; Lehwark, P.; Pellizzer, T.; Ulbricht-Jones, E.S.; Fischer, A.; Bock, R.; Greiner, S. GeSeq-versatile and accurate annotation of organelle genomes. Nucleic Acids Res. 2017, 45, W6–W11. [Google Scholar] [CrossRef]
- Lewis, S.E.; Searle, S.; Harris, N.; Gibson, M.; Iyer, V.; Richter, J.; Wiel, C.; Bayraktaroglu, L.; Birney, E.; Crosby, M. Apollo: A sequence annotation editor. Genome Biol. 2002, 3, research0082.1. [Google Scholar] [CrossRef]
- Lohse, M.; Drechsel, O.; Bock, R. OrganellarGenomeDRAW (OGDRAW): A tool for the easy generation of high-quality custom graphical maps of plastid and mitochondrial genomes. Curr. Genet. 2007, 52, 267–274. [Google Scholar] [CrossRef]
- Zhang, D.; Gao, F.; Jakovlić, I.; Zou, H.; Zhang, J.; Li, W.X.; Wang, G.T. PhyloSuite: An integrated and scalable desktop platform for streamlined molecular sequence data management and evolutionary phylogenetics studies. Mol. Ecol. Resour. 2020, 20, 348–355. [Google Scholar] [CrossRef]
- Katoh, K.; Standley, D.M. MAFFT multiple sequence alignment software version 7: Improvements in performance and usability. Mol. Biol. Evol. 2013, 30, 772–780. [Google Scholar] [CrossRef] [PubMed]
- Capella-Gutiérrez, S.; Silla-Martínez, J.M.; Gabaldón, T. trimAl: A tool for automated alignment trimming in large-scale phylogenetic analyses. Bioinformatics 2009, 25, 1972–1973. [Google Scholar] [CrossRef] [PubMed]
- Lanfear, R.; Frandsen, P.B.; Wright, A.M.; Senfeld, T.; Calcott, B. PartitionFinder 2: New methods for selecting partitioned models of evolution for molecular and morphological phylogenetic analyses. Mol. Biol. Evol. 2017, 34, 772–773. [Google Scholar] [CrossRef] [PubMed]
- Nguyen, L.-T.; Schmidt, H.A.; Von Haeseler, A.; Minh, B.Q. IQ-TREE: A fast and effective stochastic algorithm for estimating maximum-likelihood phylogenies. Mol. Biol. Evol. 2015, 32, 268–274. [Google Scholar] [CrossRef] [PubMed]
- Huelsenbeck, J.P.; Ronquist, F. MRBAYES: Bayesian inference of phylogenetic trees. Bioinformatics 2001, 17, 754–755. [Google Scholar] [CrossRef]
- Warren, D.L.; Geneva, A.J.; Lanfear, R. RWTY (R We There Yet): An R package for examining convergence of Bayesian phylogenetic analyses. Mol. Biol. Evol. 2017, 34, 1016–1020. [Google Scholar] [CrossRef]
- Yang, Z. PAML 4: Phylogenetic analysis by maximum likelihood. Mol. Biol. Evol. 2007, 24, 1586–1591. [Google Scholar] [CrossRef]
- Hajós, M. Stratigraphy of Hungary's Miocene diatomaceous earth deposits. Geologica Hungarica. Ser. Palaeontol. 1986, 49, 1–339. [Google Scholar]
- Lazarus, D. Neptune: A marine micropaleontology database. Math. Geol. 1994, 26, 817–832. [Google Scholar] [CrossRef]
- Nakov, T.; Beaulieu, J.M.; Alverson, A.J. Accelerated diversification is related to life history and locomotion in a hyperdiverse lineage of microbial eukaryotes (Diatoms, Bacillariophyta). New Phytol. 2018, 219, 462–473. [Google Scholar] [CrossRef]


| Species | Cocconeiopsis kantsiensis | Navicula arenaria | Navicula avium | Navicula tsukamotoi | Phaeodactylum tricornutum | Pleurosigma intermedium | Seminavis. robusta | Didymosphenia geminata | Fistulifera saprophila | Halamphora americana | Schizostauron trachyderma |
|---|---|---|---|---|---|---|---|---|---|---|---|
| Sizes | 140,415 | 147,331 | 137,691 | 136,746 | 117,369 | 174,382 | 150,905 | 117,972 | 122,456 | 142,551 | 187,029 |
| LSC | 76,086 | 80,134 | 70,273 | 70,012 | 63,674 | 96,638 | 70,540 | 63,610 | 64,590 | 77,289 | 92,894 |
| SSC | 44,932 | 47,699 | 49,194 | 50,048 | 39,871 | 60,400 | 61,497 | 40,370 | 39,968 | 44,724 | 59,661 |
| IR | 9699 | 9749 | 9112 | 8343 | 6912 | 8672 | 9434 | 6996 | 8949 | 10,269 | 17,237 |
| GC content | 31.80% | 30.70% | 31.30% | 31.40% | 32.60% | 29.60% | 30.92% | 31.60% | 32.44% | 32.00% | 30.77% |
| Total genes | 167 | 165 | 164 | 164 | 162 | 157 | 175 | 160 | 160 | 172 | 197 |
| Reference | This study | [13] | [13] | [13] | [9] | [13] | [14] | [15] | [16] | [17] | [11] |
| Species | Cocconeiopsis kantsiensis | Navicula ramosissima | Navicula tsukamotoi | Navicula veneta | Phaeodactylum tricornutum | Haslea karadagensis | Didymosphenia geminata | Halamphora coffeaeformis | Schizostauron trachyderma |
|---|---|---|---|---|---|---|---|---|---|
| Sizes | 43,732 | 48,652 | 50,972 | 38,897 | 77,356 | 40,924 | 37,765 | 44,653 | 41,957 |
| GC content | 28.30% | 31.11% | 28.60% | 25.09% | 35.01% | 29.76% | 26.93% | 32.90% | 27.83% |
| PCG | 33 | 35 | 36 | 35 | 34 | 34 | 35 | 38 | 35 |
| tRNA | 25 | 23 | 25 | 23 | 24 | 22 | 25 | 22 | 22 |
| rRNA | 2 | 3 | 2 | 2 | 2 | 2 | 2 | 2 | 2 |
| Total genes | 66 | 68 | 70 | 62 | 60 | 65 | 62 | 62 | 59 |
| Reference | This study | [20] | [21] | [16] | [10] | Accession: OK729586 | [22] | [18] | [11] |
Disclaimer/Publisher’s Note: The statements, opinions and data contained in all publications are solely those of the individual author(s) and contributor(s) and not of MDPI and/or the editor(s). MDPI and/or the editor(s) disclaim responsibility for any injury to people or property resulting from any ideas, methods, instructions or products referred to in the content. |
© 2023 by the authors. Licensee MDPI, Basel, Switzerland. This article is an open access article distributed under the terms and conditions of the Creative Commons Attribution (CC BY) license (https://creativecommons.org/licenses/by/4.0/).
Share and Cite
Du, F.; Li, Y.; Xu, K. Phylogeny and Evolution of Cocconeiopsis (Cocconeidaceae) as Revealed by Complete Chloroplast and Mitochondrial Genomes. Int. J. Mol. Sci. 2024, 25, 266. https://doi.org/10.3390/ijms25010266
Du F, Li Y, Xu K. Phylogeny and Evolution of Cocconeiopsis (Cocconeidaceae) as Revealed by Complete Chloroplast and Mitochondrial Genomes. International Journal of Molecular Sciences. 2024; 25(1):266. https://doi.org/10.3390/ijms25010266
Chicago/Turabian StyleDu, Feichao, Yuhang Li, and Kuidong Xu. 2024. "Phylogeny and Evolution of Cocconeiopsis (Cocconeidaceae) as Revealed by Complete Chloroplast and Mitochondrial Genomes" International Journal of Molecular Sciences 25, no. 1: 266. https://doi.org/10.3390/ijms25010266
APA StyleDu, F., Li, Y., & Xu, K. (2024). Phylogeny and Evolution of Cocconeiopsis (Cocconeidaceae) as Revealed by Complete Chloroplast and Mitochondrial Genomes. International Journal of Molecular Sciences, 25(1), 266. https://doi.org/10.3390/ijms25010266