Abstract
Mycosis fungoides (MF) is the most common form of cutaneous T-cell lymphoma (CTCL) and is characterized by epidermotrophism of malignant CD4+ T-lymphocytes. When MF advances to a recurrent stage, patients require treatment with systemic therapies such as vorinostat, a histone deacetylase inhibitor. While vorinostat has been shown to exhibit anti-tumor activity in MF, its exact molecular mechanism has yet to be fully discerned. In the present study, we examined the transcriptomic and proteomic profiles of vorinostat treatment in two MF cell lines, Myla 2059 and HH. We find that vorinostat downregulates CTLA-4, CXCR4, and CCR7 in both cell lines, but its effect on several key pathways differs between the two MF cell lines. For example, vorinostat upregulates CCL5, CCR5, and CXCL10 expression in Myla cells but downregulates CCL5 and CXCL10 expression in HH cells. Furthermore, vorinostat upregulates IFN-γ and IL-23 signaling and downregulates IL-6, IL-7, and IL-15 signaling in Myla cells but does not affect these pathways in HH cells. Although Myla and HH represent established MF cell lines, their distinct tumor origin from separate patients demonstrates that inherent phenotypic variations within the disease persist, underscoring the importance of using a variety of MF cells in the preclinical development of MF therapeutics.
1. Introduction
Mycosis fungoides (MF) is the most common form of cutaneous T-cell lymphoma (CTCL), accounting for approximately half of all primary cutaneous lymphoma cases [1,2,3]. MF typically follows a protracted course, with patients slowly progressing through patch, plaque, and tumor stages over several years [1,3,4]. However, these patients often suffer from a significant decrease in quality of life secondary to intense pruritus, sleep disturbances, psychosocial dysfunction, and a high cost of healthcare utilization [5,6,7,8,9]. Furthermore, MF is difficult to treat, with patients only rarely achieving long-term remission or complete cure, especially in advanced stages, for which the survival rate may be as low as 18% [1,10].
In the early stages, treatment of MF is focused on controlling cutaneous lesions by using skin-directed therapies such as topical corticosteroids, topical mechlorethamine, topical retinoids, ultraviolet light therapy, and radiation therapy [1,10,11,12]. However, in the later stages, treatment relies on systemic agents such as interferons, retinoids, chemotherapeutics, and monoclonal antibodies against common T-cell receptors [1,10,11,12]. One such systemic medication, vorinostat, is a class I and II histone deacetylase inhibitor that is approved for patients with persistent, progressive, or recurrent CTCL after the failure of two other systemic therapies [1]. Vorinostat is thought to induce the accumulation of acetylated histone and non-histone proteins, which results in chromatin remodeling, increased expression of tumor suppressor genes, cell cycle arrest, and apoptosis [13]. In MF specifically, vorinostat exerts anti-tumor activities by interfering with T-cell receptor signaling, suppressing the MAPK pathway, and downregulating anti-apoptotic genes such as c-FLIP [14,15,16]. However, the exact molecular mechanisms of vorinostat in MF remain unknown [13].
This study was undertaken to further characterize the effects of vorinostat in CTCL by using two MF cell lines, Myla 2059 and HH. We find that vorinostat downregulates CTLA-4, CXCR4, and CCR7 in both cell lines but differentially modulates other chemokine receptors and inflammatory pathways.
2. Results
2.1. Transcriptomic and Proteomic Effects of Vorinostat Treatment
The overall study design is shown in Figure 1. We first analyzed control and vorinostat-treated Myla 2059 and HH cells by using RNA sequencing to identify the targets that are affected by the medication. Differential expression analysis identified 5862 differentially expressed genes (DEGs) between control and vorinostat-treated Myla cells (Figure 2A) and 6277 DEGs between control and vorinostat-treated HH cells (Figure 2B). Gene set enrichment analysis (GSEA) based on the Biocarta database revealed the suppression of several inflammatory pathways which differed between the two cell lines. Treated Myla cells showed suppression of IL-12 and IL-17 signaling in addition to the downregulation of TCR, MHC, T helper cell, and cytotoxic T cell-related pathways (Figure 2C). In contrast, treated HH cells showed suppression of the IL-2RB pathway (Figure 2D). Notably, CTLA-4 signaling was suppressed in both cell lines following vorinostat treatment.
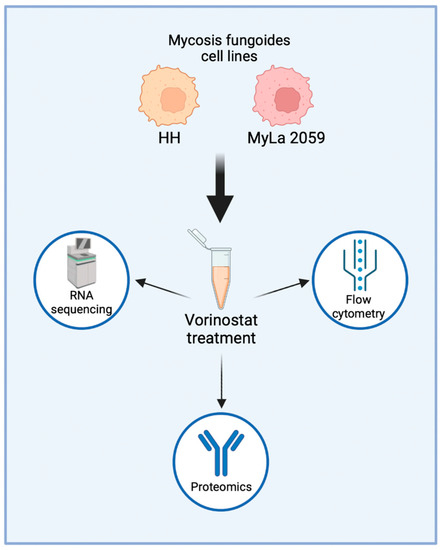
Figure 1.
Overall study design. HH and Myla 2059 cells were used for in vitro experiments. Cells were treated with vorinostat or vehicle and subjected to RNA sequencing, reverse-phase protein array (RPPA) or proteomics, and flow cytometry.
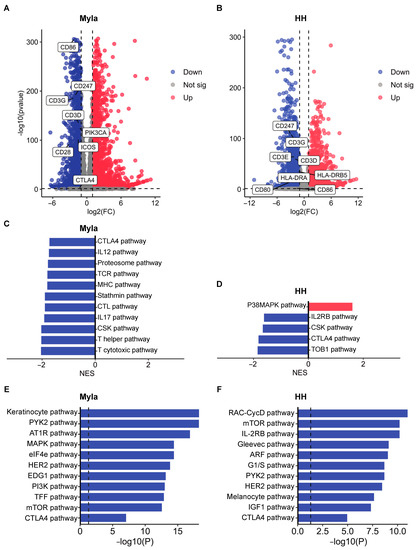
Figure 2.
Transcriptomic and proteomics effects of vorinostat treatment. (A) Volcano plot showing DEGs between control and vorinostat-treated Myla cells. (B) Volcano plot showing DEGs between control and vorinostat-treated HH cells. Differentially expressed CTLA-4-signaling-related genes are highlighted in both volcano plots. (C) GSEA results showing pathways that are up- and downregulated by vorinostat in Myla cells. (D) GSEA results showing pathways that are up- and downregulated by vorinostat in HH cells. (E) EnrichR enrichment analysis of proteins found to be downregulated by vorinostat by RPPA in Myla cells. (F) EnrichR enrichment analysis of proteins found to be downregulated by vorinostat by RPPA in HH cells. FC—fold change; sig—significant; NES—normalized enrichment score.
To broaden our understanding of the targets affected by vorinostat, we next subjected control and treated cells to RPPA. Functional enrichment analyses were performed on gene lists of proteins that are downregulated by vorinostat by using EnrichR. We first identified the top 10 pathways suppressed by vorinostat and then sought to confirm the suppression of the CTLA-4 pathway at a proteomic level. We found that the CTLA-4 pathway was indeed suppressed in both vorinostat-treated Myla (Figure 2E) and HH cells (Figure 2F). Additionally, the analysis revealed suppression of several growth-promoting pathways in vorinostat-treated Myla cells, such as MAPK, eIF4e, HER2, PI3K, and mTOR signaling (Figure 2E). Treated HH cells also showed suppression of mTOR and HER2 pathways, as well as IL-2RB signaling, similar to the transcriptomic analysis findings (Figure 2F).
2.2. Vorinostat Modulates the Expression of Chemokine Receptors and Ligands
Given the prominent downregulation of several immunologic pathways by vorinostat, we theorized that the medication may modulate the tumor microenvironment by altering the expression of chemokine receptors and ligands. We first identified the basal expression level of these receptors and ligands in Myla and HH cells by using RNA sequencing. As can be seen in Figure 3A, both cell lines showed prominent expression of CCR4, CCR7, CXCR4, and CXCL10. However, expression of other chemokines differed between the two MF cell lines. Myla cells expressed several receptors and ligands that were absent in HH cells, including CCL1, CCR3, and CXCL3, while HH cells expressed CCL28 and CXCR3, which were absent in Myla. We next evaluated how the expression of these receptors changed following vorinostat treatment. Heatmaps of significantly different chemokine receptors and ligands between the control and treated Myla and HH cells are shown in Figure 3B and Figure 3C, respectively. In both cell lines, vorinostat suppressed the expression of CXCR4 and CCR7, while it upregulated CXCL11. However, vorinostat affected several other receptors and ligands in these cell lines differently. CCL5 and its receptor CCR5 were upregulated by vorinostat in Myla cells, while CCL5 was suppressed in vorinostat-treated HH cells. Similarly, vorinostat treatment upregulated CXCL10 in Myla cells but downregulated its expression in HH cells. In contrast, CCR10 was downregulated in Myla cells but upregulated in HH cells in response to vorinostat treatment.
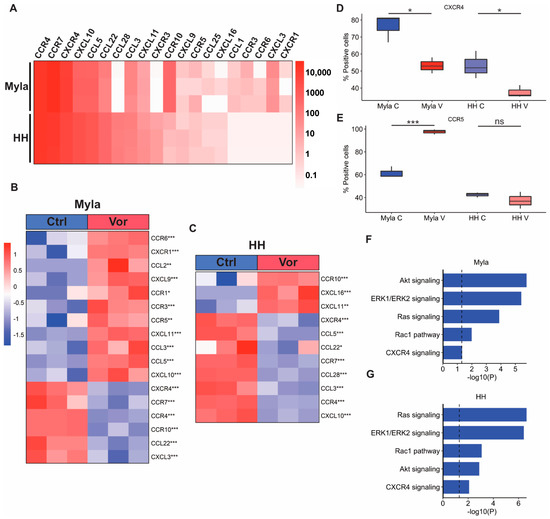
Figure 3.
Effect of vorinostat on chemokine receptors and ligands. (A) Heatmap showing expression of chemokine receptors and ligands at baseline in Myla and HH cells. (B) Heatmap showing chemokine receptors and ligands significantly altered by vorinostat treatment in Myla cells. (C) Heatmap showing chemokine receptors and ligands significantly altered by vorinostat treatment in HH cells. (D) Boxplot showing CXCR4 expression in control and vorinostat-treated Myla and HH cells identified via flow cytometry. (E) Boxplot showing CCR5 expression in control and vorinostat-treated Myla and HH cells identified via flow cytometry. (F) EnrichR enrichment analysis of RPPA data showing downregulation of CXCR4-related pathways in Myla cells via vorinostat treatment. (G) EnrichR enrichment analysis of RPPA data showing downregulation of CXCR4-related pathways in HH cells via vorinostat treatment. * p < 0.05; ** p < 0.01; *** p < 0.001; Ctrl—control; Vor—vorinostat; C—control; V—vorinostat; NS—not significant.
We next sought to confirm alterations of some chemokine receptors by utilizing flow cytometry and RPPA. Consistent with our transcriptomic data findings, flow cytometry analysis also showed that the expression of CXCR4 significantly decreased in both cell lines following vorinostat treatment (Figure 3D). Additionally, the expression of CCR5 significantly increased in treated Myla cells, while there was no significant difference in treated HH cells (Figure 3E). We next conducted an EnrichR enrichment analysis on gene lists of proteins that were downregulated by vorinostat in both cell lines to determine if CXCR4 and downstream signaling pathways were suppressed at a protein level. This analysis showed suppression of Akt, ERK1/ERK2, Ras, Rac1, and CXCR4 signaling pathways in both cell lines following vorinostat treatment (Figure 3F,G).
2.3. Vorinostat Modulates Cytokine Signaling
Finally, given the suppression of various inflammatory pathways identified via GSEA, we proceeded to examine how vorinostat affected additional cytokine signaling pathways by using gene set variation analysis (GSVA). Boxplots of GSVA results are shown in Figure 4A–I. Interestingly, similar to the GSEA findings (Figure 2C,D), vorinostat had a differential effect on several cytokine pathways in the two cell lines and seemingly provided broader immunoregulatory effects on Myla cells. IFN-γ and IL-23 signaling were increased in vorinostat-treated Myla cells, while IL-2, IL-3, IL-4, IL-6, IL-7, and IL-15 signaling pathways were decreased. No significant difference was observed for these pathways in treated HH cells. Similarly, IL-5 signaling was suppressed in treated HH cells, but no difference was observed in treated Myla cells.
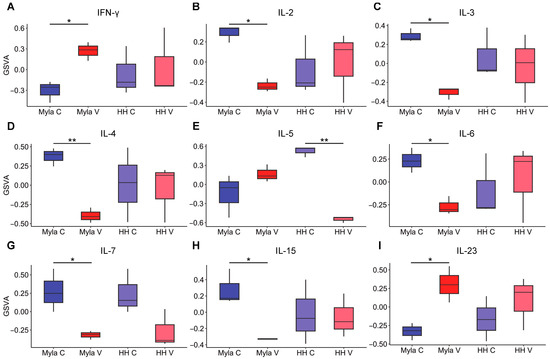
Figure 4.
Effect of vorinostat on inflammatory pathways. (A) Boxplot showing effect of vorinostat on INF-γ signaling, (B) IL-2 signaling, (C) IL-3 signaling, (D) IL-4 signaling, (E) IL-5 signaling, (F) IL-6 signaling, (G) IL-7 signaling, (H) IL-15 signaling, (I) IL-23 signaling. * p < 0.05, ** p < 0.01; C—control; V—vorinostat; GSVA—gene set variation analysis.
3. Discussion
The present study examines the transcriptomic and proteomic impacts of vorinostat in two MF cell lines. Our results demonstrate that vorinostat suppresses CTLA-4 signaling and decreases the expression of CXCR4 and CCR7 in both cell lines. However, the effect of vorinostat on other chemokines and interleukin signaling pathways varies between the two cell lines.
The ability of vorinostat to suppress CTLA-4 in both MF cell lines is noteworthy. CTLA-4 is an immune checkpoint co-stimulatory protein that is commonly overexpressed in various solid and hematologic malignancies and serves to promote evasion of immune surveillance by inhibiting T-cell activation and proliferation [17,18]. CTLA-4 expression is often increased in patients with MF and becomes progressively more dysregulated with advancement to the late-stage disease [19]. This may be one reason that vorinostat is efficacious in treating advanced MF and other hematologic malignancies [20,21], as suppression of CTLA-4 likely promotes a more robust immune response against malignant tissues [22]. Consistent with previous research, our study also found vorinostat to repress the growth promoting the TCR signaling pathway [14]. However, we find that the medication downregulates this pathway in Myla cells but not HH.
Vorinostat also reduced levels of the chemokine receptors CXCR4 and CCR7 in both cell lines. CXCR4 is expressed by most hematopoietic cells. The receptor and its chemotactic ligand, CXCL12, function to regulate cell migration and are upregulated in various cancers, including MF [23]. Activation of the CXCR4-CXCL12 axis has been shown to promote tumor growth, angiogenesis, and metastasis in breast [24,25,26], colorectal [27], and lung cancers [28,29]. In CTCL specifically, CXCR4 plays a role in cell migration and chemotaxis and may promote cutaneous homing of cells through interactions between CXCR4 on malignant lymphocytes and CXCL12 on fibroblasts and dermal stromal cells [30,31]. This finding corroborates previous studies demonstrating CXCR4 suppression in vorinostat-treated CTCL cells [14]. However, Wozniak et al. did not detect CCR7 suppression by the medication. CCR7 is another homing chemokine receptor expressed by dendritic cells and T-cells that induces migration and invasion of malignant cells into lymph nodes through its ligand, CCL21, which is present on lymphatic vessels [32]. The expression of CCR7 has been shown to be a marker of advanced MF and has been correlated with subcutaneous involvement [33]. Taken together, this suggests that vorinostat may modulate the expression of these chemokine receptors and ligands to alter tumor cell-homing.
When the expression of other chemokine receptors and ligands is evaluated, however, vorinostat appears to differentially affect each cell line. For example, vorinostat increased the expression of CCL5, CCR5, CXCL10, and CCR10 in Myla cells but decreased CCL5 and CXCL10, upregulated CCR10, and had no significant effect on CCR5 in HH cells. The role of the CCR5-CCL5 axis in CTCL is not completely understood, and CCR5 expression may be limited to a rarer type of CTCL, namely, subcutaneous panniculitis-like T-cell lymphoma [34,35], so further studies are needed to determine how these changes may affect CTCL pathogenesis. CCR10 and its ligand, CCL27, are preferentially expressed on the memory-like regulatory T-cells in the skin, which help maintain cutaneous homeostasis [36]. CCR10 has also been shown to be significantly increased in CTCL patients regardless of their disease stage [37]. Regulatory T-cells inhibit anti-tumor immunity and promote tumor development and progression, so suppression of CCR10 in vorinostat-treated Myla cells could indicate less Treg activity and a more robust anti-tumor response [38]. Interestingly, CXCL10 has previously been shown to be suppressed by vorinostat treatment, but its expression was not found to be differentially modulated by the medication in a cell-line-specific manner. CXCL10 is a cytokine that promotes the recruitment of CXCR3+ cells, such as Th1 and CD8+ T-cells [39]. Thus, the upregulation of CXCL10 by vorinostat in Myla cells could promote a more robust cellular response against malignant T-cells. In fact, intratumoral CXCL10 is shown to be a positive prognostic factor for response to immunotherapy in other cancers such as melanoma [39]. In addition to CXCL10 suppression, previous studies have demonstrated that vorinostat decreases the expression of several chemokine receptors and ligands, including CXCR3, CXCL13, CXCL16, CCL1, CCL22, CCL26, CCL28, CCRA, and CCR4, while upregulating CXCL9, CXCL11, CCL19, CCL20, CCL27, CX3CL1, CCR2, and CCR6 [14]. We also detected the suppression of CCL22 and CCR4 with upregulation of CXCL11 in both cell lines. However, CCR6 was upregulated only in Myla cells but not affected in HH.
The effect of vorinostat on cytokine signaling is cell-type-specific. For example, vorinostat increased IFN-γ and IL-23 signaling, while it suppressed IL-6, IL-7, IL-15, and IL-17 signaling pathways in Myla but not HH cells. Previous studies have shown that vorinostat suppresses IL-4 and IL-5 and increases the expression of IL-6, IL-15, and IL-23 but did not detect a differential effect on these pathways [14]. IFN-γ is a proinflammatory cytokine that is often decreased in MF [40]. IFN-γ has been shown to stimulate CD8+ T-cells to promote a robust cellular response against malignant cells. Furthermore, IFN-γ supplementation has previously been used to treat several cancers, including MF [41]. IL-23 was shown to be increased in both epidermal keratinocytes and dermal lymphocytes, with a lower prevalence shown in later stages of CTCL, indicating that abnormal levels of IL-23 may also play a role in CTCL disease progression [42]. IL-6 is an acute-phase reactant that is produced by macrophages in response to pathogen-associated molecular patterns [43]. Elevated levels of this cytokine have been identified in CTCL patients and show a negative correlation with prognosis, as it may cooperate with vascular endothelial growth factor and leukotriene alpha to induce endothelial cell proliferation and neovascularization [44]. IL-7 is a cytokine that is necessary for T-cell development in the thymus, where it activates STAT3 and STAT5 to promote maturation of these cells [45]. Aberrant IL-7 singling is believed to a play role in the early stages of CTCL, as activation of STAT3 and STAT5 provides a survival signal to malignant T-cells until the later stages, in which there is often cytokine-independent JAK1 and JAK3 signaling [46,47,48]. IL-15 is an inflammatory cytokine that functions to promote cell growth and proliferation and is thought to have both anti-tumor and tumor-promoting activities, with its net effect likely being dependent on the particular tissue environment. This cytokine is thought to play a complex role in the pathogenesis of CTCL and is predominantly expressed in the skin lesions of advanced-stage MF, contributing to the survival and proliferation of malignant T-cells [49]. A recent study that utilized transgenic mice that overexpress IL-15 showed that this cytokine induces CTCL-like-lesions that are comparable to CTCL in humans. The same study demonstrated that ZEB1, a transcriptional repressor of IL-15, is unable to bind to the IL-15 promotor region in the cells of CTCL patients due to hypermethylation in this region of the gene transcript, resulting in overexpression of this cytokine [50]. IL-17 family cytokines are produced by many cells, including mast cells, neutrophils, and Th17 cells, and promote an immune response to extracellular pathogens [51]. IL-17 is shown to be expressed by malignant T-cells in CTCL and becomes progressively more dysregulated with disease progression [52]. IL-17 is thought to contribute to CTCL by activating pathways such as NF-kB and MAPK as well as by promoting angiogenesis [53,54].
Although both Myla and HH represent established MF, these cell lines originate from different patients and are, thus, expected to display molecular heterogeneity. For example, immunophenotyping studies have demonstrated differences in cluster of differentiation (CD) marker expression in these cells with Myla cells expressing CD4 and CD8 and with HH expressing CD2, CD3, CD4, CD5, and CD30 but lacking CD8 and CD25 [55]. Likewise, clinical trials have demonstrated a differential response among patients treated with the drug, with only approximately 29.7% showing an objective response [56]. Given the findings of the present study, this differential response may be due in part to heterogeneity in the immunomodulatory effects of the drug among MF patients, further highlighting the utility of personalized medicine in this population. For example, vorinostat may be synergistic with a CTLA-4 inhibitor in patients with a similar phenotype to HH or Myla, as it would further antagonize this pathway. At the same time, biologics targeted at other cell surface markers may be more or less effective in combination with vorinostat, depending on the molecular characteristics of that patient’s disease.
The limitations of this study include the use of only two MF cell lines and the lack of in vivo experiments. Further investigation utilizing additional cell lines should be completed to gain more insight into the molecular mechanisms of vorinostat on more phenotypically different cell lines and to assess the replicability of our work. In conclusion, we identified heterogeneity in the response of MF cells to vorinostat, which highlights the importance of using a variety of MF cell lines in the preclinical development of novel therapeutics.
4. Materials and Methods
4.1. Cell Culture
Myla 2059 (University of Copenhagen, Copenhagen, Denmark) and HH (ATCC, Manassas, VA, USA; #CRL-2105) were the cell lines chosen for this study. Both represent immortalized patient-derived advanced-stage MF cell lines. Myla 2059 was derived from a skin plaque biopsy of an 82-year-old Caucasian male with Stage IIA MF. The HH cell line was derived from the peripheral blood of a 61-year-old Caucasian male with Stage IVB leukemic MF [55]. Cells were maintained in RPMI-1640 (Gibco, Billings, MO, USA; #11875093) supplemented with 10% fetal bovine serum and kept at a concentration of 1 × 10⁵ to 1 × 10⁶ cells per ml. For experiments, only cells with less than five passages were used.
4.2. mRNA Sequencing
Myla 2059 and HH cells were treated with vorinostat (5 µM in 0.5% DMSO) or vehicle for 4 h. Total RNA was isolated from cell pellets by using an RNAeasy plus kit (Qiagen, West Caldwell, NJ, USA; #74034) according to the manufacturer’s instructions. RNA-seq data were processed by using the TrimGalore toolkit version 0.6.5 (https://www.bioinformatics.babraham.ac.uk/projects/trim_galore accessed on 31 March 2023). Only reads that were 20nt or longer after trimming were kept for further analysis. Reads were mapped to the GRCh38v93 version of the human genome and transcriptome [57] by using the STAR RNA-seq alignment tool [58]. Reads were kept for subsequent analysis if they mapped to a single genomic location. Gene counts were compiled by using the HTSeq tool [59]. Only genes that had at least 10 reads in any given library were used in subsequent analyses. Normalization and differential expression were carried out by using the DESeq2 [60] Bioconductor [61] package with the R statistical programming environment version 4.0.2 (www.r-project.org accessed on 31 March 2023). The false discovery rate was calculated to control for multiple hypothesis testing. GSEA was performed by using the GSEA software version 4.3.2 [62,63], with the Biocarta database as reference. GSVA was conducted with the GSVA R Bioconductor package by using the R statistical programming environment [64]. DEGs were defined as coding genes with a log2-fold change >1 or <−1 and a false-discovery-rate-adjusted p-value < 0.05.
4.3. Reverse-Phase Protein Array (RPPA)
Myla and HH cells were treated with vorinostat (5 µM in 0.5% DMSO) or vehicle for 4 h. Cell pellets were isolated and incubated with lysis buffer (1% Triton X-100, 50 mM HEPES, pH 7.4, 150 mM NaCl, 1.5 mM MgCl2, 1 mM EGTA, 100 mM NaF, 10 mM Na pyrophosphate, 1 mM Na3VO4, 10% glycerol, protease inhibitor (Roche Applied Science, Penzberg, Germany; #05056489001) and phosphatase inhibitor (Roche Applied Science, Penzberg, Germany; #04906837001)) on ice for 30 min, then they were clarified via centrifugation at 10,000 r.p.m. After quantification of protein concentration, lysates were denatured with 4X sodium dodecyl sulfate (SDS) sample buffer (40% glycerol, 8% SDS, 0.25M Tris-HCl, pH 6.8, 10% (v/v) 2-mercaptoethanol) and boiled for 5 min. Samples were stored at −80 °C and then sent to MD Anderson’s RPPA core facility (Houston, TX, USA). Biocarta functional enrichment analyses were performed on gene lists of proteins for which the expression decreased with vorinostat treatment by using EnrichR [65,66,67].
4.4. Flow Cytometry
Viable 3–5 × 10⁶ cells were incubated with vorinostat (5 µM in 0.5% DMSO) or vehicle for 24 h at 37 °C in 5% CO2. Cells were collected after incubation and filtered through 40 mm cell filters to obtain single-cell suspensions. The cells were washed in RPMI-1640, washed with PBS, and stained for viability (Zombie Aqua Fixable Viability Kit, BioLegend, San Diego, CA, USA). Cells were then incubated with TruStain fcX (BioLegend, San Diego, CA, USA) to block Fc receptor binding and were resuspended for labelling with antibodies against extracellular markers. The cell surface markers were incubated with cells in Hanks Balanced Salt Solution with 2% Calf Serum, 5 mM sodium azide, and 5 mM 4-(2- hydroxyethyl)-1-piperazineethanesulfonic acid. The surface-labeled cells were fixed and permeabilized by using the BD Cytofix/Cytoperm buffer kit (BD Biosciences, Franklin Lakes, NJ, USA). The cells were further labeled for intracellular cytokine markers. The antibody-labeled cells were then washed in intracellular staining buffer and resuspended in stabilizing fixative (BD Biosciences, Franklin Lakes, NJ, USA). Cell acquisition was performed on the BD LSRFortessa flow cytometer (BD Biosciences, Franklin Lakes, NJ, USA), and data were analyzed by using Cytobank software (Cytobank, Mountain View, CA, USA). The absolute number of the corresponding cell population was calculated as the total number of live cells x % of the corresponding cell population/100.
4.5. Statistical Analysis
Data were analyzed by using GraphPad Prism 9.0 software (San Diego, CA, USA). Comparisons between groups were conducted by using Student’s t-tests. Differences with a p-value of <0.05 were considered statistically significant.
Author Contributions
Conceptualization, M.M.K. and S.G.K.; methodology, M.M.K., S.G.K., Z.A.B. and S.V.R.; software, Z.A.B.; validation, S.G.K., Z.A.B., and J.C.; formal analysis, Z.A.B.; investigation, Z.A.B., M.M.K., C.R. and A.P.; resources, M.M.K.; data curation, Z.A.B.; writing—original draft preparation, Z.A.B. and S.V.R.; writing—review and editing, S.V.R., K.L., W.L., J.C. and M.M.; visualization, S.G.K.; supervision, M.M.K.; project administration, M.M.K.; funding acquisition, M.M.K. All authors have read and agreed to the published version of the manuscript.
Funding
This research received no external funding.
Institutional Review Board Statement
Not applicable.
Informed Consent Statement
Not applicable.
Data Availability Statement
Available from the corresponding author S.G.K. upon reasonable request.
Conflicts of Interest
S.G. Kwatra is an advisory board member/consultant for Abbvie, Aslan Pharmaceuticals, Arcutis Biotherapeutics, Celldex Therapeutics, Galderma, Genzada Pharmaceuticals, Incyte Corporation, Johnson & Johnson, Novartis Pharmaceuticals Corporation, Pfizer, Regeneron Pharmaceuticals, and Sanofi and has served as an investigator for Galderma, Incyte, Pfizer, and Sanofi. All other authors report no conflict of interest.
References
- Trautinger, F.; Eder, J.; Assaf, C.; Bagot, M.; Cozzio, A.; Dummer, R.; Gniadecki, R.; Klemke, C.-D.; Ortiz-Romero, P.L.; Papadavid, E.; et al. European Organisation for Research and Treatment of Cancer consensus recommendations for the treatment of mycosis fungoides/Sézary syndrome–Update 2017. Eur. J. Cancer 2017, 77, 57–74. [Google Scholar] [CrossRef] [PubMed]
- Polgárová, K.; Polívka, J.; Kodet, O.; Klener, P.; Trněný, M. Retrospective Analysis of 118 Patients with Cutaneous T-Cell Lymphomas: A Single-Center Experience. Front. Oncol. 2022, 12, 884091. [Google Scholar] [CrossRef] [PubMed]
- Pulitzer, M. Cutaneous T-cell Lymphoma. Clin. Lab. Med. 2017, 37, 527–546. [Google Scholar] [CrossRef]
- Willemze, R. Mycosis fungoides variants—Clinicopathologic features, differential diagnosis, and treatment. Semin. Cutan. Med. Surg. 2018, 37, 11–17. [Google Scholar] [CrossRef]
- Choi, J.; Sutaria, N.; Roh, Y.S.; Bordeaux, Z.; Sweren, R.J.; Semenov, Y.R.; Kwatra, S.G. Racial and ethnic disparities in inpatient health care utilization for mycosis fungoides: A cross-sectional analysis of the 2012–2017 National Inpatient Sample. J. Am. Acad. Dermatol. 2022, 86, 1408–1410. [Google Scholar] [CrossRef]
- Demierre, M.-F.; Gan, S.; Jones, J.; Miller, D.R. Significant impact of cutaneous T-cell lymphoma on patients’ quality of life: Results of a 2005 National Cutaneous Lymphoma Foundation Survey. Cancer 2006, 107, 2504–2511. [Google Scholar] [CrossRef]
- Ottevanger, R.; van Beugen, S.; Evers, A.W.; Willemze, R.; Vermeer, M.H.; Quint, K.D. Itch in patients with cutaneous T-cell lymphoma as a quality of life indicator. JAAD Int. 2022, 9, 57–64. [Google Scholar] [CrossRef]
- Kaul, S.; Belzberg, M.; Hughes, J.-D.M.; Mahadevan, V.; Khanna, R.; Bakhshi, P.R.; Hong, M.S.; Williams, K.A.; Grossberg, A.L.; Kwatra, S.G.; et al. Comorbidities in Mycosis Fungoides and Racial Differences in Co-Existent Lymphomatoid Papulosis: A Cross-Sectional Study of 580 Patients in an Urban Tertiary Care Center. Medicines 2019, 7, 1. [Google Scholar] [CrossRef]
- Huang, A.H.; Kwatra, S.G.; Khanna, R.; Semenov, Y.R.; Okoye, G.A.; Sweren, R.J. Racial Disparities in the Clinical Presentation and Prognosis of Patients with Mycosis Fungoides. J. Natl. Med. Assoc. 2019, 111, 633–639. [Google Scholar] [CrossRef] [PubMed]
- Willemze, R.; Jaffe, E.S.; Burg, G.; Cerroni, L.; Berti, E.; Swerdlow, S.H.; Ralfkiaer, E.; Chimenti, S.; Diaz-Perez, J.L.; Duncan, L.M.; et al. WHO-EORTC Classification for Cutaneous Lymphomas. Blood 2005, 105, 3768–3785. [Google Scholar] [CrossRef] [PubMed]
- Wilcox, R.A. Cutaneous T-cell lymphoma: 2017 update on diagnosis, risk-stratification, and management. Am. J. Hematol. 2017, 92, 1085–1102. [Google Scholar] [CrossRef]
- Jawed, S.I.; Myskowski, P.L.; Horwitz, S.; Moskowitz, A.; Querfeld, C. Primary cutaneous T-cell lymphoma (mycosis fungoides and Sézary syndrome): Part II. Prognosis, management, and future directions. J. Am. Acad. Dermatol. 2014, 70, 223.e1–223.e17. [Google Scholar] [CrossRef]
- McGuire, C.; Lee, J. Brief Review of Vorinostat. Clin. Med. Insights Ther. 2010, 2, CMT.S1102–87. [Google Scholar] [CrossRef]
- Wozniak, M.B.; Villuendas, R.; Bischoff, J.R.; Aparicio, C.B.; Martínez Leal, J.F.; de La Cueva, P.; Rodriguez, M.E.; Herreros, B.; Martin-Perez, D.; Longo, M.I.; et al. Vorinostat interferes with the signaling transduction pathway of T-cell receptor and synergizes with phosphoinositide-3 kinase inhibitors in cutaneous T-cell lymphoma. Haematologica 2010, 95, 613–621. [Google Scholar] [CrossRef] [PubMed]
- Al-Yacoub, N.; Fecker, L.F.; Möbs, M.; Plötz, M.; Braun, F.K.; Sterry, W.; Eberle, J. Apoptosis Induction by SAHA in Cutaneous T-Cell Lymphoma Cells Is Related to Downregulation of c-FLIP and Enhanced TRAIL Signaling. J. Investig. Dermatol. 2012, 132, 2263–2274. [Google Scholar] [CrossRef]
- Karpova, M.B.; Gunz, D.; Okoniewski, M.J.; Cozzio, A.; Schad, K.; Conzett, K.B.; Dummer, R. Transcriptome adaptation caused by vorinostat/bexarotene combination therapy in advanced cutaneous T-cell lymphoma. J. Clin. Oncol. 2010, 28, 8050. [Google Scholar] [CrossRef]
- Liu, J.-N.; Kong, X.-S.; Huang, T.; Wang, R.; Li, W.; Chen, Q.-F. Clinical Implications of Aberrant PD-1 and CTLA4 Expression for Cancer Immunity and Prognosis: A Pan-Cancer Study. Front. Immunol. 2020, 11, 2048. [Google Scholar] [CrossRef]
- Chambers, C.A.; Krummel, M.E.; Boitel, B.; Hurwitz, A.; Sullivan, T.J.; Fournier, S.; Cassell, D.; Brunner, M.; Allison, J.P. The Role of CTLA-4 in the Regulation and Initiation of T-Cell Responses. Immunol. Rev. 1996, 153, 27–46. [Google Scholar] [CrossRef] [PubMed]
- Wong, H.; Wilson, A.J.; Gibson, H.; Hafner, M.S.; Hedgcock, C.J.; Berger, C.L.; Edelson, R.L.; Lim, H.W. Increased Expression of CTLA-4 in Malignant T Cells from Patients with Mycosis Fungoides–Cutaneous T-Cell Lymphoma. J. Investig. Dermatol. 2006, 126, 212–219. [Google Scholar] [CrossRef]
- Duvic, M.; Talpur, R.; Ni, X.; Zhang, C.; Hazarika, P.; Kelly, C.; Chiao, J.H.; Reilly, J.F.; Ricker, J.L.; Richon, V.M.; et al. Phase 2 trial of oral vorinostat (suberoylanilide hydroxamic acid, SAHA) for refractory cutaneous T-cell lymphoma (CTCL). Blood 2007, 109, 31–39. [Google Scholar] [CrossRef] [PubMed]
- Duvic, M.; Dimopoulos, M. The safety profile of vorinostat (suberoylanilide hydroxamic acid) in hematologic malignancies: A review of clinical studies. Cancer Treat. Rev. 2015, 43, 58–66. [Google Scholar] [CrossRef] [PubMed]
- Buchbinder, E.I.; Desai, A. CTLA-4 and PD-1 Pathways: Similarities, Differences, and Implications of Their Inhibition. Am. J. Clin. Oncol. 2016, 39, 98–106. [Google Scholar] [CrossRef] [PubMed]
- Maj, J.; Jankowska-Konsur, A.M.; Hałoń, A.; Woźniak, Z.; Plomer-Niezgoda, E.; Reich, A. Expression of CXCR4 and CXCL12 and their correlations to the cell proliferation and angiogenesis in mycosis fungoides. Adv. Dermatol. Allergol. 2015, 32, 437–442. [Google Scholar] [CrossRef] [PubMed]
- Smith, M.C.P.; Luker, K.E.; Garbow, J.R.; Prior, J.L.; Jackson, E.; Piwnica-Worms, D.; Luker, G.D. CXCR4 Regulates Growth of Both Primary and Metastatic Breast Cancer. Cancer Res. 2004, 64, 8604–8612. [Google Scholar] [CrossRef]
- Orimo, A.; Gupta, P.B.; Sgroi, D.C.; Arenzana-Seisdedos, F.; Delaunay, T.; Naeem, R.; Carey, V.J.; Richardson, A.L.; Weinberg, R.A. Stromal fibroblasts present in invasive human breast carcinomas promote tumor growth and angiogenesis through elevated SDF-1/CXCL12 secretion. Cell 2005, 121, 335–348. [Google Scholar] [CrossRef]
- Müller, A.; Homey, B.; Soto, H.; Ge, N.; Catron, D.; Buchanan, M.E.; McClanahan, T.; Murphy, E.; Yuan, W.; Wagner, S.N.; et al. Involvement of chemokine receptors in breast cancer metastasis. Nature 2001, 410, 50–56. [Google Scholar] [CrossRef] [PubMed]
- Zeelenberg, I.S.; Ruuls-Van Stalle, L.; Roos, E. The chemokine receptor CXCR4 is required for outgrowth of colon carcinoma micrometastases. Cancer Res. 2003, 63, 3833–3839. [Google Scholar]
- Gangadhar, T.; Nandi, S.; Salgia, R. The role of chemokine receptor CXCR4 in lung cancer. Cancer Biol. Ther. 2010, 9, 409–416. [Google Scholar] [CrossRef]
- Saur, D.; Seidler, B.; Schneider, G.; Algül, H.; Beck, R.; Senekowitsch–Schmidtke, R.; Schwaiger, M.; Schmid, R.M. CXCR4 Expression Increases Liver and Lung Metastasis in a Mouse Model of Pancreatic Cancer. Gastroenterology 2005, 129, 1237–1250. [Google Scholar] [CrossRef]
- Wu, X.-S.; Lonsdorf, A.S.; Hwang, S.T. Cutaneous T-Cell Lymphoma: Roles for Chemokines and Chemokine Receptors. J. Investig. Dermatol. 2009, 129, 1115–1119. [Google Scholar] [CrossRef]
- Narducci, M.G.; Scala, E.; Bresin, A.; Caprini, E.; Picchio, M.C.; Remotti, D.; Ragone, G.; Nasorri, F.; Frontani, M.; Arcelli, D.; et al. Skin homing of Sézary cells involves SDF-1-CXCR4 signaling and down-regulation of CD26/dipeptidylpeptidase IV. Blood 2006, 107, 1108–1115. [Google Scholar] [CrossRef] [PubMed]
- Cuesta-Mateos, C.; Terrón, F.; Herling, M. CCR7 in Blood Cancers–Review of Its Pathophysiological Roles and the Potential as a Therapeutic Target. Front. Oncol. 2021, 11, 736758. [Google Scholar] [CrossRef]
- Hu, S.C.-S.; Lin, C.-L.; Hong, C.-H.; Yu, H.-S.; Chen, G.-S.; Lee, C.-H. CCR7 expression correlates with subcutaneous involvement in mycosis fungoides skin lesions and promotes migration of mycosis fungoides cells (MyLa) through mTOR activation. J. Dermatol. Sci. 2014, 74, 31–38. [Google Scholar] [CrossRef] [PubMed]
- Honda, Y.; Otsuka, A.; Nonomura, Y.; Kaku, Y.; Dainichi, T.; Miyachi, Y.; Kabashima, K. CCR5 and CXCR3 expression in a case of subcutaneous panniculitis-like T-cell lymphoma. J. Eur. Acad. Dermatol. Venereol. 2015, 30, 1413–1415. [Google Scholar] [CrossRef] [PubMed]
- Kitayama, N.; Otsuka, A.; Honda, Y.; Matsumura, Y.; Honda, T.; Kabashima, K. CCR4 and CCR5 expression in a case of subcutaneous panniculitis-like T-cell lymphoma. Eur. J. Dermatol. 2017, 27, 414–415. [Google Scholar] [CrossRef]
- Xia, M.; Hu, S.; Fu, Y.; Jin, W.; Yi, Q.; Matsui, Y.; Yang, J.; McDowell, M.A.; Sarkar, S.; Kalia, V.; et al. CCR10 regulates balanced maintenance and function of resident regulatory and effector T cells to promote immune homeostasis in the skin. J. Allergy Clin. Immunol. 2014, 134, 634–644. [Google Scholar] [CrossRef]
- Fujita, Y.; Abe, R.; Sasaki, M.; Honda, A.; Furuichi, M.; Asano, Y.; Norisugi, O.; Shimizu, T.; Shimizu, H. Presence of Circulating CCR10+ T cells and Elevated Serum CTACK/CCL27 in the Early Stage of Mycosis Fungoides. Clin. Cancer Res. 2006, 12, 2670–2675. [Google Scholar] [CrossRef]
- Ohue, Y.; Nishikawa, H. Regulatory T (Treg) cells in cancer: Can Treg cells be a new therapeutic target? Cancer Sci. 2019, 110, 2080–2089. [Google Scholar] [CrossRef]
- Reschke, R.; Yu, J.; Flood, B.A.; Higgs, E.F.; Hatogai, K.; Gajewski, T.F. Immune cell and tumor cell-derived CXCL10 is indicative of immunotherapy response in metastatic melanoma. J. Immunother. Cancer 2021, 9, e003521. [Google Scholar] [CrossRef]
- Chong, B.F.; Wilson, A.J.; Gibson, H.M.; Hafner, M.S.; Luo, Y.; Hedgcock, C.J.; Wong, H.K. Immune Function Abnormalities in Peripheral Blood Mononuclear Cell Cytokine Expression Differentiates Stages of Cutaneous T-Cell Lymphoma/Mycosis Fungoides. Clin. Cancer Res. 2008, 14, 646–653. [Google Scholar] [CrossRef]
- Sugaya, M.; Tokura, Y.; Hamada, T.; Tsuboi, R.; Moroi, Y.; Nakahara, T.; Amano, M.; Ishida, S.; Watanabe, D.; Tani, M.; et al. Phase II study of i.v. interferon-gamma in Japanese patients with mycosis fungoides. J. Dermatol. 2014, 41, 50–56. [Google Scholar] [CrossRef] [PubMed]
- Doherty, S.D.; Ni, X.; Doherty, C.B.; Jones, D.; Zhao, X.; Owen, L.B.; Duvic, M. Abnormal expression of interleukin-23 in mycosis fungoides/Sézary syndrome lesions. Arch. Dermatol. Res. 2006, 298, 353–356. [Google Scholar] [CrossRef]
- Mihara, M.; Hashizume, M.; Yoshida, H.; Suzuki, M.; Shiina, M. IL-6/IL-6 receptor system and its role in physiological and pathological conditions. Clin. Sci. 2011, 122, 143–159. [Google Scholar] [CrossRef]
- Stolearenco, V.; Namini, M.R.J.; Hasselager, S.S.; Gluud, M.; Buus, T.B.; Willerslev-Olsen, A.; Ødum, N.; Krejsgaard, T. Cellular Interactions and Inflammation in the Pathogenesis of Cutaneous T-Cell Lymphoma. Front. Cell Dev. Biol. 2020, 8, 851. [Google Scholar] [CrossRef]
- Hong, C.; Luckey, M.A.; Park, J.-H. Intrathymic IL-7: The where, when, and why of IL-7 signaling during T cell development. Semin. Immunol. 2012, 24, 151–158. [Google Scholar] [CrossRef]
- Nielsen, M.; Kæstel, C.; Eriksen, K.; Woetmann, A.; Stokkedal, T.; Kaltoft, K.; Geisler, C.; Röpke, C.; Ødum, N. Inhibition of constitutively activated Stat3 correlates with altered Bcl-2/Bax expression and induction of apoptosis in mycosis fungoides tumor cells. Leukemia 1999, 13, 735–738. [Google Scholar] [CrossRef] [PubMed]
- van Kester, M.S.; Out-Luiting, J.J.; von dem Borne, P.A.; Willemze, R.; Tensen, C.P.; Vermeer, M.H. Cucurbitacin I Inhibits Stat3 and Induces Apoptosis in Sézary Cells. J. Investig. Dermatol. 2008, 128, 1691–1695. [Google Scholar] [CrossRef]
- Eriksen, K.W.; Kaltoft, K.; Mikkelsen, G.; Nielsen, M.H.; Zhang, Q.; Geisler, C.; Nissen, M.; Röpke, C.; Wasik, M.K.; Ødum, N. Constitutive STAT3-Activation in Sezary Syndrome: Tyrphostin AG490 Inhibits STAT3-Activation, Interleukin-2 Receptor Expression and Growth of Leukemic Sezary Cells. Leukemia 2001, 15, 787–793. [Google Scholar] [CrossRef]
- Willerslev-Olsen, A.; Litvinov, I.; Fredholm, S.; Petersen, D.L.; Sibbesen, N.A.; Gniadecki, R.; Zhang, Q.; Bonefeld, C.M.; Wasik, M.A.; Geisler, C.; et al. IL-15 and IL-17F are differentially regulated and expressed in mycosis fungoides (MF). Cell Cycle 2014, 13, 1306–1312. [Google Scholar] [CrossRef] [PubMed]
- Mishra, A.; La Perle, K.; Kwiatkowski, S.; Sullivan, L.A.; Sams, G.H.; Johns, J.; Curphey, D.P.; Wen, J.; McConnell, K.; Qi, J.; et al. Mechanism, Consequences, and Therapeutic Targeting of Abnormal IL15 Signaling in Cutaneous T-cell Lymphoma. Cancer Discov. 2016, 6, 986–1005. [Google Scholar] [CrossRef] [PubMed]
- Monin, L.; Gaffen, S.L. Interleukin 17 Family Cytokines: Signaling Mechanisms, Biological Activities, and Therapeutic Implications. Cold Spring Harb. Perspect. Biol. 2018, 10, a028522. [Google Scholar] [CrossRef] [PubMed]
- Krejsgaard, T.; Litvinov, I.V.; Wang, Y.; Xia, L.; Willerslev-Olsen, A.; Koralov, S.B.; Kopp, K.L.; Bonefeld, C.M.; Wasik, M.A.; Geisler, C.; et al. Elucidating the role of interleukin-17F in cutaneous T-cell lymphoma. Blood 2013, 122, 943–950. [Google Scholar] [CrossRef] [PubMed]
- Song, X.; Qian, Y. The activation and regulation of IL-17 receptor mediated signaling. Cytokine 2013, 62, 175–182. [Google Scholar] [CrossRef] [PubMed]
- Lauenborg, B.; Litvinov, I.V.; Zhou, Y.; Willerslev-Olsen, A.; Bonefeld, C.M.; Nastasi, C.; Fredholm, S.; Lindahl, L.M.; Sasseville, D.; Geisler, C.; et al. Malignant T cells activate endothelial cells via IL-17 F. Blood Cancer J. 2017, 7, e586. [Google Scholar] [CrossRef]
- Gill, R.P.K.; Gantchev, J.; Villarreal, A.M.; Ramchatesingh, B.; Netchiporouk, E.; Akilov, O.E.; Ødum, N.; Gniadecki, R.; Koralov, S.B.; Litvinov, I.V. Understanding Cell Lines, Patient-Derived Xenograft and Genetically Engineered Mouse Models Used to Study Cutaneous T-Cell Lymphoma. Cells 2022, 11, 593. [Google Scholar] [CrossRef]
- Olsen, E.A.; Kim, Y.H.; Kuzel, T.M.; Pacheco, T.R.; Foss, F.M.; Parker, S.; Frankel, S.R.; Chen, C.; Ricker, J.L.; Arduino, J.M.; et al. Phase IIB Multicenter Trial of Vorinostat in Patients with Persistent, Progressive, or Treatment Refractory Cutaneous T-Cell Lymphoma. J. Clin. Oncol. 2007, 25, 3109–3115. [Google Scholar] [CrossRef]
- Kersey, P.J.; Staines, D.; Lawson, D.; Kulesha, E.; Derwent, P.; Humphrey, J.C.; Hughes, D.S.T.; Keenan, S.; Kerhornou, A.; Koscielny, G.; et al. Ensembl Genomes: An integrative resource for genome-scale data from non-vertebrate species. Nucleic Acids Res. 2011, 40, D91–D97. [Google Scholar] [CrossRef] [PubMed]
- Dobin, A.; Davis, C.A.; Schlesinger, F.; Drenkow, J.; Zaleski, C.; Jha, S.; Batut, P.; Chaisson, M.; Gingeras, T.R. STAR: Ultrafast universal RNA-seq aligner. Bioinformatics 2013, 29, 15–21. [Google Scholar] [CrossRef] [PubMed]
- Putri, G.H.; Anders, S.; Pyl, P.T.; Pimanda, J.E.; Zanini, F. Analysing high-throughput sequencing data in Python with HTseq 2.0. Bioinfor. 2022, 38, 2943–2945. [Google Scholar] [CrossRef] [PubMed]
- Love, M.I.; Huber, W.; Anders, S. Moderated estimation of fold change and dispersion for RNA-seq data with DESeq2. Genome Biol. 2014, 15, 550. [Google Scholar] [CrossRef]
- Huber, W.; Carey, V.J.; Gentleman, R.; Anders, S.; Carlson, M.; Carvalho, B.S.; Bravo, H.C.; Davis, S.; Gatto, L.; Girke, T.; et al. Orchestrating high-throughput genomic analysis with Bioconductor. Nat. Methods 2015, 12, 115–121. [Google Scholar] [CrossRef] [PubMed]
- Mootha, V.K.; Lindgren, C.M.; Eriksson, K.-F.; Subramanian, A.; Sihag, S.; Lehar, J.; Puigserver, P.; Carlsson, E.; Ridderstråle, M.; Laurila, E.; et al. PGC-1α-responsive genes involved in oxidative phosphorylation are coordinately downregulated in human diabetes. Nat. Genet. 2003, 34, 267–273. [Google Scholar] [CrossRef]
- Subramanian, A.; Tamayo, P.; Mootha, V.K.; Mukherjee, S.; Ebert, B.L.; Gillette, M.A.; Paulovich, A.; Pomeroy, S.L.; Golub, T.R.; Lander, E.S.; et al. Gene set enrichment analysis: A knowledge-based approach for interpreting genome-wide expression profiles. Proc. Natl. Acad. Sci. USA 2005, 102, 15545–15550. [Google Scholar] [CrossRef]
- Hänzelmann, S.; Castelo, R.; Guinney, J. GSVA: Gene set variation analysis for microarray and RNA-Seq data. BMC Bioinform. 2013, 14, 7. [Google Scholar] [CrossRef]
- Kuleshov, M.V.; Jones, M.R.; Rouillard, A.D.; Fernandez, N.F.; Duan, Q.; Wang, Z.; Koplev, S.; Jenkins, S.L.; Jagodnik, K.M.; Lachmann, A.; et al. Enrichr: A comprehensive gene set enrichment analysis web server 2016 update. Nucleic Acids Res. 2016, 44, W90–W97. [Google Scholar] [CrossRef] [PubMed]
- Chen, E.Y.; Tan, C.M.; Kou, Y.; Duan, Q.; Wang, Z.; Meirelles, G.V.; Clark, N.R.; Ma’Ayan, A. Enrichr: Interactive and collaborative HTML5 gene list enrichment analysis tool. BMC Bioinform. 2013, 14, 128. [Google Scholar] [CrossRef] [PubMed]
- Xie, Z.; Bailey, A.; Kuleshov, M.V.; Clarke, D.J.B.; Evangelista, J.E.; Jenkins, S.L.; Lachmann, A.; Wojciechowicz, M.L.; Kropiwnicki, E.; Jagodnik, K.M.; et al. Gene Set Knowledge Discovery with Enrichr. Curr. Protoc. 2021, 1, e90. [Google Scholar] [CrossRef]
Disclaimer/Publisher’s Note: The statements, opinions and data contained in all publications are solely those of the individual author(s) and contributor(s) and not of MDPI and/or the editor(s). MDPI and/or the editor(s) disclaim responsibility for any injury to people or property resulting from any ideas, methods, instructions or products referred to in the content. |
© 2023 by the authors. Licensee MDPI, Basel, Switzerland. This article is an open access article distributed under the terms and conditions of the Creative Commons Attribution (CC BY) license (https://creativecommons.org/licenses/by/4.0/).