
An In Vitro Approach to Model EMT in Breast Cancer

 ,
, 
Abstract
1. Introduction
2. Results
2.1. EMT Status
2.1.1. EMT Marker
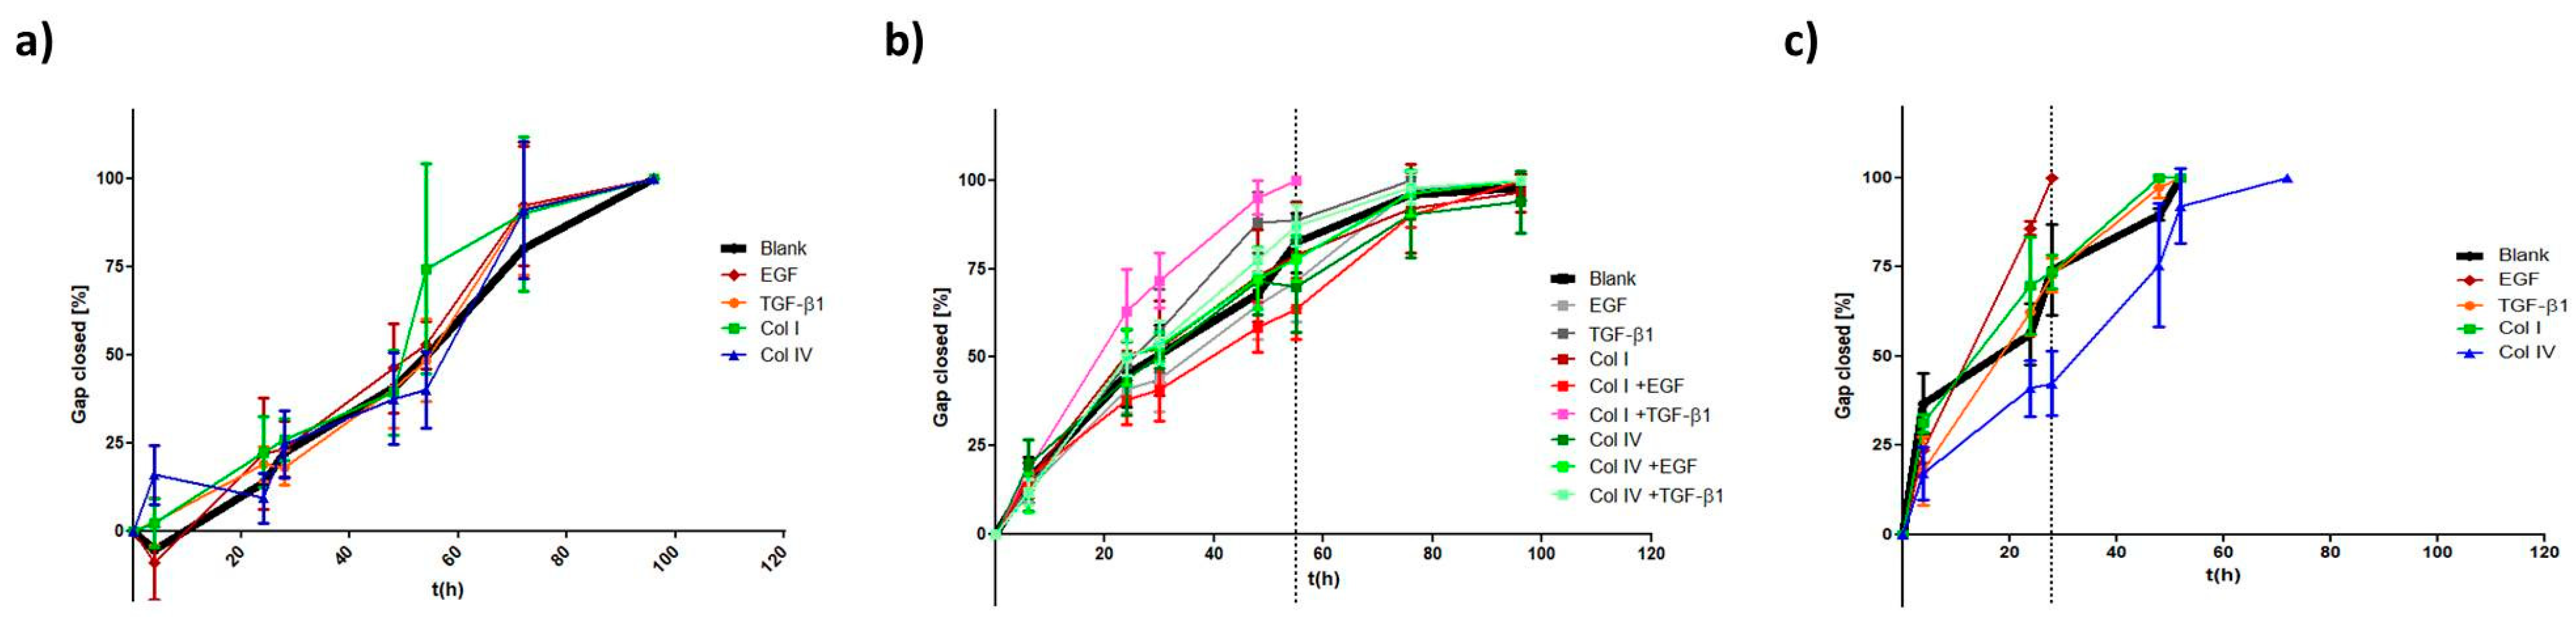
2.1.2. Migration
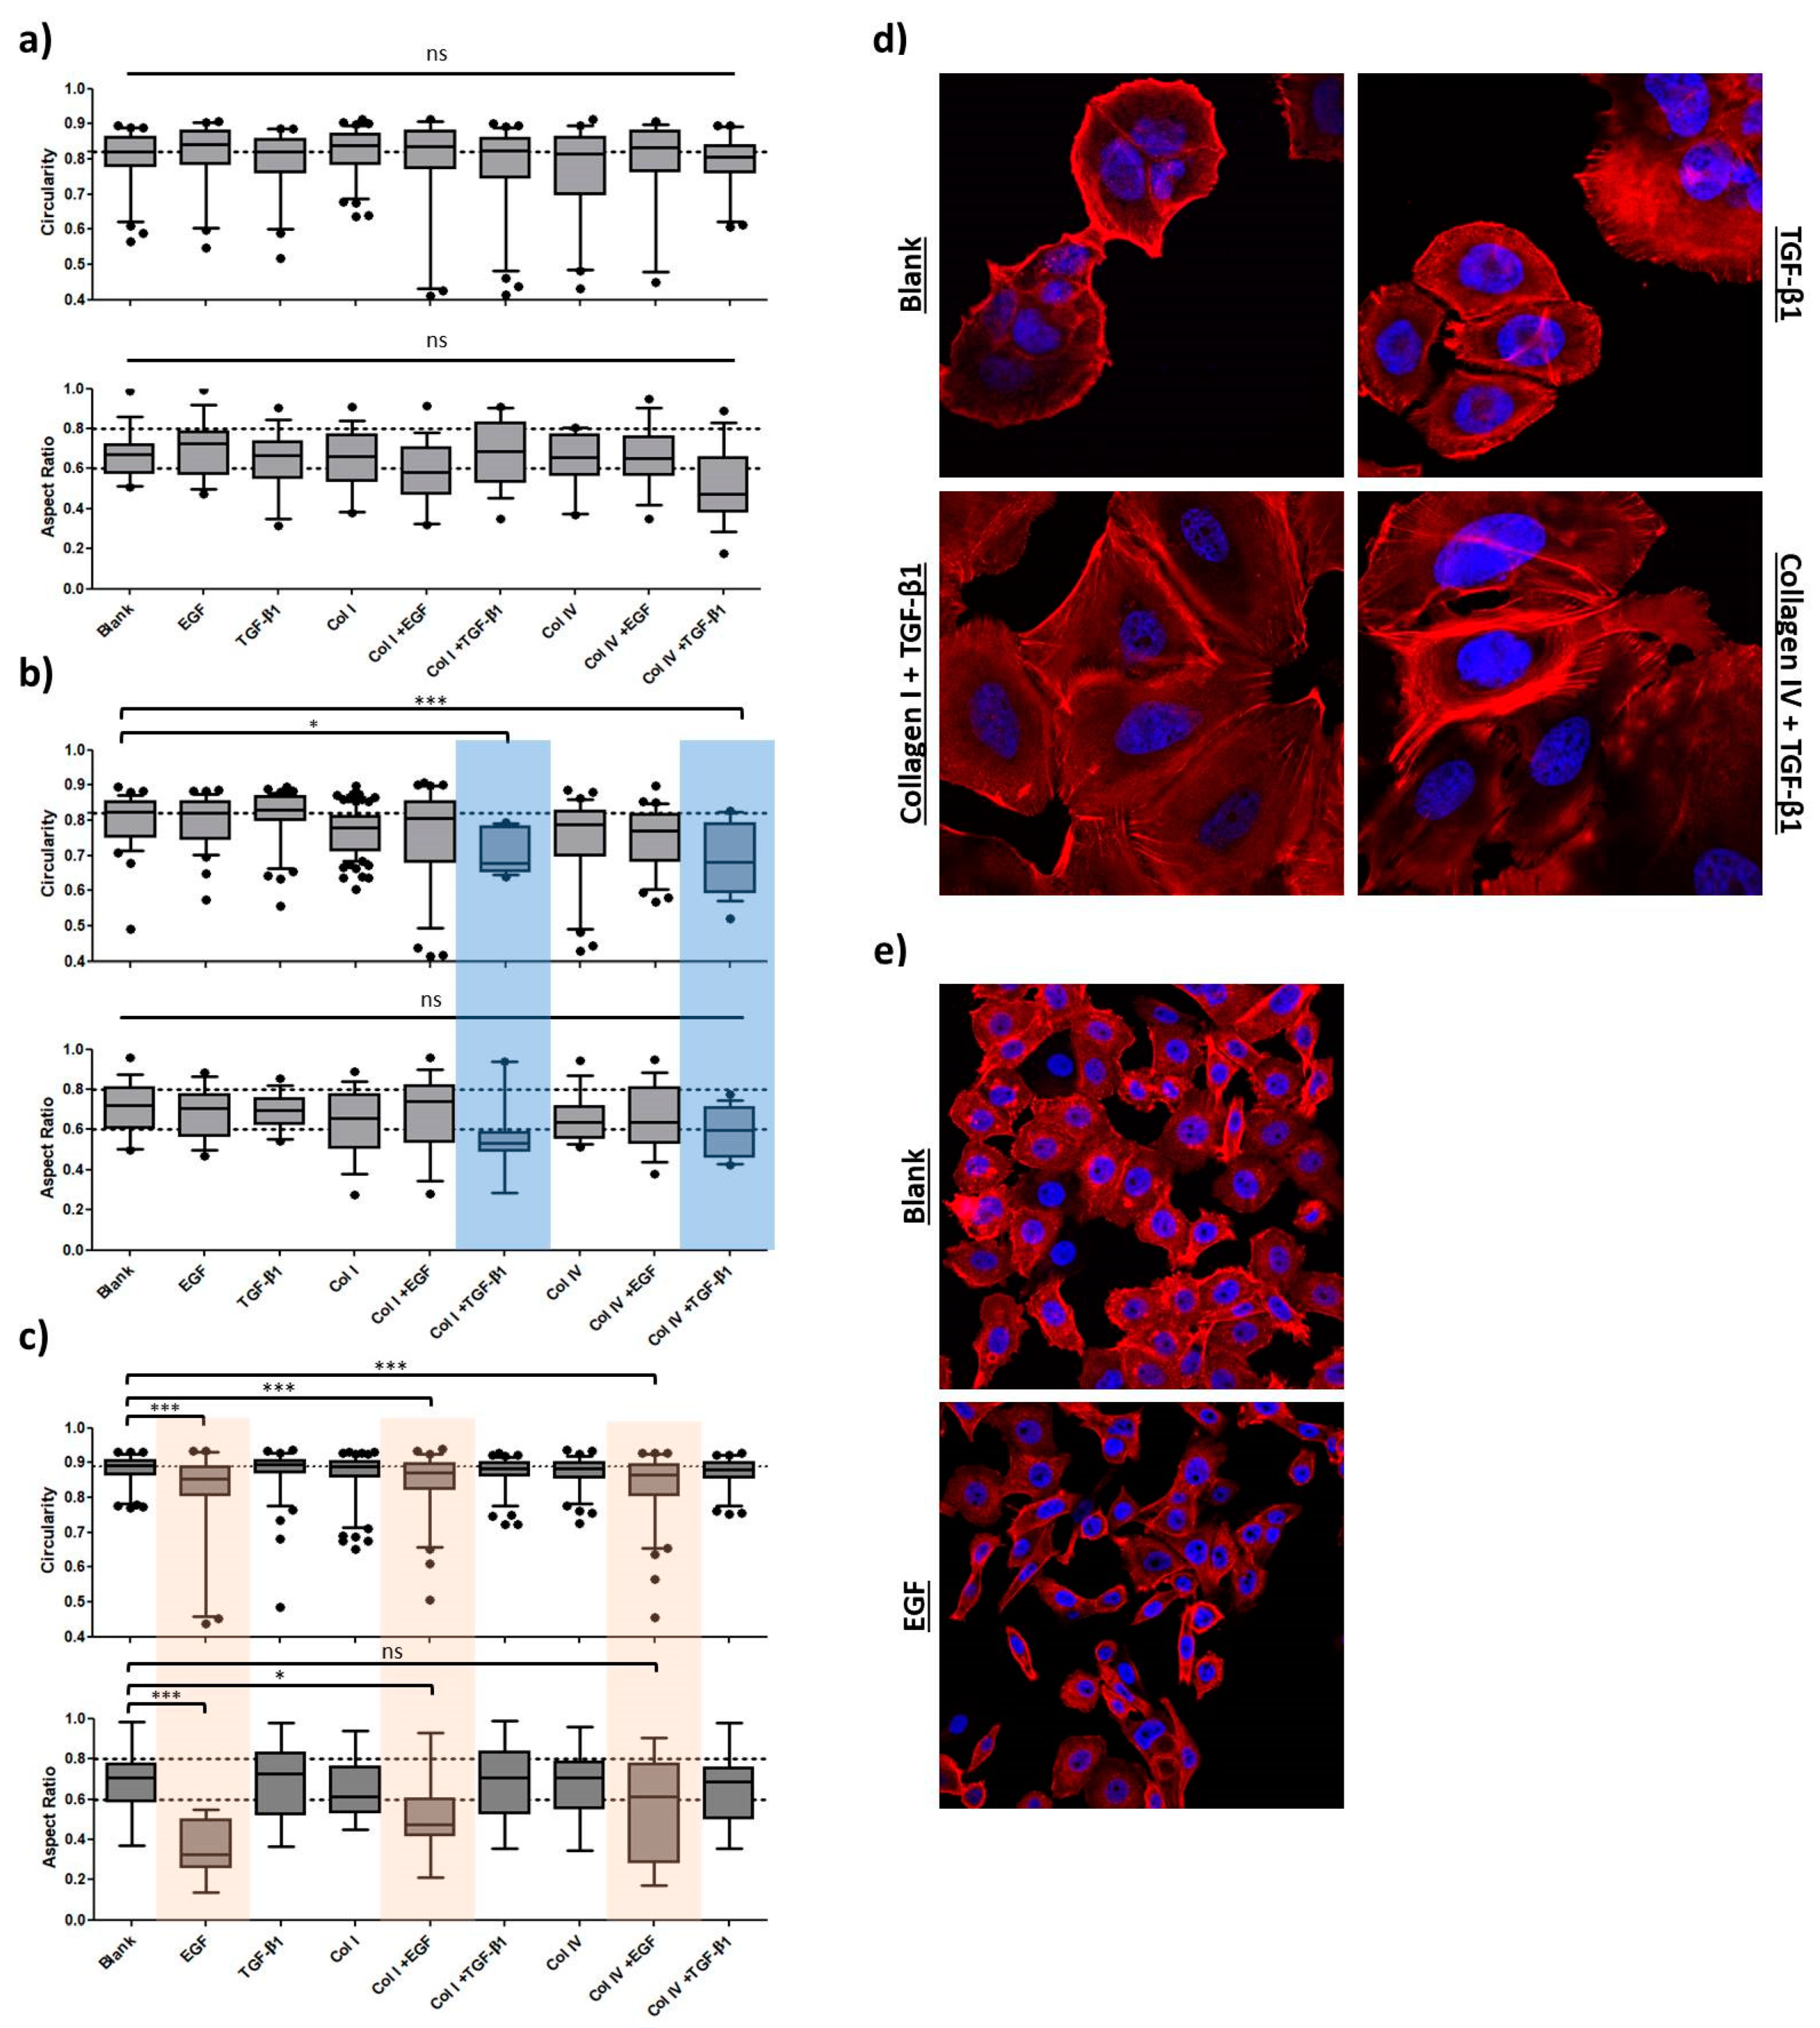
2.1.3. Morphology
2.2. EMT Induction
2.2.1. EMT Marker
2.2.2. Morphology
2.2.3. Migration
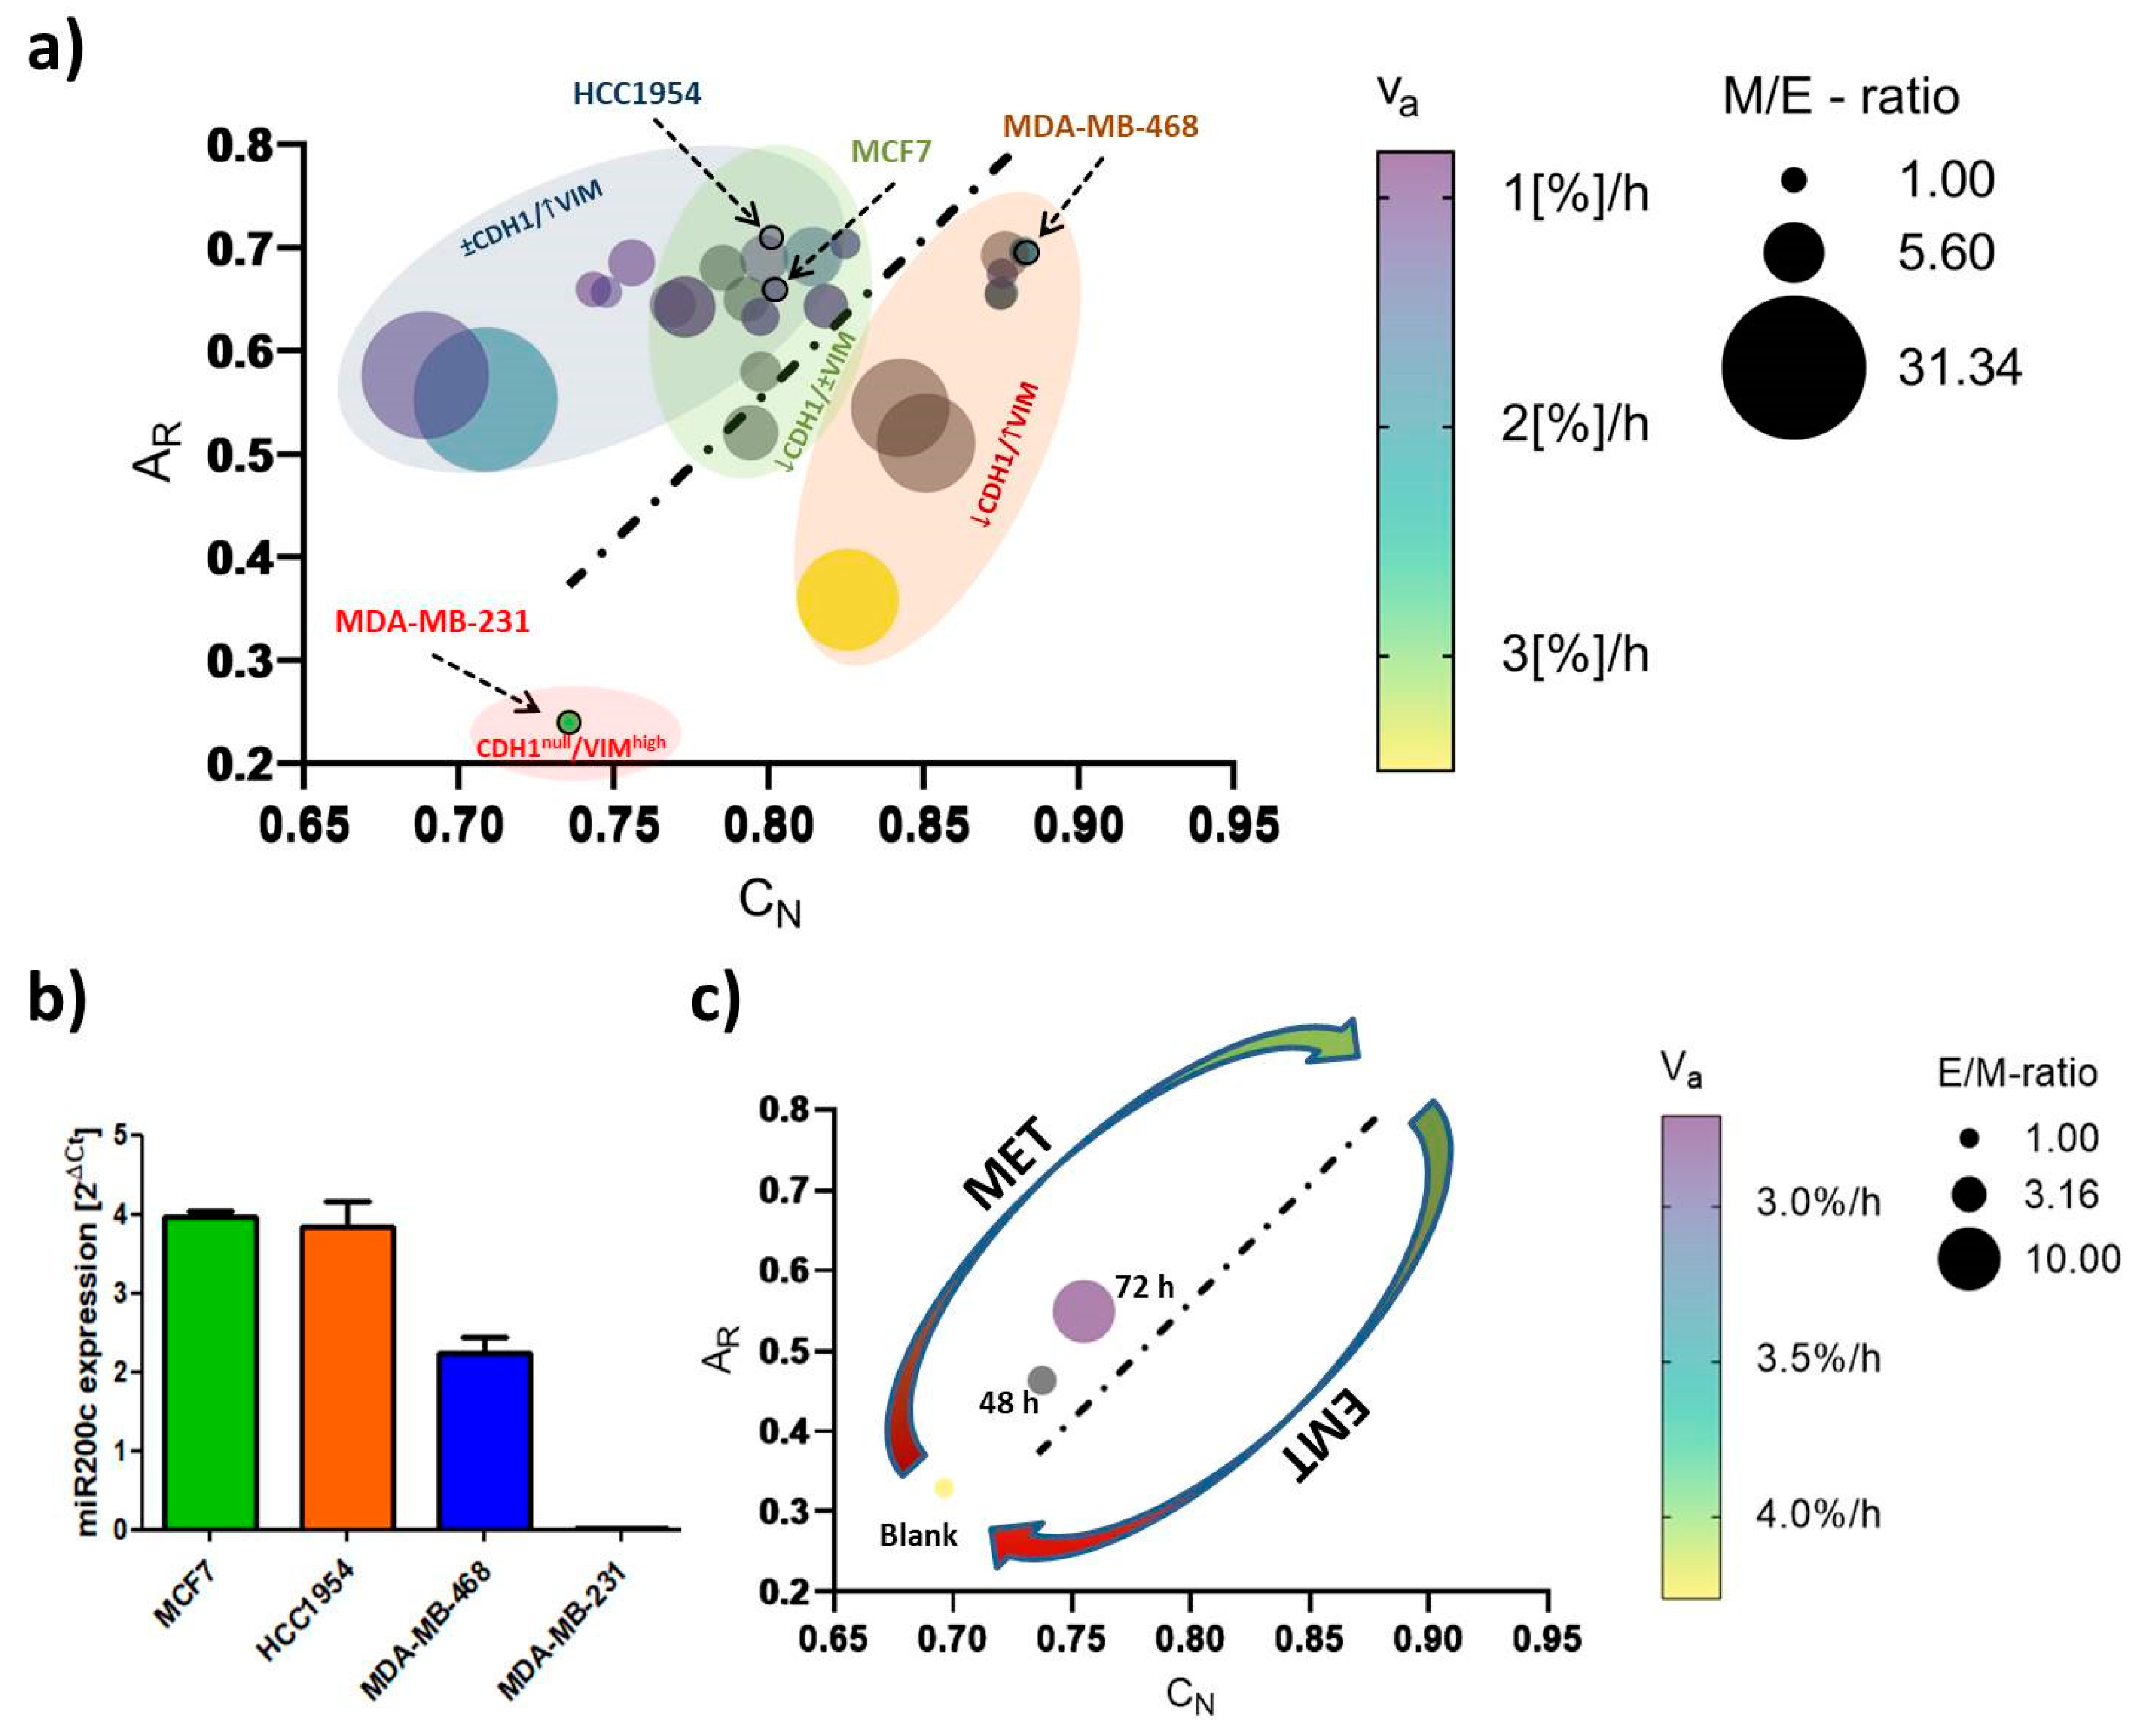
2.3. EMT-Phenotyping Model and Its Application
3. Discussion
4. Materials and Methods
5. Conclusions
Supplementary Materials
Author Contributions
Funding
Data Availability Statement
Acknowledgments
Conflicts of Interest
References
- Cano, A.; Pérez-Moreno, M.A.; Rodrigo, I.; Locascio, A.; Blanco, M.J.; del Barrio, M.G.; Portillo, F.; Nieto, M.A. The transcription factor snail controls epithelial–mesenchymal transitions by repressing e-cadherin expression. Nat. Cell Biol. 2000, 2, 76–83. [Google Scholar] [CrossRef] [PubMed]
- Thiery, J.P. Epithelial-mesenchymal transitions in tumour progression. Nat. Rev. Cancer 2002, 2, 442–454. [Google Scholar] [CrossRef]
- Yang, J.; Antin, P.; Berx, G.; Blanpain, C.; Brabletz, T.; Bronner, M.; Campbell, K.; Cano, A.; Casanova, J.; Christofori, G.; et al. Guidelines and definitions for research on epithelial–mesenchymal transition. Nat. Rev. Mol. Cell Biol. 2020, 21, 341–352. [Google Scholar] [CrossRef] [PubMed]
- Brabletz, T.; Kalluri, R.; Nieto, M.A.; Weinberg, R.A. Emt in cancer. Nat. Rev. Cancer 2018, 18, 128–134. [Google Scholar] [CrossRef]
- Banyard, J.; Bielenberg, D.R. The role of emt and met in cancer dissemination. Connect. Tissue Res. 2015, 56, 403–413. [Google Scholar] [CrossRef] [PubMed]
- Conklin, M.W.; Keely, P.J. Why the stroma matters in breast cancer: Insights into breast cancer patient outcomes through the examination of stromal biomarkers. Cell Adhes. Migr. 2012, 6, 249–260. [Google Scholar] [CrossRef]
- Son, H.; Moon, A. Epithelial-mesenchymal transition and cell invasion. Toxicol. Res. 2010, 26, 245–252. [Google Scholar] [CrossRef]
- Kalluri, R.; Weinberg, R.A. The basics of epithelial-mesenchymal transition. J. Clin. Investig. 2009, 119, 1420–1428. [Google Scholar] [CrossRef]
- Tam, W.L.; Weinberg, R.A. The epigenetics of epithelial-mesenchymal plasticity in cancer. Nat. Med. 2013, 19, 1438. [Google Scholar] [CrossRef]
- Weinberg, R.A. The Biology of Cancer; Garland Science: New York, NY, USA, 2014. [Google Scholar]
- Tan, T.Z.; Miow, Q.H.; Miki, Y.; Noda, T.; Mori, S.; Huang, R.Y.; Thiery, J.P. Epithelial-mesenchymal transition spectrum quantification and its efficacy in deciphering survival and drug responses of cancer patients. EMBO Mol. Med. 2014, 6, 1279–1293. [Google Scholar] [CrossRef]
- Vasaikar, S.V.; Deshmukh, A.P.; den Hollander, P.; Addanki, S.; Kuburich, N.A.; Kudaravalli, S.; Joseph, R.; Chang, J.T.; Soundararajan, R.; Mani, S.A. Emtome: A resource for pan-cancer analysis of epithelial-mesenchymal transition genes and signatures. Br. J. Cancer 2021, 124, 259–269. [Google Scholar] [CrossRef]
- Taube, J.H.; Herschkowitz, J.I.; Komurov, K.; Zhou, A.Y.; Gupta, S.; Yang, J.; Hartwell, K.; Onder, T.T.; Gupta, P.B.; Evans, K.W.; et al. Core epithelial-to-mesenchymal transition interactome gene-expression signature is associated with claudin-low and metaplastic breast cancer subtypes. Proc. Natl. Acad. Sci. USA 2010, 107, 15449–15454. [Google Scholar] [CrossRef] [PubMed]
- Bhowmik, S.K.; Ramirez-Peña, E.; Arnold, J.M.; Putluri, V.; Sphyris, N.; Michailidis, G.; Putluri, N.; Ambs, S.; Sreekumar, A.; Mani, S.A. Emt-induced metabolite signature identifies poor clinical outcome. Oncotarget 2015, 6, 42651–42660. [Google Scholar] [CrossRef] [PubMed]
- Prat, A.; Perou, C.M. Deconstructing the molecular portraits of breast cancer. Mol. Oncol. 2011, 5, 5–23. [Google Scholar] [CrossRef] [PubMed]
- Scimeca, M.; Antonacci, C.; Colombo, D.; Bonfiglio, R.; Buonomo, O.C.; Bonanno, E. Emerging prognostic markers related to mesenchymal characteristics of poorly differentiated breast cancers. Tumour Biol. 2016, 37, 5427–5435. [Google Scholar] [CrossRef] [PubMed]
- Bao, T.; Davidson, N.E. Gene expression profiling of breast cancer. Adv. Surg. 2008, 42, 249–260. [Google Scholar] [CrossRef]
- Arpino, G.; Generali, D.; Sapino, A.; Del Matro, L.; Frassoldati, A.; de Laurentis, M.; Pronzato, P.; Mustacchi, G.; Cazzaniga, M.; De Placido, S.; et al. Gene expression profiling in breast cancer: A clinical perspective. Breast 2013, 22, 109–120. [Google Scholar] [CrossRef] [PubMed]
- Yin, L.; Duan, J.-J.; Bian, X.-W.; Yu, S.-c. Triple-negative breast cancer molecular subtyping and treatment progress. Breast Cancer Res. 2020, 22, 61. [Google Scholar] [CrossRef]
- Sorlie, T.; Tibshirani, R.; Parker, J.; Hastie, T.; Marron, J.S.; Nobel, A.; Deng, S.; Johnsen, H.; Pesich, R.; Geisler, S.; et al. Repeated observation of breast tumor subtypes in independent gene expression data sets. Proc. Natl. Acad. Sci. USA 2003, 100, 8418–8423. [Google Scholar] [CrossRef]
- O’Meara, T.A.; Tolaney, S.M. Tumor mutational burden as a predictor of immunotherapy response in breast cancer. Oncotarget 2021, 12, 394–400. [Google Scholar] [CrossRef]
- Alluri, P.; Newman, L.A. Basal-like and triple-negative breast cancers: Searching for positives among many negatives. Surg. Oncol. Clin. N. Am. 2014, 23, 567–577. [Google Scholar] [CrossRef]
- Sarrió, D.; Rodriguez-Pinilla, S.M.; Hardisson, D.; Cano, A.; Moreno-Bueno, G.; Palacios, J. Epithelial-mesenchymal transition in breast cancer relates to the basal-like phenotype. Cancer Res. 2008, 68, 989–997. [Google Scholar] [CrossRef]
- Koleckova, M.; Ehrmann, J.; Bouchal, J.; Janikova, M.; Brisudova, A.; Srovnal, J.; Staffova, K.; Svoboda, M.; Slaby, O.; Radova, L.; et al. Epithelial to mesenchymal transition and microrna expression are associated with spindle and apocrine cell morphology in triple-negative breast cancer. Sci. Rep. 2021, 11, 5145. [Google Scholar] [CrossRef] [PubMed]
- Zeng, Q.; Li, W.; Lu, D.; Wu, Z.; Duan, H.; Luo, Y.; Feng, J.; Yang, D.; Fu, L.; Yan, X. Cd146, an epithelial-mesenchymal transition inducer, is associated with triple-negative breast cancer. Proc. Natl. Acad. Sci. USA 2012, 109, 1127–1132. [Google Scholar] [CrossRef] [PubMed]
- Christiansen, J.J.; Rajasekaran, A.K. Reassessing epithelial to mesenchymal transition as a prerequisite for carcinoma invasion and metastasis. Cancer Res. 2006, 66, 8319–8326. [Google Scholar] [CrossRef] [PubMed]
- Yilmaz, M.; Christofori, G. Emt, the cytoskeleton, and cancer cell invasion. Cancer Metastasis Rev. 2009, 28, 15–33. [Google Scholar] [CrossRef] [PubMed]
- Lee, J.M.; Dedhar, S.; Kalluri, R.; Thompson, E.W. The epithelial–mesenchymal transition: New insights in signaling, development, and disease. J. Cell Biol. 2006, 172, 973–981. [Google Scholar] [CrossRef] [PubMed]
- Kokkinos, M.I.; Wafai, R.; Wong, M.K.; Newgreen, D.F.; Thompson, E.W.; Waltham, M. Vimentin and epithelial-mesenchymal transition in human breast cancer--observations in vitro and in vivo. Cells Tissues Organs 2007, 185, 191–203. [Google Scholar] [CrossRef]
- Battaglia, R.A.; Delic, S.; Herrmann, H.; Snider, N.T. Vimentin on the move: New developments in cell migration [version 1; peer review: 2 approved]. F1000Research 2018, 7, 1796. [Google Scholar] [CrossRef]
- Herrmann, H.; Bär, H.; Kreplak, L.; Strelkov, S.V.; Aebi, U. Intermediate filaments: From cell architecture to nanomechanics. Nat. Rev. Mol. Cell Biol. 2007, 8, 562–573. [Google Scholar] [CrossRef]
- Costigliola, N.; Ding, L.; Burckhardt, C.J.; Han, S.J. Vimentin fibers orient traction stress. Proc. Natl. Acad. Sci. USA 2017, 114, 5195–5200. [Google Scholar] [CrossRef] [PubMed]
- Liu, C.-Y.; Lin, H.-H.; Tang, M.-J.; Wang, Y.-K. Vimentin contributes to epithelial-mesenchymal transition cancer cell mechanics by mediating cytoskeletal organization and focal adhesion maturation. Oncotarget 2015, 6, 15966–15983. [Google Scholar] [CrossRef] [PubMed]
- Gan, Z.; Ding, L.; Burckhardt, C.J.; Lowery, J.; Zaritsky, A.; Sitterley, K.; Mota, A.; Costigliola, N.; Starker, C.G.; Voytas, D.F.; et al. Vimentin intermediate filaments template microtubule networks to enhance persistence in cell polarity and directed migration. Cell Syst. 2016, 3, 252–263.e258. [Google Scholar] [CrossRef] [PubMed]
- Shintani, Y.; Maeda, M.; Chaika, N.; Johnson, K.R.; Wheelock, M.J. Collagen i promotes epithelial-to-mesenchymal transition in lung cancer cells via transforming growth factor–β signaling. Am. J. Respir. Cell Mol. Biol. 2008, 38, 95–104. [Google Scholar] [CrossRef] [PubMed]
- Carey, S.P.; Martin, K.E.; Reinhart-King, C.A. Three-dimensional collagen matrix induces a mechanosensitive invasive epithelial phenotype. Sci. Rep. 2017, 7, 42088. [Google Scholar] [CrossRef]
- Vidal, M.; Salavaggione, L.; Ylagan, L.; Wilkins, M.; Watson, M.; Weilbaecher, K.; Cagan, R. A role for the epithelial microenvironment at tumor boundaries: Evidence from drosophila and human squamous cell carcinomas. Am. J. Pathol. 2010, 176, 3007–3014. [Google Scholar] [CrossRef]
- Bhatia, S.; Wang, P.; Toh, A.; Thompson, E.W. New insights into the role of phenotypic plasticity and emt in driving cancer progression. Front. Mol. Biosci. 2020, 7, 71. [Google Scholar] [CrossRef]
- Jolly, M.K.; Celià-Terrassa, T. Dynamics of phenotypic heterogeneity associated with emt and stemness during cancer progression. J. Clin. Med. 2019, 8, 1542. [Google Scholar] [CrossRef]
- Schaeffer, D.; Somarelli, J.A.; Hanna, G.; Palmer, G.M.; Garcia-Blanco, M.A. Cellular migration and invasion uncoupled: Increased migration is not an inexorable consequence of epithelial-to-mesenchymal transition. Mol. Cell. Biol. 2014, 34, 3486–3499. [Google Scholar] [CrossRef]
- Buckley, S.T.; Medina, C.; Davies, A.M.; Ehrhardt, C. Cytoskeletal re-arrangement in tgf-β1-induced alveolar epithelial-mesenchymal transition studied by atomic force microscopy and high-content analysis. Nanomed. Nanotechnol. Biol. Med. 2012, 8, 355–364. [Google Scholar] [CrossRef]
- Coughlin, M.F.; Bielenberg, D.R.; Lenormand, G.; Marinkovic, M.; Waghorne, C.G.; Zetter, B.R.; Fredberg, J.J. Cytoskeletal stiffness, friction, and fluidity of cancer cell lines with different metastatic potential. Clin. Exp. Metastasis 2013, 30, 237–250. [Google Scholar] [CrossRef] [PubMed]
- Paluch, E.; Heisenberg, C.-P. Biology and physics of cell shape changes in development. Curr. Biol. 2009, 19, R790–R799. [Google Scholar] [CrossRef] [PubMed]
- Lecuit, T.; Lenne, P.-F. Cell surface mechanics and the control of cell shape, tissue patterns and morphogenesis. Nat. Rev. Mol. Cell Biol. 2007, 8, 633–644. [Google Scholar] [CrossRef] [PubMed]
- Leggett, S.E.; Hruska, A.M.; Guo, M.; Wong, I.Y. The epithelial-mesenchymal transition and the cytoskeleton in bioengineered systems. Cell Commun. Signal. 2021, 19, 32. [Google Scholar] [CrossRef] [PubMed]
- Shankar, J.; Nabi, I.R. Actin cytoskeleton regulation of epithelial mesenchymal transition in metastatic cancer cells. PLoS ONE 2015, 10, e0119954. [Google Scholar]
- Ljepoja, B.; Schreiber, C.; Gegenfurtner, F.A.; García-Roman, J.; Köhler, B.; Zahler, S.; Rädler, J.O.; Wagner, E.; Roidl, A. Inducible microrna-200c decreases motility of breast cancer cells and reduces filamin a. PLoS ONE 2019, 14, e0224314. [Google Scholar] [CrossRef]
- Ren, Z.-X.; Yu, H.-B.; Li, J.-S.; Shen, J.-L.; Du, W.-S. Suitable parameter choice on quantitative morphology of a549 cell in epithelial-mesenchymal transition. Biosci. Rep. 2015, 35, e00202. [Google Scholar] [CrossRef]
- Sarkar, A.; Barui, A.; Sengupta, S.; Chatterjee, J.; Ghorai, S.; Mukherjee, A. Epithelial mesenchymal transition in lung cancer cells: A quantitative analysis. In Proceedings of the 2015 37th Annual International Conference of the IEEE Engineering in Medicine and Biology Society (EMBC), Milan, Italy, 25–29 August 2015; pp. 5372–5375. [Google Scholar]
- Kim, J.; Cao, Y.; Eddy, C.; Deng, Y.; Levine, H.; Rappel, W.-J.; Sun, B. The mechanics and dynamics of cancer cells sensing noisy 3d contact guidance. Proc. Natl. Acad. Sci. USA 2021, 118, e2024780118. [Google Scholar] [CrossRef]
- Schöchlin, M.; Weissinger, S.E.; Brandes, A.R.; Herrmann, M.; Möller, P.; Lennerz, J.K. A nuclear circularity-based classifier for diagnostic distinction of desmoplastic from spindle cell melanoma in digitized histological images. J. Pathol. Inform. 2014, 5, 40. [Google Scholar] [CrossRef]
- Bussolati, G.; Maletta, F.; Asioli, S.; Annaratone, L.; Sapino, A.; Marchiò, C. “To be or not to be in a good shape”: Diagnostic and clinical value of nuclear shape irregularities in thyroid and breast cancer. In Cancer Biology and the Nuclear Envelope: Recent Advances May Elucidate Past Paradoxes; Schirmer, E.C., de las Heras, J.I., Eds.; Springer: New York, NY, USA, 2014; pp. 101–121. [Google Scholar]
- Chiotaki, R.; Polioudaki, H.; Theodoropoulos, P.A. Differential nuclear shape dynamics of invasive andnon-invasive breast cancer cells are associated with actin cytoskeleton organization and stability. Biochem. Cell Biol. 2014, 92, 287–295. [Google Scholar] [CrossRef]
- Friedl, P.; Wolf, K.; Lammerding, J. Nuclear mechanics during cell migration. Curr. Opin. Cell Biol. 2011, 23, 55–64. [Google Scholar] [CrossRef] [PubMed]
- Fischer, T.; Hayn, A.; Mierke, C.T. Effect of nuclear stiffness on cell mechanics and migration of human breast cancer cells. Front. Cell Dev. Biol. 2020, 8, 393. [Google Scholar] [CrossRef]
- Kim, J.B.; Stein, R.; O’Hare, M.J. Tumour-stromal interactions in breast cancer: The role of stroma in tumourigenesis. Tumour Biol. 2005, 26, 173–185. [Google Scholar] [CrossRef] [PubMed]
- Polyak, K.; Kalluri, R. The role of the microenvironment in mammary gland development and cancer. Cold Spring Harb. Perspect. Biol. 2010, 2, a003244. [Google Scholar] [CrossRef] [PubMed]
- Mao, Y.; Keller, E.T.; Garfield, D.H.; Shen, K.; Wang, J. Stromal cells in tumor microenvironment and breast cancer. Cancer Metastasis Rev. 2013, 32, 303–315. [Google Scholar] [CrossRef]
- Wiseman, B.S.; Werb, Z. Stromal effects on mammary gland development and breast cancer. Science 2002, 296, 1046–1049. [Google Scholar] [CrossRef]
- Campbell, J.J.; Husmann, A.; Hume, R.D.; Watson, C.J.; Cameron, R.E. Development of three-dimensional collagen scaffolds with controlled architecture for cell migration studies using breast cancer cell lines. Biomaterials 2017, 114, 34–43. [Google Scholar] [CrossRef]
- Nieto, M.A.; Huang, R.Y.; Jackson, R.A.; Thiery, J.P. Emt: 2016. Cell 2016, 166, 21–45. [Google Scholar] [CrossRef]
- Craene, B.D.; Berx, G. Regulatory networks defining emt during cancer initiation and progression. Nat. Rev. Cancer 2013, 13, 97. [Google Scholar] [CrossRef]
- Vuoriluoto, K.; Haugen, H.; Kiviluoto, S.; Mpindi, J.P.; Nevo, J.; Gjerdrum, C.; Tiron, C.; Lorens, J.B.; Ivaska, J. Vimentin regulates emt induction by slug and oncogenic h-ras and migration by governing axl expression in breast cancer. Oncogene 2011, 30, 1436–1448. [Google Scholar] [CrossRef]
- Kim, K.K.; Kugler, M.C.; Wolters, P.J.; Robillard, L.; Galvez, M.G.; Brumwell, A.N.; Sheppard, D.; Chapman, H.A. Alveolar epithelial cell mesenchymal transition develops in vivo during pulmonary fibrosis and is regulated by the extracellular matrix. Proc. Natl. Acad. Sci. USA 2006, 103, 13180–13185. [Google Scholar] [CrossRef] [PubMed]
- Munger, J.S.; Sheppard, D. Cross talk among tgf-β signaling pathways, integrins, and the extracellular matrix. Cold Spring Harb. Perspect. Biol. 2011, 3, a005017. [Google Scholar] [CrossRef] [PubMed]
- Zambruno, G.; Marchisio, P.C.; Marconi, A.; Vaschieri, C.; Melchiori, A.; Giannetti, A.; De Luca, M. Transforming growth factor-beta 1 modulates beta 1 and beta 5 integrin receptors and induces the de novo expression of the alpha v beta 6 heterodimer in normal human keratinocytes: Implications for wound healing. J. Cell Biol. 1995, 129, 853–865. [Google Scholar] [CrossRef] [PubMed]
- Houle, D.; Govindaraju, D.R.; Omholt, S. Phenomics: The next challenge. Nat. Rev. Genet. 2010, 11, 855–866. [Google Scholar] [CrossRef] [PubMed]
- Smith, K.; Piccinini, F.; Balassa, T.; Koos, K.; Danka, T.; Azizpour, H.; Horvath, P. Phenotypic image analysis software tools for exploring and understanding big image data from cell-based assays. Cell Syst. 2018, 6, 636–653. [Google Scholar] [CrossRef] [PubMed]
- Wang, W.; Douglas, D.; Zhang, J.; Kumari, S.; Enuameh, M.S.; Dai, Y.; Wallace, C.T.; Watkins, S.C.; Shu, W.; Xing, J. Live-cell imaging and analysis reveal cell phenotypic transition dynamics inherently missing in snapshot data. Sci. Adv. 2020, 6, eaba9319. [Google Scholar] [CrossRef] [PubMed]
- Schindelin, J.; Arganda-Carreras, I.; Frise, E.; Kaynig, V.; Longair, M.; Pietzsch, T.; Preibisch, S.; Rueden, C.; Saalfeld, S.; Schmid, B.; et al. Fiji: An open-source platform for biological-image analysis. Nat. Methods 2012, 9, 676–682. [Google Scholar] [CrossRef]
- Tian, H.; Lian, R.; Li, Y.; Liu, C.; Liang, S.; Li, W.; Tao, T.; Wu, X.; Ye, Y.; Yang, X.; et al. Akt-induced lncrna val promotes emt-independent metastasis through diminishing trim16-dependent vimentin degradation. Nat. Commun. 2020, 11, 5127. [Google Scholar] [CrossRef]
- Jolly, M.K.; Ware, K.E.; Gilja, S.; Somarelli, J.A.; Levine, H. Emt and met: Necessary or permissive for metastasis? Mol. Oncol. 2017, 11, 755–769. [Google Scholar] [CrossRef]


Disclaimer/Publisher’s Note: The statements, opinions and data contained in all publications are solely those of the individual author(s) and contributor(s) and not of MDPI and/or the editor(s). MDPI and/or the editor(s) disclaim responsibility for any injury to people or property resulting from any ideas, methods, instructions or products referred to in the content. |
© 2023 by the authors. Licensee MDPI, Basel, Switzerland. This article is an open access article distributed under the terms and conditions of the Creative Commons Attribution (CC BY) license (https://creativecommons.org/licenses/by/4.0/).
Share and Cite
Isert, L.; Mehta, A.; Loiudice, G.; Oliva, A.; Roidl, A.; Merkel, O.M. An In Vitro Approach to Model EMT in Breast Cancer. Int. J. Mol. Sci. 2023, 24, 7757. https://doi.org/10.3390/ijms24097757
Isert L, Mehta A, Loiudice G, Oliva A, Roidl A, Merkel OM. An In Vitro Approach to Model EMT in Breast Cancer. International Journal of Molecular Sciences. 2023; 24(9):7757. https://doi.org/10.3390/ijms24097757
Chicago/Turabian StyleIsert, Lorenz, Aditi Mehta, Gabriele Loiudice, Altea Oliva, Andreas Roidl, and Olivia M. Merkel. 2023. "An In Vitro Approach to Model EMT in Breast Cancer" International Journal of Molecular Sciences 24, no. 9: 7757. https://doi.org/10.3390/ijms24097757
APA StyleIsert, L., Mehta, A., Loiudice, G., Oliva, A., Roidl, A., & Merkel, O. M. (2023). An In Vitro Approach to Model EMT in Breast Cancer. International Journal of Molecular Sciences, 24(9), 7757. https://doi.org/10.3390/ijms24097757