
NMR-Relaxometric Investigation of Mn(II)-Doped Polyoxometalates in Aqueous Solutions

 ,
,  ,
,  and
and 
Abstract
1. Introduction
2. Results and Discussion
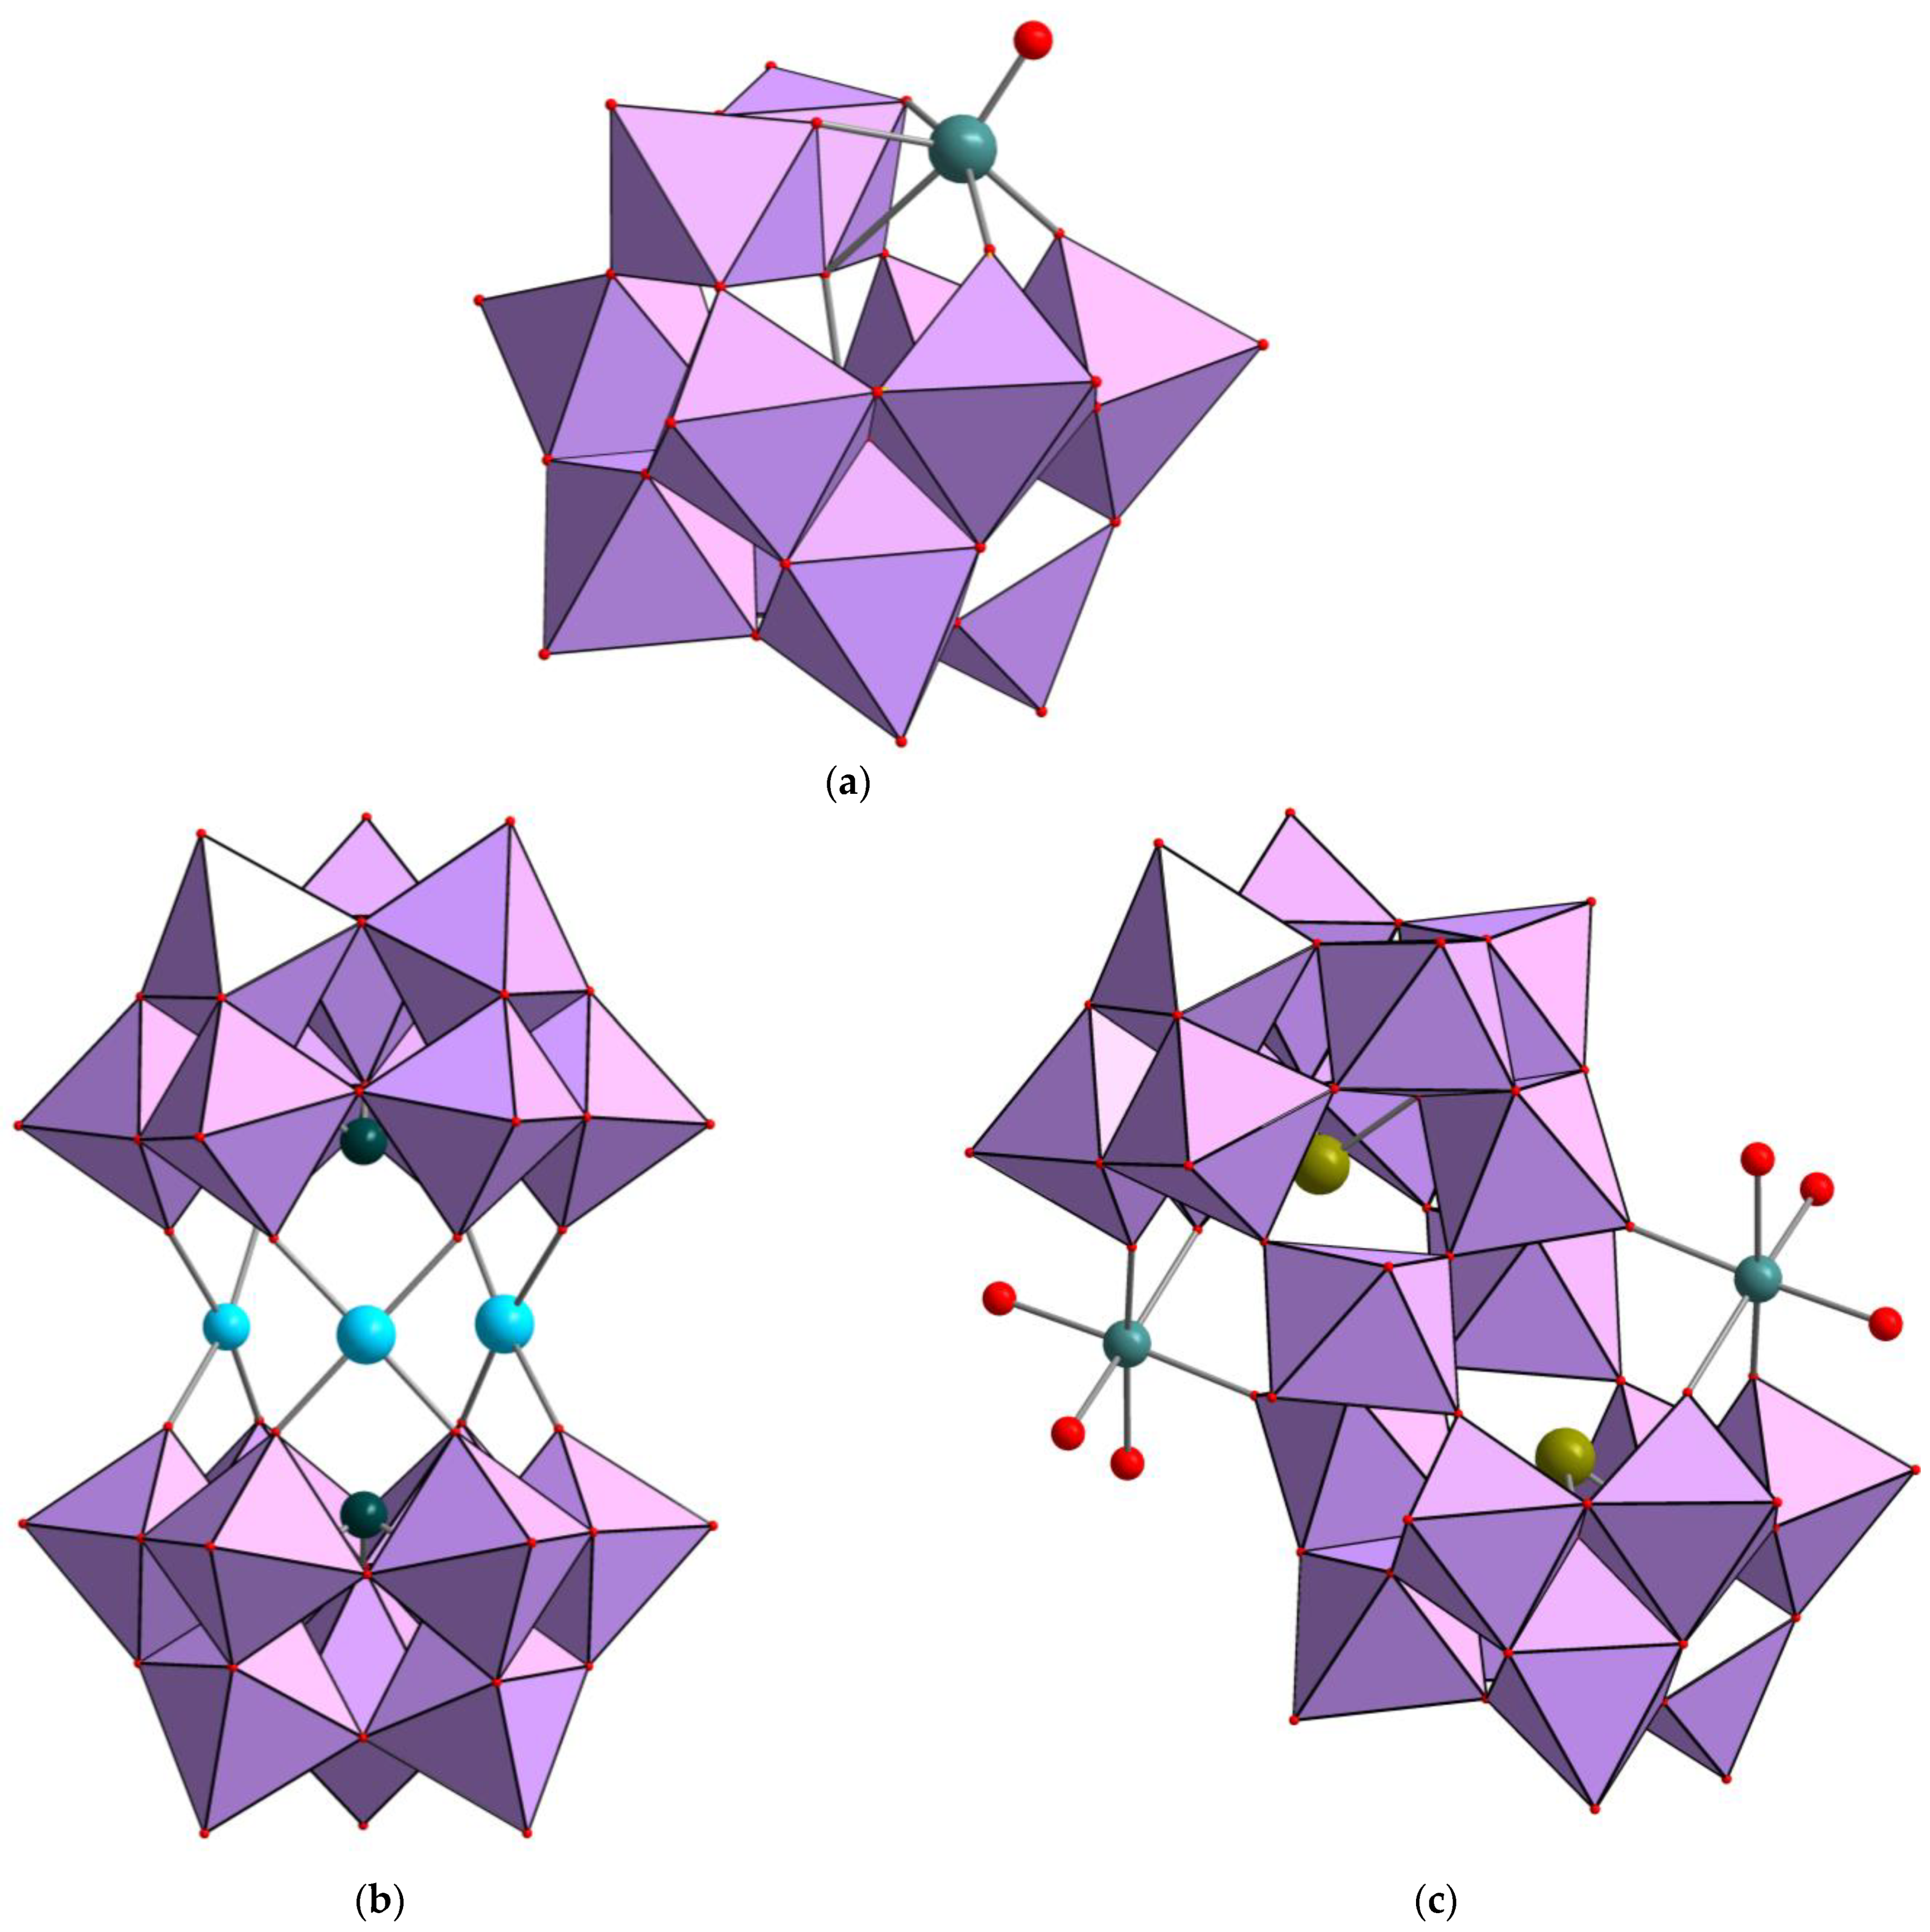
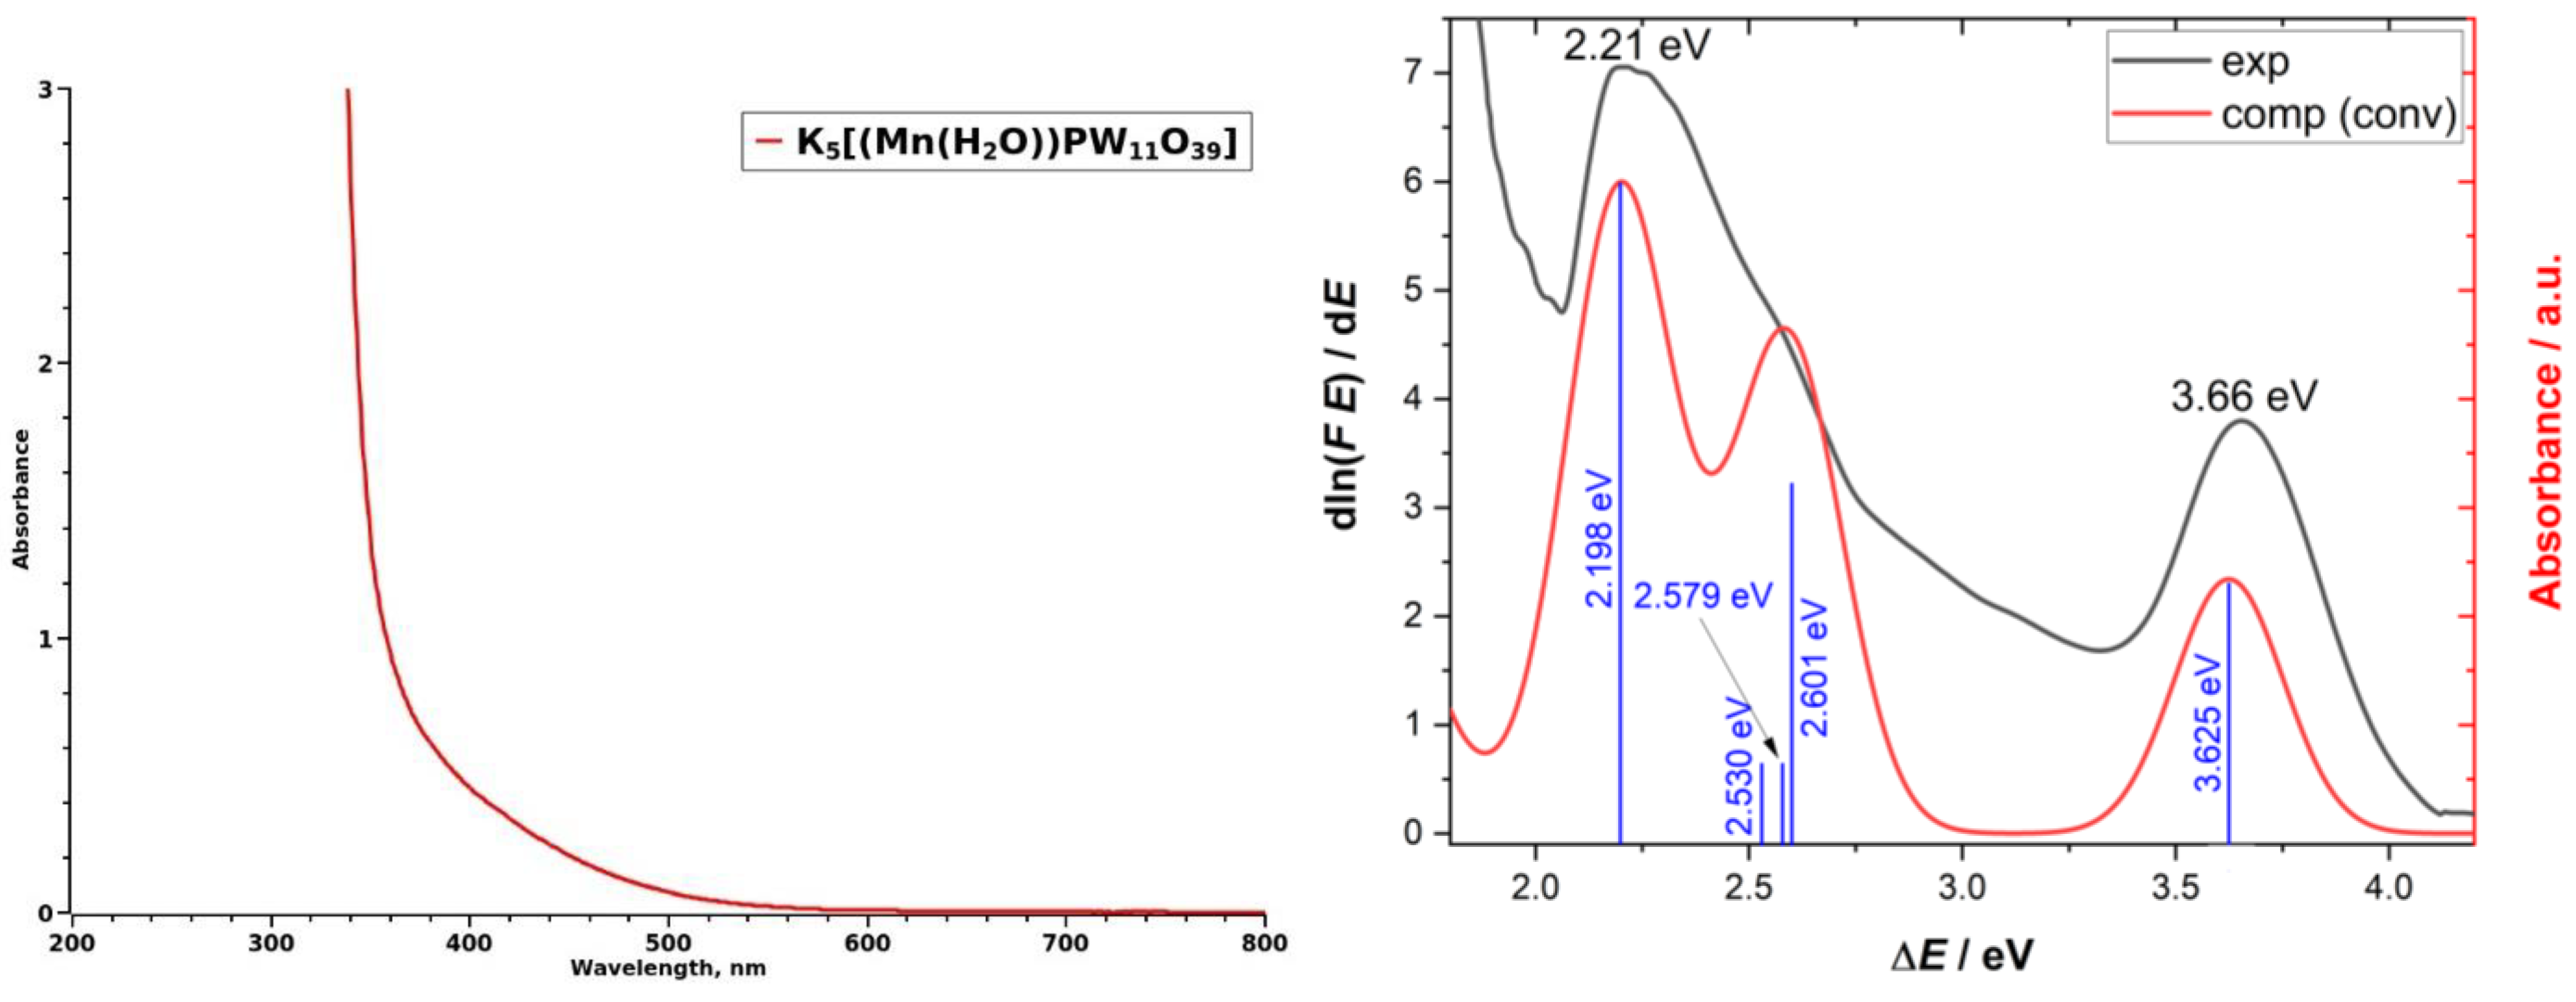
2.1. Synthesis and Characterization of Mn-Containing Complexes
2.2. Quantum-Chemical Calculations of Mn2+ Electronic States
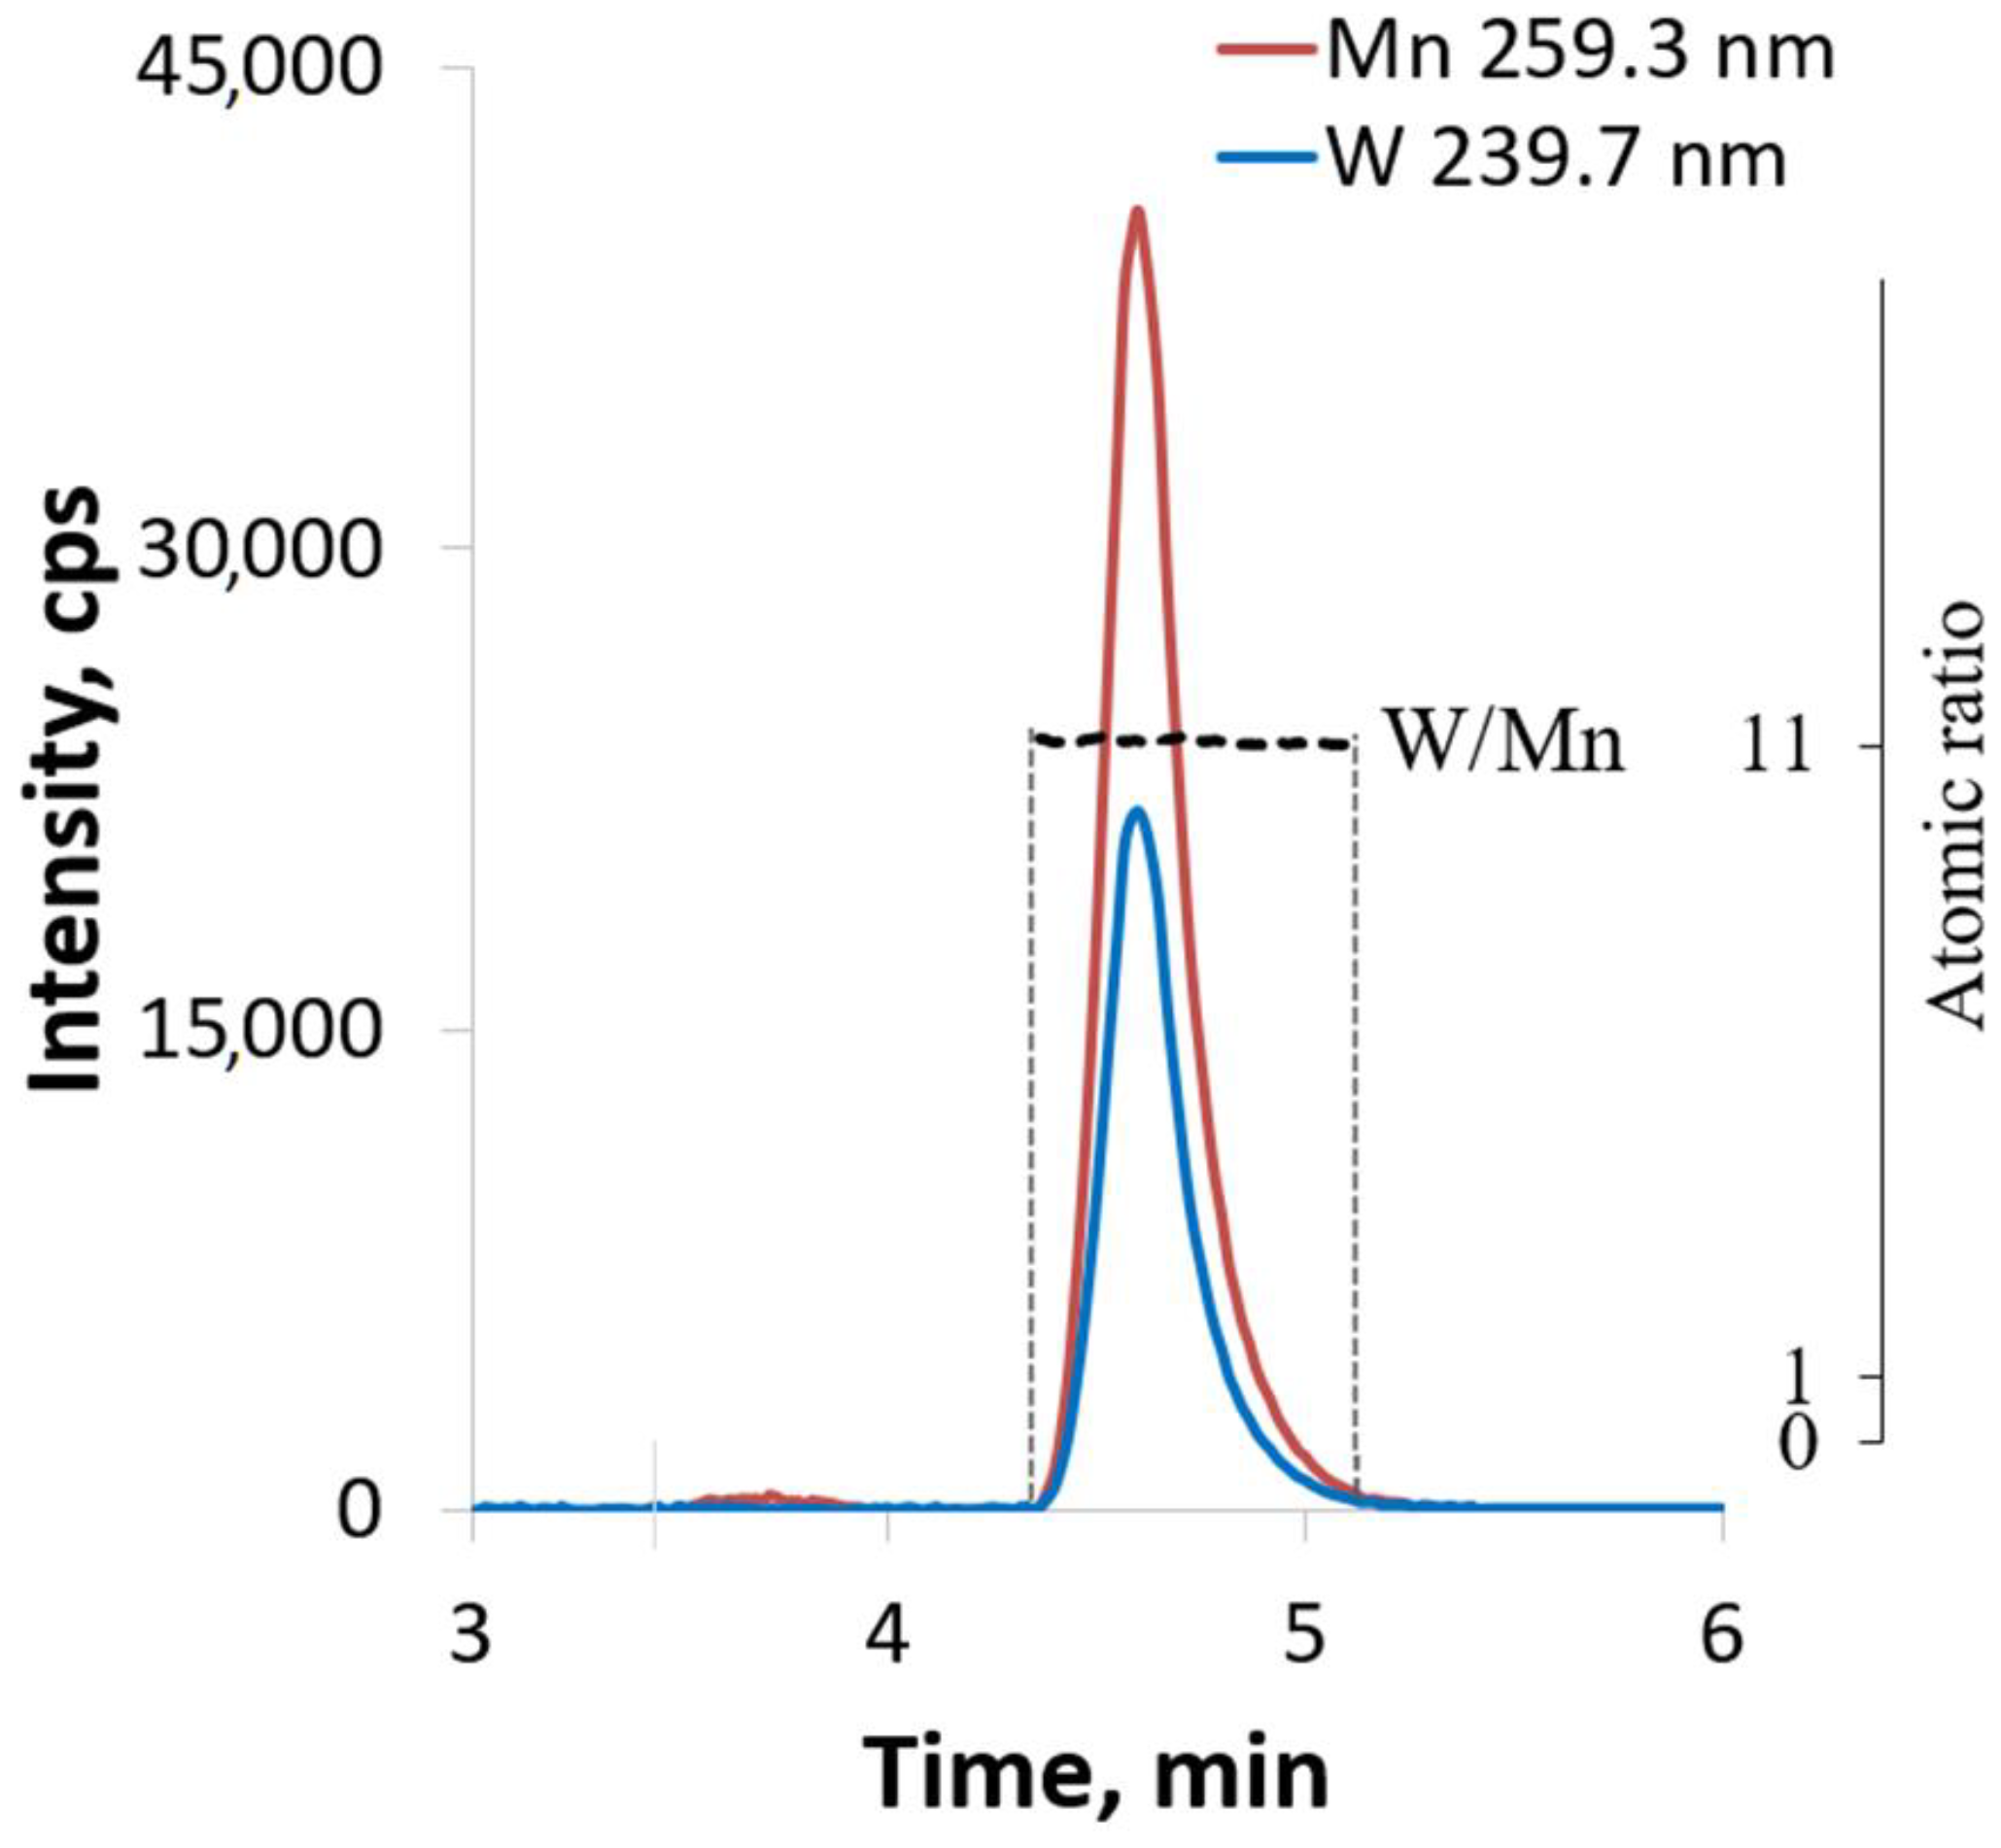
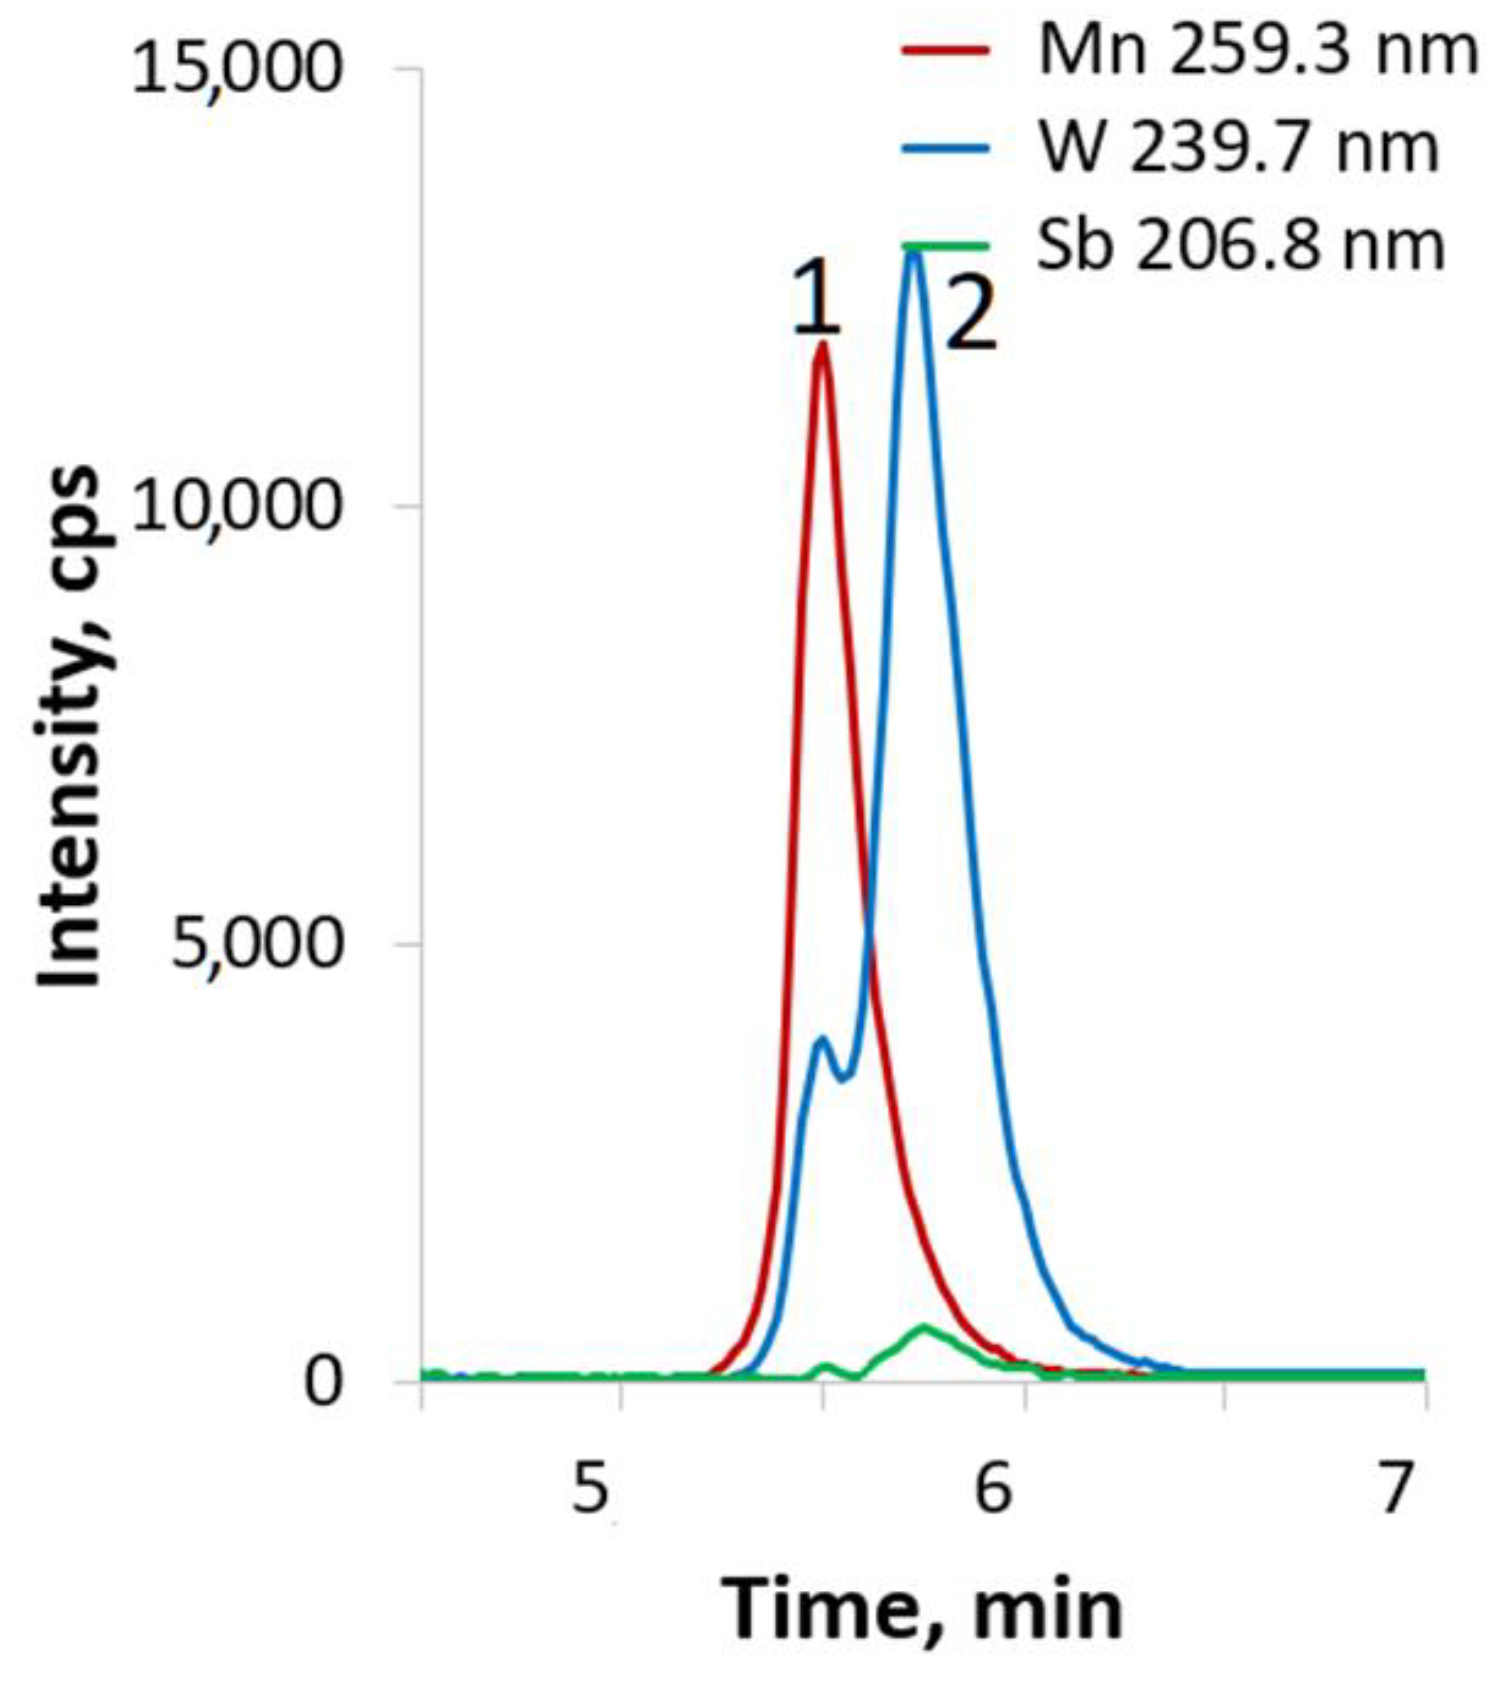
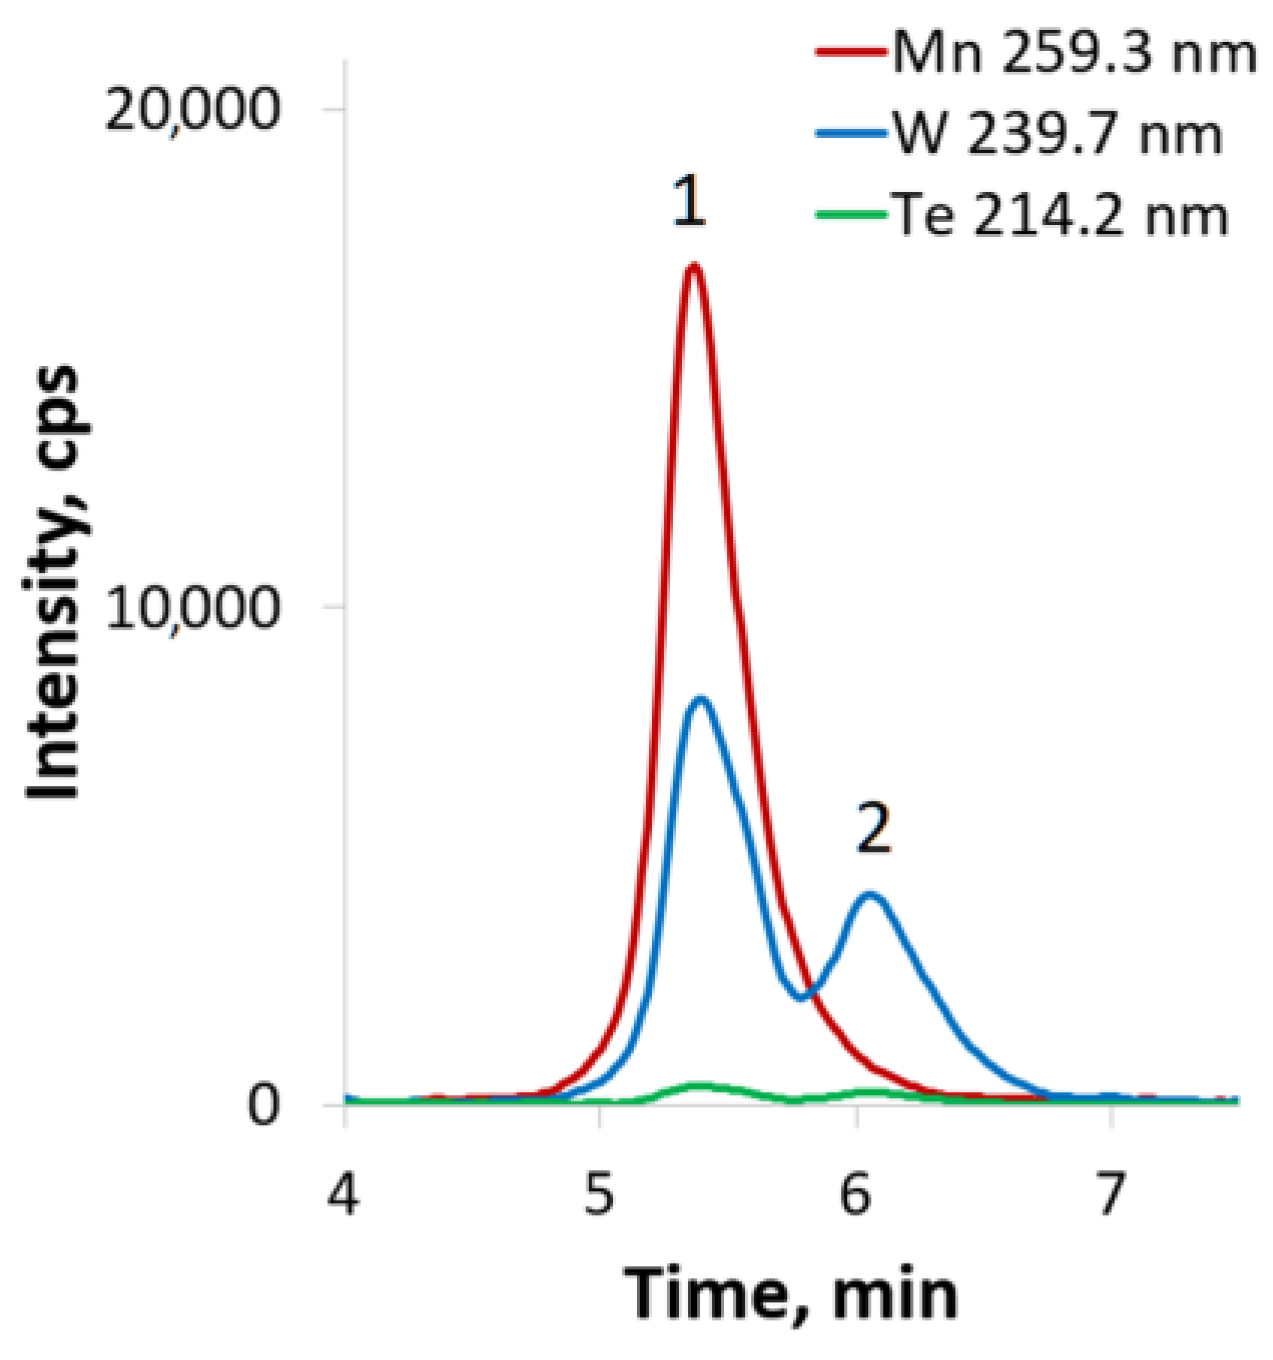
2.3. HPLC-ICP-AES
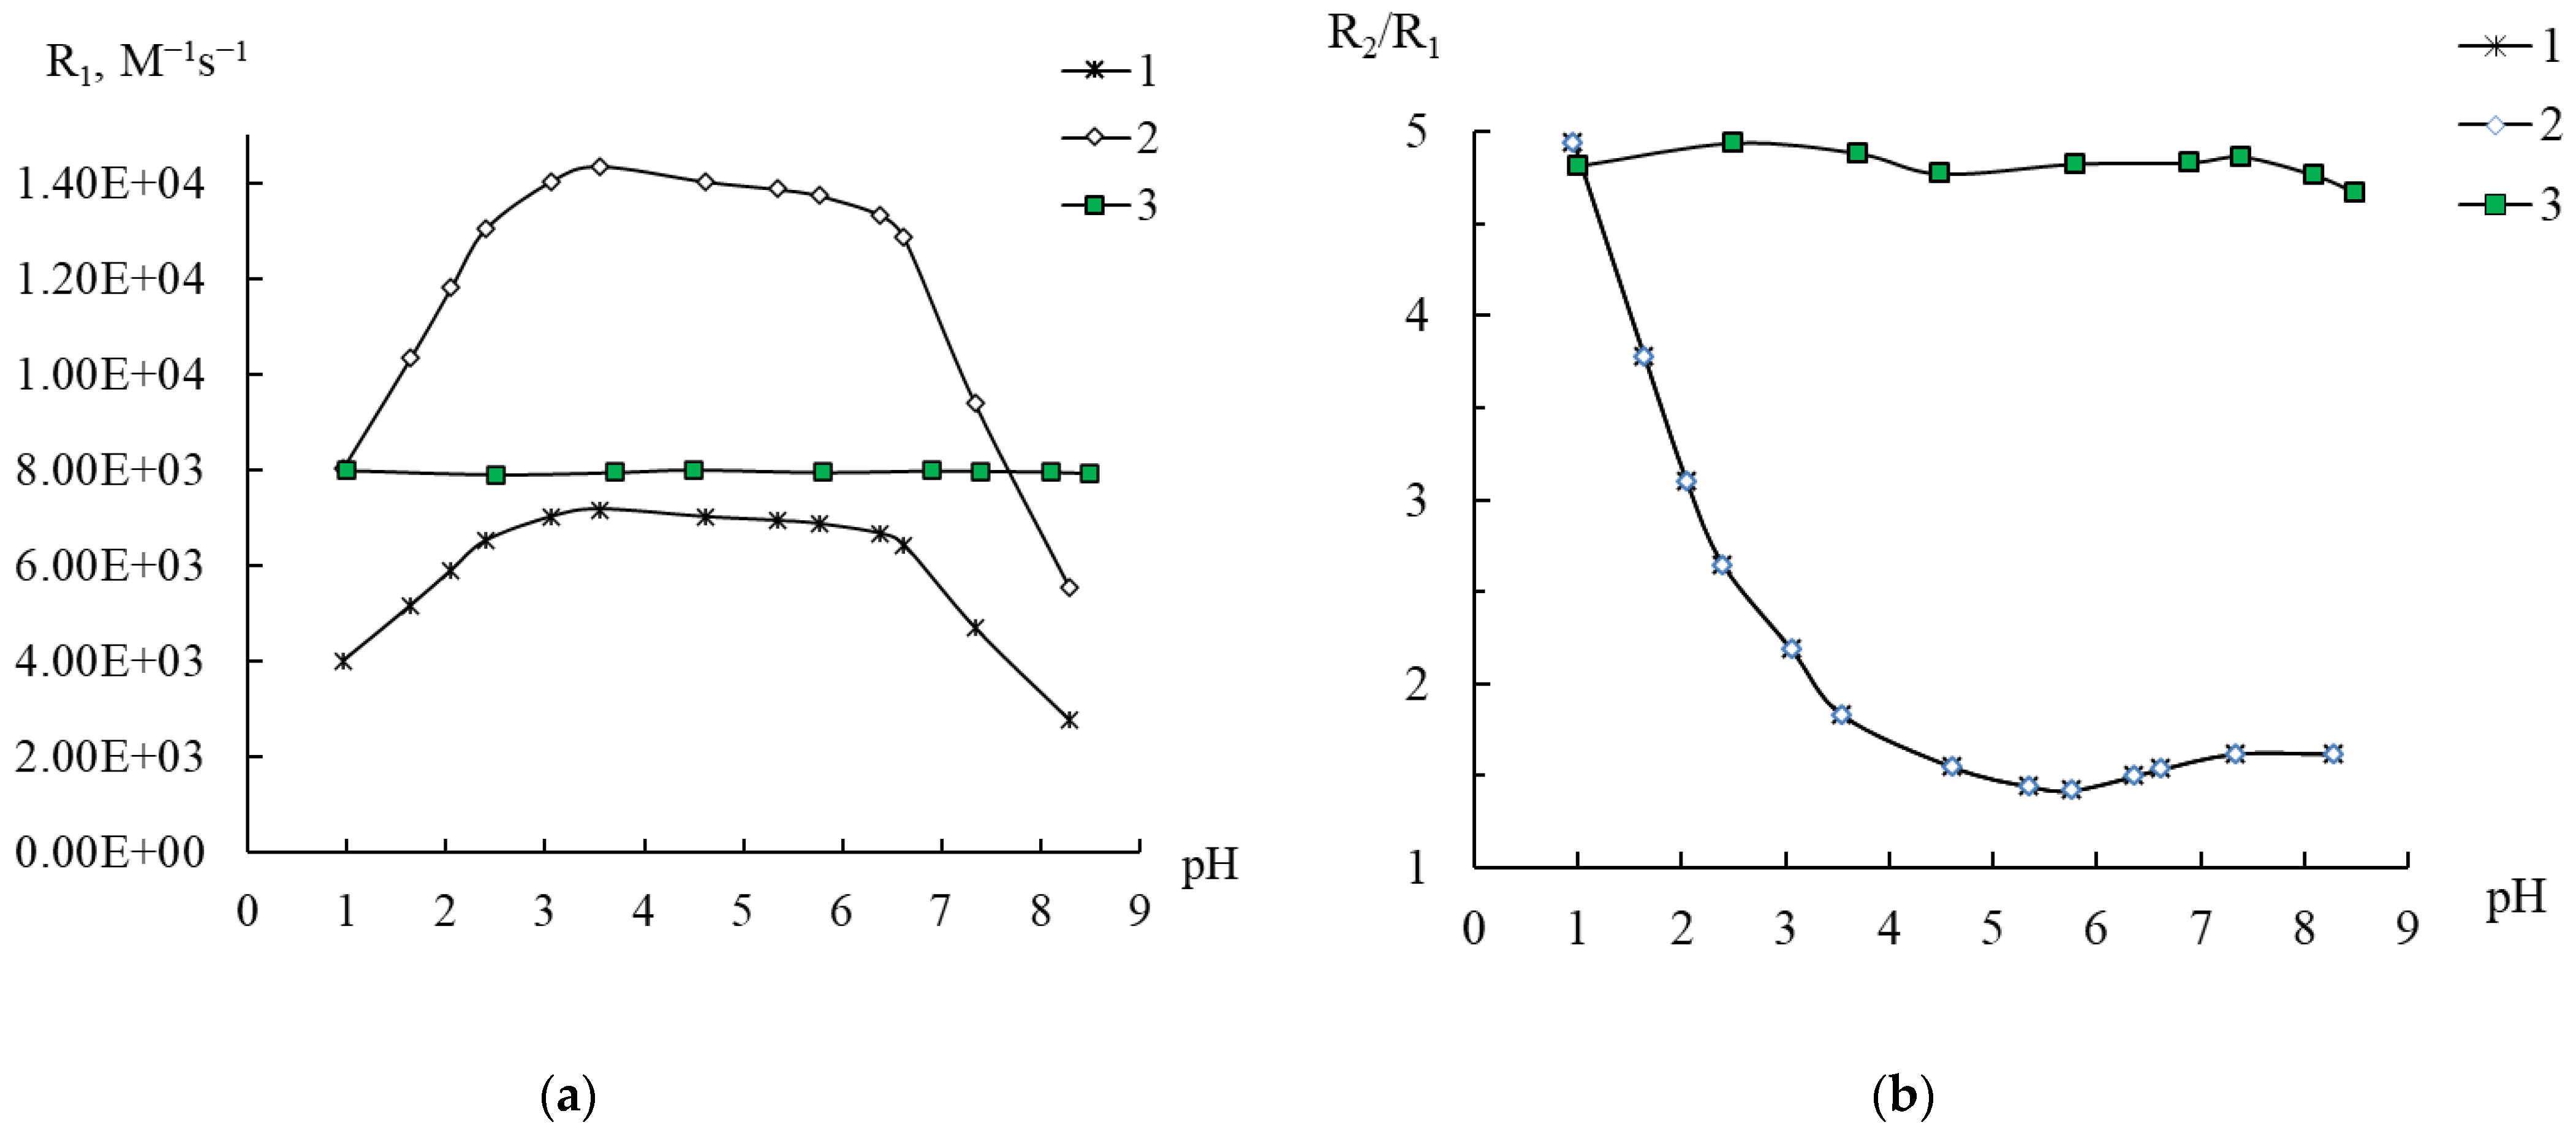
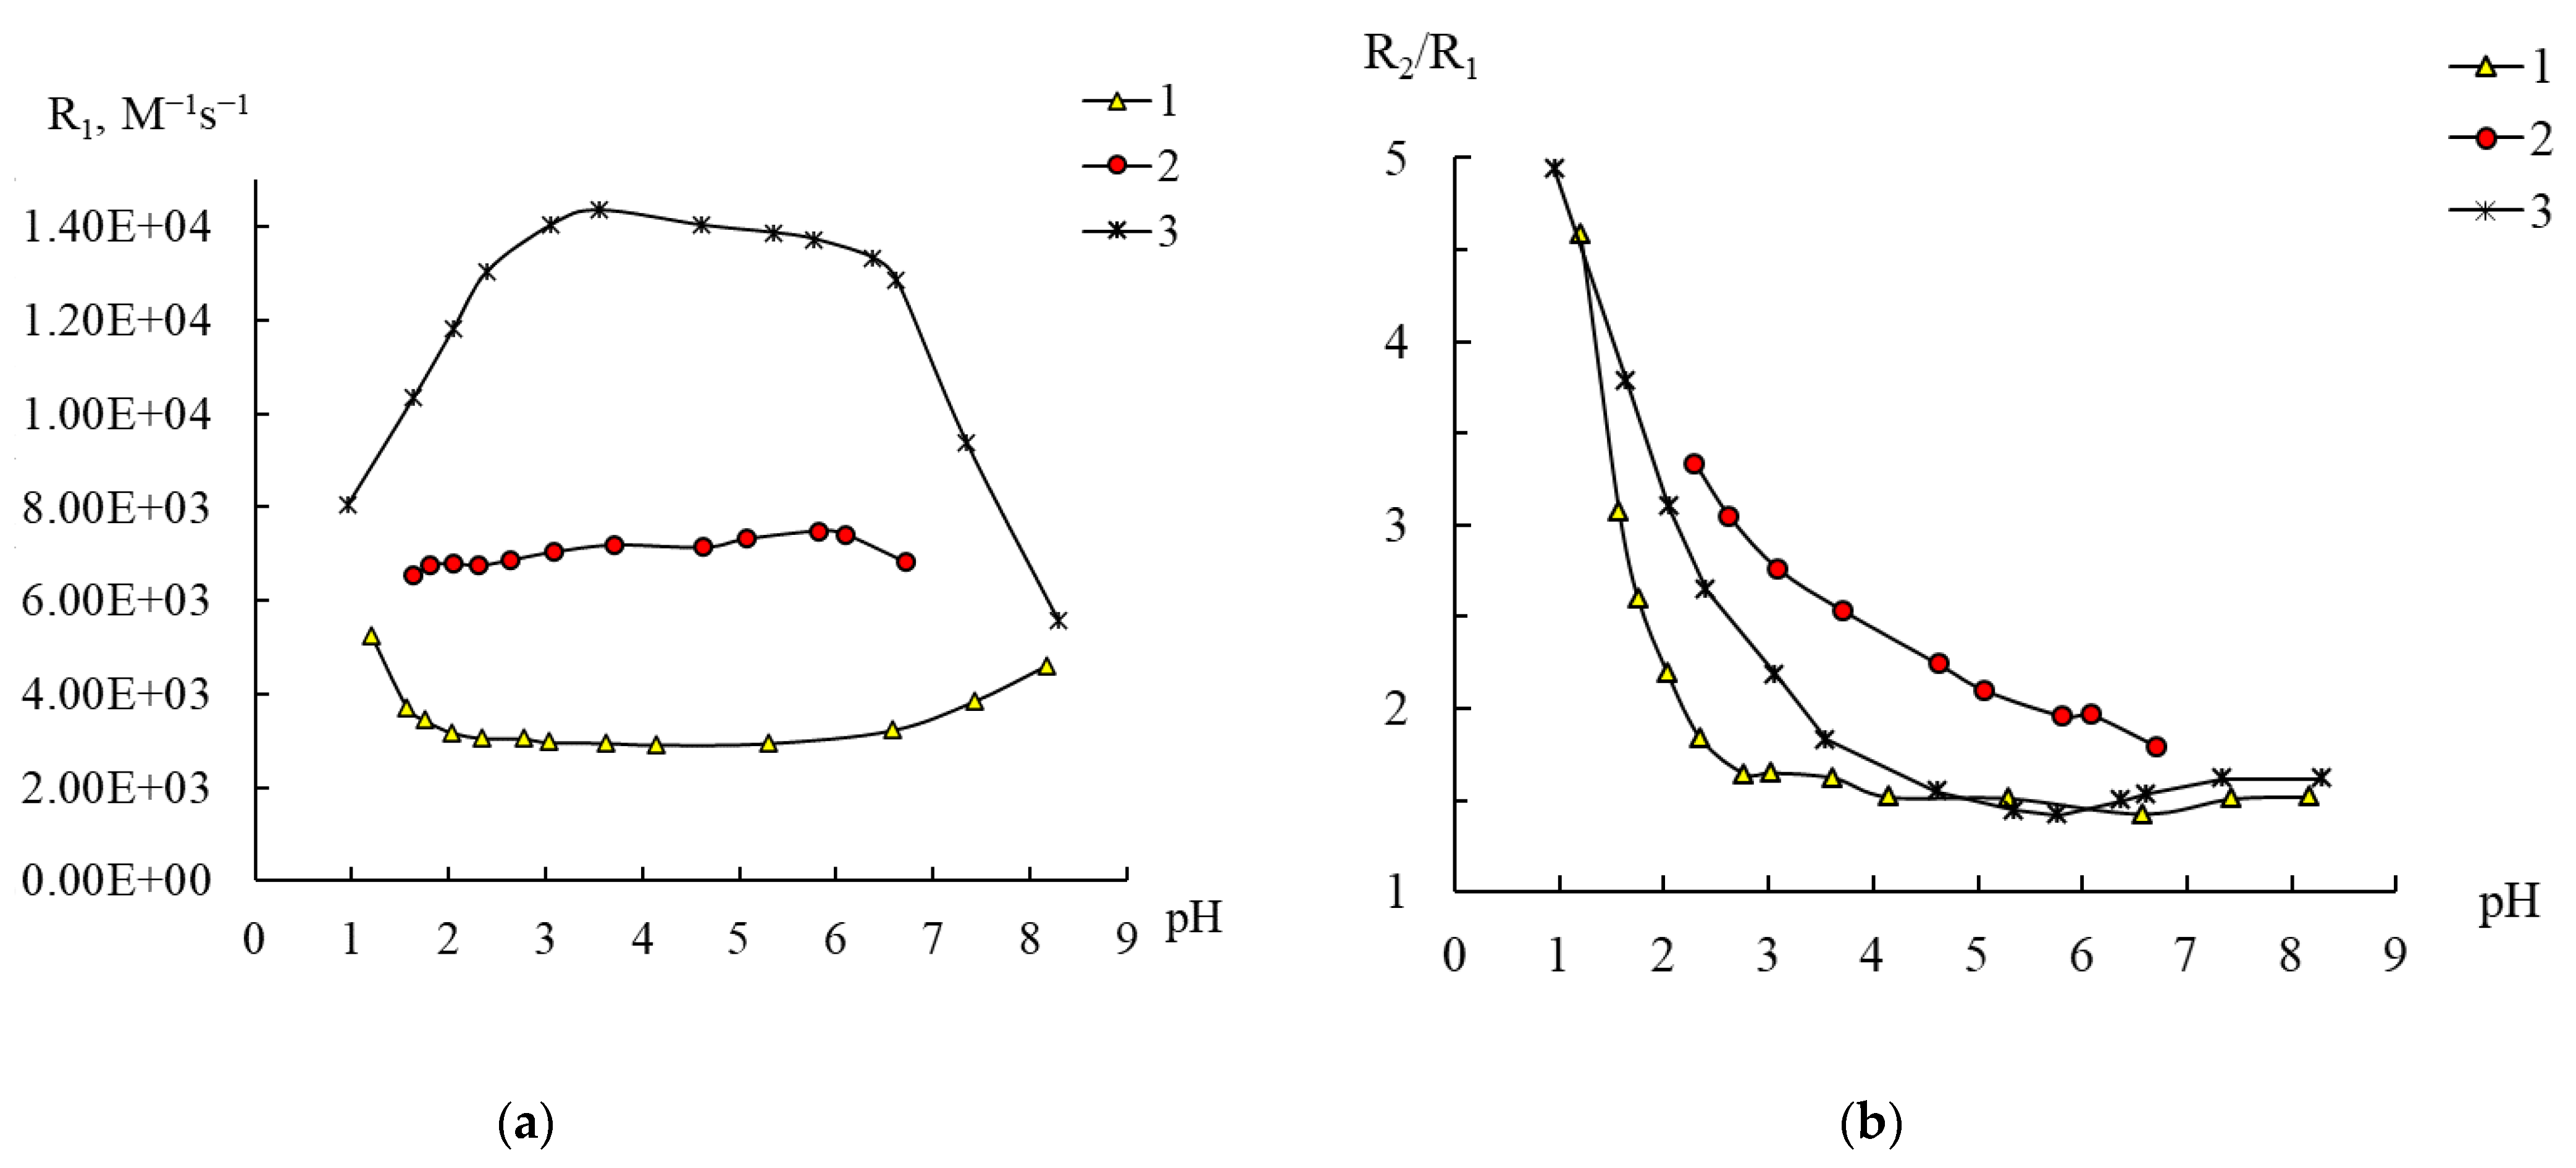
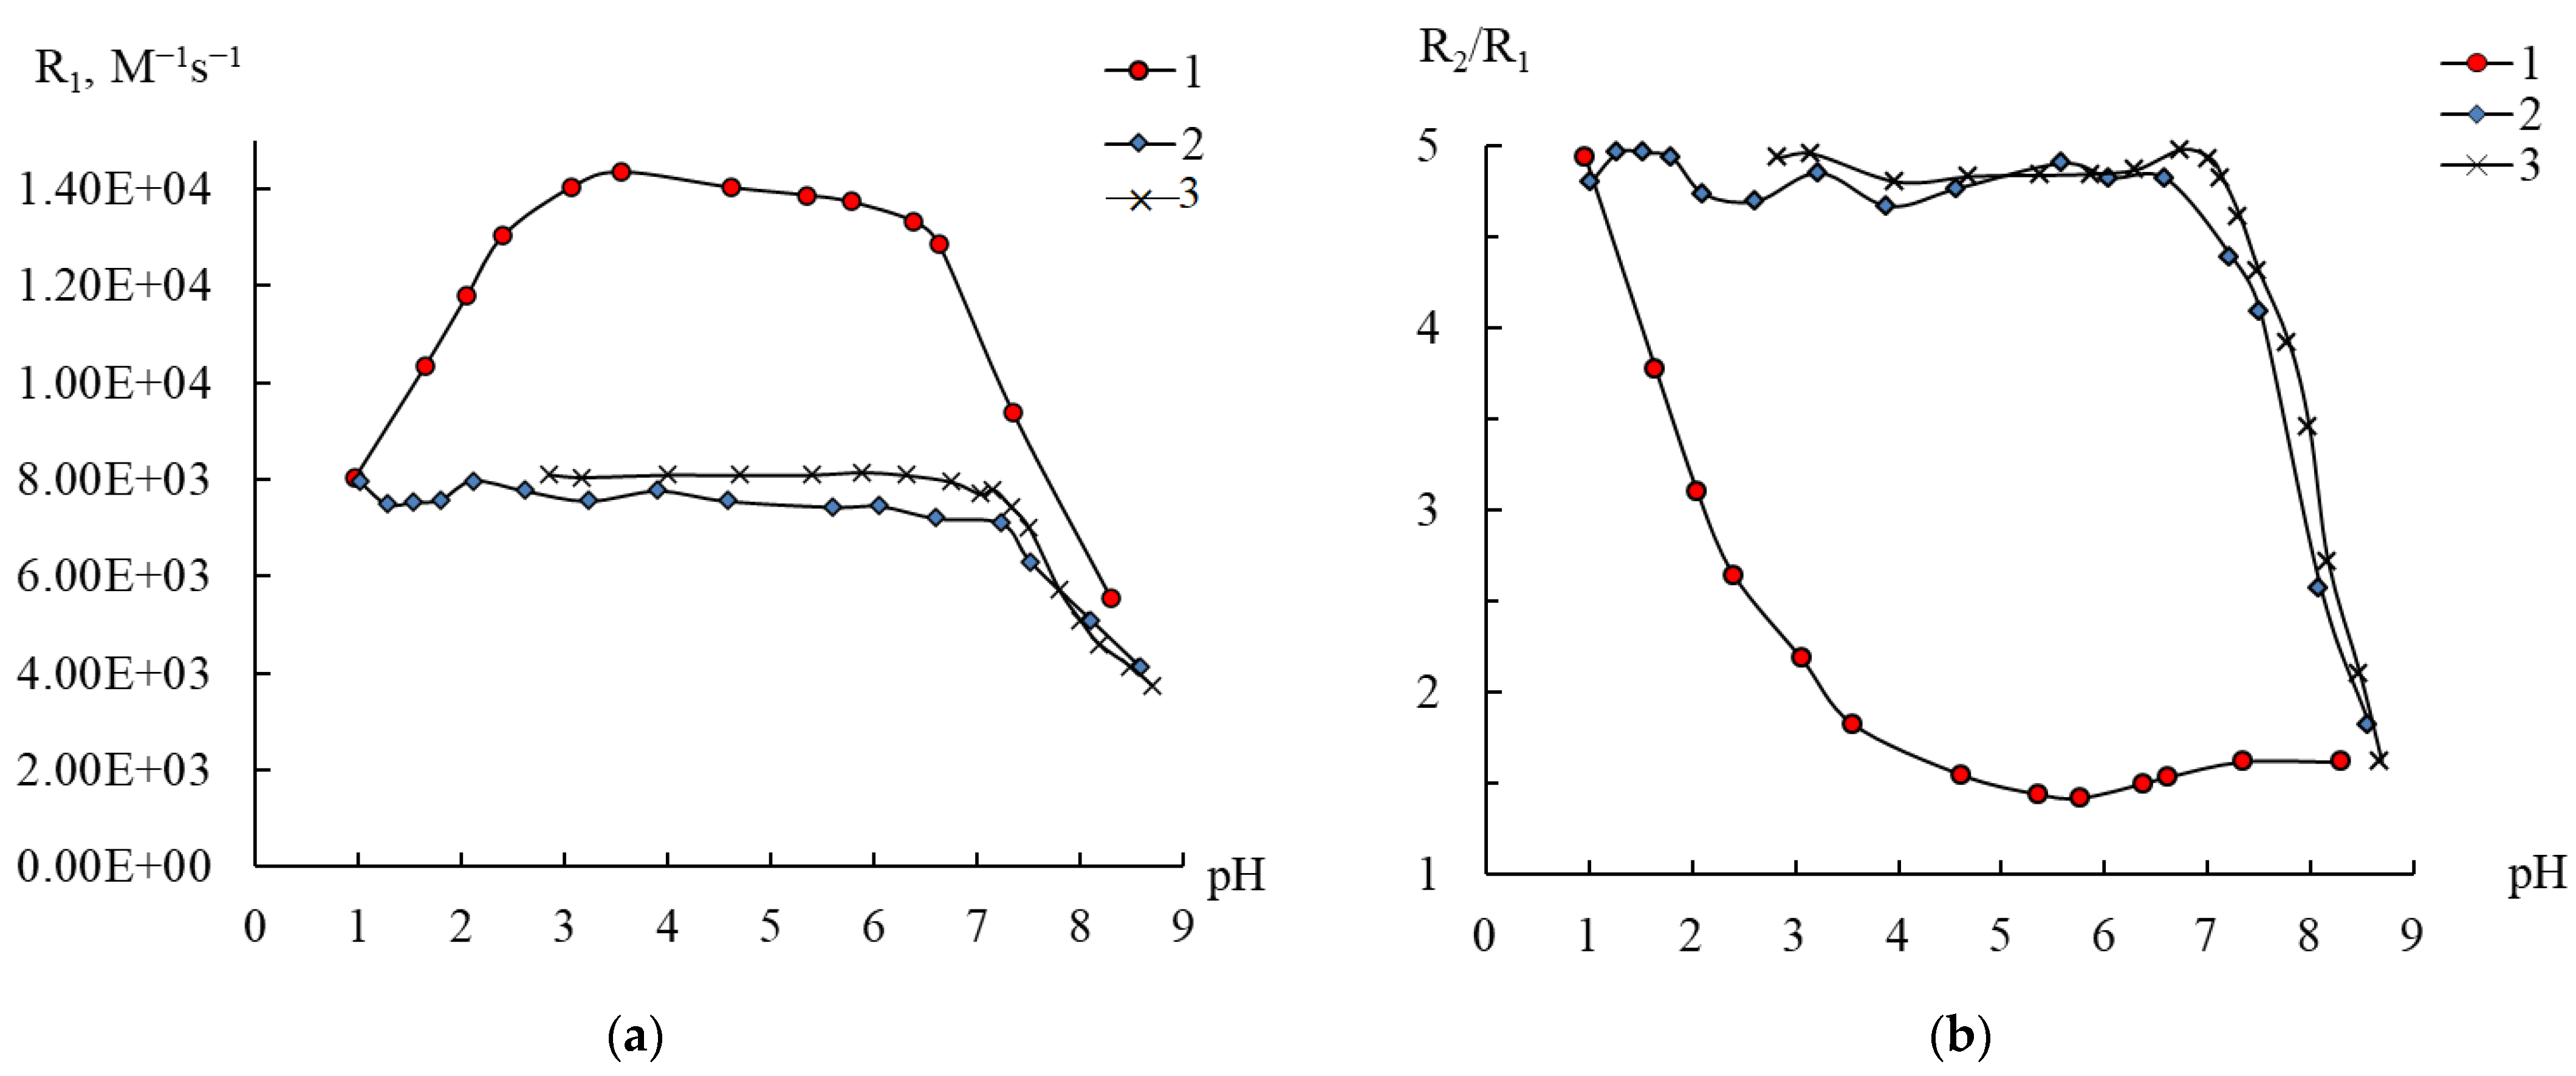
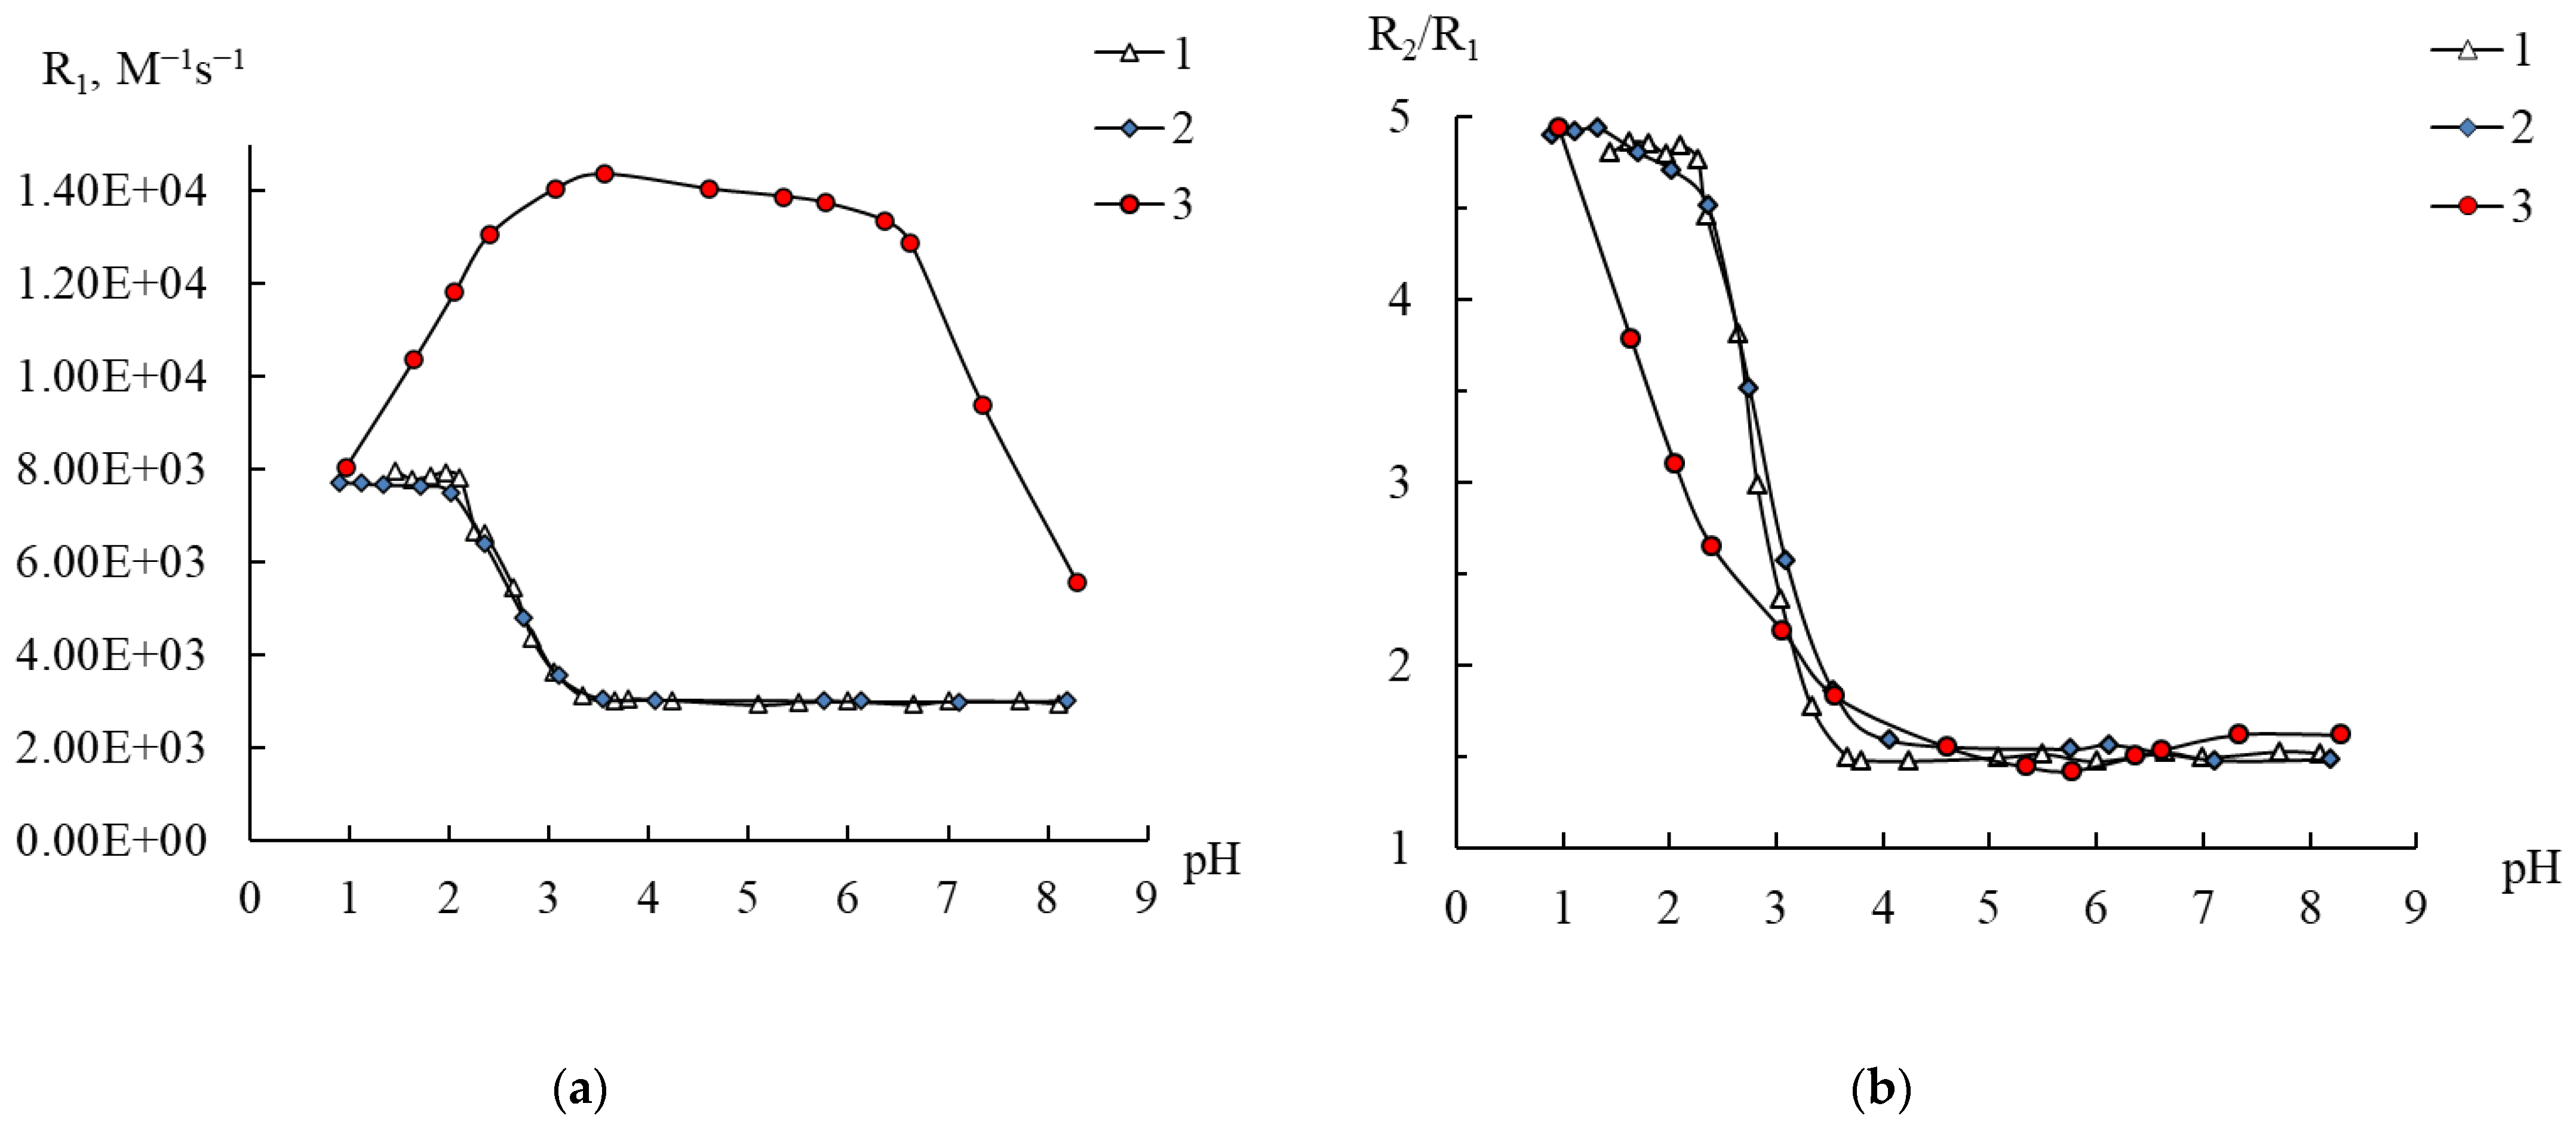
2.4. Behavior of 1–3 in Water According to NMR Relaxation Data
2.5. Effect of the Cationic Polymer on Compound 3 in Water
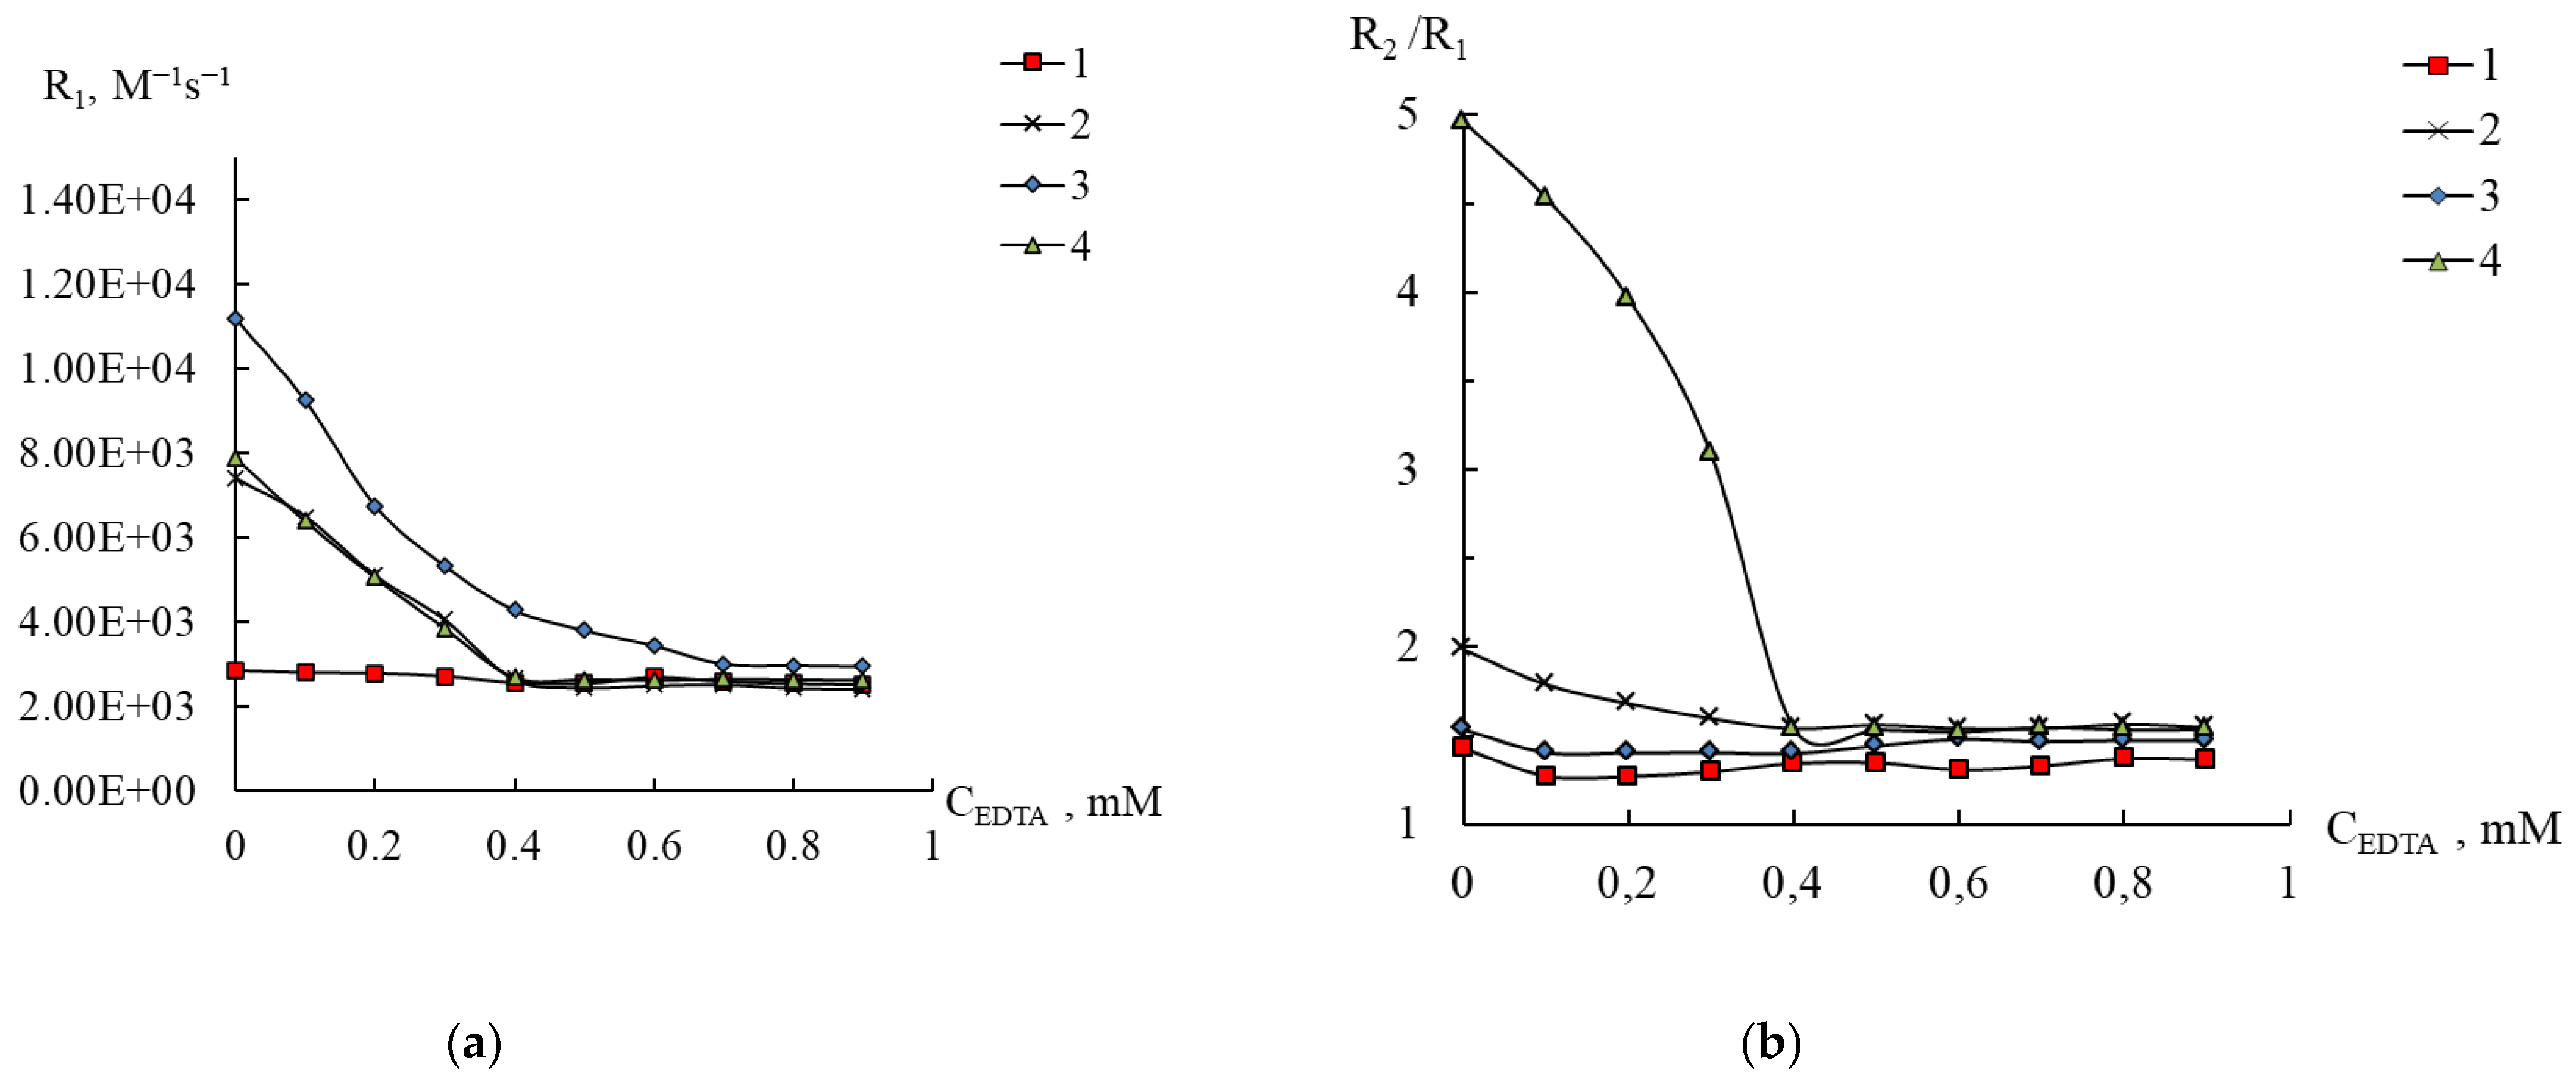
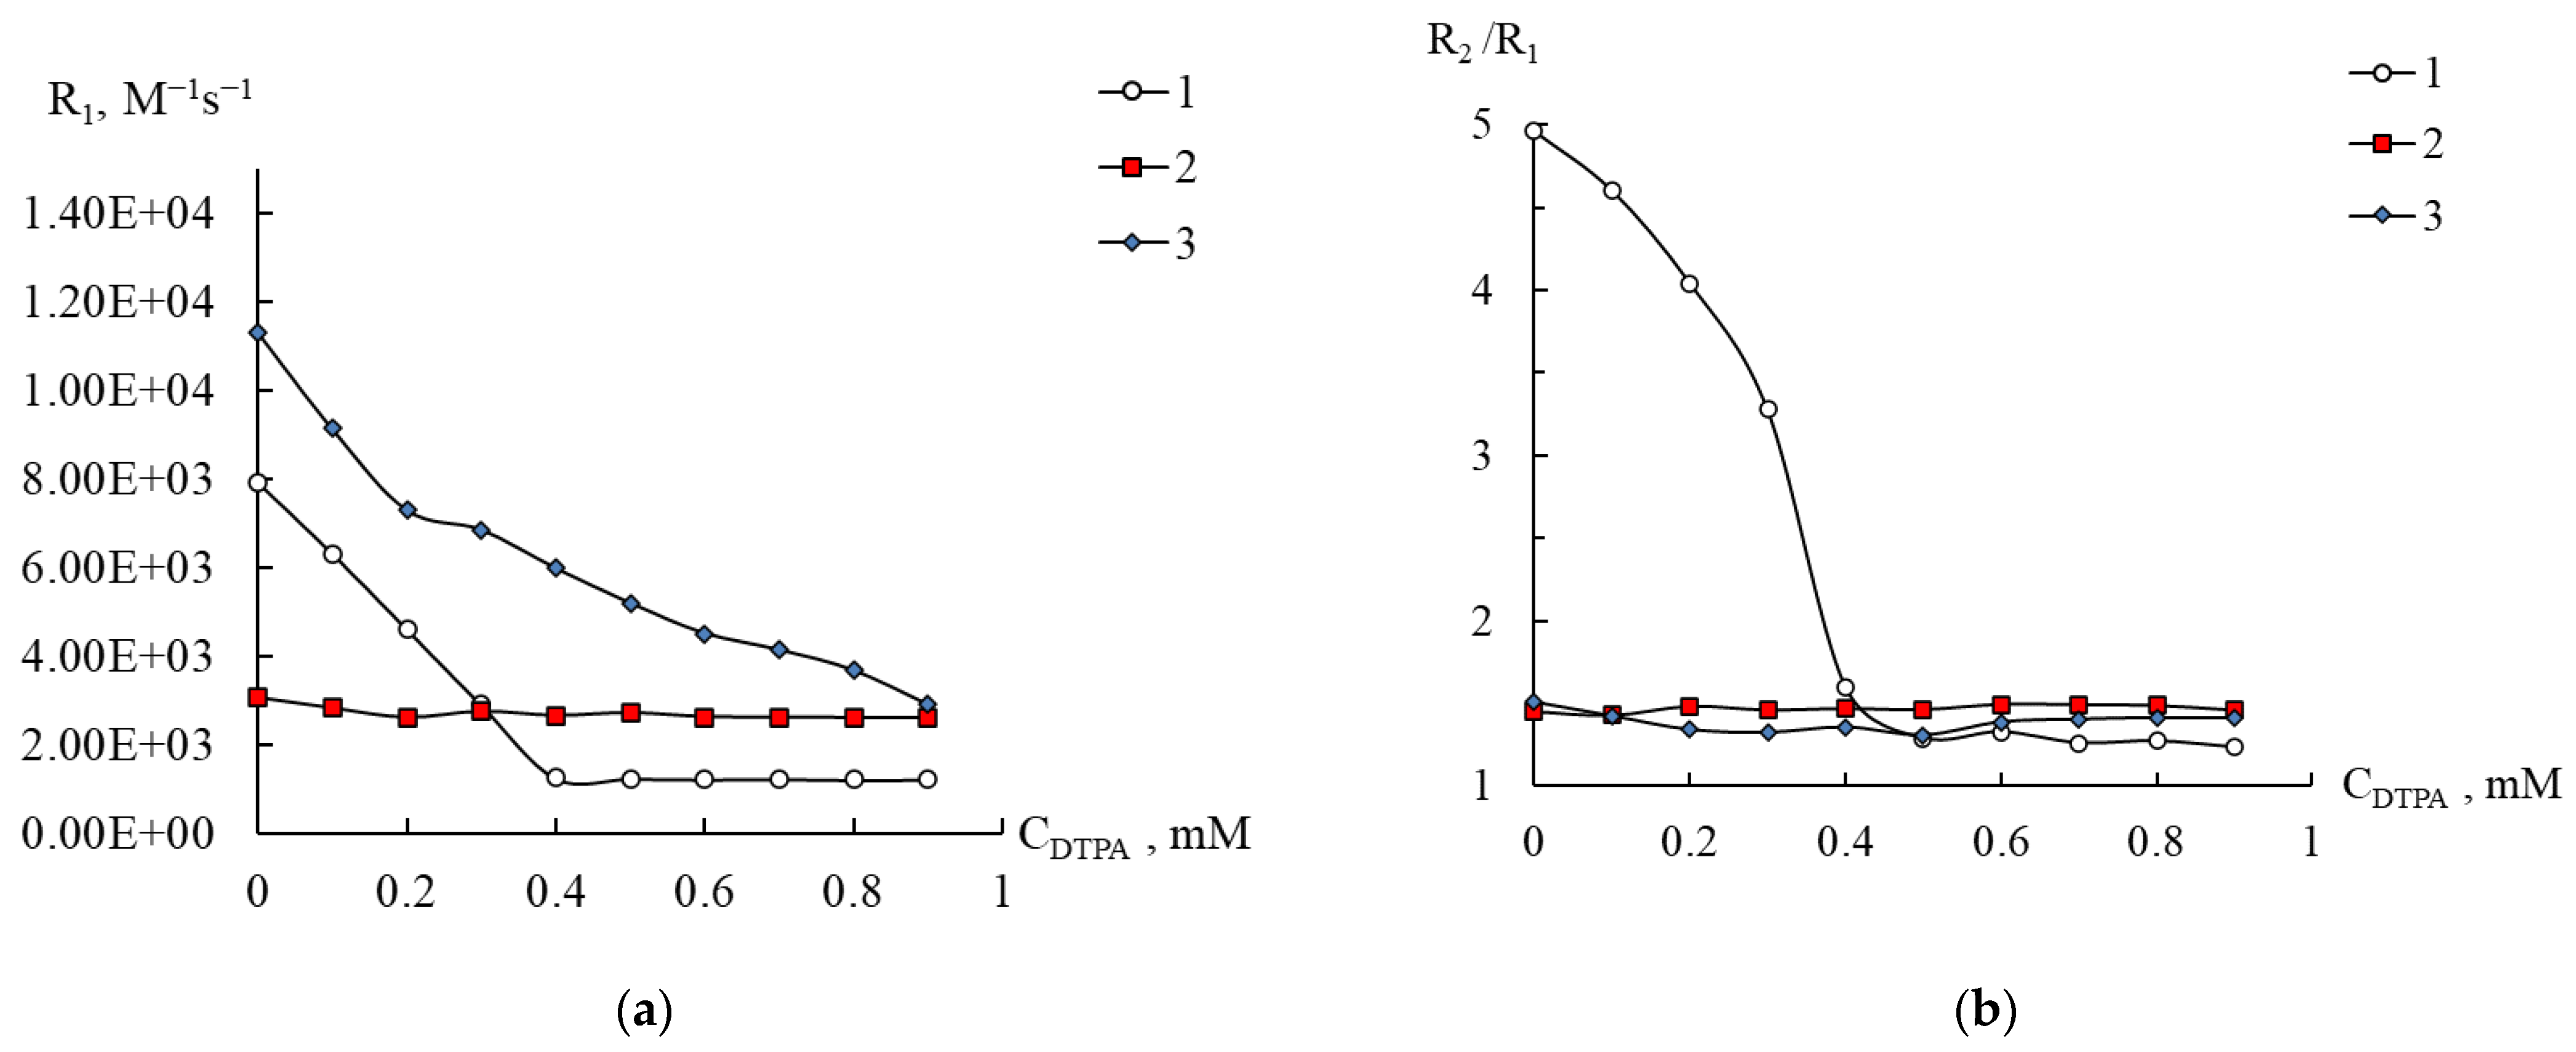
2.6. Stability of Compounds 1–3 in Complexone Solutions
3. Materials and Methods
3.1. General Information
3.2. Synthesis
3.3. NMR-Relaxation
3.4. Diffuse Reflectance Spectra
3.5. X-ray Diffraction on Single Crystals
3.6. X-ray Powder Diffraction
3.7. HPLC-ICP-AES
3.8. Quantum-Chemical Calculations
4. Conclusions
Supplementary Materials
Author Contributions
Funding
Data Availability Statement
Acknowledgments
Conflicts of Interest
References
- Grant, J.; Naeim, M.; Lee, Y.; Miya, D.; Kee, T.; Ho, D. Engineering Multifunctional Nanomedicine Platforms for Drug Delivery and Imaging. In Nanotheranostics for Cancer; Springer: Berlin/Heidelberg, Germany, 2019; pp. 319–344. [Google Scholar]
- Shigeta, S.; Mori, S.; Yamase, T.; Yamamoto, N.; Yamamoto, N. Anti-RNA virus activity of polyoxometalates. Biomed. Pharmacother. 2006, 60, 211–219. [Google Scholar] [CrossRef] [PubMed]
- Hosseini, S.M.; Amini, E.; Tavassoti Kheiri, M.; Mehrbod, P.; Shahidi, M.; Zabihi, E. Anti-influenza Activity of a Novel Polyoxometalate Derivative (POM-4960). Int. J. Mol. Cell. Med. 2012, 1, 21–29. [Google Scholar] [PubMed]
- Shahabadi, N.; Mahdavi, M.; Zendehcheshm, S. Can polyoxometalates (POMs) prevent of coronavirus 2019-nCoV cell entry? Interaction of POMs with TMPRSS2 and spike receptor domain complexed with ACE2 (ACE2-RBD): Virtual screening approaches. Inform. Med. Unlocked 2022, 29, 100902. [Google Scholar] [CrossRef] [PubMed]
- Aureliano, M. The Future Is Bright for Polyoxometalates. BioChem 2022, 2, 8–26. [Google Scholar] [CrossRef]
- Moussawi, M.A.; Haouas, M.; Floquet, S.; Shepard, W.E.; Abramov, P.A.; Sokolov, M.N.; Fedin, V.P.; Cordier, S.; Ponchel, A.; Monflier, E.; et al. Nonconventional Three-Component Hierarchical Host–Guest Assembly Based on Mo-Blue Ring-Shaped Giant Anion, γ-Cyclodextrin, and Dawson-type Polyoxometalate. J. Am. Chem. Soc. 2017, 139, 14376–14379. [Google Scholar] [CrossRef]
- Martín, S.; Takashima, Y.; Lin, C.-G.; Song, Y.-F.; Miras, H.N.; Cronin, L. Integrated Synthesis of Gold Nanoparticles Coated with Polyoxometalate Clusters. Inorg. Chem. 2019, 58, 4110–4116. [Google Scholar] [CrossRef]
- Wang, Y.; Weinstock, I.A. Polyoxometalate-decorated nanoparticles. Chem. Soc. Rev. 2012, 41, 7479. [Google Scholar] [CrossRef]
- Ruiz-Bilbao, E.; Pardo-Almanza, M.; Oyarzabal, I.; Artetxe, B.; Felices, L.S.; García, J.A.; Seco, J.M.; Colacio, E.; Lezama, L.; Gutiérrez-Zorrilla, J.M. Slow Magnetic Relaxation and Luminescent Properties of Mononuclear Lanthanide-Substituted Keggin-Type Polyoxotungstates with Compartmental Organic Ligands. Inorg. Chem. 2022, 61, 2428–2443. [Google Scholar] [CrossRef]
- Ibrahim, M.; Rudszuck, T.; Kerdi, B.; Krämer, S.; Guthausen, G.; Powell, A.K. Comparative NMR Relaxivity Study of Polyoxometalate-Based Clusters [Mn4(H2O)2(P2W1SO56)2]16− and [{Dy(H2O)6}2Mn4(H2O)2(P2W15O56)2]10− from 20 MHz to 1.2 GHz. Appl. Magn. Reson. 2020, 51, 1295–1305. [Google Scholar] [CrossRef]
- Müller, A.; Das, S.K.; Talismanova, M.O.; Bögge, H.; Kögerler, P.; Schmidtmann, M.; Talismanov, S.S.; Luban, M.; Krickemeyer, E. Paramagnetic Keplerate “Necklaces” Synthesized by a Novel Room-Temperature Solid-State Reaction: Controlled Linking of Metal-Oxide-Based Nanoparticles. Angew. Chem. Int. Ed. 2002, 41, 579–582. [Google Scholar] [CrossRef]
- Tsunashima, R.; Richmond, C.; Cronin, L. Exploring the mobility of nanoscale polyoxometalates using gel electrophoresis. Chem. Sci. 2012, 3, 343–348. [Google Scholar] [CrossRef]
- Ostroushko, A.A.; Gette, I.F.; Danilova, I.G.; Mukhlynina, E.A.; Tonkushina, M.O.; Grzhegorzhevskii, K.V. Studies on the possibility of introducing iron-molybdenum buckyballs into an organism by electrophoresis. Nanotechnol. Russ. 2014, 9, 577–582. [Google Scholar] [CrossRef]
- Drahoš, B.; Lukeš, I.; Tóth, É. Manganese(II) Complexes as Potential Contrast Agents for MRI. Eur. J. Inorg. Chem. 2012, 2012, 1975–1986. [Google Scholar] [CrossRef]
- Daksh, S.; Kaul, A.; Deep, S.; Datta, A. Current advancement in the development of manganese complexes as magnetic resonance imaging probes. J. Inorg. Biochem. 2022, 237, 112018. [Google Scholar] [CrossRef]
- Nagendraraj, T.; Kumaran, S.S.; Mayilmurugan, R. Mn(II) complexes of phenylenediamine based macrocyclic ligands as T1-MRI contrast agents. J. Inorg. Biochem. 2022, 228, 111684. [Google Scholar] [CrossRef] [PubMed]
- Qin, R.; Li, S.; Qiu, Y.; Feng, Y.; Liu, Y.; Ding, D.; Xu, L.; Ma, X.; Sun, W.; Chen, H. Carbonized paramagnetic complexes of Mn (II) as contrast agents for precise magnetic resonance imaging of sub-millimeter-sized orthotopic tumors. Nat. Commun. 2022, 13, 1938. [Google Scholar] [CrossRef] [PubMed]
- Li, Z.; Li, W.; Li, X.; Pei, F.; Wang, X.; Lei, H. Mn(II)-monosubstituted polyoxometalates as candidates for contrast agents in magnetic resonance imaging. J. Inorg. Biochem. 2007, 101, 1036–1042. [Google Scholar] [CrossRef]
- Pan, D.; Caruthers, S.D.; Senpan, A.; Schmieder, A.H.; Wickline, S.A.; Lanza, G.M. Revisiting an old friend: Manganese-based MRI contrast agents. Wiley Interdiscip. Rev. Nanomed. Nanobiotechnol. 2011, 3, 162–173. [Google Scholar] [CrossRef]
- Popel, A.A. Magnetic Relaxation Method of Analysis of Inorganic Substances (in Russian); Khimiya: Moscow, Russia, 1978. [Google Scholar]
- Amirov, R.R.; Burilova, E.A.; Zhuravleva, Y.I.; Zakharov, A.V.; Ziyatdinova, A.B. NMR paramagnetic probing of polymer solutions using manganese(II) ions. Polym. Sci. Ser. C 2017, 59, 133–140. [Google Scholar] [CrossRef]
- Amirov, R.R.; Burilova, E.A.; McMillan, Z.T.; Amirova, L.R.; Ziyatdinova, A.B.; Shayimova, J.R.; Bukharov, M.S.; Dimiev, A.M.; Zakharov, A.V. An NMR relaxivity and ESR study of the interaction of the paramagnetic manganese(II) and gadolinium(III) ions with anionic, cationic and neutral water-soluble polymers and their mixtures. J. Mol. Liq. 2017, 238, 184–192. [Google Scholar] [CrossRef]
- Amirov, R.R.; Shayimova, J.; Nasirova, Z.; Dimiev, A.M. Chemistry of graphene oxide. Reactions with transition metal cations. Carbon N. Y. 2017, 116, 356–365. [Google Scholar] [CrossRef]
- Burilova, E.A.; Vagapova, L.I.; Nasirova, Z.A.; Nikitina, T.V.; Solodov, A.N.; Shaiymova, J.R.; Amirov, R.R. Peculiarities of Manganese(II) Interaction with Hydroxyethylidene Diphosphonic Acid and Aminomethylated Calix[4]resorcinol in Organized Media. Uchenye Zap. Kazan. Univ. Seriya Estestv. Nauk. 2019, 161, 199–210. [Google Scholar] [CrossRef]
- Burilova, E.A.; Ziyatdinova, A.B.; Zyavkina, Y.I.; Amirov, R. Influence of Water-soluble Polymers on the Formation of Manganese (II) Complexonates in Solutions. 1. Complexes with EDTA. Proc. Kazan Univ. Nat. Sci. Zap. Kazan. Univ. Seriya Estestv. Nauk. 2013, 155, 10–25. [Google Scholar]
- Burilova, E.A.; Ziyatdinova, A.B.; Zyavkina, Y.I.; Amirov, R.R. Influence of Water-soluble Polymers on the Formation of Manganese(II) Complexonates in Solutions. 2. Complexes with DTPA. Proc. Kazan Univ. Nat. Sci. Ser. 2013, 155, 26–38. [Google Scholar]
- Patel, K.; Shringarpure, P.; Patel, A. One-step synthesis of a Keggin-type manganese(II)-substituted phosphotungstate: Structural and spectroscopic characterization and non-solvent liquid phase oxidation of styrene. Transit. Met. Chem. 2011, 36, 171–177. [Google Scholar] [CrossRef]
- Bösing, M.; Nöh, A.; Loose, I.; Krebs, B. Highly efficient catalysts in directed oxygen-transfer processes: Synthesis, structures of novel manganese-containing heteropolyanions, and applications in regioselective epoxidation of dienes with hydrogen peroxide. J. Am. Chem. Soc. 1998, 120, 7252–7259. [Google Scholar] [CrossRef]
- Abramov, P.A.; Peresypkina, E.V.; Izarova, N.V.; Vicent, C.; Zhdanov, A.A.; Kompankov, N.B.; Gutsul, T.; Sokolov, M.N. Polyoxoanions assembled by the condensation of vanadate, tungstate and selenite: Solution studies and crystal structures of the mixed metal derivatives (NMe4)2Na2[WVI4VV2O19]·8H2O and (NMe4)4.83[(SeIV WVI4.57VV4.43O33)2(WVI(O)(H2O))(VVO)2.6]·10.57H2O. New J. Chem. 2016, 40, 937–944. [Google Scholar] [CrossRef]
- Wang, J.-P.; Ma, P.-T.; Li, J.; Niu, H.-Y.; Niu, J.-Y. Self-Assembly of [B-SbW9O33]9− Subunit with Transition Metal Ions (Mn2+, Cu2+, Co2+) in Aqueous Solution: Syntheses, Structures and Magnetic Properties of Sandwich Type Polyoxometalates with Subvalent SbIII Heteroatom. Chem.–An Asian J. 2008, 3, 822–833. [Google Scholar] [CrossRef]
- Su, X.-F.; Guan, W.; Yan, L.-K.; Lang, Z.-L.; Su, Z.-M. Evidence of two-state reactivity in water oxidation catalyzed by polyoxometalate-based complex [Mn3(H2O)3(SbW9O33)2]12−. J. Catal. 2019, 376, 146–149. [Google Scholar] [CrossRef]
- Volkmer, D.; Bredenkötter, B.; Tellenbröker, J.; Kögerler, P.; Kurth, D.G.; Lehmann, P.; Schnablegger, H.; Schwahn, D.; Piepenbrink, M.; Krebs, B. Structure and Properties of the Dendron-Encapsulated Polyoxometalate (C52H60NO12)12[(Mn(H2O))3(SbW9O33)2], a First Generation Dendrizyme. J. Am. Chem. Soc. 2002, 124, 10489–10496. [Google Scholar] [CrossRef]
- Neumann, R.; Gara, M. Highly Active Manganese-Containing Polyoxometalate as Catalyst for Epoxidation of Alkenes with Hydrogen Peroxide. J. Am. Chem. Soc. 1994, 116, 5509–5510. [Google Scholar] [CrossRef]
- Shuvaeva, O.V.; Zhdanov, A.A.; Romanova, T.E.; Abramov, P.A.; Sokolov, M.N. Hyphenated techniques in speciation analysis of polyoxometalates: Identification of individual [PMo12−xVxO40]−3−x (x = 1–3) in the reaction mixtures by high performance liquid chromatography and atomic emission spectrometry with inductively coupled. Dalton Trans. 2017, 46, 3541–3546. [Google Scholar] [CrossRef] [PubMed]
- Mukhacheva, A.A.; Volcheck, V.V.; Sheven, D.G.; Yanshole, V.V.; Kompankov, N.B.; Haouas, M.; Abramov, P.A.; Sokolov, M.N. Coordination capacity of Keggin anions as polytopic ligands: Case study of [VNb12O40]15−. Dalton Trans. 2021, 50, 7078–7084. [Google Scholar] [CrossRef] [PubMed]
- Mukhacheva, A.A.; Shmakova, A.A.; Volchek, V.V.; Romanova, T.E.; Benassi, E.; Gushchin, A.L.; Yanshole, V.; Sheven, D.G.; Kompankov, N.B.; Abramov, P.A.; et al. Reactions of [Ru(NO)Cl5]2− with pseudotrilacunary {XW9O33}9− (X = AsIII, SbIII) anions. Dalton Trans. 2019, 48, 15989–15999. [Google Scholar] [CrossRef] [PubMed]
- Kuznetsova, A.A.; Volchek, V.V.; Yanshole, V.V.; Fedorenko, A.D.; Kompankov, N.B.; Kokovkin, V.V.; Gushchin, A.L.; Abramov, P.A.; Sokolov, M.N. Coordination of Pt(IV) by {P8W48} Macrocyclic Inorganic Cavitand: Structural, Solution, and Electrochemical Studies. Inorg. Chem. 2022, 61, 14560–14567. [Google Scholar] [CrossRef]
- Ritchie, C.; Alley, K.G.; Boskovic, C. Lacunary tungstotellurates(iv): [Te2W17O61]12−, [Te2W16O58(OH)2]14− and [Te2W18O62(OH)2]10−. Dalton Trans. 2010, 39, 8872. [Google Scholar] [CrossRef]
- Amirov, R.R. Metal Complexes as Magnetic Relaxation Probes for Highly Ordered Media: Application in Magnetic Resonance Tomography and Solution Chemistry (in Russian); Novoe Znanie: Kazan, Russia, 2005. [Google Scholar]
- Shayapov, V.R.; Usoltsev, A.N.; Adonin, S.A.; Sokolov, M.N.; Samsonenko, D.G.; Fedin, V.P. Thermochromism of bromotellurates(iv): Experimental insights. New J. Chem. 2019, 43, 3927–3930. [Google Scholar] [CrossRef]
- Sheldrick, G.M. SHELXT–Integrated space-group and crystal-structure determination. Acta Crystallogr. Sect. A Found. Adv. 2015, 71, 3–8. [Google Scholar] [CrossRef]
- Sheldrick, G.M. Crystal structure refinement with SHELXL. Acta Crystallogr. Sect. C Struct. Chem. 2015, 71, 3–8. [Google Scholar] [CrossRef]
- Hübschle, C.B.; Sheldrick, G.M.; Dittrich, B. ShelXle: A Qt graphical user interface for SHELXL. J. Appl. Crystallogr. 2011, 44, 1281–1284. [Google Scholar] [CrossRef]
- Becke, A.D. Density-functional thermochemistry. III. The role of exact exchange. J. Chem. Phys. 1993, 98, 5648–5652. [Google Scholar] [CrossRef]
- Lee, C.; Yang, W.; Parr, R.G. Development of the Colle-Salvetti correlation-energy formula into a functional of the electron density. Phys. Rev. B 1988, 37, 785–789. [Google Scholar] [CrossRef] [PubMed]
- Hay, P.J.; Wadt, W.R. Ab initio effective core potentials for molecular calculations. Potentials for the transition metal atoms Sc to Hg. J. Chem. Phys. 1985, 82, 270–283. [Google Scholar] [CrossRef]
- Wadt, W.R.; Hay, P.J. Ab initio effective core potentials for molecular calculations. Potentials for main group elements Na to Bi. J. Chem. Phys. 1985, 82, 284–298. [Google Scholar] [CrossRef]
- Hay, P.J.; Wadt, W.R. Ab initio effective core potentials for molecular calculations. Potentials for K to Au including the outermost core orbitals. J. Chem. Phys. 1985, 82, 299–310. [Google Scholar] [CrossRef]
- Grimme, S.; Ehrlich, S.; Goerigk, L. Effect of the damping function in dispersion corrected density functional theory. J. Comput. Chem. 2011, 32, 1456–1465. [Google Scholar] [CrossRef] [PubMed]
- Martin, R.L. Natural transition orbitals. J. Chem. Phys. 2003, 118, 4775–4777. [Google Scholar] [CrossRef]
- Frisch, M.J.; Trucks, G.W.; Schlegel, H.B.; Scuseria, G.E.; Robb, M.A.; Cheeseman, J.R.; Scalmani, G.; Barone, V.; Petersson, G.A.; Nakatsuji, H.; et al. Gaussian 16, Revision C.01; Gaussian, Inc.: Wallingford CT, USA, 2016. [Google Scholar]


Disclaimer/Publisher’s Note: The statements, opinions and data contained in all publications are solely those of the individual author(s) and contributor(s) and not of MDPI and/or the editor(s). MDPI and/or the editor(s) disclaim responsibility for any injury to people or property resulting from any ideas, methods, instructions or products referred to in the content. |
© 2023 by the authors. Licensee MDPI, Basel, Switzerland. This article is an open access article distributed under the terms and conditions of the Creative Commons Attribution (CC BY) license (https://creativecommons.org/licenses/by/4.0/).
Share and Cite
Korenev, V.S.; Burilova, E.A.; Volchek, V.V.; Benassi, E.; Amirov, R.R.; Sokolov, M.N.; Abramov, P.A. NMR-Relaxometric Investigation of Mn(II)-Doped Polyoxometalates in Aqueous Solutions. Int. J. Mol. Sci. 2023, 24, 7308. https://doi.org/10.3390/ijms24087308
Korenev VS, Burilova EA, Volchek VV, Benassi E, Amirov RR, Sokolov MN, Abramov PA. NMR-Relaxometric Investigation of Mn(II)-Doped Polyoxometalates in Aqueous Solutions. International Journal of Molecular Sciences. 2023; 24(8):7308. https://doi.org/10.3390/ijms24087308
Chicago/Turabian StyleKorenev, Vladimir S., Evgenia A. Burilova, Victoria V. Volchek, Enrico Benassi, Rustem R. Amirov, Maxim N. Sokolov, and Pavel A. Abramov. 2023. "NMR-Relaxometric Investigation of Mn(II)-Doped Polyoxometalates in Aqueous Solutions" International Journal of Molecular Sciences 24, no. 8: 7308. https://doi.org/10.3390/ijms24087308
APA StyleKorenev, V. S., Burilova, E. A., Volchek, V. V., Benassi, E., Amirov, R. R., Sokolov, M. N., & Abramov, P. A. (2023). NMR-Relaxometric Investigation of Mn(II)-Doped Polyoxometalates in Aqueous Solutions. International Journal of Molecular Sciences, 24(8), 7308. https://doi.org/10.3390/ijms24087308