

Circulating Immune Proteins: Improving the Diagnosis and Clinical Outcome in Advanced Non-Small Cell Lung Cancer

 , , , , and
Abstract
:1. Introduction
2. Results
2.1. Clinical Characteristics of NSCLC Patients and Biomarker Assessment
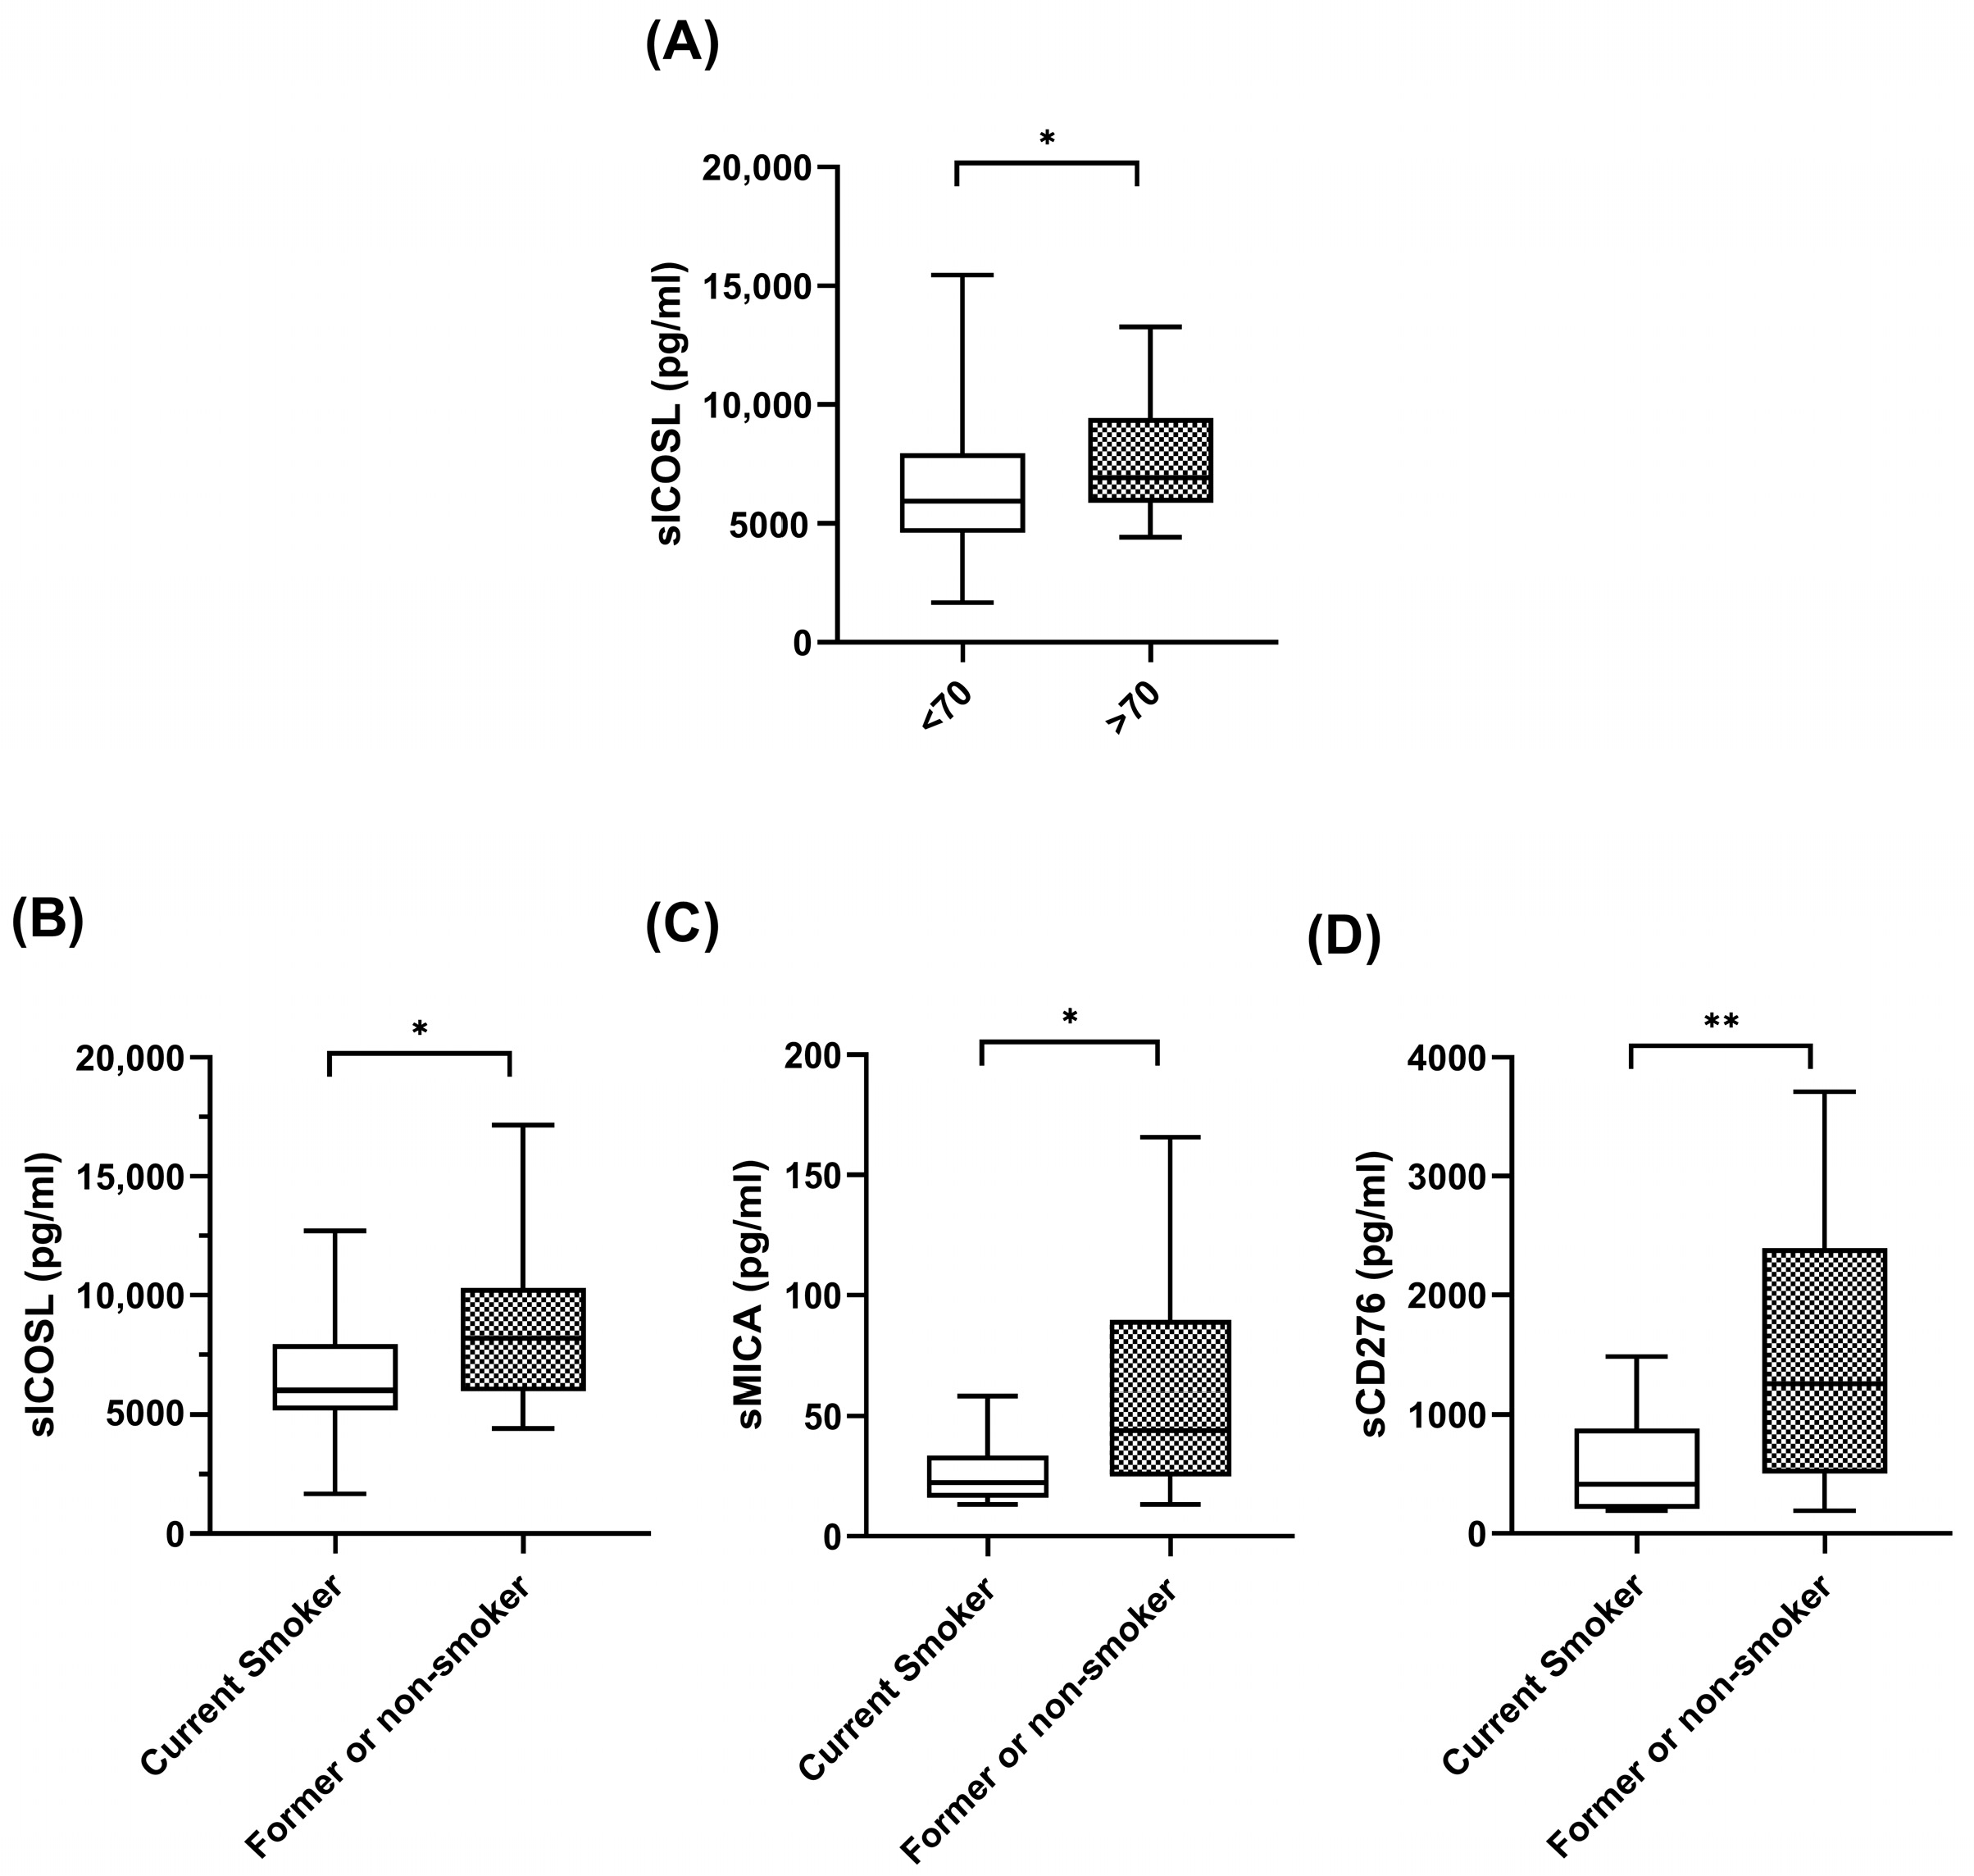
2.2. Correlations between Clinical Characteristics of NSCLC Patients and Biomarker Assessment
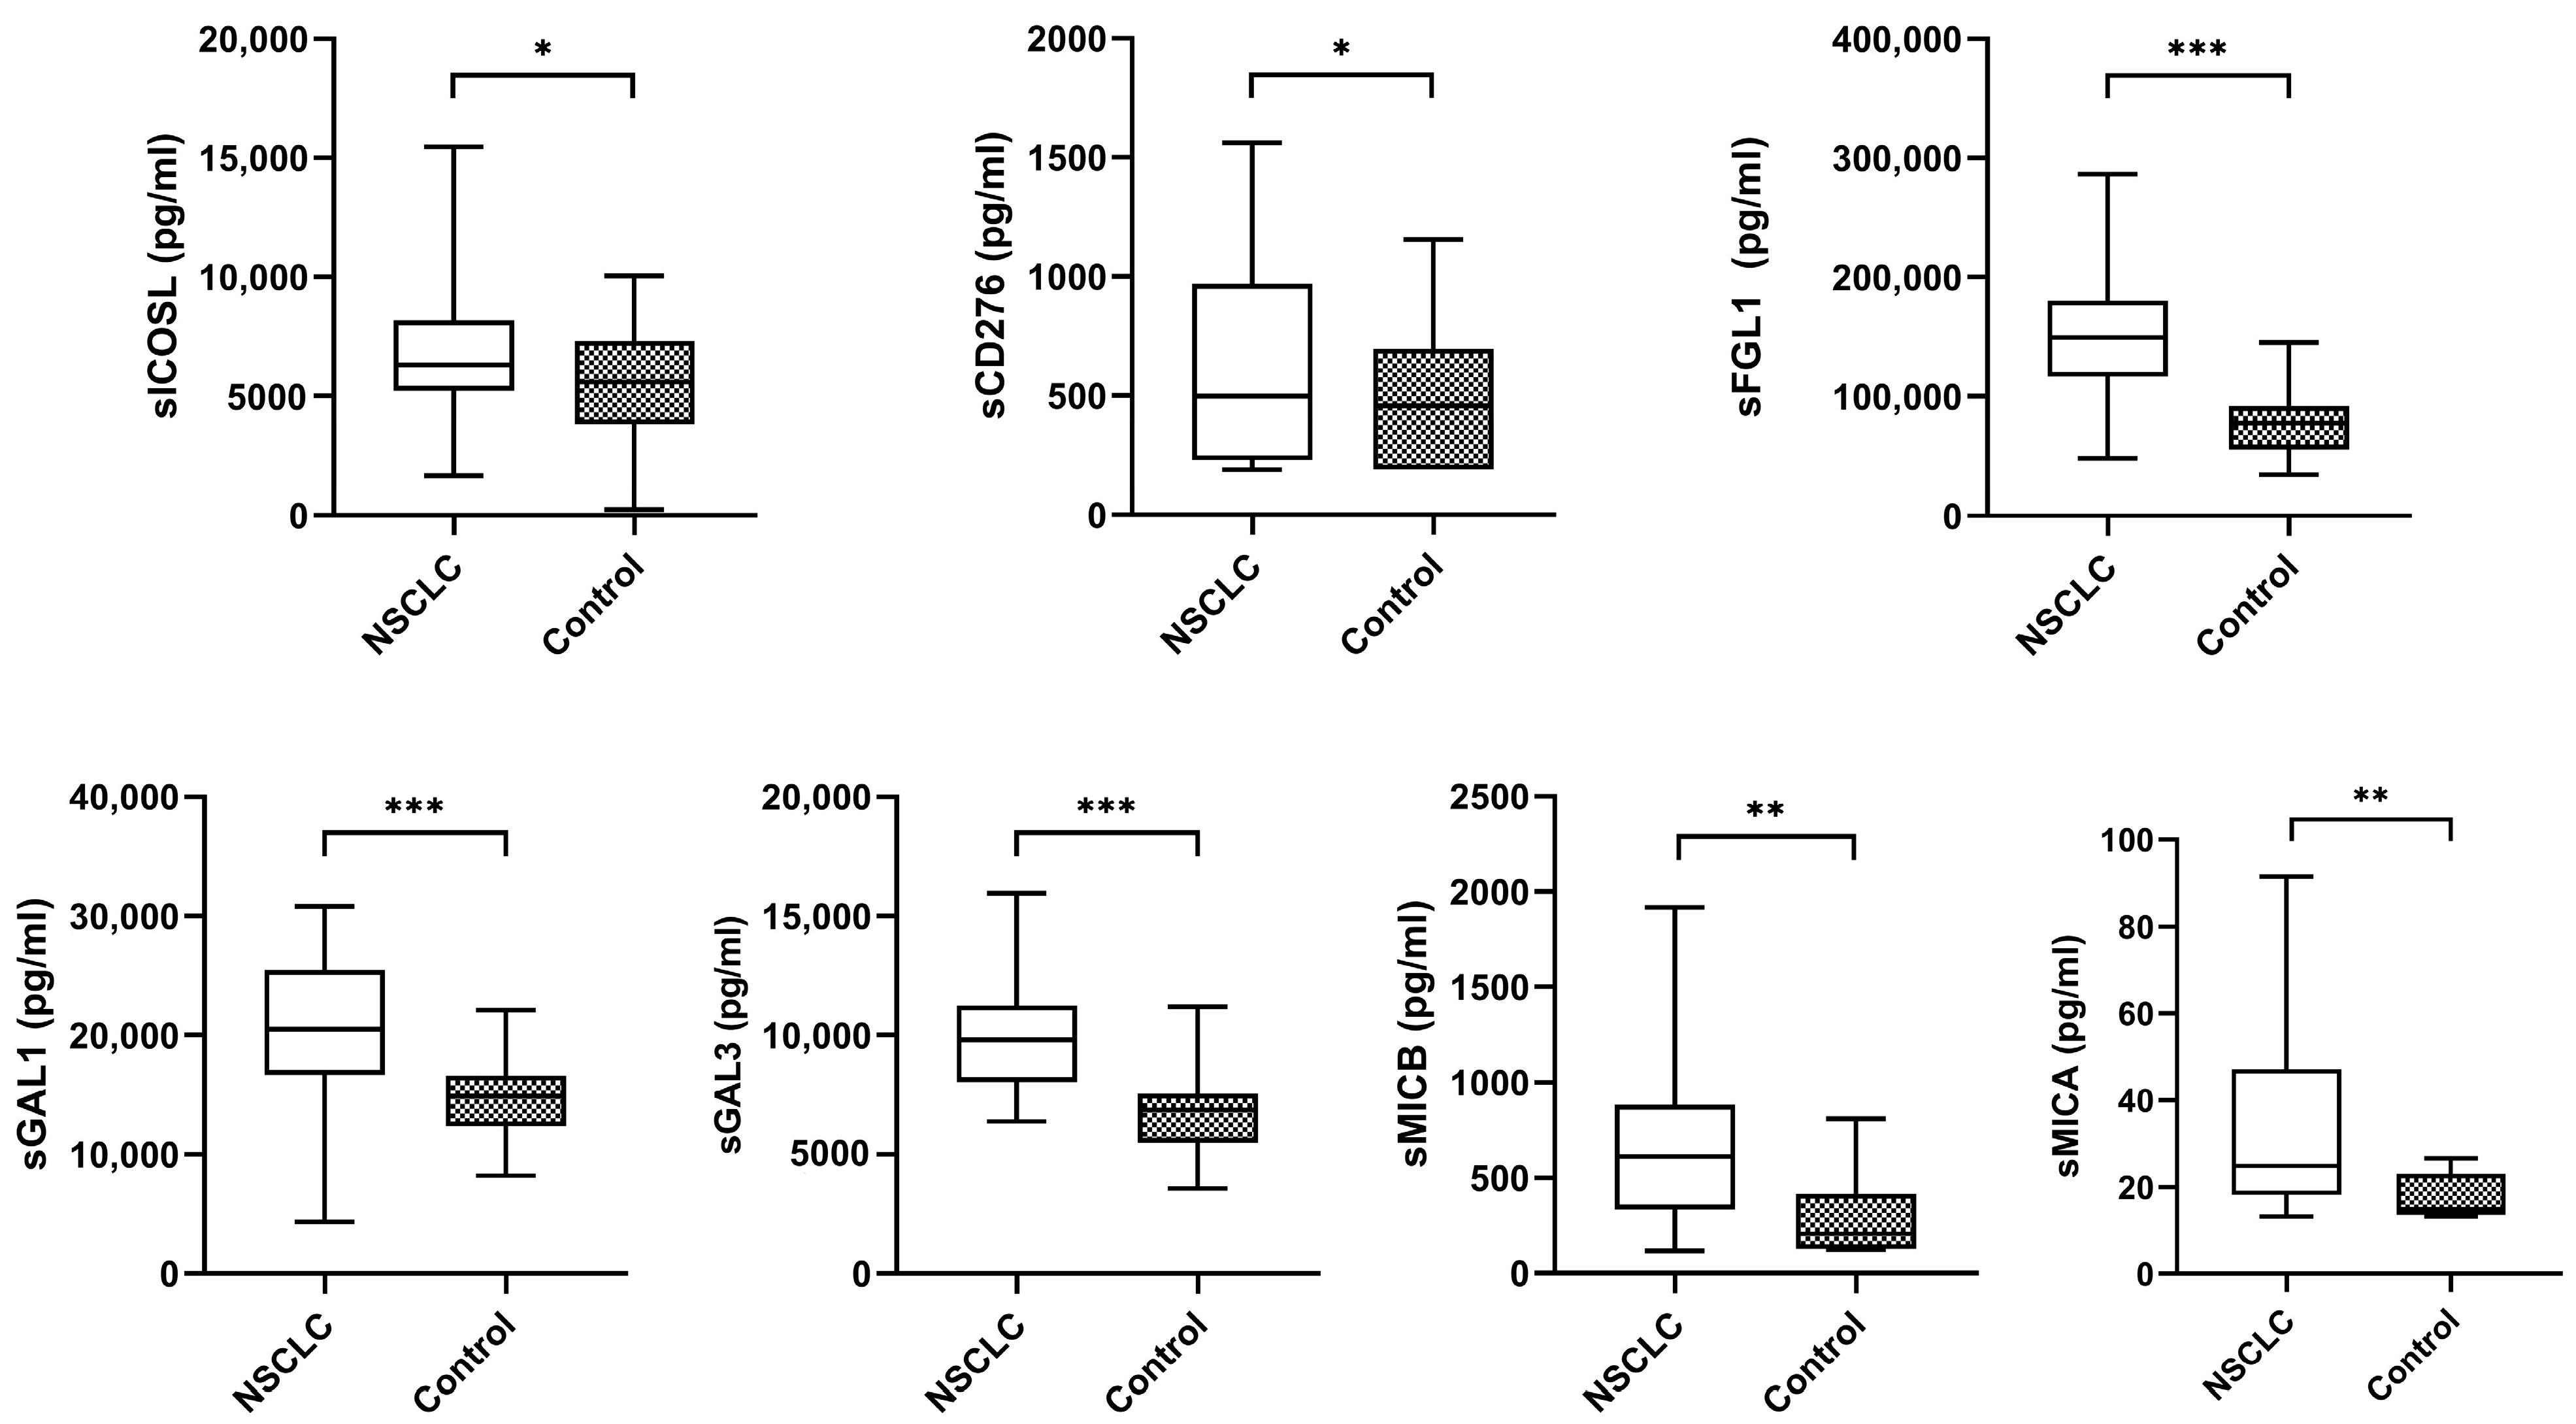
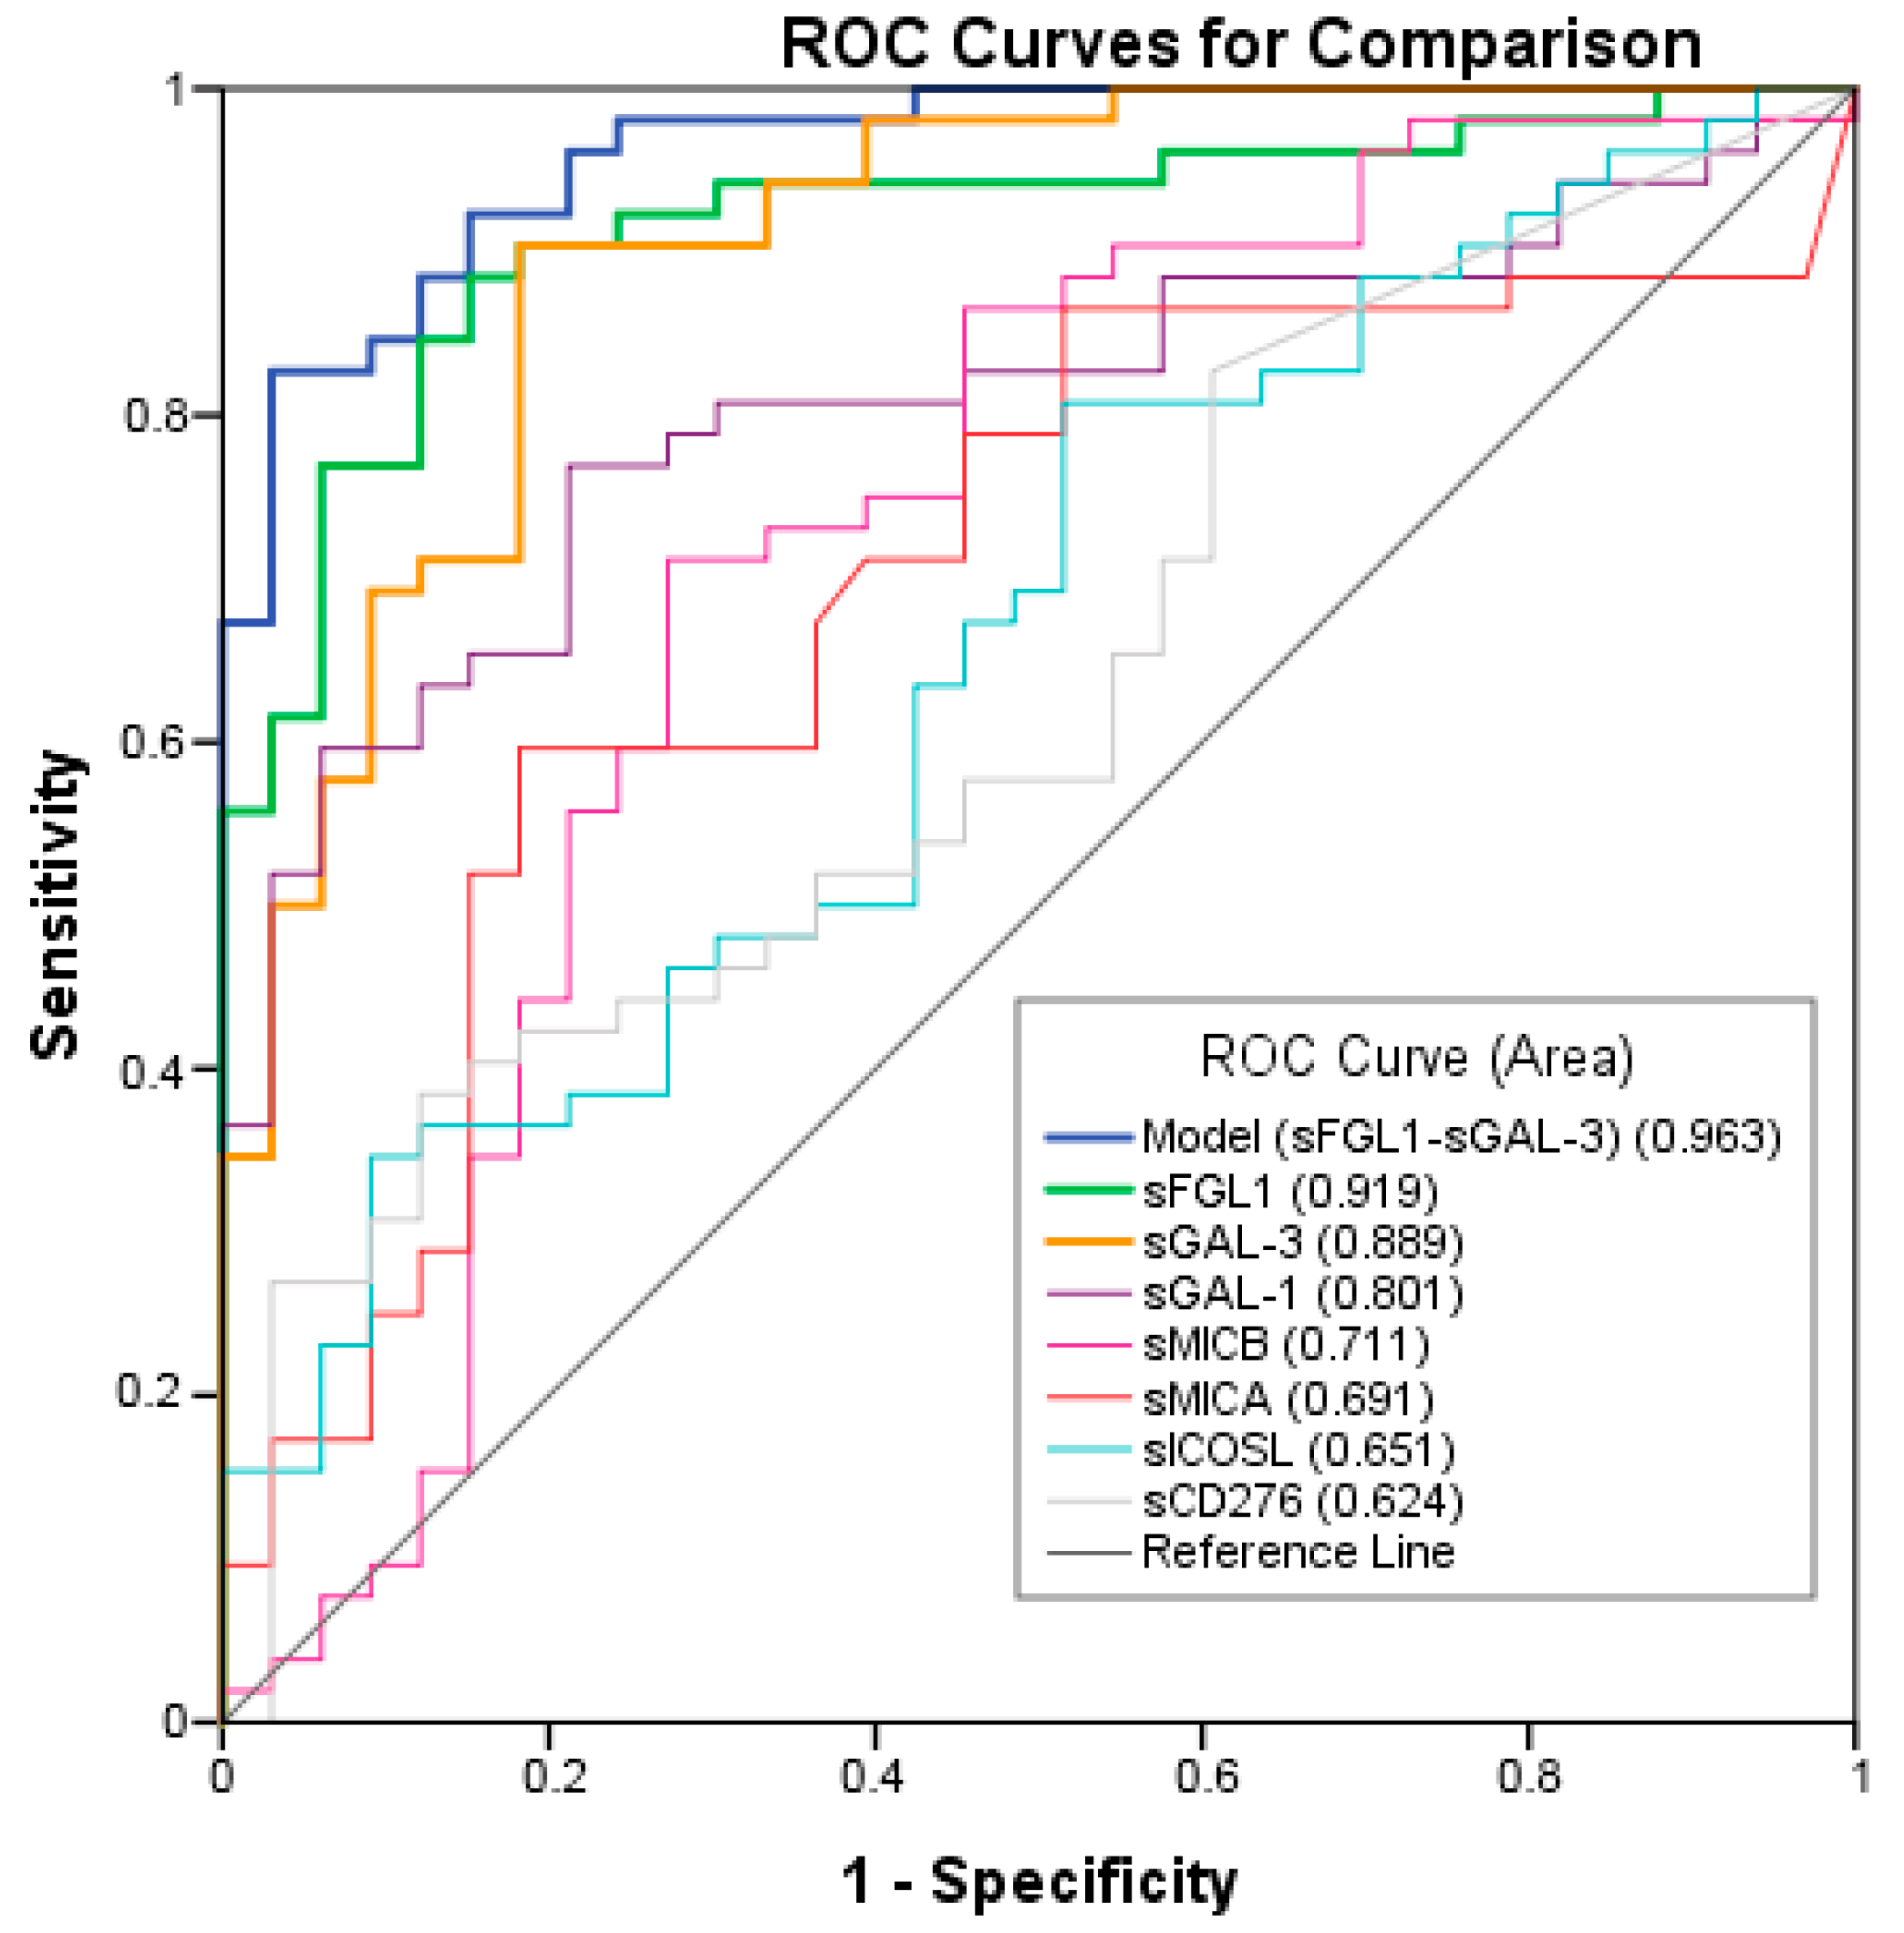
2.3. Biomarkers with Diagnostic Value
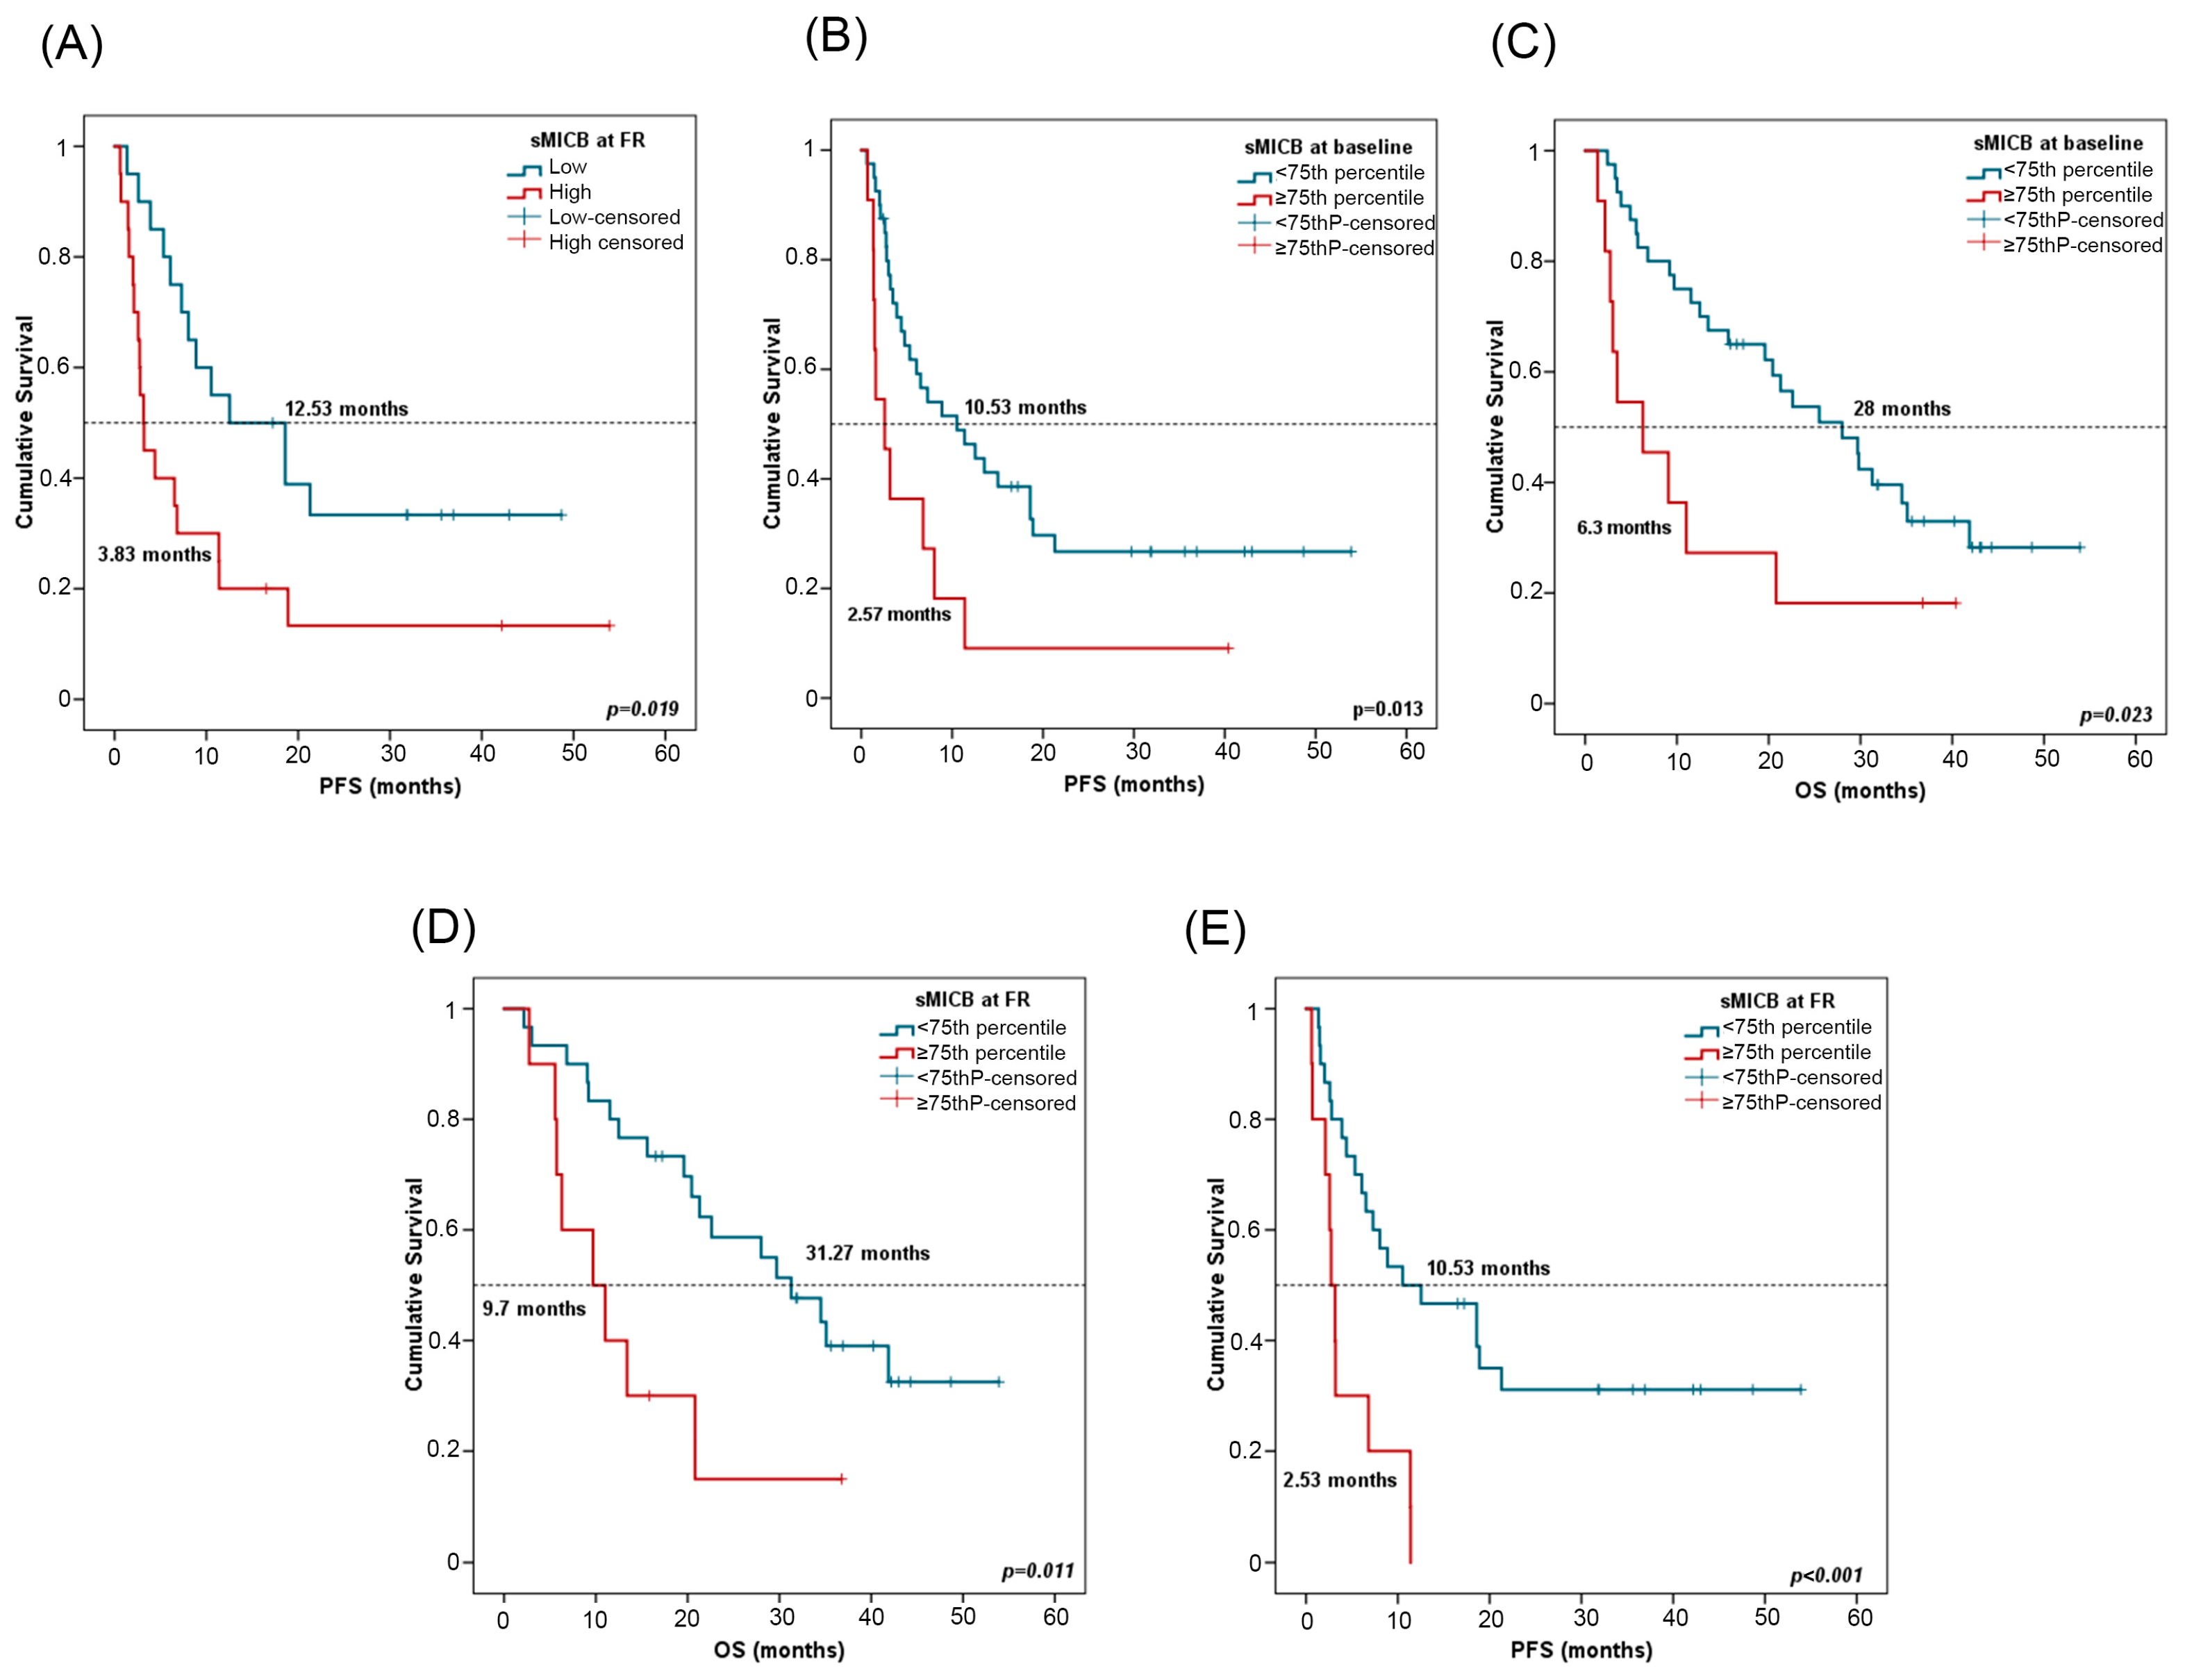
2.4. Correlation of Plasma Biomarkers Levels with Response (ORR and Clinical Benefit) and Survival
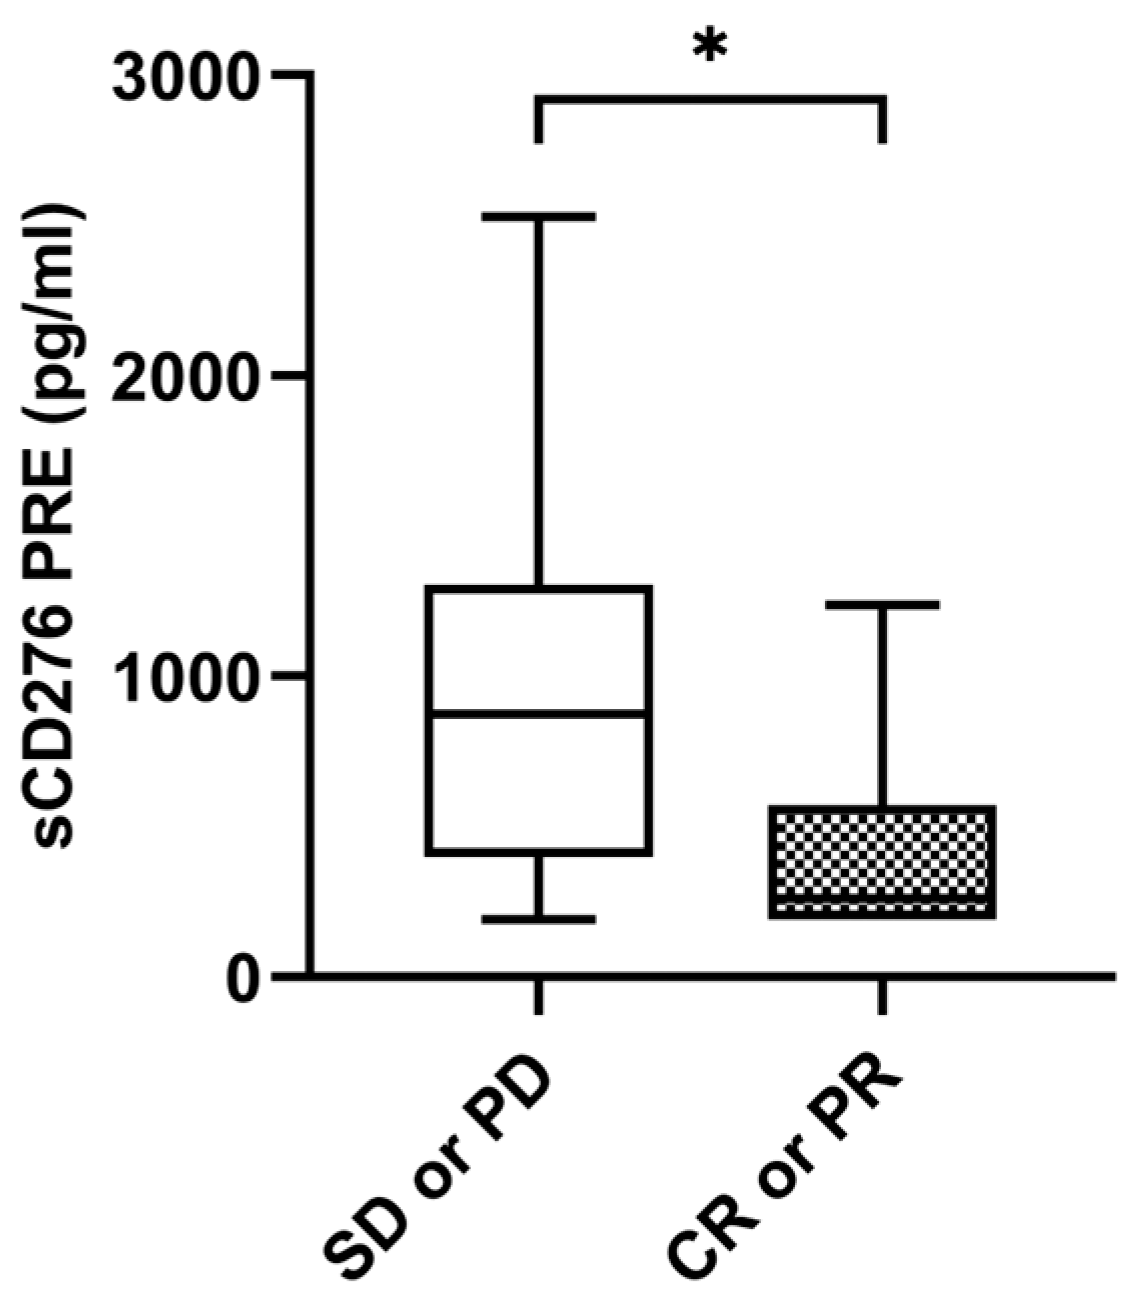
2.4.1. sCD276
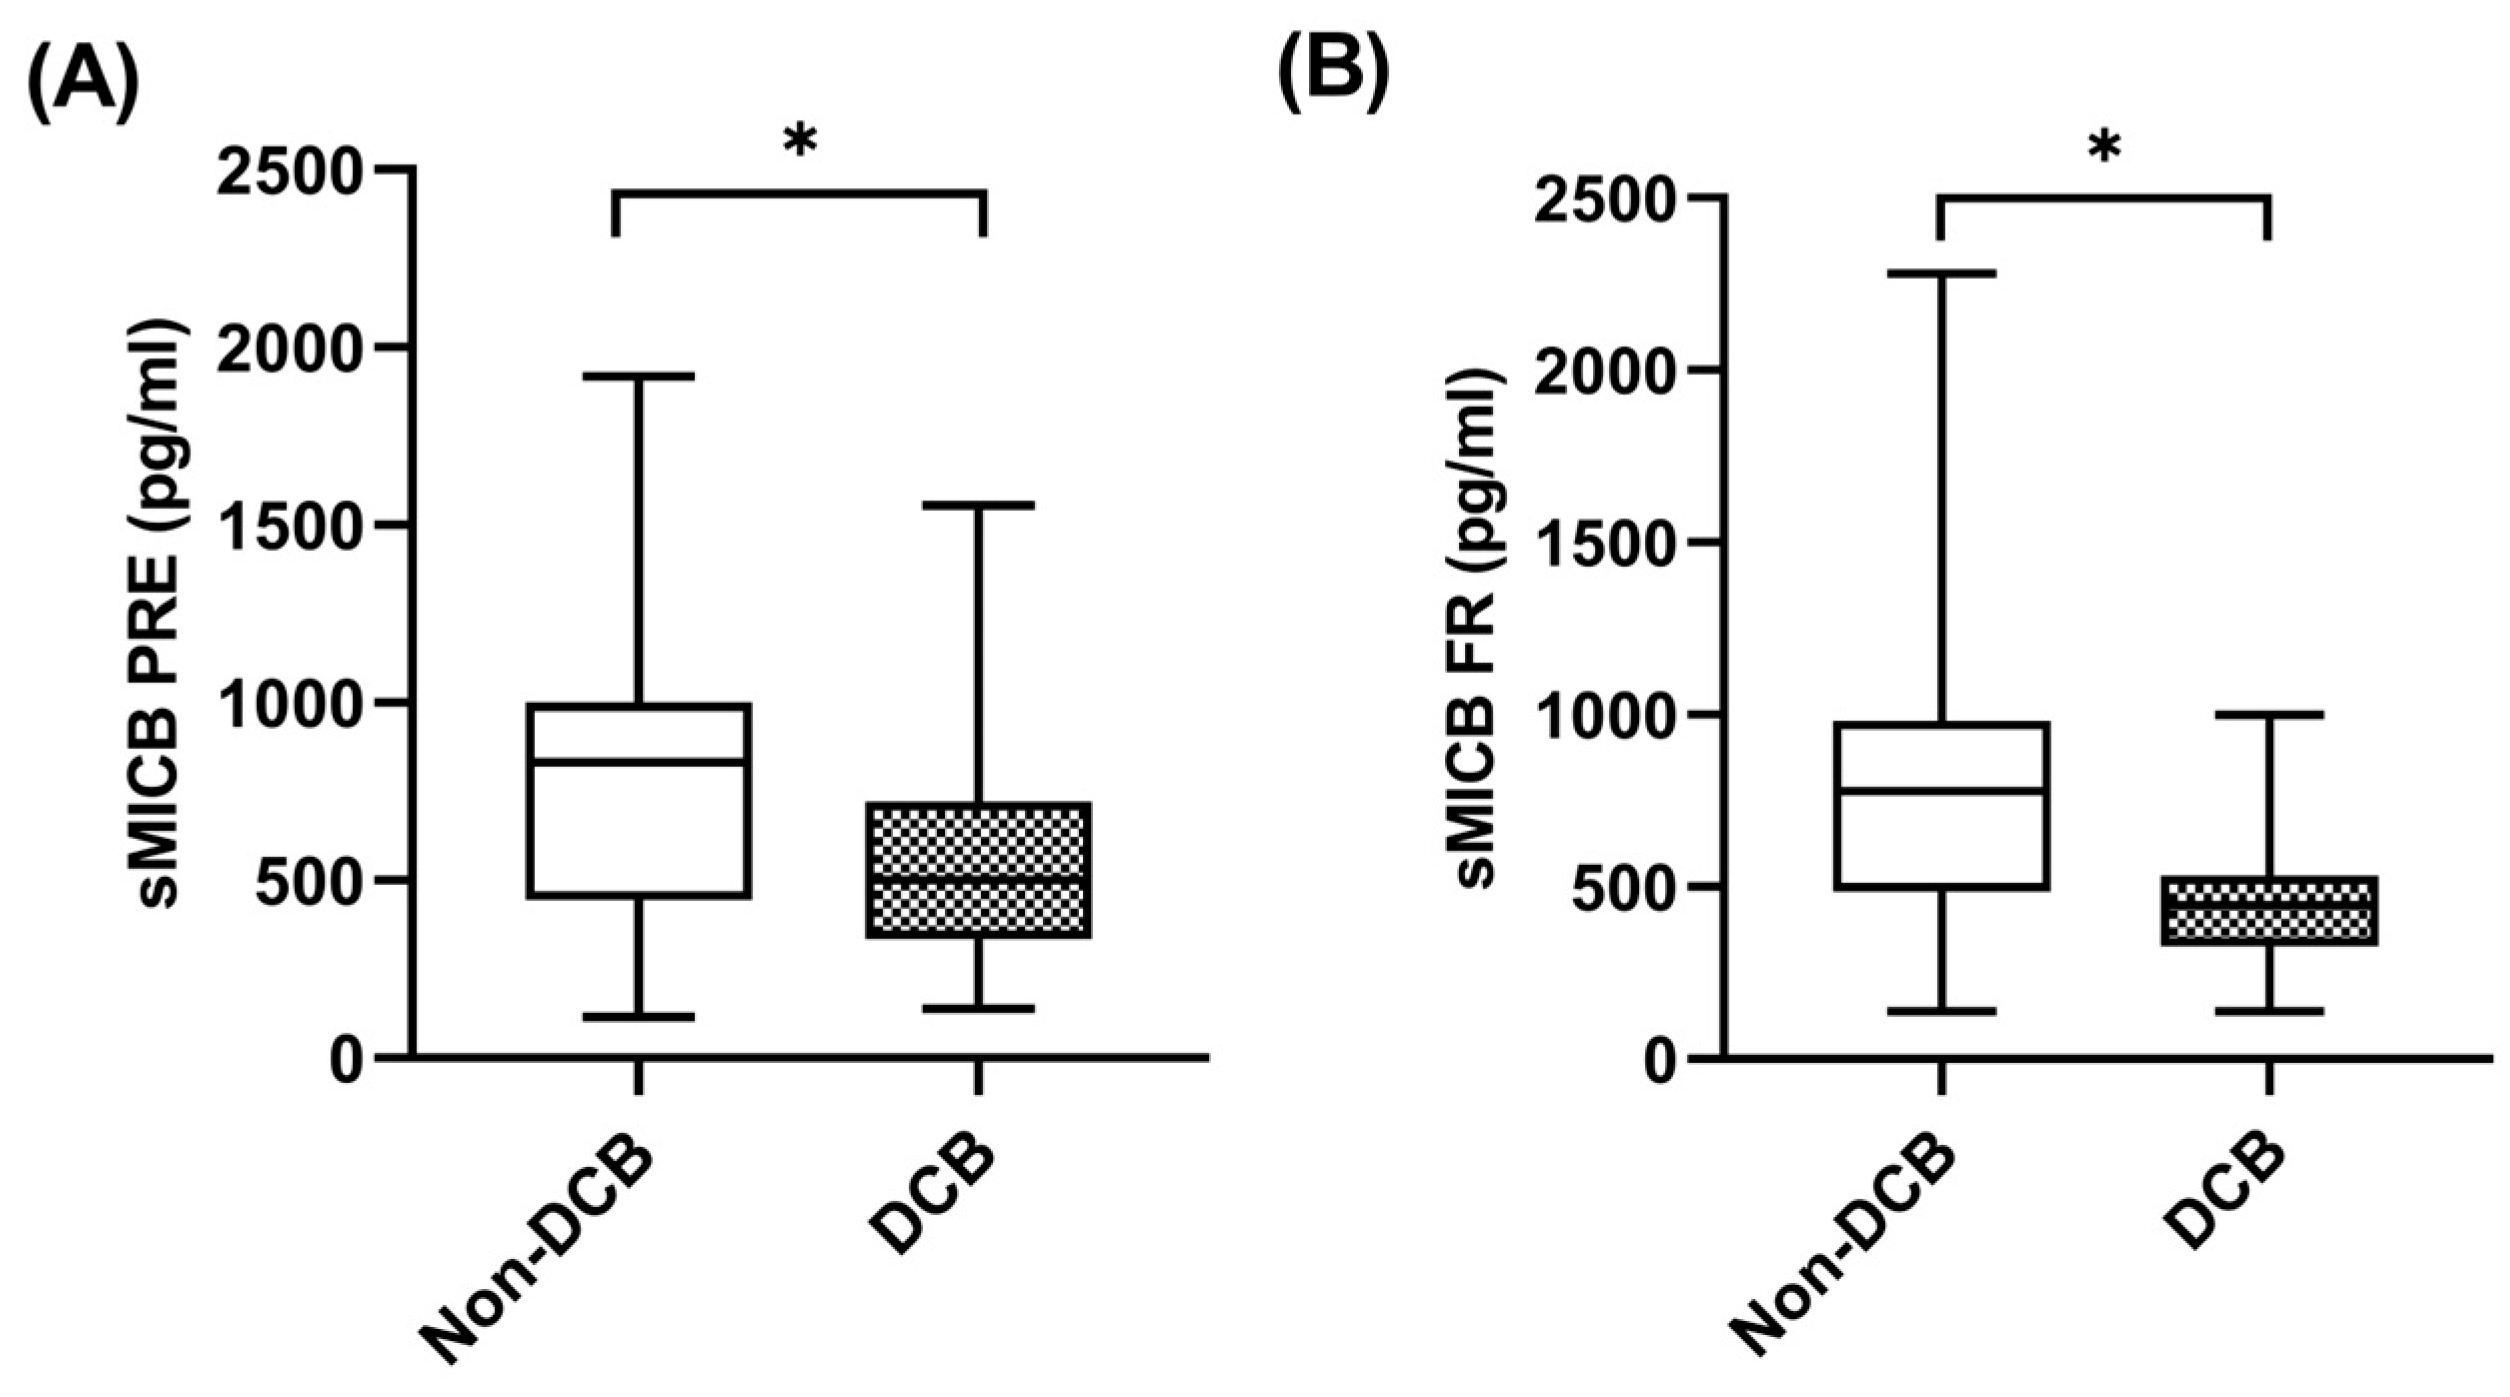
2.4.2. sMICB
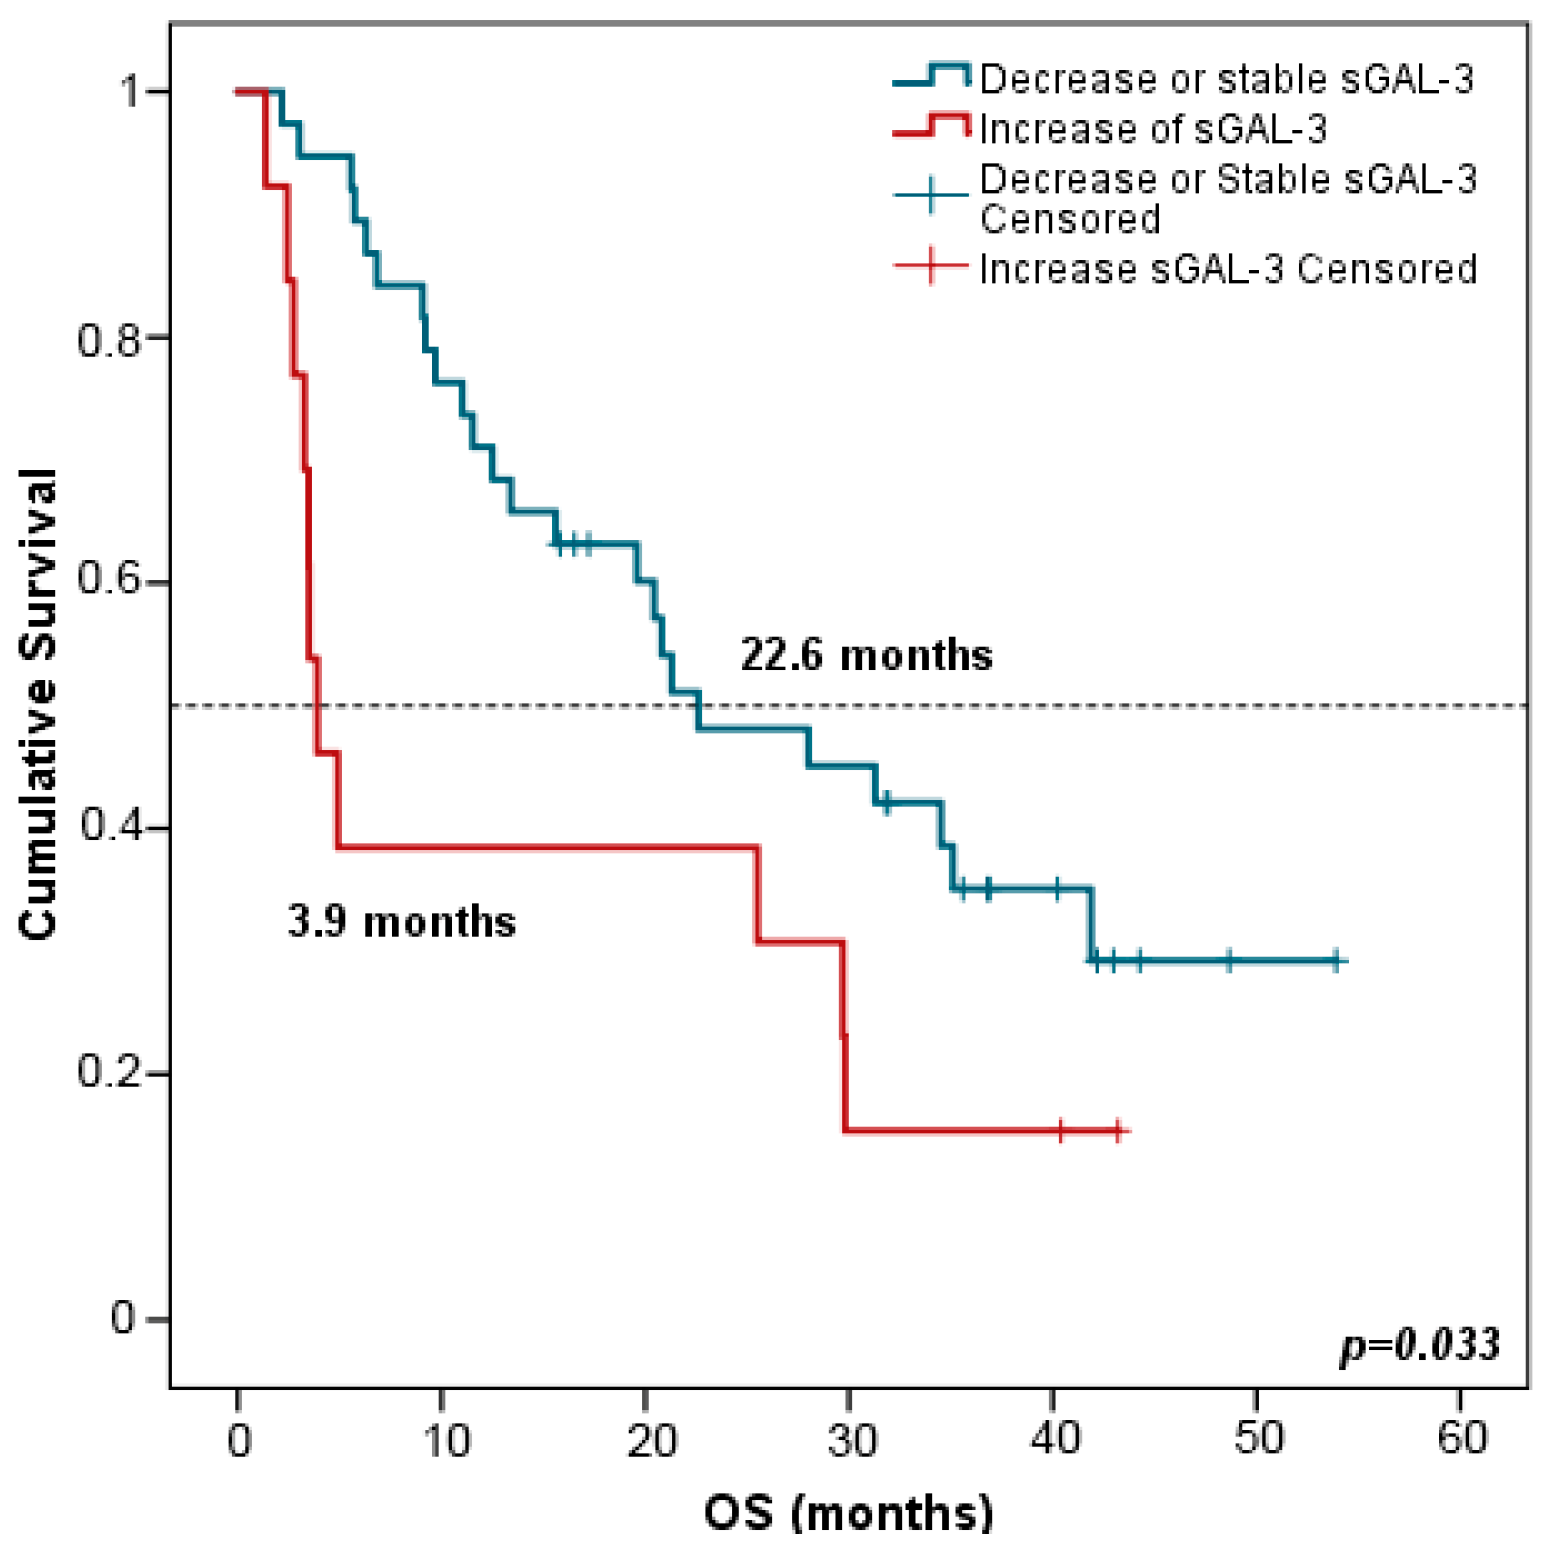
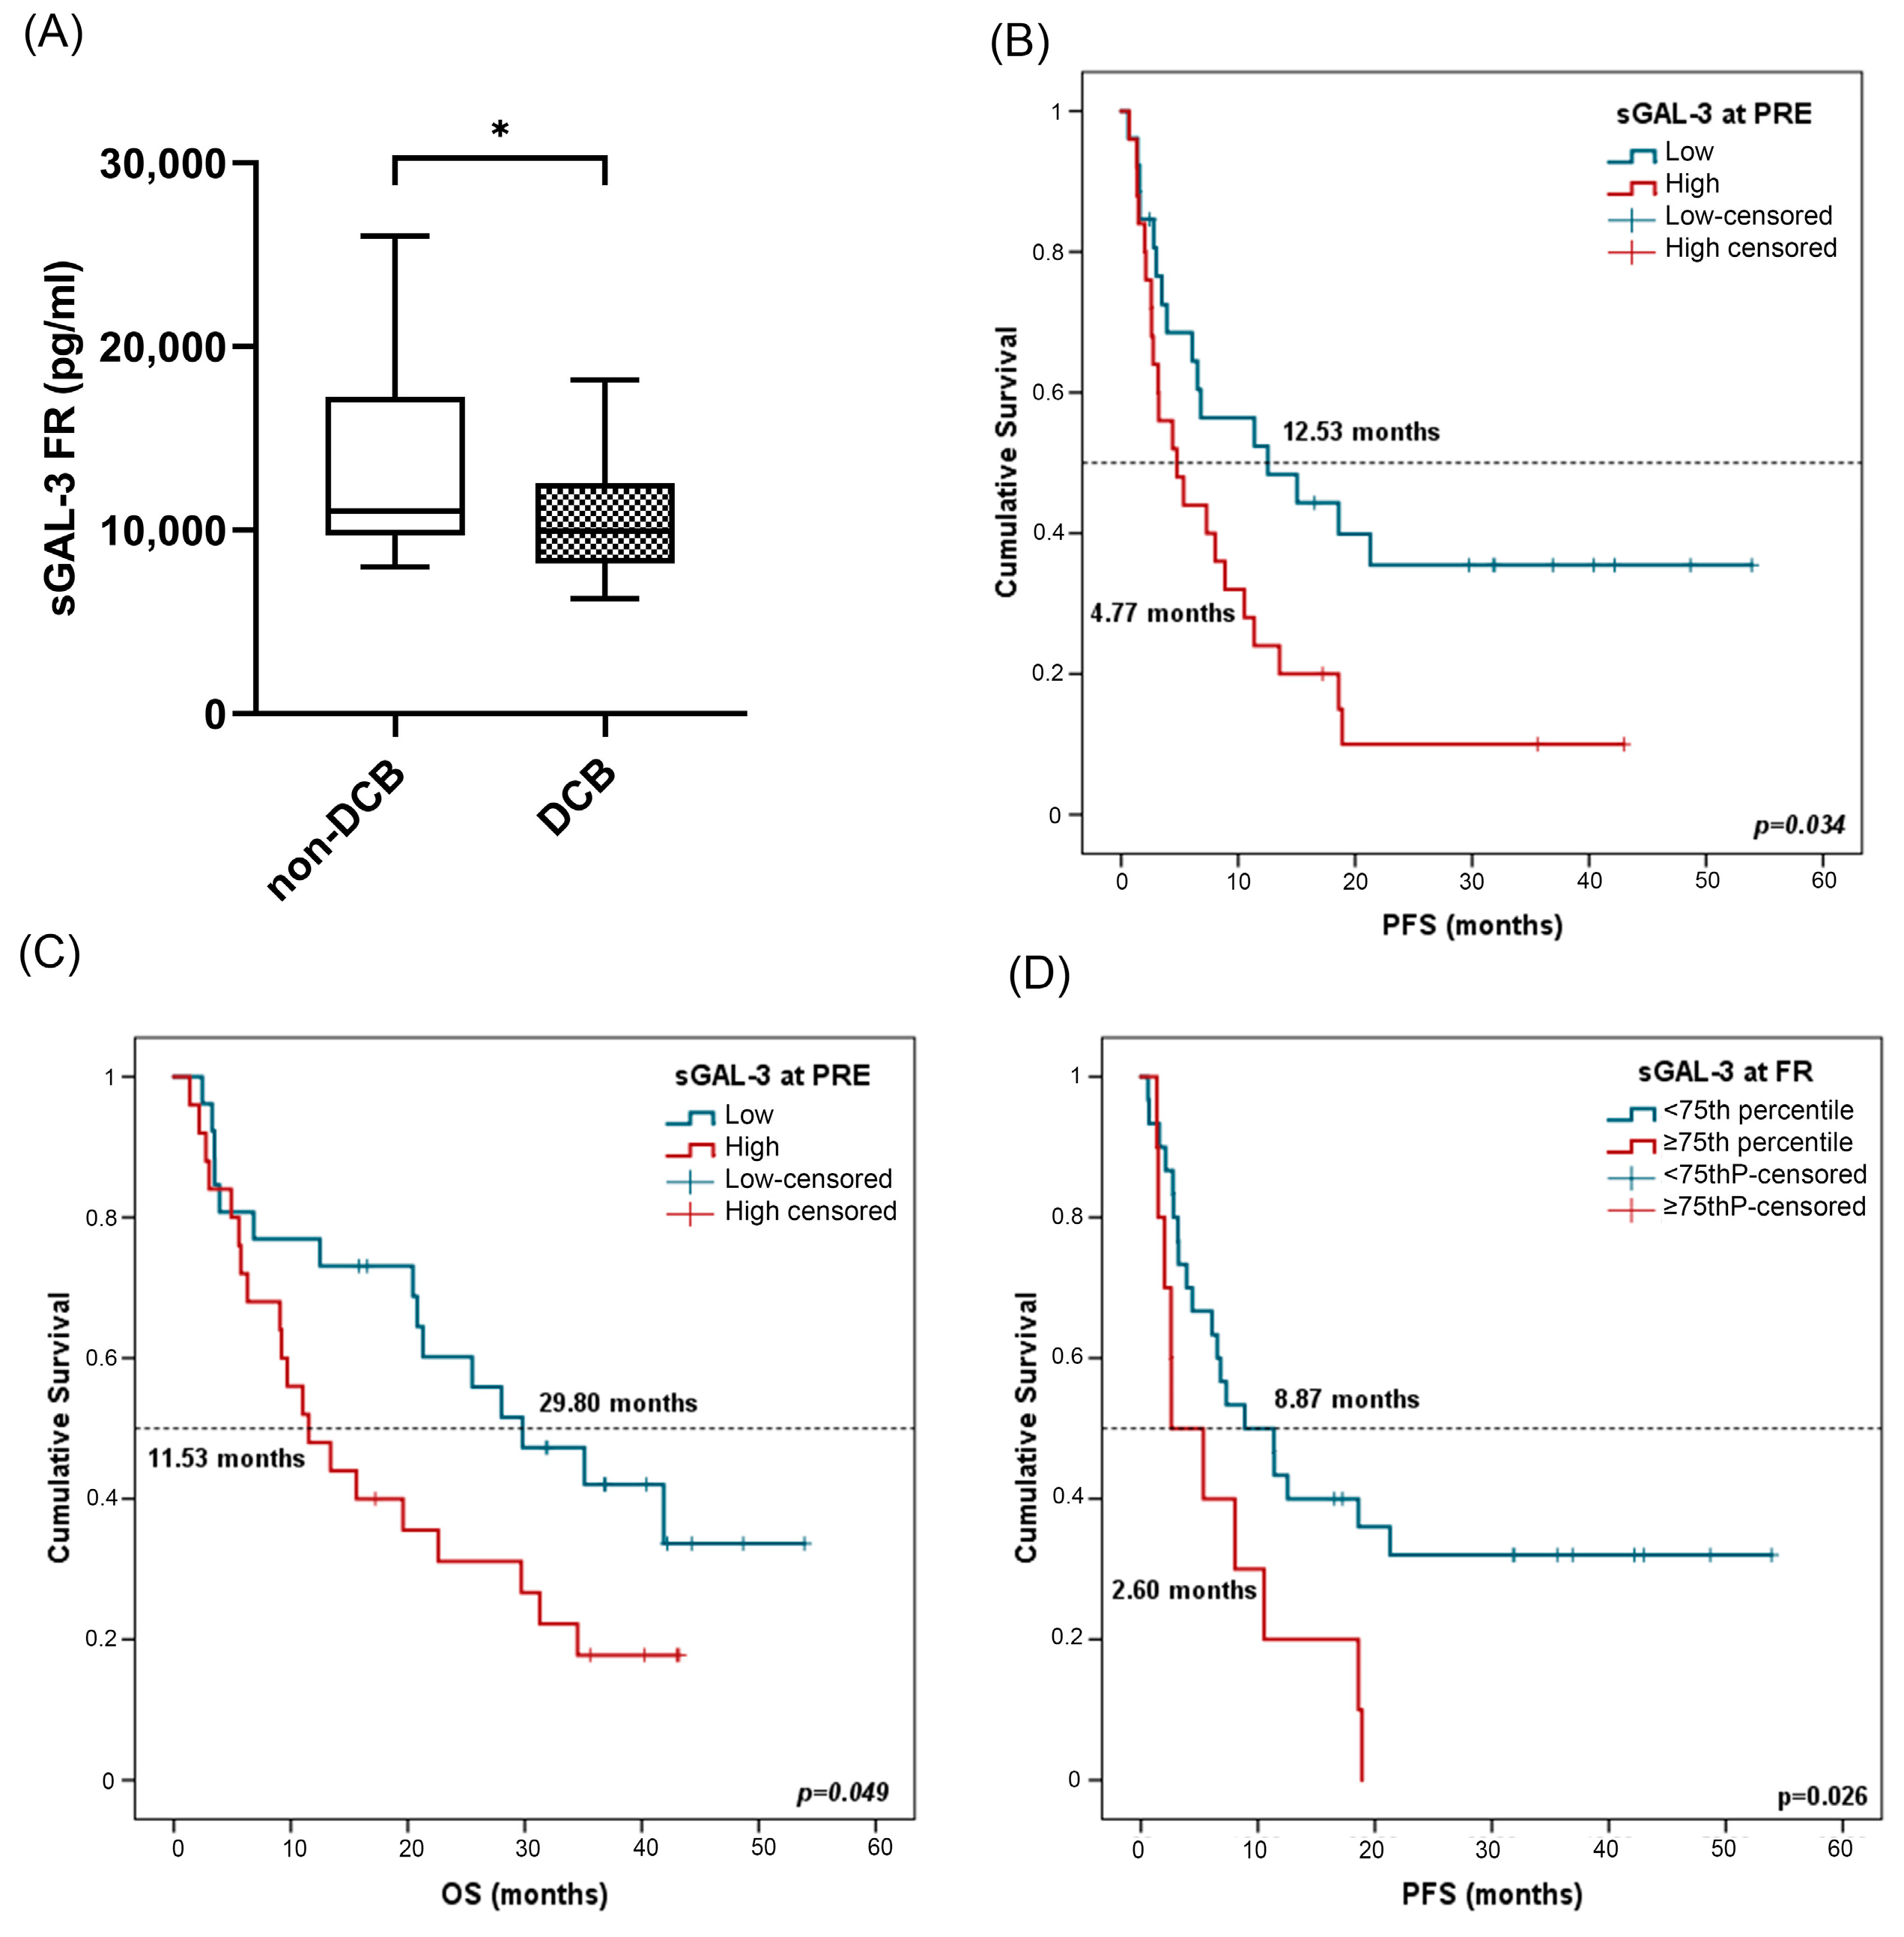
2.4.3. sGAL-3
2.4.4. sICOSL, sGAL1, sFGLF1, and sMICA
3. Discussion
4. Materials and Methods
4.1. Study Population
4.2. Sample Collection
4.3. Multiparametric Immunoassay Based on Luminex xMAP
4.4. Exploratory Endpoints Patients Evaluation
4.5. Statistical Analysis
5. Conclusions
Supplementary Materials
Author Contributions
Funding
Institutional Review Board Statement
Informed Consent Statement
Data Availability Statement
Conflicts of Interest
References
- Siegel, R.L.; Miller, K.D.; Fuchs, H.E.; Jemal, A. Cancer Statistics, 2022. CA Cancer J. Clin. 2022, 72, 7–33. [Google Scholar] [CrossRef] [PubMed]
- Baratella, E.; Cernic, S.; Minelli, P.; Furlan, G.; Crimì, F.; Rocco, S.; Ruaro, B.; Cova, M.A. Accuracy of CT-Guided Core-Needle Biopsy in Diagnosis of Thoracic Lesions Suspicious for Primitive Malignancy of the Lung: A Five-Year Retrospective Analysis. Tomography 2022, 8, 2828–2838. [Google Scholar] [CrossRef] [PubMed]
- Smok-Kalwat, J.; Mertowska, P.; Mertowski, S.; Smolak, K.; Kozińska, A.; Koszałka, F.; Kwaśniewski, W.; Grywalska, E.; Góźdź, S. The Importance of the Immune System and Molecular Cell Signaling Pathways in the Pathogenesis and Progression of Lung Cancer. Int. J. Mol. Sci. 2023, 24, 1506. [Google Scholar] [CrossRef] [PubMed]
- Brahmer, J.; Reckamp, K.L.; Baas, P.; Crinò, L.; Eberhardt, W.E.E.; Poddubskaya, E.; Antonia, S.; Pluzanski, A.; Vokes, E.E.; Holgado, E.; et al. Nivolumab versus Docetaxel in Advanced Squamous-Cell Non-Small-Cell Lung Cancer. N. Engl. J. Med. 2015, 373, 123–135. [Google Scholar] [CrossRef] [PubMed]
- Borghaei, H.; Paz-Ares, L.; Horn, L.; Spigel, D.R.; Steins, M.; Ready, N.E.; Chow, L.Q.; Vokes, E.E.; Felip, E.; Holgado, E.; et al. Nivolumab versus Docetaxel in Advanced Non-Squamous Non-Small Cell Lung Cancer. N. Engl. J. Med. 2015, 373, 1627. [Google Scholar] [CrossRef] [PubMed]
- Herbst, R.S.; Baas, P.; Kim, D.W.; Felip, E.; Pérez-Gracia, J.L.; Han, J.Y.; Molina, J.; Kim, J.H.; Arvis, C.D.; Ahn, M.J.; et al. Pembrolizumab versus Docetaxel for Previously Treated, PD-L1-Positive, Advanced Non-Small-Cell Lung Cancer (KEYNOTE-010): A Randomised Controlled Trial. Lancet 2016, 387, 1540–1550. [Google Scholar] [CrossRef] [PubMed]
- Brahmer, J.R.; Tykodi, S.S.; Chow, L.Q.M.; Hwu, W.-J.; Topalian, S.L.; Hwu, P.; Drake, C.G.; Camacho, L.H.; Kauh, J.; Odunsi, K.; et al. Safety and Activity of Anti–PD-L1 Antibody in Patients with Advanced Cancer. N. Engl. J. Med. 2012, 366, 2455–2465. [Google Scholar] [CrossRef]
- Zou, W.; Chen, L. Inhibitory B7-Family Molecules in the Tumour Microenvironment. Nat. Rev. Immunol. 2008, 8, 467–477. [Google Scholar] [CrossRef]
- Pardoll, D.M. The Blockade of Immune Checkpoints in Cancer Immunotherapy. Nat. Rev. Cancer 2012, 12, 252–264. [Google Scholar] [CrossRef]
- Ott, P.A.; Hodi, F.S.; Robert, C. CTLA-4 and PD-1/PD-L1 Blockade: New Immunotherapeutic Modalities with Durable Clinical Benefit in Melanoma Patients. Clin. Cancer Res. 2013, 19, 5300–5309. [Google Scholar] [CrossRef]
- Malapelle, U.; Parente, P.; Pepe, F.; Di Micco, M.C.; Russo, A.; Clemente, C.; Graziano, P.; Rossi, A. B7-H3/CD276 Inhibitors: Is There Room for the Treatment of Metastatic Non-Small Cell Lung Cancer? Int. J. Mol. Sci. 2022, 23, 16077. [Google Scholar] [CrossRef]
- Havel, J.J.; Chowell, D.; Chan, T.A. The Evolving Landscape of Biomarkers for Checkpoint Inhibitor Immunotherapy. Nat. Rev. Cancer 2019, 19, 133–150. [Google Scholar] [CrossRef] [PubMed]
- Gibney, G.T.; Weiner, L.M.; Atkins, M.B. Predictive Biomarkers for Checkpoint Inhibitor-Based Immunotherapy. Lancet Oncol. 2016, 17, e542–e551. [Google Scholar] [CrossRef] [PubMed]
- Rizvi, N.A.; Hellmann, M.D.; Snyder, A.; Kvistborg, P.; Makarov, V.; Havel, J.J.; Lee, W.; Yuan, J.; Wong, P.; Ho, T.S.; et al. Mutational Landscape Determines Sensitivity to PD-1 Blockade in Non–Small Cell Lung Cancer. Science 2015, 348, 124–129. [Google Scholar] [CrossRef] [PubMed]
- Marcus, L.; Lemery, S.J.; Keegan, P.; Pazdur, R. FDA Approval Summary: Pembrolizumab for the Treatment of Microsatellite Instability-High Solid Tumors. Clin. Cancer Res. 2019, 25, 3753–3758. [Google Scholar] [CrossRef] [PubMed]
- Davis, A.A.; Patel, V.G. The Role of PD-L1 Expression as a Predictive Biomarker: An Analysis of All US Food and Drug Administration (FDA) Approvals of Immune Checkpoint Inhibitors. J. Immunother. Cancer 2019, 7, 278. [Google Scholar] [CrossRef] [PubMed]
- Aguiar, P.N.; Santoro, I.L.; Tadokoro, H.; De Lima Lopes, G.; Filardi, B.A.; Oliveira, P.; Mountzios, G.; De Mello, R.A. The Role of PD-L1 Expression as a Predictive Biomarker in Advanced Non-Small-Cell Lung Cancer: A Network Meta-Analysis. Immunotherapy 2016, 8, 479–488. [Google Scholar] [CrossRef]
- Gettinger, S.N.; Horn, L.; Gandhi, L.; Spigel, D.R.; Antonia, S.J.; Rizvi, N.A.; Powderly, J.D.; Heist, R.S.; Carvajal, R.D.; Jackman, D.M.; et al. Overall Survival and Long-Term Safety of Nivolumab (Anti-Programmed Death 1 Antibody, BMS-936558, ONO-4538) in Patients with Previously Treated Advanced Non-Small-Cell Lung Cancer. J. Clin. Oncol. 2015, 33, 2004–2012. [Google Scholar] [CrossRef]
- Pinato, D.J.; Shiner, R.J.; White, S.D.T.; Black, J.R.M.; Trivedi, P.; Stebbing, J.; Sharma, R.; Mauri, F.A. Intra-Tumoral Heterogeneity in the Expression of Programmed-Death (PD) Ligands in Isogeneic Primary and Metastatic Lung Cancer: Implications for Immunotherapy. Oncoimmunology 2016, 5, e1213934. [Google Scholar] [CrossRef]
- Bassanelli, M.; Sioletic, S.; Martini, M.; Giacinti, S.; Viterbo, A.; Staddon, A.; Liberati, F.; Ceribelli, A. Heterogeneity of PD-L1 Expression and Relationship with Biology of NSCLC. Anticancer Res. 2018, 38, 3789–3796. [Google Scholar] [CrossRef]
- Topalian, S.L.; Taube, J.M.; Anders, R.A.; Pardoll, D.M. Mechanism-Driven Biomarkers to Guide Immune Checkpoint Blockade in Cancer Therapy. Nat. Rev. Cancer 2016, 16, 275–287. [Google Scholar] [CrossRef] [PubMed]
- Benlloch, S.; Botero, M.L.; Beltran-Alamillo, J.; Mayo, C.; Gimenez-Capitán, A.; De Aguirre, I.; Queralt, C.; Ramirez, J.L.; Cajal, S.R.Y.; Klughammer, B.; et al. Clinical Validation of a PCR Assay for the Detection of EGFR Mutations in Non-Small-Cell Lung Cancer: Retrospective Testing of Specimens from the EURTAC Trial. PLoS ONE 2014, 9, e89518. [Google Scholar] [CrossRef] [PubMed]
- Lanman, R.B.; Mortimer, S.A.; Zill, O.A.; Sebisanovic, D.; Lopez, R.; Blau, S.; Collisson, E.A.; Divers, S.G.; Hoon, D.S.B.; Scott Kopetz, E.; et al. Analytical and Clinical Validation of a Digital Sequencing Panel for Quantitative, Highly Accurate Evaluation of Cell-Free Circulating Tumor DNA. PLoS ONE 2015, 10, e0140712. [Google Scholar] [CrossRef] [PubMed]
- Ettinger, D.S.; Wood, D.E.; Aisner, D.L.; Akerley, W.; Bauman, J.R.; Bharat, A.; Bruno, D.S.; Chang, J.Y.; Chirieac, L.R.; D’Amico, T.A.; et al. Non-Small Cell Lung Cancer, Version 3.2022, NCCN Clinical Practice Guidelines in Oncology. J. Natl. Compr. Cancer Netw. 2022, 20, 497–530. [Google Scholar] [CrossRef] [PubMed]
- Pascual, J.; Attard, G.; Bidard, F.C.; Curigliano, G.; De Mattos-Arruda, L.; Diehn, M.; Italiano, A.; Lindberg, J.; Merker, J.D.; Montagut, C.; et al. ESMO Recommendations on the Use of Circulating Tumour DNA Assays for Patients with Cancer: A Report from the ESMO Precision Medicine Working Group. Ann. Oncol. 2022, 33, 750–768. [Google Scholar] [CrossRef] [PubMed]
- Giroux Leprieur, E.; Herbretau, G.; Dumenil, C.; Julie, C.; Giraud, V.; Labrune, S.; Dumoulin, J.; Tisserand, J.; Emile, J.F.; Blons, H.; et al. Circulating Tumor DNA Evaluated by Next-Generation Sequencing Is Predictive of Tumor Response and Prolonged Clinical Benefit with Nivolumab in Advanced Non-Small Cell Lung Cancer. Oncoimmunology 2018, 7, e1424675. [Google Scholar] [CrossRef] [PubMed]
- Provencio, M.; Serna-blasco, R.; Nadal, E.; Insa, A.; Garc, M.R.; Mart, J. Overall Survival and Biomarker Analysis of Neoadjuvant Nivolumab Plus Chemotherapy in Operable Stage IIIA Non—Small-Cell Lung Cancer (NADIM Phase II Trial) Original Reports Abstract. J. Clin. Oncol. 2022, 40, 2871. [Google Scholar] [CrossRef]
- Costantini, A.; Julie, C.; Dumenil, C.; Hélias-Rodzewicz, Z.; Tisserand, J.; Dumoulin, J.; Giraud, V.; Labrune, S.; Chinet, T.; Emile, J.F.; et al. Predictive Role of Plasmatic Biomarkers in Advanced Non-Small Cell Lung Cancer Treated by Nivolumab. Oncoimmunology 2018, 7, e1452581. [Google Scholar] [CrossRef]
- Torres-Martínez, S.; Calabuig-Fariñas, S.; Moreno-Manuel, A.; Bertolini, G.; Herreros-Pomares, A.; Escorihuela, E.; Duréndez-Saéz, E.; Guijarro, R.; Blasco, A.; Roz, L.; et al. Soluble Galectin-3 as a Microenvironment-relevant Immunoregulator with Prognostic and Predictive Value in Lung Adenocarcinoma. Mol. Oncol. 2023. epub ahead of print. [Google Scholar] [CrossRef]
- Stillman, B.N.; Hsu, D.K.; Pang, M.; Brewer, C.F.; Johnson, P.; Liu, F.-T.; Baum, L.G. Galectin-3 and Galectin-1 Bind Distinct Cell Surface Glycoprotein Receptors to Induce T Cell Death. J. Immunol. 2006, 176, 778–789. [Google Scholar] [CrossRef]
- Xing, S.; Ferrari de Andrade, L. NKG2D and MICA/B Shedding: A ‘Tag Game’ between NK Cells and Malignant Cells. Clin. Transl. Immunol. 2020, 9, e1230. [Google Scholar] [CrossRef] [PubMed]
- Qian, W.; Zhao, M.; Wang, R.; Li, H. Fibrinogen-like Protein 1 (FGL1): The next Immune Checkpoint Target. J. Hematol. Oncol. 2021, 14, 147. [Google Scholar] [CrossRef] [PubMed]
- Pico de Coaña, Y.; Choudhury, A.; Kiessling, R. Checkpoint Blockade for Cancer Therapy: Revitalizing a Suppressed Immune System. Trends Mol. Med. 2015, 21, 482–491. [Google Scholar] [CrossRef] [PubMed]
- Pembrolizumab (KEYTRUDA) Checkpoint Inhibitor|FDA. Available online: https://www.fda.gov/drugs/resources-information-approved-drugs/pembrolizumab-keytruda-checkpoint-inhibitor (accessed on 5 June 2023).
- Warth, A.; Körner, S.; Penzel, R.; Muley, T.; Dienemann, H.; Schirmacher, P.; von Knebel-Doeberitz, M.; Weichert, W.; Kloor, M. Microsatellite Instability in Pulmonary Adenocarcinomas: A Comprehensive Study of 480 Cases. Virchows Arch. 2016, 468, 313–319. [Google Scholar] [CrossRef] [PubMed]
- Büttner, R.; Longshore, J.W.; López-Ríos, F.; Merkelbach-Bruse, S.; Normanno, N.; Rouleau, E.; Penault-Llorca, F. Implementing TMB Measurement in Clinical Practice: Considerations on Assay Requirements. ESMO Open 2019, 4, e000442. [Google Scholar] [CrossRef] [PubMed]
- Noé, G.; Bellesoeur, A.; Golmard, L.; Thomas-Schoemann, A.; Boudou-Rouquette, P.; Meyo, M.T.; Puszkiel, A.; Arrondeau, J.; Alexandre, J.; Goldwasser, F.; et al. Differential Kinase Activation in Peripheral Blood Mononuclear Cells from Non-Small-Cell Lung Cancer Patients Treated with Nivolumab. Cancers 2019, 11, 762. [Google Scholar] [CrossRef] [PubMed]
- Dong, N.; Moreno-Manuel, A.; Calabuig-Fariñas, S.; Gallach, S.; Zhang, F.; Blasco, A.; Aparisi, F.; Meri-Abad, M.; Guijarro, R.; Sirera, R.; et al. Characterization of Circulating t Cell Receptor Repertoire Provides Information about Clinical Outcome after Pd-1 Blockade in Advanced Non-Small Cell Lung Cancer Patients. Cancers 2021, 13, 2950. [Google Scholar] [CrossRef]
- Malapelle, U.; Tiseo, M.; Vivancos, A.; Kapp, J.; Serrano, M.J.; Tiemann, M. Liquid Biopsy for Biomarker Testing in Non-Small Cell Lung Cancer: A European Perspective. J. Mol. Pathol. 2021, 2, 255–273. [Google Scholar] [CrossRef]
- Abate, R.E.; Frezzetti, D.; Maiello, M.R.; Gallo, M.; Camerlingo, R.; De Luca, A.; De Cecio, R.; Morabito, A.; Normanno, N. Next Generation Sequencing-Based Profiling of Cell Free DNA in Patients with Advanced Non-Small Cell Lung Cancer: Advantages and Pitfalls. Cancers 2020, 12, 3804. [Google Scholar] [CrossRef]
- Okuma, Y.; Hosomi, Y.; Nakahara, Y.; Watanabe, K.; Sagawa, Y.; Homma, S. High Plasma Levels of Soluble Programmed Cell Death Ligand 1 Are Prognostic for Reduced Survival in Advanced Lung Cancer. Lung Cancer 2017, 104, 1–6. [Google Scholar] [CrossRef]
- Meyo, M.T.; Jouinot, A.; Giroux-leprieur, E.; Fabre, E.; Wislez, M.; Alifano, M.; Leroy, K.; Boudou-rouquette, P.; Tlemsani, C.; Khoudour, N.; et al. Predictive Value of Soluble PD-1, PD-L1, VEGFA, CD40 Ligand and CD44 for Nivolumab Therapy in Advanced Non-Small Cell Lung Cancer: A Case-Control Study. Cancers 2020, 12, 473. [Google Scholar] [CrossRef]
- de la Iglesia, J.V.; Slebos, R.J.C.; Martin-Gomez, L.; Wang, X.; Teer, J.K.; Tan, A.C.; Gerke, T.A.; Aden-Buie, G.; van Veen, T.; Masannat, J.; et al. Effects of Tobacco Smoking on the Tumor Immune Microenvironment in Head and Neck Squamous Cell Carcinoma. Clin. Cancer Res. 2020, 26, 1474–1485. [Google Scholar] [CrossRef]
- Hammerman, P.S.; Voet, D.; Lawrence, M.S.; Voet, D.; Jing, R.; Cibulskis, K.; Sivachenko, A.; Stojanov, P.; McKenna, A.; Lander, E.S.; et al. Comprehensive Genomic Characterization of Squamous Cell Lung Cancers. Nature 2012, 489, 519–525. [Google Scholar] [CrossRef]
- Desrichard, A.; Kuo, F.; Chowell, D.; Lee, K.W.; Riaz, N.; Wong, R.J.; Chan, T.A.; Morris, L.G.T. Tobacco Smoking-Associated Alterations in the Immune Microenvironment of Squamous Cell Carcinomas. J. Natl. Cancer Inst. 2018, 110, 1386–1392. [Google Scholar] [CrossRef]
- Inamura, K.; Yokouchi, Y.; Kobayashi, M.; Sakakibara, R.; Ninomiya, H.; Subat, S.; Nagano, H.; Nomura, K.; Okumura, S.; Shibutani, T.; et al. Tumor B7-H3 (CD276) Expression and Smoking History in Relation to Lung Adenocarcinoma Prognosis. Lung Cancer 2017, 103, 44–51. [Google Scholar] [CrossRef]
- Wang, J.; Sanmamed, M.F.; Datar, I.; Su, T.T.; Ji, L.; Sun, J.; Chen, L.; Chen, Y.; Zhu, G.; Yin, W.; et al. Fibrinogen-like Protein 1 Is a Major Immune Inhibitory Ligand of LAG-3. Cell 2019, 176, 334–347.e12. [Google Scholar] [CrossRef]
- Li, W.; Zheng, H.; Qin, H.; Liu, G.; Ke, L.; Li, Y.; Li, N.; Zhong, X. Exploration of Differentially Expressed Plasma Proteins in Patients with Lung Adenocarcinoma Using ITRAQ-Coupled 2D LC-MS/MS. Clin. Respir. J. 2018, 12, 2036–2045. [Google Scholar] [CrossRef]
- Beretov, J.; Wasinger, V.C.; Graham, P.H.; Millar, E.K.; Kearsley, J.H.; Li, Y. Proteomics for Breast Cancer Urine Biomarkers. Adv. Clin. Chem. 2014, 63, 123–167. [Google Scholar] [CrossRef]
- DuPont, N.C.; Wang, K.; Wadhwa, P.D.; Culhane, J.F.; Nelson, E.L. Validation and Comparison of Luminex Multiplex Cytokine Analysis Kits with ELISA: Determinations of a Panel of Nine Cytokines in Clinical Sample Culture Supernatants. J. Reprod. Immunol. 2005, 66, 175. [Google Scholar] [CrossRef] [PubMed]
- Huang, Y.; Wang, H.C.; Zhao, J.; Wu, M.H.; Shih, T.C. Immunosuppressive Roles of Galectin-1 in the Tumor Microenvironment. Biomolecules 2021, 11, 1398. [Google Scholar] [CrossRef] [PubMed]
- Arcolia, V.; Journe, F.; Wattier, A.; Leteurtre, E.; Renaud, F.; Gabius, H.J.; Remmelink, M.; Decaestecker, C.; Rodriguez, A.; Boutry, S.; et al. Galectin-1 Is a Diagnostic Marker Involved in Thyroid Cancer Progression. Int. J. Oncol. 2017, 51, 760–770. [Google Scholar] [CrossRef]
- Martinez-Bosch, N.; Barranco, L.E.; Orozco, C.A.; Moreno, M.; Visa, L.; Iglesias, M.; Oldfield, L.; Neoptolemos, J.P.; Greenhalf, W.; Earl, J.; et al. Increased plasma levels of galectin-1 in pancreatic cancer: Potential use as biomarker. Oncotarget 2018, 9, 32984–32996. [Google Scholar] [CrossRef]
- Ruvolo, P.P. Galectin 3 as a Guardian of the Tumor Microenvironment. Biochim. Biophys. Acta 2016, 1863, 427–437. [Google Scholar] [CrossRef]
- Kuo, H.Y.; Hsu, H.T.; Chen, Y.C.; Chang, Y.W.; Liu, F.T.; Wu, C.W. Galectin-3 Modulates the EGFR Signalling-Mediated Regulation of Sox2 Expression via c-Myc in Lung Cancer. Glycobiology 2015, 26, 155–165. [Google Scholar] [CrossRef]
- Szöke, T.; Kayser, K.; Trojan, I.; Kayser, G.; Furak, J.; Tiszlavicz, L.; Baumhäkel, J.D.; Gabius, H.J. The Role of Microvascularization and Growth/Adhesion-Regulatory Lectins in the Prognosis of Non-Small Cell Lung Cancer in Stage II. Eur. J. Cardio-Thorac. Surg. 2007, 31, 783–787. [Google Scholar] [CrossRef]
- Sun, J.; Soyeon, K.; Koh, J.; Kim, M.; Keam, B.; Kim, T.M.; Lindmark, B.; Kim, D.W. Predictive Role of Galectin-3 for Immune Checkpoint Blockades (ICBs) in Advanced or Metastatic Non-small Cell Lung Cancer: A Potential New Marker for ICB Resistance. J. Cancer Res. Clin. Oncol. 2022, 149, 2355–2365. [Google Scholar] [CrossRef]
- Xie, L.; Ni, W.K.; Chen, X.D.; Xiao, M.B.; Chen, B.Y.; He, S.; Lu, C.H.; Li, X.Y.; Jiang, F.; Ni, R.Z. The Expressions and Clinical Significances of Tissue and Serum Galectin-3 in Pancreatic Carcinoma. J. Cancer Res. Clin. Oncol. 2012, 138, 1035–1043. [Google Scholar] [CrossRef]
- Zhang, X.; Wan, Y.; Chata, R.; Brazzale, A.; Atherton, J.J.; Kostner, K.; Dimeski, G.; Punyadeera, C. A Pilot Study to Demonstrate Diagnostic Potential of Galectin-3 Levels in Saliva. J. Clin. Pathol. 2016, 69, 1100–1104. [Google Scholar] [CrossRef]
- Polat, V.; Bozcali, E.; Uygun, T.; Opan, S.; Karakaya, O. Diagnostic Significance of Serum Galectin-3 Levels in Heart Failure with Preserved Ejection Fraction. Front. Cardiovasc. Med. 2017, 71, 191–197. [Google Scholar] [CrossRef]
- Balan, V.; Wang, Y.; Nangia-Makker, P.; Kho, D.; Bajaj, M.; Smith, D.; Heilbrun, L.; Raz, A.; Heath, E. Galectin-3: A Possible Complementary Marker to the PSA Blood Test. Oncotarget 2013, 4, 542–549. [Google Scholar] [CrossRef] [PubMed]
- Chen, C.; Duckworth, C.A.; Fu, B.; Pritchard, D.M.; Rhodes, J.M.; Yu, L.G. Circulating Galectins-2,-4 and-8 in Cancer Patients Make Important Contributions to the Increased Circulation of Several Cytokines and Chemokines That Promote Angiogenesis and Metastasis. Br. J. Cancer 2014, 110, 741–752. [Google Scholar] [CrossRef] [PubMed]
- Altan, M.; Pelekanou, V.; Schalper, K.A.; Toki, M.; Gaule, P.; Syrigos, K.; Herbst, R.S.; Rimm, D.L. B7-H3 Expression in NSCLC and Its Association with B7-H4, PD-L1 and Tumor-Infiltrating Lymphocytes. Clin. Cancer Res. 2017, 23, 5202–5209. [Google Scholar] [CrossRef]
- Hofmeyer, K.A.; Ray, A.; Zang, X. The Contrasting Role of B7-H3. Proc. Natl. Acad. Sci. USA 2008, 105, 10277–10278. [Google Scholar] [CrossRef] [PubMed]
- Chen, W.; Liu, P.; Wang, Y.; Nie, W.; Li, Z.; Xu, W.; Li, F.; Zhou, Z.; Zhao, M.; Liu, H. Characterization of a Soluble B7-H3 (SB7-H3) Spliced from the Intron and Analysis of SB7-H3 in the Sera of Patients with Hepatocellular Carcinoma. PLoS ONE 2013, 8, 2–8. [Google Scholar] [CrossRef] [PubMed]
- Zhang, G.; Hou, J.; Shi, J.; Yu, G.; Lu, B.; Zhang, X. Soluble CD276 (B7-H3) Is Released from Monocytes, Dendritic Cells and Activated T Cells and Is Detectable in Normal Human Serum. Immunology 2008, 123, 538–546. [Google Scholar] [CrossRef] [PubMed]
- Kovaleva, O.V.; Belova, T.P.; Korotkova, E.A.; Kushlinskii, D.N.; Gratchev, A.N.; Petrikova, N.A.; Kudlay, D.A.; Kushlinskii, N.E. Soluble B7-H3 in Ovarian Cancer and Its Predictive Value. Bull. Exp. Biol. Med. 2021, 171, 472–474. [Google Scholar] [CrossRef] [PubMed]
- Huang, L.; Zhou, Y.; Sun, Q.; Cao, L.; Zhang, X. Evaluation of the Role of Soluble B7-H3 in Association with Membrane B7-H3 Expression in Gastric Adenocarcinoma. Cancer Biomark. 2022, 33, 123–129. [Google Scholar] [CrossRef]
- Genova, C.; Tasso, R.; Rosa, A.; Rossi, G.; Reverberi, D.; Fontana, V.; Marconi, S.; Croce, M.; Giovanna, M.; Bello, D.; et al. Prognostic Role of Soluble and Extracellular Vesicle-Associated PD-L1, B7-H3 and B7-H4 in Non-Small Cell Lung Cancer Patients Treated with Immune Checkpoint Inhibitors. Cells 2023, 12, 832. [Google Scholar] [CrossRef]
- Chitadze, G.; Bhat, J.; Lettau, M.; Janssen, O.; Kabelitz, D. Generation of Soluble NKG2D Ligands: Proteolytic Cleavage, Exosome Secretion and Functional Implications. Scand. J. Immunol. 2013, 78, 120–129. [Google Scholar] [CrossRef]
- Groh, V.; Wu, J.; Yee, C.; Spies, T. Tumour-Derived Soluble MIC Ligands Impair Expression of NKG2D and T-Cell Activation. Nature 2002, 419, 734–738. [Google Scholar] [CrossRef]
- Doubrovina, E.S.; Doubrovin, M.M.; Vider, E.; Sisson, R.B.; O’Reilly, R.J.; Dupont, B.; Vyas, Y.M. Evasion from NK Cell Immunity by MHC Class I Chain-Related Molecules Expressing Colon Adenocarcinoma. J. Immunol. 2003, 171, 6891–6899. [Google Scholar] [CrossRef] [PubMed]
- Wu, J.D.; Higgins, L.M.; Steinle, A.; Cosman, D.; Haugk, K.; Plymate, S.R. Prevalent Expression of the Immunostimulatory MHC Class I Chain-Related Molecule Is Counteracted by Shadding in Prostate Cancer. J. Clin. Investig. 2004, 114, 560–568. [Google Scholar] [CrossRef] [PubMed]
- Raffaghello, L.; Prigione, I.; Airoldi, I.; Camoriano, M.; Levreri, I.; Gambini, C.; Pende, D.; Steinte, A.; Ferrone, S.; Pistoia, V. Downregulation and/or Release of NKG2D Ligands as Immune Evasion Strategy of Human Neuroblastoma. Neoplasia 2004, 6, 558–568. [Google Scholar] [CrossRef] [PubMed]
- Tamaki, S.; Kawakami, M.; Ishitani, A.; Kawashima, W.; Kasuda, S.; Yamanaka, Y.; Shimomura, H.; Imai, Y.; Nakagawa, Y.; Hatake, K.; et al. Soluble MICB Serum Levels Correlate with Disease Stage and Survival Rate in Patients with Oral Squamous Cell Carcinoma. Anticancer Res. 2010, 30, 4097–4101. [Google Scholar]
- Wu, B.J.; Li, W.P.; Qian, C.; Ding, W.; Zhou, Z.W.; Jiang, H. Serum Soluble MICB (SMICB) Correlates with Disease Progression and Survival in Melanoma Patients. Tumor Biol. 2013, 34, 565–569. [Google Scholar] [CrossRef]
- Maccalli, C.; Giannarelli, D.; Chiarucci, C.; Cutaia, O.; Giacobini, G.; Hendrickx, W.; Amato, G.; Annesi, D.; Bedognetti, D.; Altomonte, M.; et al. Soluble NKG2D Ligands Are Biomarkers Associated with the Clinical Outcome to Immune Checkpoint Blockade Therapy of Metastatic Melanoma Patients. Oncoimmunology 2017, 6, e1323618. [Google Scholar] [CrossRef]
- Powderly, J.D.; Gutierrez, M.; Wang, J.S.; Hamilton, E.P.; Sharma, M.; Spira, A.I.; Millward, M.; Shackleton, M.J.; Frentzas, S.; Koczywas, M.; et al. A Phase 1 Dose-Escalation Study to Investigate the Safety, Efficacy, Pharmacokinetics, and Pharmacodynamic Activity of CLN-619 (Anti-MICA/MICB Antibody) Alone and in Combination with Pembrolizumab in Patients with Advanced Solid Tumors. J. Clin. Oncol. 2022, 40, TPS2688. [Google Scholar] [CrossRef]
- Khan, M.; Zhao, Z.; Arooj, S.; Fu, Y.; Liao, G. Soluble PD-1: Predictive, Prognostic, and Therapeutic Value for Cancer Immunotherapy. Front. Immunol. 2020, 11, 587460. [Google Scholar] [CrossRef]
- Ruopp, M.D.; Perkins, N.J.; Whitcomb, B.W.; Schisterman, E.F. Youden Index and Optimal Cut-Point Estimated from Observations Affected by a Lower Limit of Detection. Biom. J. 2008, 50, 419430. [Google Scholar] [CrossRef]


| Patient Characteristics | Patients | |
|---|---|---|
| n = 52 | % | |
| Age at diagnosis (median, range) | 67.5 [IQR 51–89] | |
| Gender | ||
| Male | 39 | 75 |
| Female | 13 | 25 |
| Histology | ||
| ADC | 34 | 65.4 |
| SCC | 13 | 25 |
| Others | 5 | 9.6 |
| Stage | ||
| III | 12 | 23.1 |
| IVA | 13 | 25 |
| IVB | 27 | 51.9 |
| Performance status | ||
| 0–1 | 44 | 84.6 |
| 2 | 7 | 13.5 |
| Smoking status | ||
| Current | 37 | 71.2 |
| Former | 11 | 21.2 |
| Never | 4 | 7.7 |
| Progression | ||
| Yes | 38 | 73.1 |
| No | 14 | 26.9 |
| Exitus | ||
| Yes | 36 | 69.2 |
| No | 16 | 30.8 |
| Analyte | Median at PRE (pg/mL) | IQR at PRE (pg/mL) | Median at FR (pg/mL) | IQR at FR (pg/mL) |
|---|---|---|---|---|
| sICOSL | 6413.32 | 259.88–8220.46 | 6411.42 | 5336.64–9826.69 |
| sCD276 | 611.78 | 238.45–1247.62 | 885.78 | 231.51–1749.88 |
| sFGL1 | 151,042.76 | 121,193.97–189,434.59 | 156,594.82 | 125,794.24–211,091.35 |
| sGAL-1 | 20,506.60 | 16,678.27–25,437.53 | 21,408.75 | 18,321.44–26,125.93 |
| sGAL-3 | 9991.40 | 8066.19–12,776.39 | 10,252.91 | 8728.84–13,004.53 |
| sMICA | 28.22 | 19.00–54.07 | 13.33 | 16.53–41.62 |
| sMICB | 611.08 | 343.44–929.92 | 512.27 | 393.76–825.87 |
| AUC (95% CI) | Sensitivity | Specificity | PPV | NPV | |
|---|---|---|---|---|---|
| NSCLC vs. Healthy | |||||
| sFGL1 | 0.919 (0.860–0.978) | 0.885 | 0.853 | 0.902 | 0.828 |
| sGAL-3 | 0.889 (0.817–0.960) | 0.904 | 0.794 | 0.904 | 0.794 |
| sGAL-1 | 0.801 (0.709–0.894) | 0.596 | 0.941 | 0.939 | 0.604 |
| sMICB | 0.711 (0.592–0.830) | 0.712 | 0.706 | 0.712 | 0.706 |
| sMICA | 0.691 (0.575–0.807) | 0.538 | 0.818 | 0.824 | 0.529 |
| sICOSL | 0.651 (0.535–0.769) | 0.808 | 0.471 | 0.700 | 0.615 |
| sCD276 | 0.624 (0.504–0.743) | 0.269 | 0.971 | 0.933 | 0.465 |
| Model (sFGL1-sGAL3) | 0.963 (0.929–0.996) | 0.827 | 0.971 | 0.997 | 0.785 |
| PFS | OS | |||||
|---|---|---|---|---|---|---|
| HR | 95% CI | p-Value | HR | 95% CI | p-Value | |
| sMICB at FR (high vs. low) | 2.348 | 1.129–4.883 | 0.022 * | 1.827 | 0.838–3.983 | 0.129 |
| sMICB at PRE 75th percentile | 2.454 | 1.180–5.102 | 0.016 * | 2.378 | 1.104–5.125 | 0.027 * |
| sMICB at FR 75th percentile | 3.643 | 1.611–8.241 | 0.002 ** | 2.938 | 1.232–7.005 | 0.015 * |
| sGAL3 at PRE (high vs. low) | 2.024 | 1.053–3.890 | 0.034 * | 1.949 | 0.992–3.830 | 0.053 |
| sGAL3 at FR 75th percentile | 2.341 | 1.082–5.064 | 0.031 * | 2181 | 0.955–4.980 | 0.064 |
Disclaimer/Publisher’s Note: The statements, opinions and data contained in all publications are solely those of the individual author(s) and contributor(s) and not of MDPI and/or the editor(s). MDPI and/or the editor(s) disclaim responsibility for any injury to people or property resulting from any ideas, methods, instructions or products referred to in the content. |
© 2023 by the authors. Licensee MDPI, Basel, Switzerland. This article is an open access article distributed under the terms and conditions of the Creative Commons Attribution (CC BY) license (https://creativecommons.org/licenses/by/4.0/).
Share and Cite
Torres-Martínez, S.; Calabuig-Fariñas, S.; Gallach, S.; Mosqueda, M.; Munera-Maravilla, E.; Sirera, R.; Navarro, L.; Blasco, A.; Camps, C.; Jantus-Lewintre, E. Circulating Immune Proteins: Improving the Diagnosis and Clinical Outcome in Advanced Non-Small Cell Lung Cancer. Int. J. Mol. Sci. 2023, 24, 17587. https://doi.org/10.3390/ijms242417587
Torres-Martínez S, Calabuig-Fariñas S, Gallach S, Mosqueda M, Munera-Maravilla E, Sirera R, Navarro L, Blasco A, Camps C, Jantus-Lewintre E. Circulating Immune Proteins: Improving the Diagnosis and Clinical Outcome in Advanced Non-Small Cell Lung Cancer. International Journal of Molecular Sciences. 2023; 24(24):17587. https://doi.org/10.3390/ijms242417587
Chicago/Turabian StyleTorres-Martínez, Susana, Silvia Calabuig-Fariñas, Sandra Gallach, Marais Mosqueda, Ester Munera-Maravilla, Rafael Sirera, Lara Navarro, Ana Blasco, Carlos Camps, and Eloisa Jantus-Lewintre. 2023. "Circulating Immune Proteins: Improving the Diagnosis and Clinical Outcome in Advanced Non-Small Cell Lung Cancer" International Journal of Molecular Sciences 24, no. 24: 17587. https://doi.org/10.3390/ijms242417587
APA StyleTorres-Martínez, S., Calabuig-Fariñas, S., Gallach, S., Mosqueda, M., Munera-Maravilla, E., Sirera, R., Navarro, L., Blasco, A., Camps, C., & Jantus-Lewintre, E. (2023). Circulating Immune Proteins: Improving the Diagnosis and Clinical Outcome in Advanced Non-Small Cell Lung Cancer. International Journal of Molecular Sciences, 24(24), 17587. https://doi.org/10.3390/ijms242417587