Article

TIMAP, a Regulatory Subunit of Protein Phosphatase 1, Inhibits In Vitro Neuronal Differentiation

Department of Medical Chemistry, Faculty of Medicine, University of Debrecen, Egyetem Tér 1, H-4032 Debrecen, Hungary
*
Author to whom correspondence should be addressed.
Int. J. Mol. Sci. 2023, 24(24), 17360; https://doi.org/10.3390/ijms242417360
Submission received: 22 October 2023 / Revised: 6 December 2023 / Accepted: 7 December 2023 / Published: 11 December 2023
(This article belongs to the Section Molecular Biology)

Abstract

:
TIMAP (TGF-β-inhibited membrane associated protein) is abundant in endothelial cells, and it has been regarded as a member of the myosin phosphatase targeting protein (MYPT) family. Our workgroup previously identified several interacting protein partners of TIMAP and proved its regulatory subunit role for protein phosphatase 1 catalytic subunit (PP1c). TIMAP is also expressed in neuronal cells, but details of its function have not been studied yet. Therefore, we aimed to explore the role of TIMAP in neuronal cells, especially during differentiation. Expression of TIMAP was proved both at mRNA and protein levels in SH-SY5Y human neuroblastoma cells. Differentiation of SH-SY5Y cells was optimized and proved by the detection of neuronal differentiation markers, such as β3-tubulin, nestin and inhibitor of differentiation 1 (ID1) using qPCR and Western blot. We found downregulation of TIMAP during differentiation. In accordance with this, overexpression of recombinant TIMAP attenuated the differentiation of neuronal cells. Moreover, the subcellular localization of TIMAP has changed during differentiation as it translocated from the plasma membrane into the nucleus. The nuclear interactome of TIMAP revealed more than 50 proteins, offering the possibility to further investigate the role of TIMAP in several key physiological pathways of neuronal cells.

1. Introduction

Reversible protein phosphorylation is a fundamental and crucial posttranslational modification of proteins that regulates the activity, conformation, interacting partners or cellular fate of proteins. Protein kinases attach a phosphate group to Ser, Thr or Tyr side chain of proteins [1], while protein phosphatases are able to remove it by hydrolysis [2,3]. Protein phosphatase 1 (PP1) enzyme was the first identified Ser/Thr phosphatase [2,4], and it is responsible for the dephosphorylation of over half of the phosphoserine/threonine residues in eukaryotic cells [5]. It takes part in many intracellular processes in eukaryotic cells, such as protein translation, apoptosis, glycogen metabolism, signal transduction and RNA processing [2,6]. Structurally active PP1 holoenzymes consist of a catalytic subunit in complex with at least one regulatory subunit, also known as PP1 interacting protein (PIP). The ~37 kDa catalytic subunits, PP1c, are highly preserved among the species and are encoded by three genes in mammals: PPP1CA, PPP1CB and PPP1CC, resulting in four isoforms PP1cα, PP1cβ (a.k.a. PP1cδ), PP1cγ1 and PP1cγ2 (resulting from alternative splicing) [2,7,8,9,10,11]. The expression of all isoforms is widespread except for PP1γ2, which is predominantly found in testes and sperm [8].
TIMAP (TGF-β-inhibited membrane-associated protein) belongs to the myosin phosphatase targeting protein (MYPT) family as one of the regulatory subunits of the PP1 holoenzyme [12]. TIMAP is predominant in hematopoietic cells, and an increasing number of papers explore its function in endothelial cells [13]. As a PP1 regulatory subunit, its main function is considered to control the activity of the δ isoform of PP1c [14,15]. TIMAP undergoes reversible phosphorylation on multiple Ser side chains, and the substrate specificity of TIMAP–PP1c relies on its phosphorylation state [12,16]. Among other phosphoproteins, ezrin–radixin–moesin (ERM) and merlin (neurofibromin 2; NF2) were identified as TIMAP–PP1c substrates in endothelial cells (reviewed in [13]). ERM proteins and merlin have a prominent role in neuronal cell functions, and their altered expression or posttranslational regulation are associated with serious diseases, for example, neurofibromatosis [17]. TIMAP mRNA was detected in tissues derived from the rat central nervous system such as the cerebellum, forebrain or brainstem; however, no detailed research was carried out in neuronal cells [14,18]. The coding gene (ppp1r16b) for TIMAP was identified as a prognostic biomarker of glioblastoma multiforme, a type of primary brain tumor, shown by integrated analysis of methylation and expression profiles [19]. The high expression level and the limited knowledge about TIMAP in neuronal cells raised our interest in studying the role of TIMAP in these cell types.
SH-SY5Y human neuroblastoma cell line is widely utilized as an in vitro model system in neurobiology, in particular for research focusing on neurodegenerative diseases such as Alzheimer’s disease [20], Parkinson’s disease [21]; neuronal aging [22], neuronal toxicology [23] as well as in the field of neurovirology [24]. The most advantageous quality of the SH-SY5Y cell line lies in its capability of being able to be differentiated into neuron-like phenotype exhibiting morphological and gene expressional similarities to that of mature neurons [25]. Undifferentiated SH-SY5Y cells show rounded morphology, non-polarized cell bodies with a low number of truncated cell processes [26]. When SH-SY5Y cells are fully differentiated into a neuron-like phenotype, they exhibit extended, often branched processes as well as withdrawal from the cell cycle [27]. Beside the morphological alterations, gene up- or downregulation are both easy-to-follow hallmarks of the differentiation. SH-SY5Y cells express neuronal markers such as proliferating cell nuclear antigen (PCNA), nestin, limited amount of dopamine-ß-hydroxylase (DBH), neurofilament proteins as well as nerve growth factor receptors (NGFR, butyryl-cholinesterase (BChE), acetylcholinesterase (AChE), tyrosine hydroxylase (TH) and basal noradrenaline release [25,26,27]. Differentiated cells express a variety of mature neuronal markers including growth-associated protein (GAP-43), synaptophysin (SYN), synaptic vesicle protein II (SV2), neuronal nuclei antigen (NeuN), neuron-specific enolase (NSE) and microtubule-associated protein-2 (MAP-2), β3-tubulin or high-weight neurofilament (NF-H) [25]. These features of SH-SY5Y were utilized in the present study to explore the role of TIMAP in neuronal cells, especially in differentiation.

2. Results

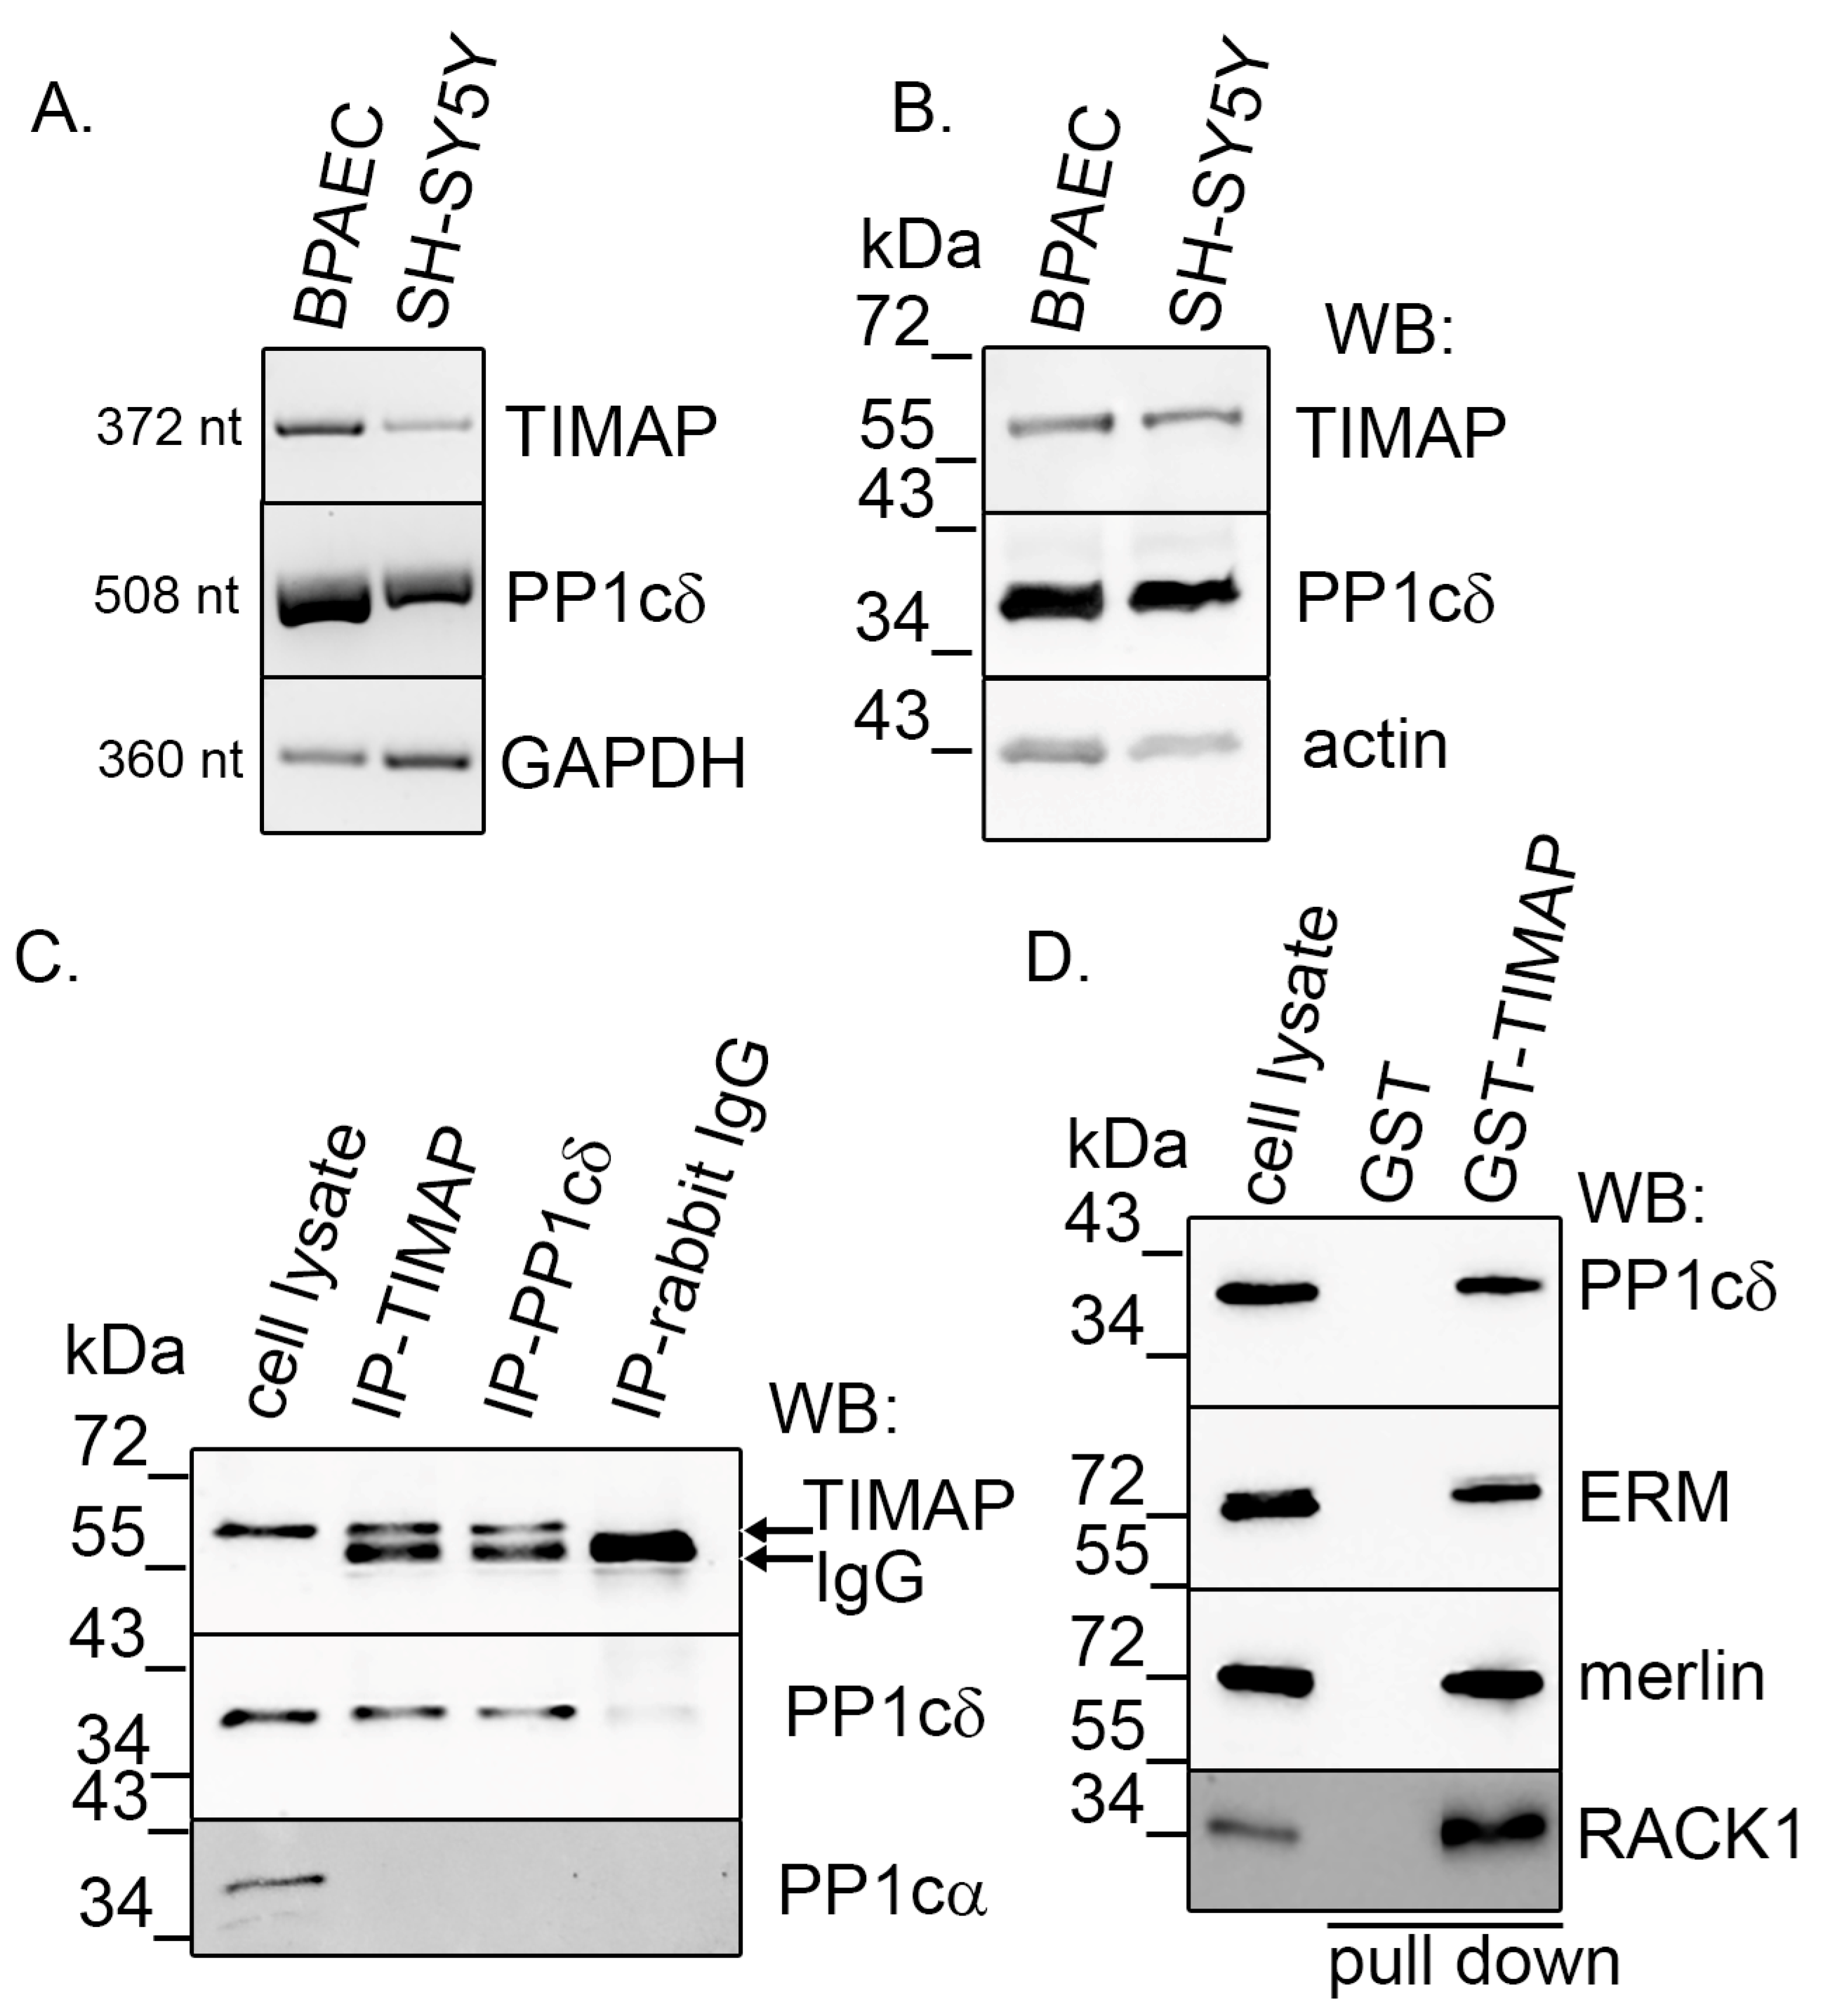
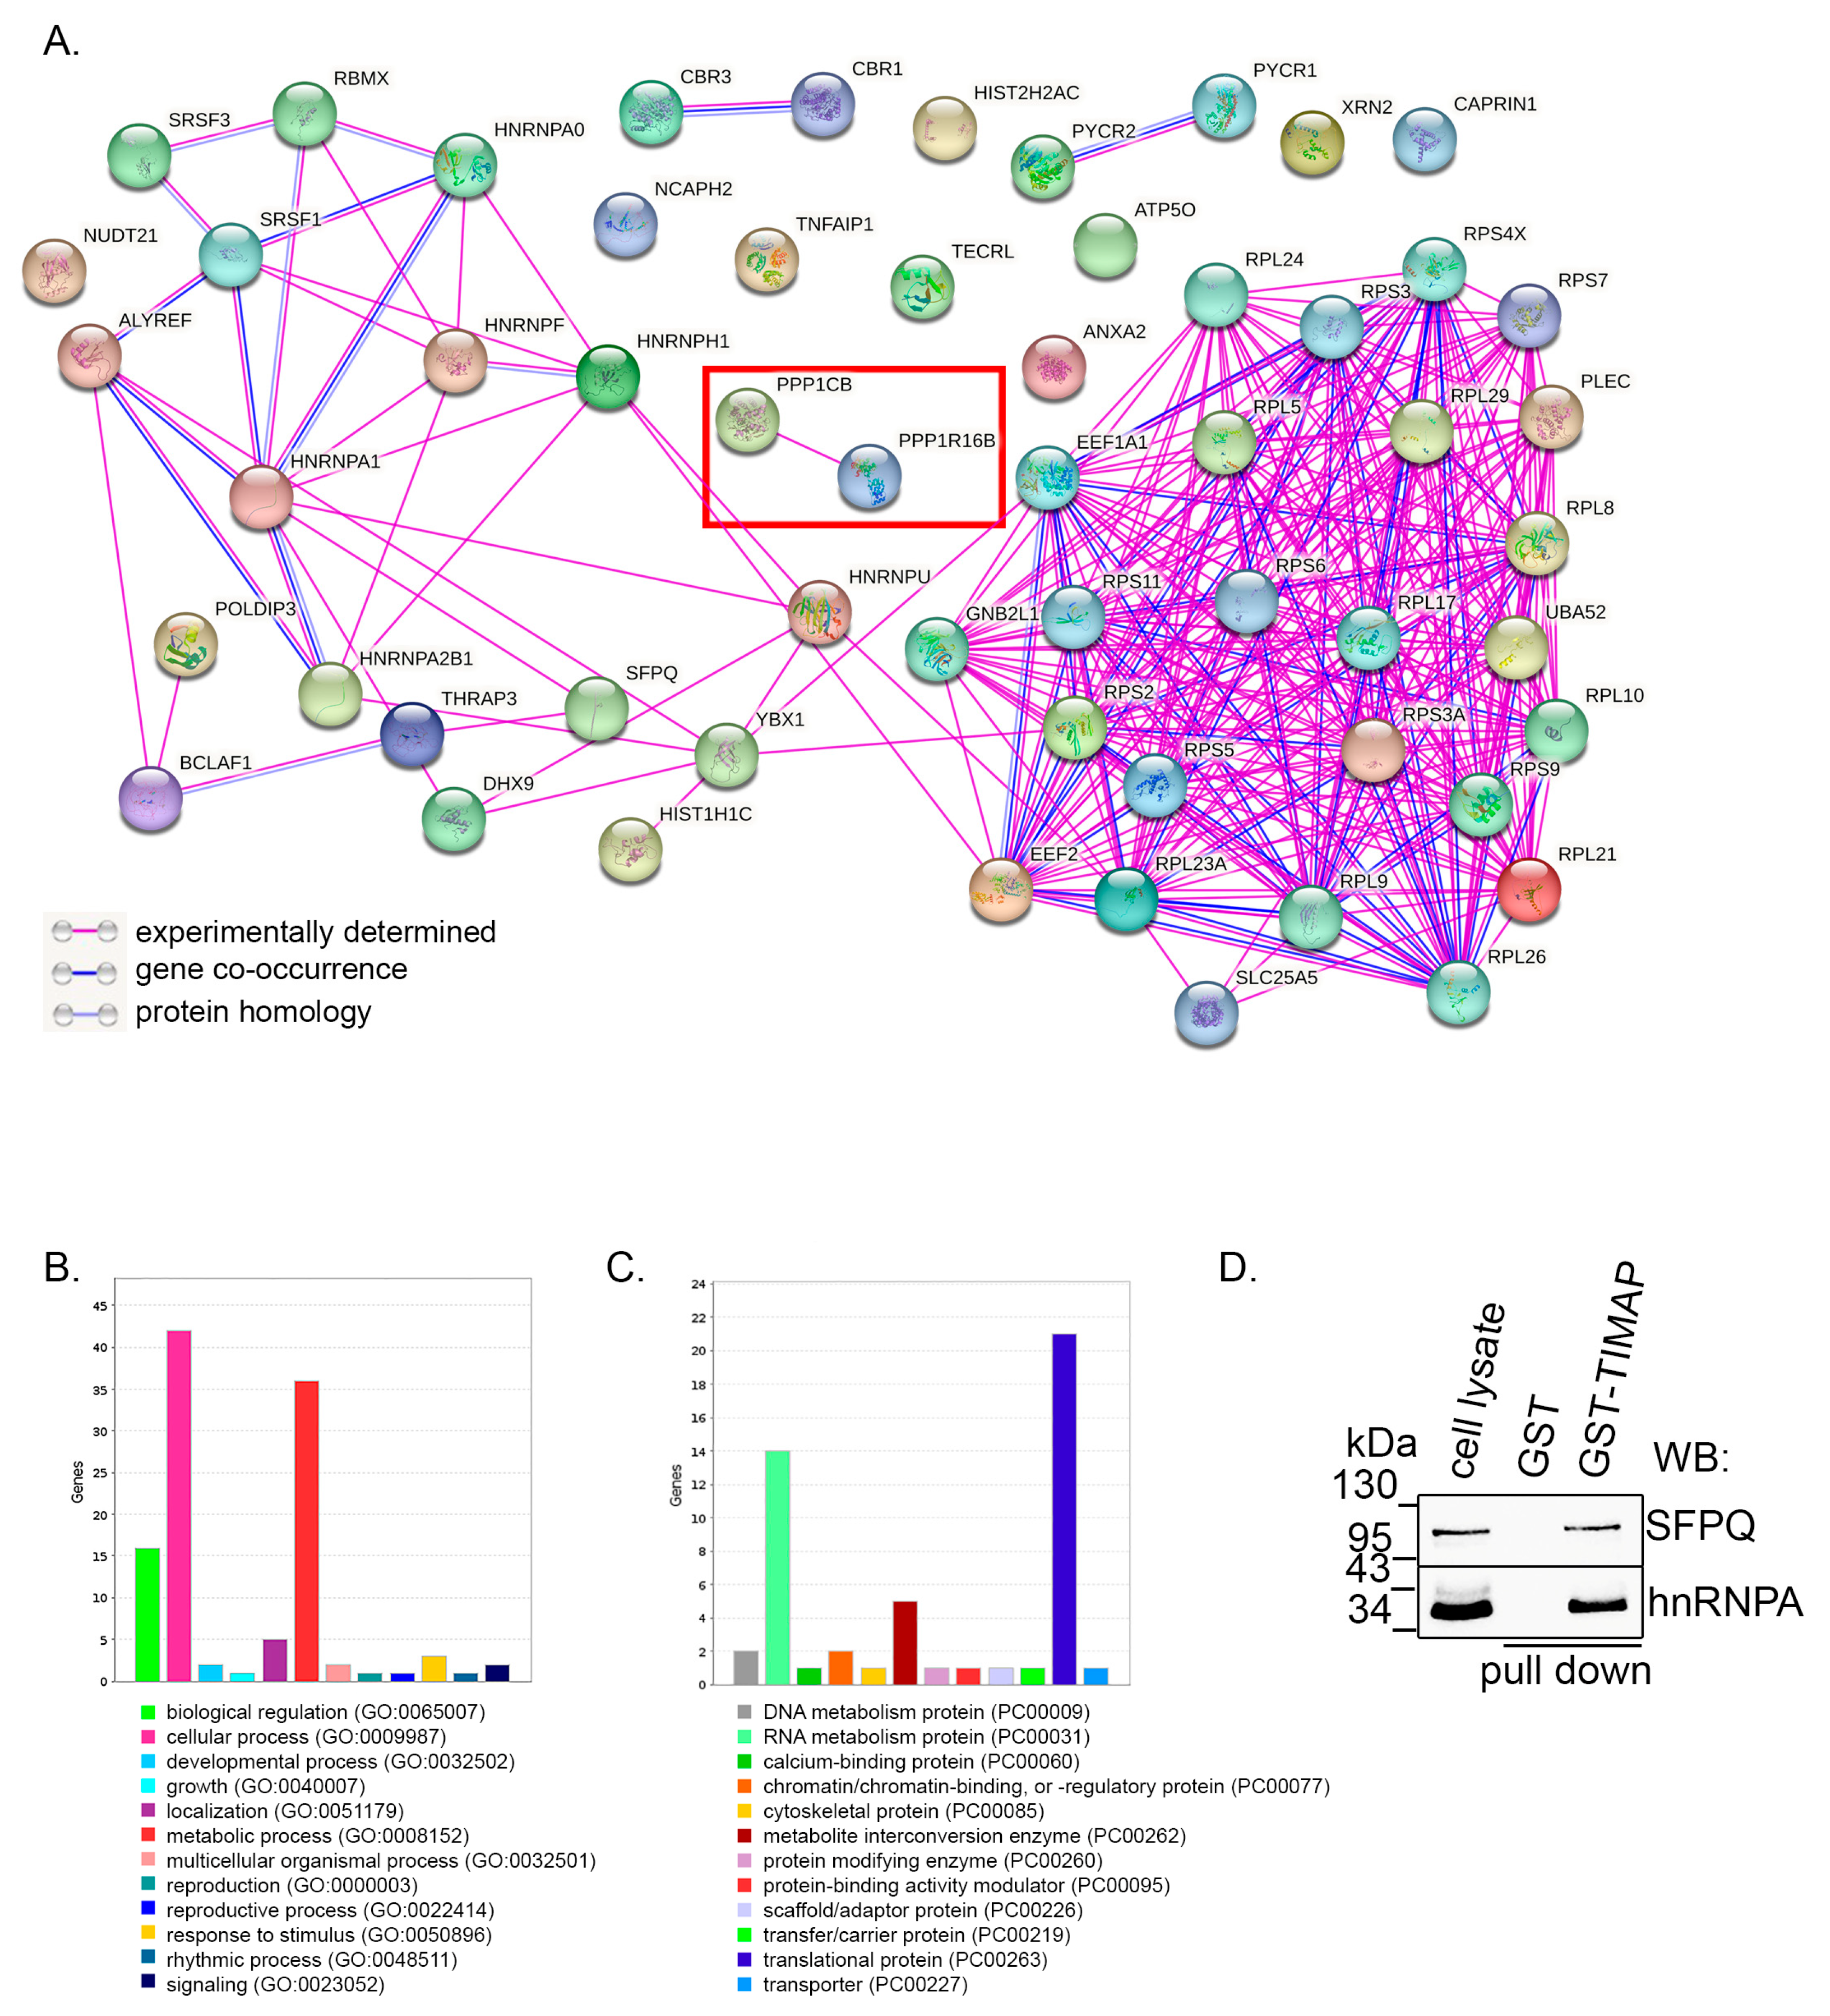
2.1. TIMAP–PP1c Complex Is Present in SH-SY5Y Cells

SH-SY5Y human neuroblastoma cell line was used as a model system to study the TIMAP–PP1c complex in neuronal cells. First, we confirmed that TIMAP (PPP1R16B; UNIPROT: Q96T49) and PP1cδ (PPP1CB; UNIPROT: P62140) mRNA and proteins are present and expressed in these cells. RT-PCR was performed using total RNA isolated from SH-SY5Y cells. As a positive control, bovine pulmonary artery endothelial cell (BPAEC) cDNA was used, as TIMAP is highly expressed in endothelial cells [14]. Primers were designed to recognize both human and bovine sequences. PCR products were identified at the expected base pair sizes both with TIMAP- and PP1cδ-specific primer pairs (Figure 1A). The expressions of these genes at protein level were verified by Western blots from total SH-SY5Y and BPAEC cell lysate, as positive control. The utilized antibodies demonstrated the ability to detect both human and bovine proteins, as expected from the manufacturers. Figure 1B shows that SH-SY5Y cells express both TIMAP and PP1cδ. TIMAP is a well-known regulatory subunit of PP1cδ in endothelial cells, and several substrates of the active holoenzyme have also been described [13]. To confirm that TIMAP specifically binds to PP1cδ in neuronal cells, endogenous TIMAP–PP1cδ interaction was confirmed by immunoprecipitation using specific antibodies. TIMAP was detected in the immunoprecipitate of PP1cδ and vice versa; moreover, no interaction was detected with PP1cα (Figure 1C). GST-tagged bacterially expressed TIMAP protein was used in pull-down method to examine the binding of TIMAP–PP1c interacting partners/substrates described earlier in endothelial cells. Our results prove that ERM, merlin and receptor for activated C kinase 1 (RACK1) proteins bind to the TIMAP–PP1cδ complex in neuronal cells as well (Figure 1D).

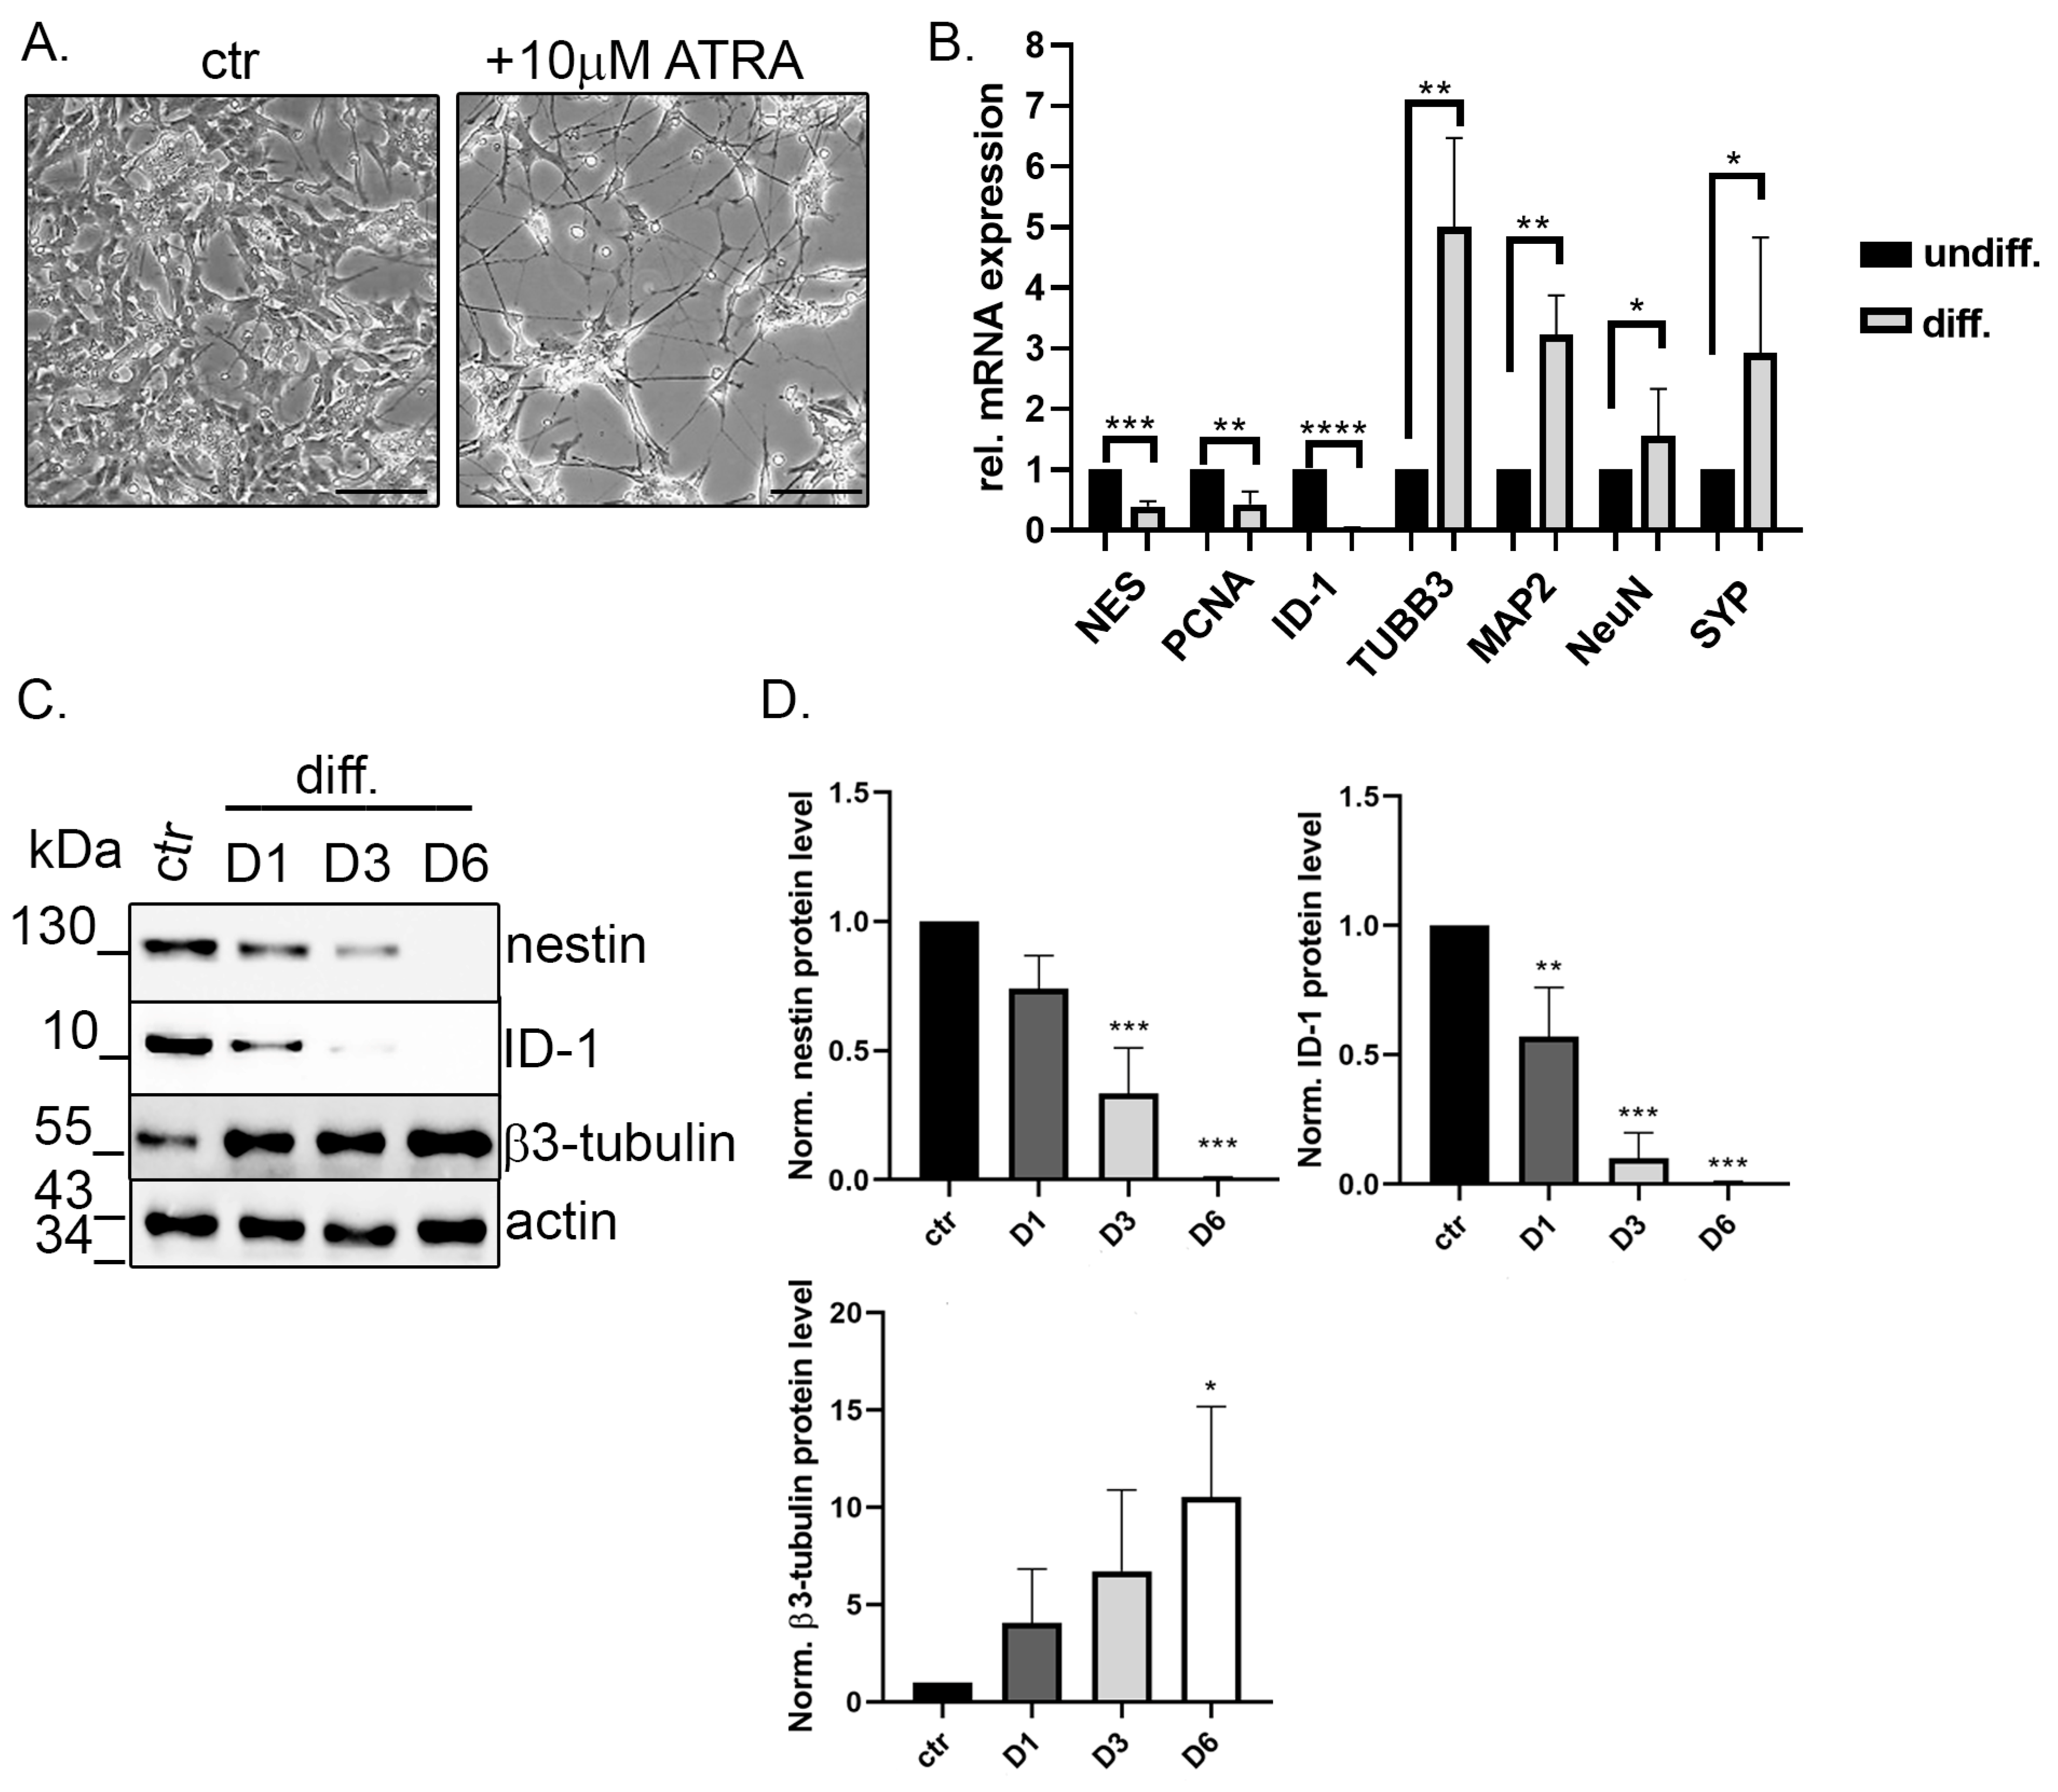
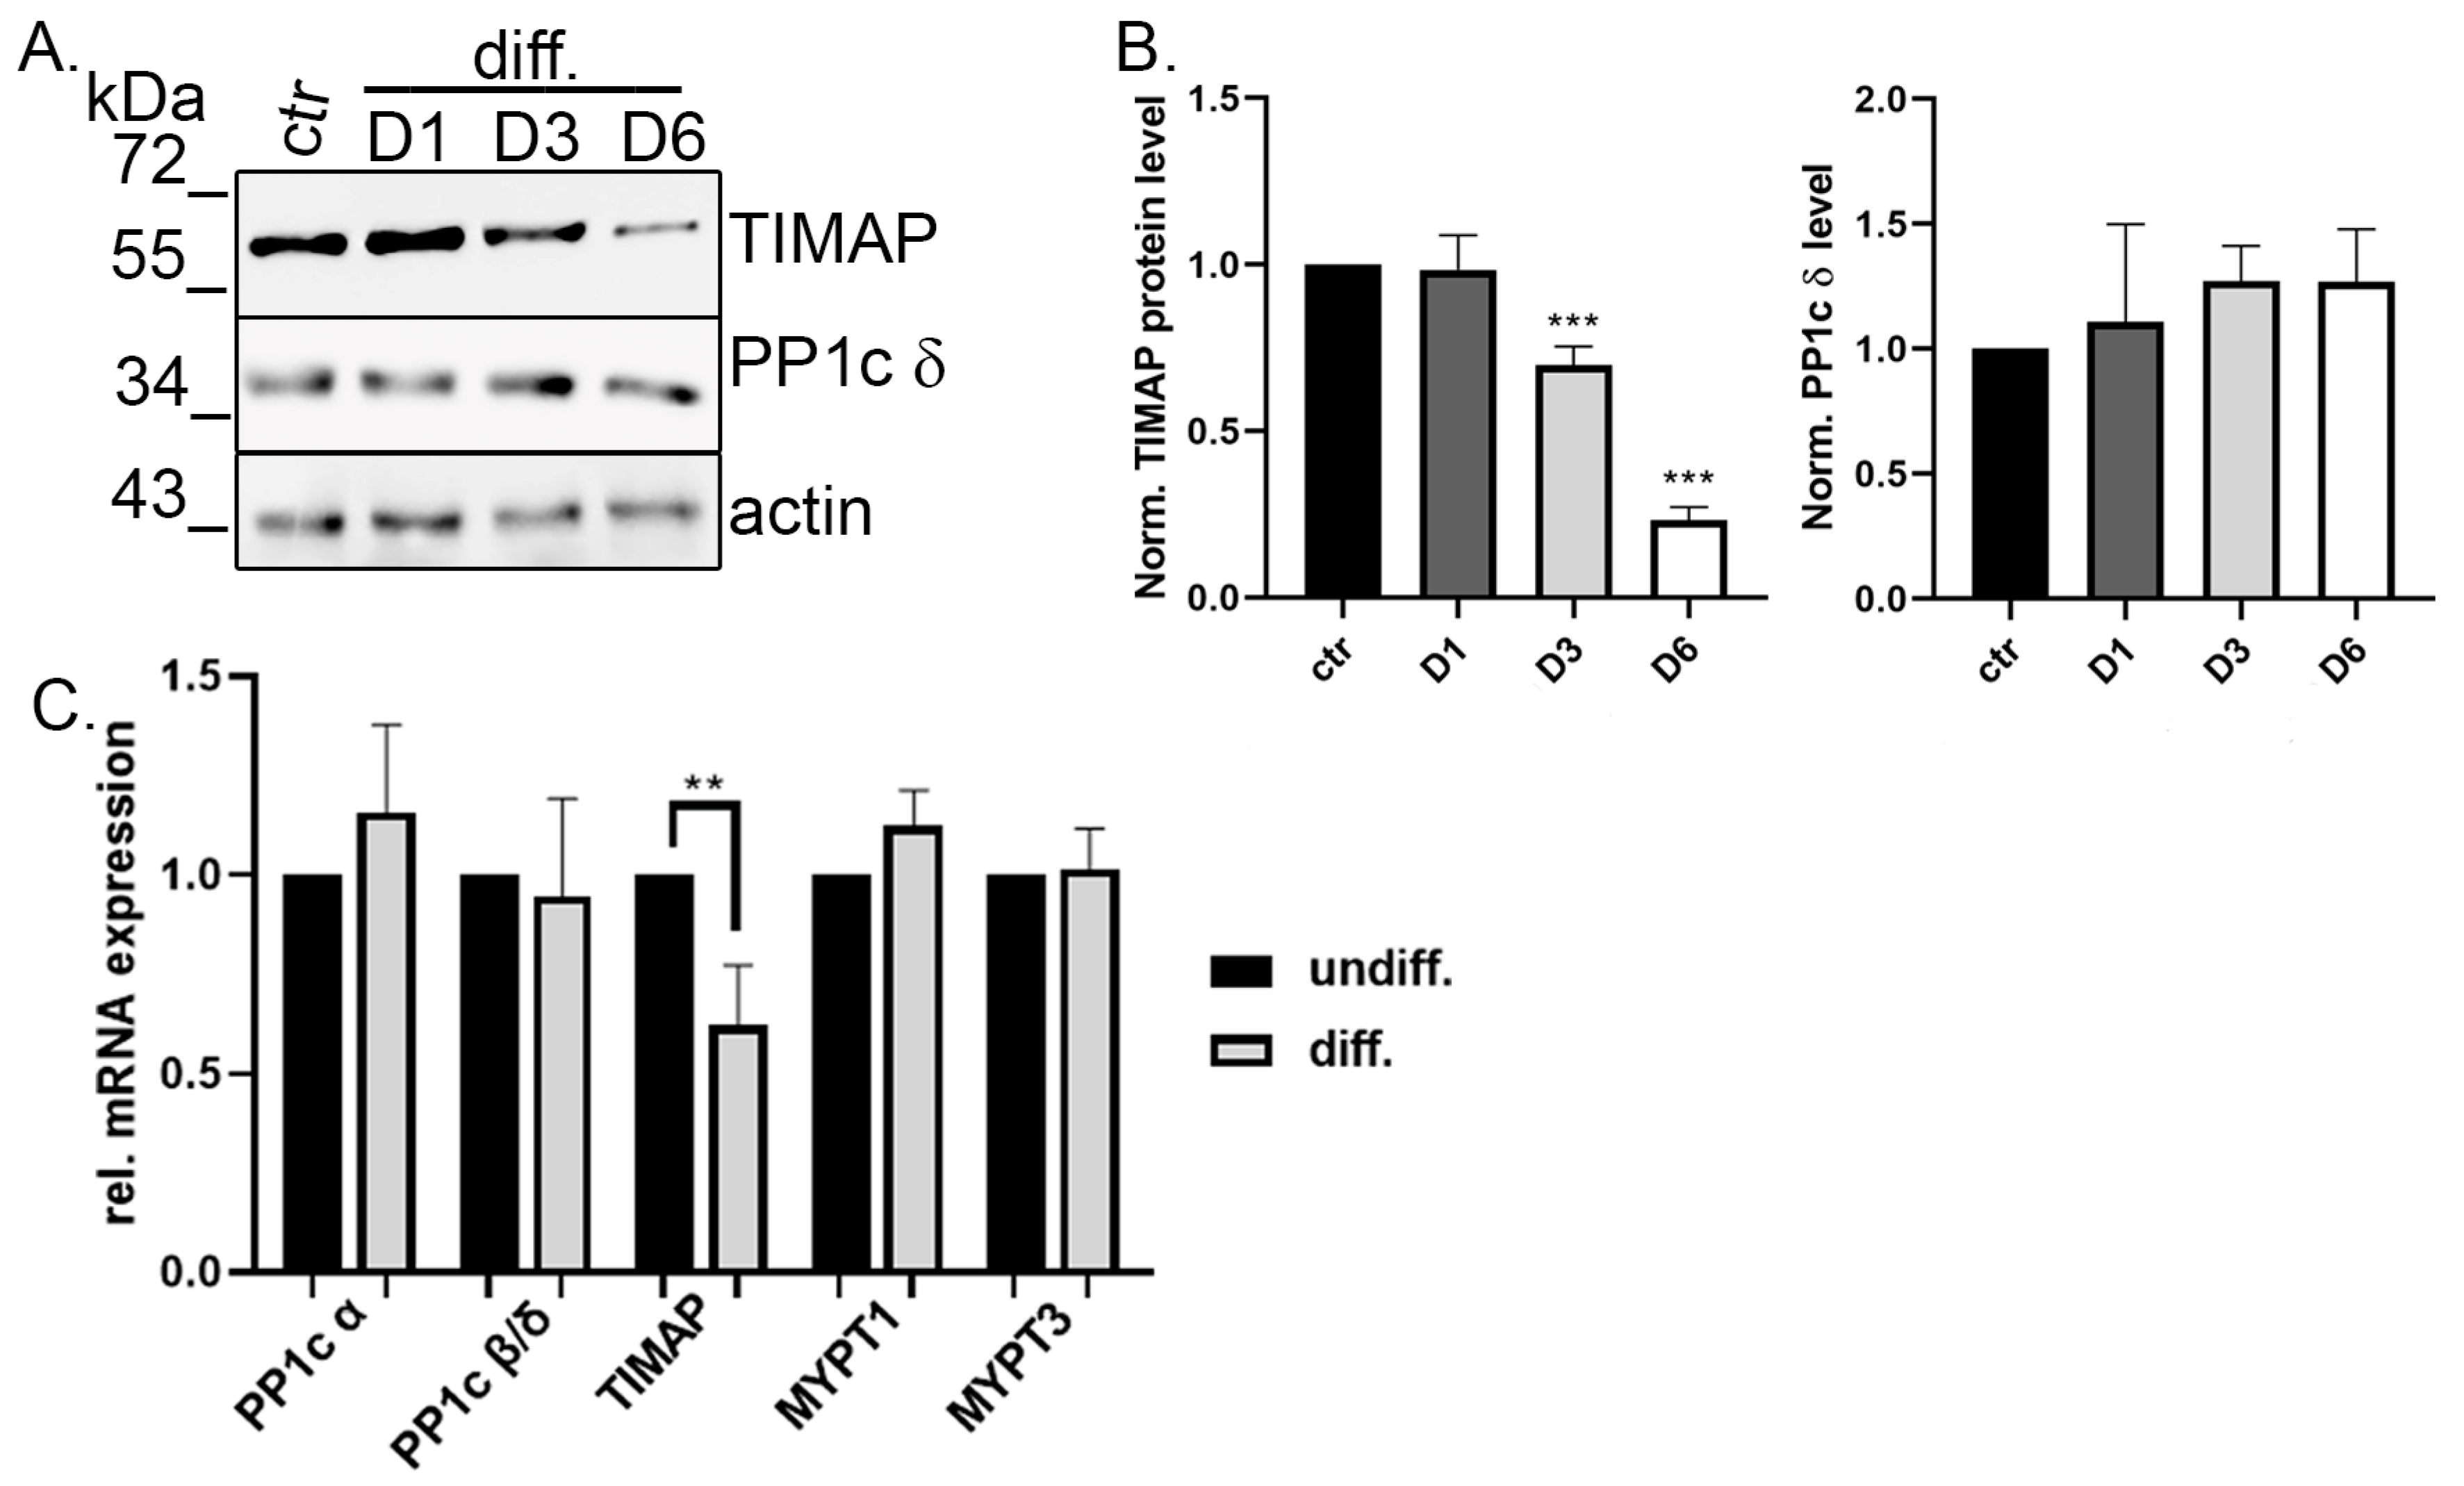
2.2. TIMAP Is Downregulated in Differentiated SH-SY5Y Cells

Next, differentiation of SH-SY5Y cells initiated by all trans retinoic acid (ATRA) was tested. Treated cells achieved a typical neuronal phenotype with extended neurites by the end of the 6th day, while the undifferentiated cells maintained relatively short neurites (Figure 2A). Relative levels of genes affected by differentiation were measured by qPCR. Undifferentiated and differentiated (Day 6 of ATRA treatment) cells were used to extract total RNA and qPCR was performed (Figure 2B). Unmature neuron markers like nestin (NES), inhibitor of differentiation 1 (ID-1) or proliferating cell nuclear antigen (PCNA) had a significantly lower level in differentiated cells, while mature neuronal markers like β3-tubulin (TUBB3), microtubule-associated protein 2 (MAP2), neuronal nuclei (NeuN) or synaptophysin (SYP) increased greatly, proving the successful differentiation of the cells (Figure 2B). Protein levels of ID-1, nestin and β3-tubulin were also compared by Western blot analysis during the differentiation by taking samples on Day 1, Day 3 and Day 6 (Figure 2C). A gradually decreasing protein expression level was found for ID-1 and nestin, in contrast with the intensifying β3-tubulin level. As the sign of full differentiation, both ID-1 and nestin proteins were undetectable at Day 6 (Figure 2C,D).
Then, we analyzed TIMAP and PP1cδ mRNA and protein expression levels during the differentiation. Protein samples, collected from control and Day 1, Day 3 and Day 6 of differentiation, were subjected to Western blot using TIMAP- and PP1cδ-specific antibodies (Figure 3A). The normalized protein level of PP1cδ did not show any changes, while the TIMAP protein level was significantly reduced on Day 6 compared to control (Day 0) (Figure 3B). qPCR results revealed that the relative mRNA expression level of TIMAP was also lower in differentiated cells, while no significant changes were detected for PP1cδ, or the other abundant catalytic subunit isoform, PP1cα. Other PP1 regulatory members of the MYPT family, namely myosin phosphatase target subunit 1 (MYPT1) or myosin phosphatase target subunit 3 (MYPT3), were also checked; however, no alterations were found (Figure 3C).

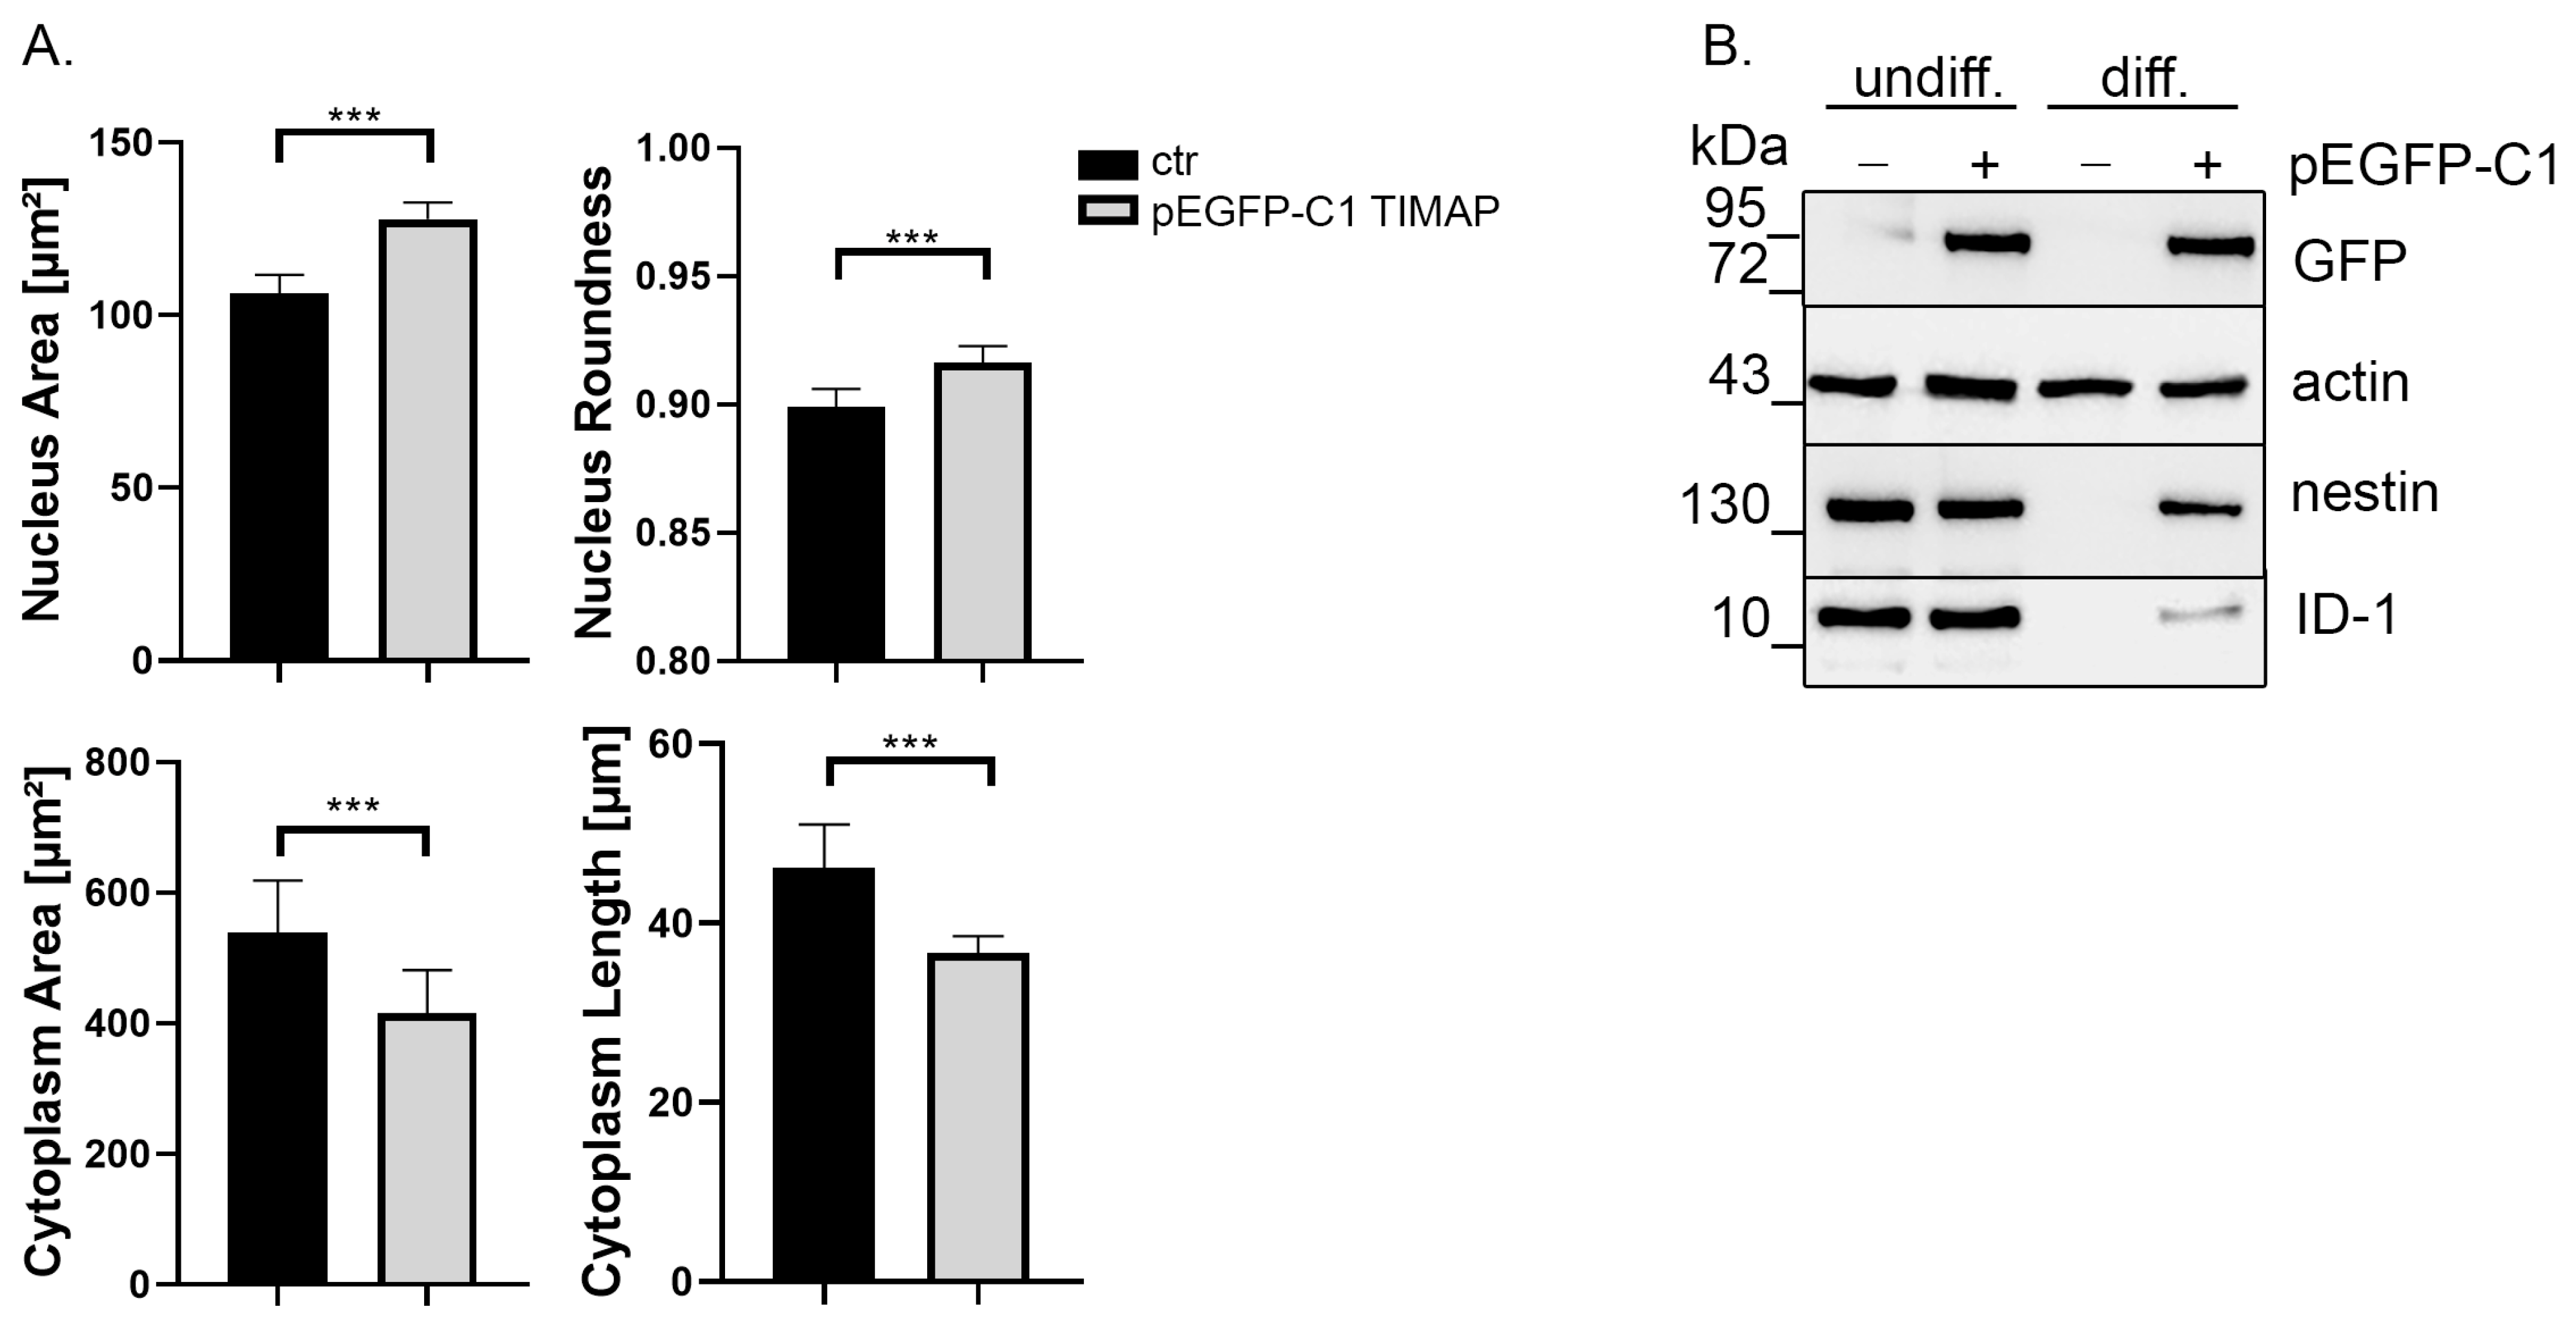
2.3. TIMAP Overexpression Delays Neuronal Differentiation

Subsequently, we tested the effect of TIMAP overexpression on differentiation and cell morphological changes of ATRA-treated SH-SY5Y cells. Cells were transiently transfected with pEGFP-C1 TIMAP plasmid. Transfected and non-transfected cells were tested for TIMAP antibody as well (Figure S1A). Differentiation 24 h post-transfection was performed as earlier. Morphological alterations were analyzed using Opera Phenix HCS (Figure S1B). Nucleus area and roundness were enlarged in transfected and differentiated cells, while cytoplasm area and length were significantly smaller compared to the differentiated cells without transfection (Figure 4A). This morphological phenotype of the TIMAP-overexpressing cells is similar to the undifferentiated cell phenotype, suggesting that overexpression of TIMAP attenuates neuronal differentiation. Therefore, differentiation markers were tested at protein level (Figure 4B). Untransfected and TIMAP transfected cells were differentiated, and samples were collected on Day 6. The strong GFP signal of the transfected cell sample shows that the recombinant TIMAP was present during the differentiation. In the untransfected cells, the protein level of nestin and ID-1 reduced greatly to an undetectable level, as expected, while in the TIMAP-overexpressing cell samples, although reduced, an apparent amount of nestin and ID-1 protein was however detected. These results clearly indicate that differentiation was delayed or incomplete in TIMAP-overexpressing cells.

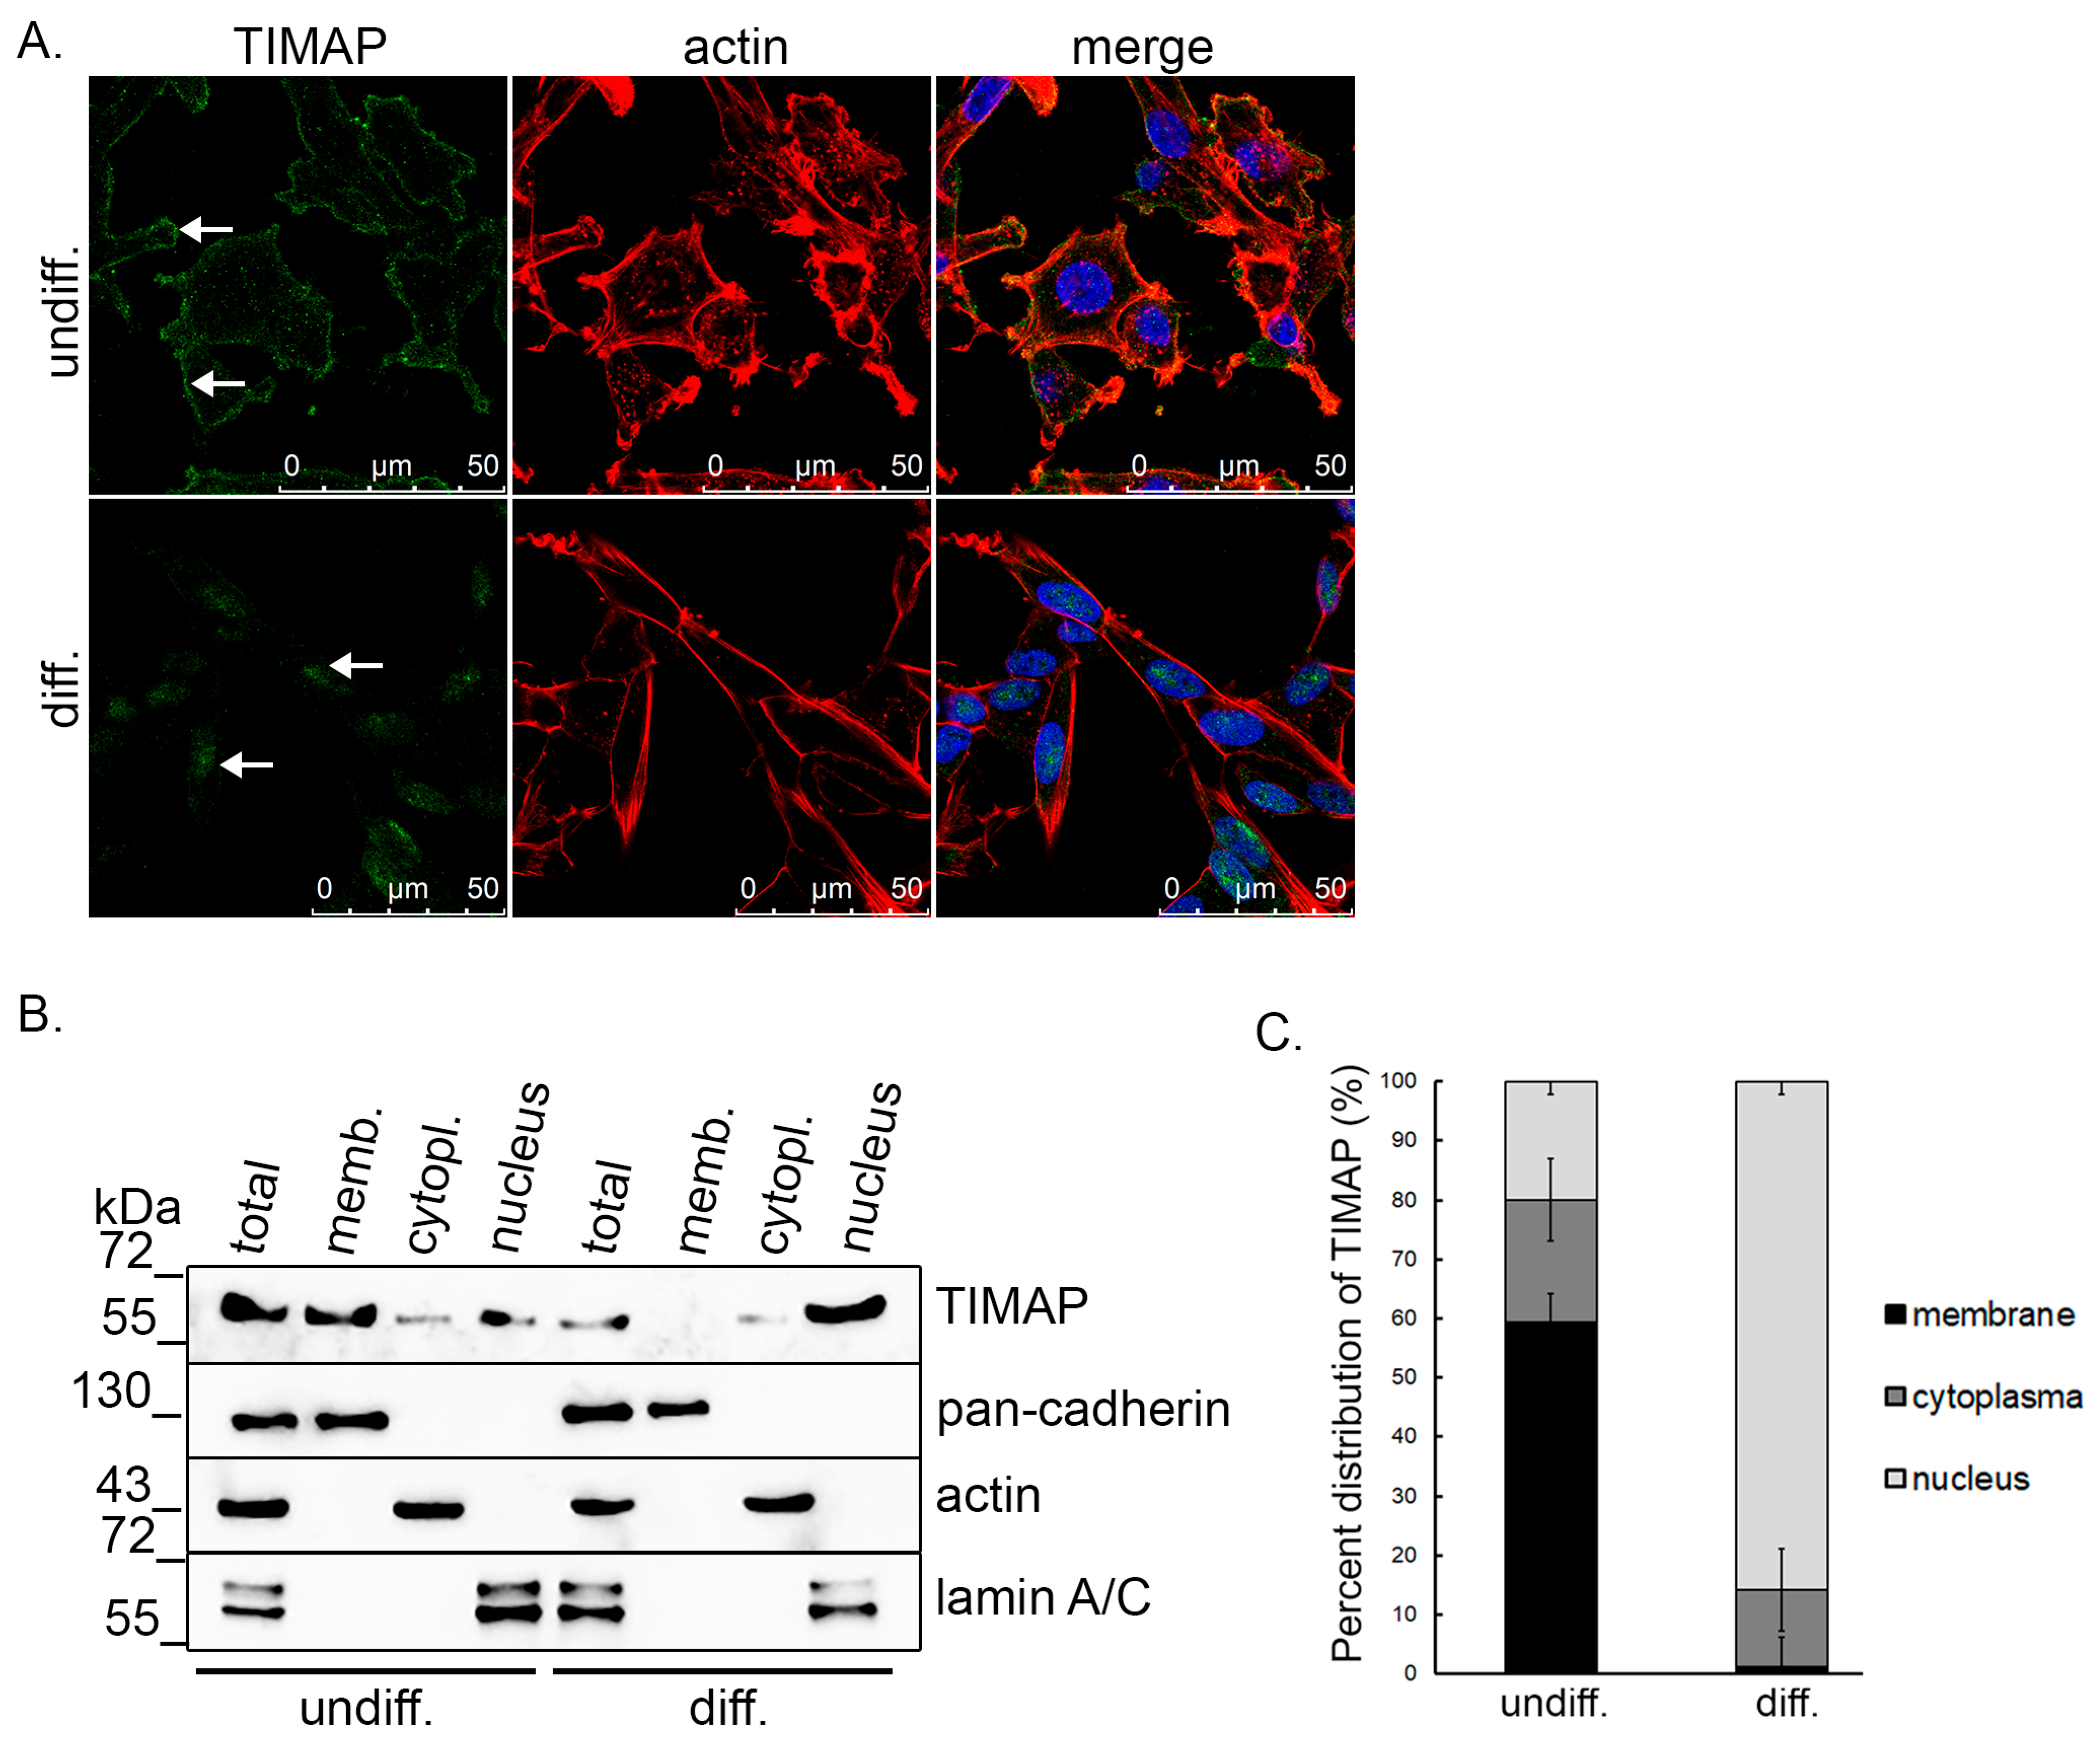
2.4. TIMAP Translocate into the Nucleus of SH-SY5Y Cells upon Differentiation

As we showed above, TIMAP protein level decreases during differentiation. Therefore, immunofluorescent staining of undifferentiated and differentiated cells was carried out to study TIMAP subcellular localization. In undifferentiated SH-SY5Y cells, TIMAP was located in the membrane area, whereas in differentiated cells, TIMAP was predominantly observed in the nuclei (Figure 5A). This localization change was also studied by testing subcellular fractionations of the undifferentiated and differentiated cells by Western blot analysis. TIMAP was present with a higher abundancy in the membrane fraction of undifferentiated cells compared to the cytoplasmic and nuclear fractions. In differentiated cells, despite the lower total amount of the protein, a more pronounced appearance was found in the nucleus (Figure 5B).
To learn about the possible role of TIMAP in the nucleus, we initiated further studies to explore its nuclear interactome. Nuclear fraction of undifferentiated SH-SY5Y cells was performed and subsequently used in GST–TIMAP pull-down assay. Potential interacting proteins were separated on SDS-PAGE, and MS/MS analysis was performed. Fifty-seven potential TIMAP interacting partners were identified (Table 1).
Figure 6A shows the STRING network analysis (https://string-db.org/; accessed on 9 September 2023) of the found proteins integrating the known and predicted associations in humans. Annexin A2 (ANXA2), eEF1A1 (eukaryotic elongation factor 1A) and RACK1 (GNBL21) interaction with TIMAP has already been reported in BPAEC cells [28,29,30]. To classify the proteins by their biological process (Figure 6B) and by their protein class (Figure 6C), panther gene ontology (GO) term analysis was performed (http://pantherdb.org; accessed on 9 September 2023). The majority of the identified proteins play a role in cellular and metabolic processes and belong to the translational and RNA metabolism protein classes. We also analyzed the direct interaction of two of the identified proteins, namely SFPQ and hnRNPA1. Figure 6D shows that both proteins are detectable in the pull-down samples.

3. Discussion

Neuronal differentiation involves intricate regulation by numerous signaling pathways. The complexity relies on gene expression up/downregulation; furthermore, the regulation is also influenced by posttranslational modifications of several proteins, such as reversible phosphorylation. Many recent studies have shown the involvement of protein phosphorylation and dephosphorylation not only in neuronal differentiation but also in many neurodegenerative disorders such as Parkinson’s or Alzheimer’s disease [31,32,33]. These findings presenting the importance of protein phosphatases were expected, as the brain expresses the highest levels of protein kinases and phosphatases of all mammalian tissues [34].
Protein phosphatases achieve their specificity through their regulatory subunits. TIMAP is considered as an endothelial-cell-predominant regulatory subunit of PP1, a Ser/Thr-specific protein phosphatase, and it belongs to the MYPT family [14]. In addition to the high expression level of TIMAP in endothelial cells, a reasonable amount was found in neuronal cells as well [14]. This piqued our interest to study the function of TIMAP in neuronal cells. The limited literature on the topic made the research challenging, but the present study focusing on TIMAP is just the first step to uncovering new protein phosphatase-1-based signaling mechanisms in neuronal cells.
The usage of B35 (rat neuroblastoma), PC12 (harvested from a pheochromocytoma rat adrenal medulla) or Neuro-2A (mouse neuroblast) cells is very common in neuronal signaling studies, but gene expression differences and signaling pathways alterations exist between these non-human cells vs. human cells [35,36,37]. Therefore, we used SH-SY5Y human neuroblastoma cell line that is originated from the SK-N-SH parental cell line obtained in 1973 through a multitude of subcloning [38].
In the present study, we have characterized a novel signaling pathway of neuronal differentiation involving TIMAP. We showed that SH-SY5Y cells express both TIMAP and PP1cδ, and the presence of the endogenous TIMAP–PP1c complex was also proved. The expression of PP1c isoforms in the brain was shown earlier, having the highest expression for PP1cα and PP1cγ, but all isoforms are considered as abundant [34]. Although TIMAP can bind all three isoforms of PP1c in vitro, it specifically interacts with the PP1cδ isoform in cells [39].
A multitude of approaches have been used for differentiation of SH-SY5Y cells including the standalone use or combination of serum deprivation, all-trans retinoic acid (RA) [40], dibutyryl cyclic AMP (dbcAMP) [41], brain-derived neurotropic factor (BDNF) [42], vanadate [43], nerve growth factor [44], estradiol (17-beta-estradiol), TPA (12-o-tetradecanoyl-pherbol-13-acetate) [45], cholesterol [46] and 1,25-dihydroxycholecalciferol (D3) [47]. With specific use of these differentiation agents, it is possible to produce a mature neuron-like cell population of dopaminergic, cholinergic or adrenergic neuronal phenotypes. Although many agents are in use to induce differentiation of SH-SY5Y cells, the effects of them on signaling pathways are less known. In contrast, retinoic acid, a vitamin A derivative, has well-documented effects on neuronal differentiation [48]. It is often used in 10 µM concentration through a differentiation period ranging from 5 to 21 days [25]. Retinoic acid signaling is mediated by two receptor types: the RXRs and the RARs, members of the nuclear hormone receptors acting by regulation of the transcriptional activity of their target genes [48].
All these advantages led us to choose the simplest protocol for SH-SY5Y differentiation using ATRA with the shortest incubation time to study the role of TIMAP protein in neuronal differentiation. Successful differentiation was confirmed by analyzing morphological changes as well as by the detection of expression of key differentiation markers. Interestingly, differentiated cells had lower ppp1r16b (TIMAP) mRNA level and, eventually, decreased TIMAP protein level. However, PP1c levels were not affected due to differentiation. In endothelial cells, TIMAP competes with MYPT1 for PP1c, and its overexpression reduces MYPT1 protein level [49]. MYPT1 expression in neuronal cells has been reported earlier [50]. Therefore, the expression of MYPT1 and MYPT3, members of the MYPT family that are largely homologous of TIMAP, was tested. We found that neither MYPT1 nor MYPT3 is up/downregulated upon differentiation; therefore, we concluded that during the differentiation of SH-SY5Y cells, the lower level of TIMAP is not compensated by an increased expression of other MYPT family members. Furthermore, our results demonstrated that overexpression of TIMAP in SH-SY5Y cells delayed neuronal differentiation. Not only nestin and ID-1 were detectable by Western blot in TIMAP-overexpressed and ATRA-treated cells on Day 6, but the cell morphology was resembling that of the immature phenotype. TIMAP-overexpressing cells had a significantly larger and rounder nucleus and their cytoplasm was smaller and shorter. This phenotype is more similar to the undifferentiated cells as differentiation results in an elongated cell morphology.
TIMAP was present mostly in the plasma membrane of SH-SY5Y, shown by cell fractionation and immunofluorescent staining. TIMAP has a C-terminal prenylation motif (CAAX-box) that allows its membrane localization [14]. In endothelial cells, an adaptor protein, RACK1, binds farnesyl transferase and TIMAP simultaneously and ensures C-terminal modification of TIMAP that directs the protein into the plasma membrane [28]. It was shown that the TIMAP–PP1c complex has several substrates in endothelial cell membrane, like ECE-1, ERM, merlin proteins (reviewed in [13]). Here, we showed the interaction of TIMAP–PP1c with RACK1 and ERM in SH-SY5Y cells as well.
Upon differentiation, we found that TIMAP translocated to the nuclear region of cells. TIMAP has an N-terminal bipartite nuclear localization signal that explains its nuclear appearance. The presence of TIMAP in the nucleus was detected earlier in pulmonary endothelial cells [12]. Yet, this is the first signaling pathway that was identified resulting in the translocation of TIMAP into the nucleus of cells. As TIMAP seems to inhibit differentiation, the nuclear interactome of TIMAP was analyzed in undifferentiated cells. With the possibility in mind that the decreased total protein levels may effect endogenous interaction detection, we carried out pull-down assay using recombinant TIMAP and the nuclear fraction of the undifferentiated SH-SY5Y cells. Although GST pull-down assay has limitations compared to endogenous IP (such as lack of posttranslational modifications of TIMAP), the nuclear interactome of TIMAP revealed numerous new potential binding partners of TIMAP besides the ones that were identified earlier in endothelial cells, namely ANXA2, eEF1A1 and RACK1 [28,29,30]. We showed before that eEF1A1 is involved in the nuclear trafficking of TIMAP, but it is not exclusively responsible for its nuclear export. However, eEF1A1 phosphorylated by ROCK seemed to be the substrate of the TIMAP–PP1c complex [30]. Several publications showed a decreased expression of eEF1A1 in Parkinson’s or Alzheimer’s disease patients [51,52,53]. The interaction of TIMAP with PP1cδ (PPP1CB) in the nucleus implies that the TIMAP–PP1c complex can have substrates in the nucleus. The nuclear interactome of TIMAP showed that its interacting partners are predominantly proteins involved in translation and RNA metabolism. Dysregulation of translation, phosphorylation of translational proteins can lead to serious conditions [54]. As there are several proteins that are found to form larger complexes from the identified partners, further verification of direct interaction with TIMAP should be conducted with specific assays. From the interactome, we chose heterogeneous nuclear ribonucleoprotein A1 (hnRNPA1) and splicing factor proline- and glutamine-rich (SFPQ) proteins to verify their interaction with TIMAP–PP1c. HnRNPA1 seems to be a hub protein among the interaction partners. It is known to be involved in pre-mRNA splicing, mRNA transport, RNA transcription and protein translation, and several studies showed that it contributes to neurodegenerative diseases too [55]. HnRNPA1 undergoes many posttranslational modifications including phosphorylation on Ser/Thr side chains [56,57,58,59]. Although the kinases responsible were identified, no phosphatases were described which ensure reversibility. One may hypothesize that TIMAP–PP1c could be responsible for dephosphorylation of (some of) these side chains; however, this requires further investigation. The other examined interacting partner is SFPQ, an RNA-binding protein involved in neuronal function and neurodegeneration [60]. SFPQ is a multifunctional protein as it interacts with several proteins regulating paraspeckle formation, alternative splicing or DNA damage repair, and axon growth [61,62,63]. It was shown in T cells that SFPQ is phosphorylated on Thr687 by GSK3 [64], offering another future path for our research.
In conclusion, the TIMAP–PP1c complex was shown to be present in neuronal cells, and TIMAP appears to be an inhibitor of neuronal differentiation. The nuclear interactome of TIMAP revealed several new potential protein binding partners, but the detailed signaling pathways remain to be investigated. These binding partners can be novel substrates of TIMAP–PP1c and further demonstrate the possible role of TIMAP as a transcriptional regulator.

4. Materials and Methods

4.1. Cell Cultures and Cell Differentiation

Human SH-SY5Y (European Tissue Culture) cells were maintained in DMEM containing 10% heat inactivated FBS, 2 mM of L-glutamine and 4.5 g/L of glucose at 37 °C in a 5% CO2 incubator. Next, 10 μM of all-trans retinoic acid (ATRA) in 1% FBS containing DMEM was used for 6 days for SH-SY5Y cell differentiation. Medium was replenished every 48 h [21,65]. Differentiation was monitored via microscopic assessment of morphological changes of neurite outgrowth or by collecting the samples for Western blot or qPCR. BPAEC cells were used and maintained as described earlier [28].

4.2. Bacterial Protein Expression and GST Pull-Down Assay, LC-MS/MS Analysis

GST or GST–TIMAP proteins were formed and purified as described in [28]. SH-SY5Y cells were lysed in 800 μL 50 mM of Tris-HCl (pH 7.5), 0.2% 2-mercaptoethanol, 0.1% Tween 20 containing lysis buffer in the presence of protease inhibitors. Pulldown was performed as described in [28].
Mass Spectrometry was performed as described in [28].

4.3. SDS-PAGE and Western Blotting

Denatured protein samples (30–50 μg total protein) were separated on SDS polyacrylamide gels (10–12%), and Western blot was carried out as described in [29]. In each individual experiment, equal amounts of protein were loaded per well. Primary and secondary antibodies employed are listed in Table 2.

4.4. RNA Isolation, cDNA Synthesis and qPCR

SH-SY5Y cells were utilized to extract total RNA using a GeneJET RNA purification kit (Thermo Scientific, Waltham, MA, USA). Then, 2 µg of total RNA was employed for cDNA synthesis using Maxima Reverse Transcriptase™ (Thermo Scientific) and oligo-d(T)16 primer (Promega, Madison, WI, USA).
Real-time PCR analysis was performed with a LightCycler 480 Thermocycler (Roche, Basel, Switzerland, Europe) and Maxima SYBR Green qPCR Master Mix (Thermo Scientific) according to the manufacturer’s protocol. GAPDH was used to normalized threshold values (Ct values). Fold expression levels were calculated by 2−ΔΔCt values as in [66]. Applied primers are listed in Table 3; synthesized by Integrated DNA Technologies (Leuven, Belgium, Europe).

4.5. Immunoprecipitation, Immunofluorescence and Microscopy

Immunoprecipitation was performed as described in [28]. Immunofluorescent staining and microscopy were performed as described in [29], TIMAP antibody was used in 1:100 dilution, and Texas-Red Phalloidin (Invitrogen, Waltham, MA, USA) was used in 1:300 dilution.

4.6. Transfection

In order to overexpress TIMAP, SH-SY5Y cells were transfected with pEGFP-C1 TIMAP wild-type plasmid (coding for human TIMAP protein), constructed earlier [28] using Lipofectamine 3000 reagent according to the manufacturer’s protocol.

4.7. Subcellular Fractionation

Subcellular fractions of SH-SY5Y cells were formed as described in [28].

4.8. High-Content Analysis

SH-SY5Y cells were plated into CellCarrier Ultra 96-well microplates, and the indicated treatments were carried out. Subsequently, images were captured using an Opera Phenix high-content screening system (Perkin Elmer, Waltham, MA, USA) equipped with a 10× air objective, and the images were then analyzed using the integrated Harmony software (version 4.8, Perkin Elmer) [67].

4.9. Statistical Analysis

The GraphPad Prism program (version 8.0.1) was used for statistical analysis. Significances and applied statistical tests are indicated at each experiment. Image J software (version 1.54) was used for densitometry.

Supplementary Materials

The following supporting information can be downloaded at: https://www.mdpi.com/article/10.3390/ijms242417360/s1.

Author Contributions

Conceptualization, A.B. and C.C.; methodology, A.B., M.F. and Z.T.; software, A.B. and Z.T.; validation, A.B., M.F. and Z.T.; formal analysis, A.B., M.F. and Z.T.; investigation, A.B., M.F. and Z.T.; writing—original draft preparation, A.B.; writing—review and editing, A.B., C.C. and M.F.; supervision, A.B.; funding acquisition, A.B. All authors have read and agreed to the published version of the manuscript.

Funding

This research was funded by the National Research, Development and Innovation Fund (NKFI) under grant number FK135384 (to A.B.), Bolyai Fellowship (A.B.) and by the UNKP-23-3-II-DE394 New National Excellence Program of The Ministry for Culture and Innovation from the source of the National Research, Development and Innovation Fund (M.F.).

Institutional Review Board Statement

Not applicable.

Informed Consent Statement

Not applicable.

Data Availability Statement

The data that support the findings of this study are available from the corresponding author upon reasonable request.

Acknowledgments

SH-SY5Y cell line was a kind gift from Krisztina Tar. The technical assistance of Kitti Barta is appreciated.

Conflicts of Interest

The authors declare no conflict of interest.

References

  1. Barford, D. Protein phosphatases. Curr. Opin. Struct. Biol. 1995, 5, 728–734. [Google Scholar] [CrossRef] [PubMed]
  2. Ariño, J.; Velázquez, D.; Casamayor, A. Ser/Thr protein phosphatases in fungi: Structure, regulation and function. Microb. Cell 2019, 6, 217–256. [Google Scholar] [CrossRef]
  3. Cohen, P.T.; Brewis, N.D.; Hughes, V.; Mann, D.J. Protein serine/threonine phosphatases; an expanding family. FEBS Lett. 1990, 268, 355–359. [Google Scholar] [CrossRef]
  4. Shi, Y. Serine/Threonine Phosphatases: Mechanism through Structure. Cell 2009, 139, 468–484. [Google Scholar] [CrossRef] [PubMed]
  5. Bollen, M.; Peti, W.; Ragusa, M.J.; Beullens, M. The extended PP1 toolkit: Designed to create specificity. Trends Biochem. Sci. 2010, 35, 450–458. [Google Scholar] [CrossRef]
  6. Cannon, J.F. Function of protein phosphatase-1, Glc7, in Saccharomyces cerevisiae. Adv. Appl. Microbiol. 2010, 73, 27–59. [Google Scholar]
  7. Peti, W.; Nairn, A.C.; Page, R. Structural basis for protein phosphatase 1 regulation and specificity. FEBS J. 2013, 280, 596–611. [Google Scholar] [CrossRef] [PubMed]
  8. Korrodi-Gregorio, L.; Esteves, S.L.; Fardilha, M. Protein phosphatase 1 catalytic isoforms: Specificity toward interacting proteins. Transl. Res. 2014, 164, 366–391. [Google Scholar] [CrossRef] [PubMed]
  9. Ceulemans, H.; Bollen, M. Functional diversity of protein phosphatase-1, a cellular economizer and reset button. Physiol. Rev. 2004, 84, 1–39. [Google Scholar] [CrossRef]
  10. Gibbons, J.A.; Kozubowski, L.; Tatchell, K.; Shenolikar, S. Expression of human protein phosphatase-1 in Saccharomyces cerevisiae highlights the role of phosphatase isoforms in regulating eukaryotic functions. J. Biol. Chem. 2007, 282, 21838–21847. [Google Scholar] [CrossRef]
  11. Verbinnen, I.; Ferreira, M.; Bollen, M. Biogenesis and activity regulation of protein phosphatase 1. Biochem. Soc. Trans. 2017, 45, 89–99. [Google Scholar] [CrossRef] [PubMed]
  12. Csortos, C.; Czikora, I.; Bogatcheva, N.V.; Adyshev, D.M.; Poirier, C.; Olah, G.; Verin, A.D. TIMAP is a positive regulator of pulmonary endothelial barrier function. Am. J. Physiol. Lung Cell. Mol. Physiol. 2008, 295, L440–L450. [Google Scholar] [CrossRef] [PubMed]
  13. Boratko, A.; Csortos, C. TIMAP, the versatile protein phosphatase 1 regulator in endothelial cells. IUBMB Life 2017, 69, 918–928. [Google Scholar] [CrossRef] [PubMed]
  14. Cao, W.; Mattagajasingh, S.N.; Xu, H.; Kim, K.; Fierlbeck, W.; Deng, J.; Lowenstein, C.J.; Ballermann, B.J. TIMAP, a novel CAAX box protein regulated by TGF-beta1 and expressed in endothelial cells. Am. J. Physiol. Cell Physiol. 2002, 283, C327–C337. [Google Scholar] [CrossRef] [PubMed]
  15. Czikora, I.; Kim, K.M.; Kasa, A.; Becsi, B.; Verin, A.D.; Gergely, P.; Erdodi, F.; Csortos, C. Characterization of the effect of TIMAP phosphorylation on its interaction with protein phosphatase 1. Biochimie 2011, 93, 1139–1145. [Google Scholar] [CrossRef] [PubMed]
  16. Boratko, A.; Csortos, C. PKC mediated phosphorylation of TIMAP regulates PP1c activity and endothelial barrier function. Biochim. Biophys. Acta Mol. Cell Res. 2017, 1864, 431–439. [Google Scholar] [CrossRef]
  17. Schulz, A.; Zoch, A.; Morrison, H. A neuronal function of the tumor suppressor protein merlin. Acta Neuropathol. Commun. 2014, 2, 82. [Google Scholar] [CrossRef]
  18. Magdaleno, S.; Northcutt, G.M.; Curran, T.; Kurschner, C. mPPP1R16B is a novel mouse protein phosphatase 1 targeting subunit whose mRNA is located in cell bodies and dendrites of neurons in four distinct regions of the brain. Brain Res. Gene Expr. Patterns 2002, 1, 143–149. [Google Scholar] [CrossRef]
  19. Alivand, M.R.; Najafi, S.; Esmaeili, S.; Rahmanpour, D.; Zhaleh, H.; Rahmati, Y. Integrative analysis of DNA methylation and gene expression profiles to identify biomarkers of glioblastoma. Cancer Genet. 2021, 258, 135–150. [Google Scholar] [CrossRef]
  20. Bell, M.; Zempel, H. SH-SY5Y-derived neurons: A human neuronal model system for investigating TAU sorting and neuronal subtype-specific TAU vulnerability. Rev. Neurosci. 2021, 33, 1–15. [Google Scholar] [CrossRef]
  21. Xicoy, H.; Wieringa, B.; Martens, G.J. The SH-SY5Y cell line in Parkinson’s disease research: A systematic review. Mol. Neurodegener. 2017, 12, 10. [Google Scholar] [CrossRef] [PubMed]
  22. Strother, L.; Miles, G.B.; Holiday, A.R.; Cheng, Y.; Doherty, G.H. Long-term culture of SH-SY5Y neuroblastoma cells in the absence of neurotrophins: A novel model of neuronal ageing. J. Neurosci. Methods 2021, 362, 109301. [Google Scholar] [CrossRef]
  23. De Conto, V.; Cheung, V.; Maubon, G.; Souguir, Z.; Maubon, N.; Vandenhaute, E.; Berezowski, V. In vitro differentiation modifies the neurotoxic response of SH-SY5Y cells. Toxicol. In Vitro 2021, 77, 105235. [Google Scholar] [CrossRef] [PubMed]
  24. Christensen, J.; Steain, M.; Slobedman, B.; Abendroth, A. Differentiated neuroblastoma cells provide a highly efficient model for studies of productive varicella-zoster virus infection of neuronal cells. J. Virol. 2011, 85, 8436–8442. [Google Scholar] [CrossRef]
  25. Shipley, M.M.; Mangold, C.A.; Szpara, M.L. Differentiation of the SH-SY5Y Human Neuroblastoma Cell Line. J. Vis. Exp. 2016, 108, 53193. [Google Scholar]
  26. Lopes, F.M.; Schroder, R.; da Frota, M.L., Jr.; Zanotto-Filho, A.; Muller, C.B.; Pires, A.S.; Meurer, R.T.; Colpo, G.D.; Gelain, D.P.; Kapczinski, F.; et al. Comparison between proliferative and neuron-like SH-SY5Y cells as an in vitro model for Parkinson disease studies. Brain Res. 2010, 1337, 85–94. [Google Scholar] [CrossRef]
  27. Campos Cogo, S.; Gradowski Farias da Costa do Nascimento, T.; de Almeida Brehm Pinhatti, F.; de Franca Junior, N.; Santos Rodrigues, B.; Cavalli, L.R.; Elifio-Esposito, S. An overview of neuroblastoma cell lineage phenotypes and in vitro models. Exp. Biol. Med. 2020, 245, 1637–1647. [Google Scholar] [CrossRef] [PubMed]
  28. Boratko, A.; Gergely, P.; Csortos, C. RACK1 is involved in endothelial barrier regulation via its two novel interacting partners. Cell Commun. Signal. 2013, 11, 2. [Google Scholar] [CrossRef] [PubMed]
  29. Kiraly, N.; Thalwieser, Z.; Fonodi, M.; Csortos, C.; Boratko, A. Dephosphorylation of annexin A2 by protein phosphatase 1 regulates endothelial cell barrier. IUBMB Life 2021, 73, 1257–1268. [Google Scholar] [CrossRef]
  30. Boratko, A.; Peter, M.; Thalwieser, Z.; Kovacs, E.; Csortos, C. Elongation factor-1A1 is a novel substrate of the protein phosphatase 1-TIMAP complex. Int. J. Biochem. Cell Biol. 2015, 69, 105–113. [Google Scholar] [CrossRef] [PubMed]
  31. Khakha, N.; Khan, H.; Kaur, A.; Singh, T.G. Therapeutic implications of phosphorylation- and dephosphorylation-dependent factors of cAMP-response element-binding protein (CREB) in neurodegeneration. Pharmacol. Rep. 2023, 75, 1152–1165. [Google Scholar] [CrossRef]
  32. Brembati, V.; Faustini, G.; Longhena, F.; Outeiro, T.F.; Bellucci, A. Changes in alpha-Synuclein Posttranslational Modifications in an AAV-Based Mouse Model of Parkinson’s Disease. Int. J. Mol. Sci. 2023, 24, 13435. [Google Scholar] [CrossRef]
  33. Li, Z.; Yin, B.; Zhang, S.; Lan, Z.; Zhang, L. Targeting protein kinases for the treatment of Alzheimer’s disease: Recent progress and future perspectives. Eur. J. Med. Chem. 2023, 261, 115817. [Google Scholar] [CrossRef]
  34. Da Cruz e Silva, E.F.; Fox, C.A.; Ouimet, C.C.; Gustafson, E.; Watson, S.J.; Greengard, P. Differential expression of protein phosphatase 1 isoforms in mammalian brain. J. Neurosci. 1995, 15, 3375–3389. [Google Scholar] [CrossRef] [PubMed]
  35. Otey, C.A.; Boukhelifa, M.; Maness, P. B35 neuroblastoma cells: An easily transfected, cultured cell model of central nervous system neurons. Methods Cell Biol. 2003, 71, 287–304. [Google Scholar] [PubMed]
  36. Shafer, T.J.; Atchison, W.D. Transmitter, ion channel and receptor properties of pheochromocytoma (PC12) cells: A model for neurotoxicological studies. Neurotoxicology 1991, 12, 473–492. [Google Scholar] [PubMed]
  37. LePage, K.T.; Dickey, R.W.; Gerwick, W.H.; Jester, E.L.; Murray, T.F. On the use of neuro-2a neuroblastoma cells versus intact neurons in primary culture for neurotoxicity studies. Crit. Rev. Neurobiol. 2005, 17, 27–50. [Google Scholar] [CrossRef] [PubMed]
  38. Biedler, J.L.; Helson, L.; Spengler, B.A. Morphology and growth, tumorigenicity, and cytogenetics of human neuroblastoma cells in continuous culture. Cancer Res. 1973, 33, 2643–2652. [Google Scholar]
  39. Shopik, M.J.; Li, L.; Luu, H.A.; Obeidat, M.; Holmes, C.F.; Ballermann, B.J. Multi-directional function of the protein phosphatase 1 regulatory subunit TIMAP. Biochem. Biophys. Res. Commun. 2013, 435, 567–573. [Google Scholar] [CrossRef]
  40. Singh, J.; Kaur, G. Transcriptional regulation of polysialylated neural cell adhesion molecule expression by NMDA receptor activation in retinoic acid-differentiated SH-SY5Y neuroblastoma cultures. Brain Res. 2007, 1154, 8–21. [Google Scholar] [CrossRef] [PubMed]
  41. Kume, T.; Kawato, Y.; Osakada, F.; Izumi, Y.; Katsuki, H.; Nakagawa, T.; Kaneko, S.; Niidome, T.; Takada-Takatori, Y.; Akaike, A. Dibutyryl cyclic AMP induces differentiation of human neuroblastoma SH-SY5Y cells into a noradrenergic phenotype. Neurosci. Lett. 2008, 443, 199–203. [Google Scholar] [CrossRef] [PubMed]
  42. Cernaianu, G.; Brandmaier, P.; Scholz, G.; Ackermann, O.P.; Alt, R.; Rothe, K.; Cross, M.; Witzigmann, H.; Trobs, R.B. All-trans retinoic acid arrests neuroblastoma cells in a dormant state. Subsequent nerve growth factor/brain-derived neurotrophic factor treatment adds modest benefit. J. Pediatr. Surg. 2008, 43, 1284–1294. [Google Scholar] [CrossRef] [PubMed]
  43. Rogers, M.V.; Buensuceso, C.; Montague, F.; Mahadevan, L. Vanadate stimulates differentiation and neurite outgrowth in rat pheochromocytoma PC12 cells and neurite extension in human neuroblastoma SH-SY5Y cells. Neuroscience 1994, 60, 479–494. [Google Scholar] [CrossRef] [PubMed]
  44. Oe, T.; Sasayama, T.; Nagashima, T.; Muramoto, M.; Yamazaki, T.; Morikawa, N.; Okitsu, O.; Nishimura, S.; Aoki, T.; Katayama, Y.; et al. Differences in gene expression profile among SH-SY5Y neuroblastoma subclones with different neurite outgrowth responses to nerve growth factor. J. Neurochem. 2005, 94, 1264–1276. [Google Scholar] [CrossRef]
  45. Pahlman, S.; Odelstad, L.; Larsson, E.; Grotte, G.; Nilsson, K. Phenotypic changes of human neuroblastoma cells in culture induced by 12-O-tetradecanoyl-phorbol-13-acetate. Int. J. Cancer 1981, 28, 583–589. [Google Scholar] [CrossRef] [PubMed]
  46. Sarkanen, J.R.; Nykky, J.; Siikanen, J.; Selinummi, J.; Ylikomi, T.; Jalonen, T.O. Cholesterol supports the retinoic acid-induced synaptic vesicle formation in differentiating human SH-SY5Y neuroblastoma cells. J. Neurochem. 2007, 102, 1941–1952. [Google Scholar] [CrossRef] [PubMed]
  47. Agholme, L.; Lindstrom, T.; Kagedal, K.; Marcusson, J.; Hallbeck, M. An in vitro model for neuroscience: Differentiation of SH-SY5Y cells into cells with morphological and biochemical characteristics of mature neurons. J. Alzheimers Dis. 2010, 20, 1069–1082. [Google Scholar] [CrossRef]
  48. Clagett-Dame, M.; McNeill, E.M.; Muley, P.D. Role of all-trans retinoic acid in neurite outgrowth and axonal elongation. J. Neurobiol. 2006, 66, 739–756. [Google Scholar] [CrossRef]
  49. Wang, X.; Obeidat, M.; Li, L.; Pasarj, P.; Aburahess, S.; Holmes, C.F.B.; Ballermann, B.J. TIMAP inhibits endothelial myosin light chain phosphatase by competing with MYPT1 for the catalytic protein phosphatase 1 subunit PP1cbeta. J. Biol. Chem. 2019, 294, 13280–13291. [Google Scholar] [CrossRef]
  50. Lontay, B.; Serfozo, Z.; Gergely, P.; Ito, M.; Hartshorne, D.J.; Erdodi, F. Localization of myosin phosphatase target subunit 1 in rat brain and in primary cultures of neuronal cells. J. Comp. Neurol. 2004, 478, 72–87. [Google Scholar] [CrossRef]
  51. Beckelman, B.C.; Day, S.; Zhou, X.; Donohue, M.; Gouras, G.K.; Klann, E.; Keene, C.D.; Ma, T. Dysregulation of Elongation Factor 1A Expression is Correlated with Synaptic Plasticity Impairments in Alzheimer’s Disease. J. Alzheimers Dis. 2016, 54, 669–678. [Google Scholar] [CrossRef] [PubMed]
  52. Beckelman, B.C.; Zhou, X.; Keene, C.D.; Ma, T. Impaired Eukaryotic Elongation Factor 1A Expression in Alzheimer’s Disease. Neurodegener. Dis. 2016, 16, 39–43. [Google Scholar] [CrossRef] [PubMed]
  53. Garcia-Esparcia, P.; Hernandez-Ortega, K.; Koneti, A.; Gil, L.; Delgado-Morales, R.; Castano, E.; Carmona, M.; Ferrer, I. Altered machinery of protein synthesis is region- and stage-dependent and is associated with alpha-synuclein oligomers in Parkinson’s disease. Acta Neuropathol. Commun. 2015, 3, 76. [Google Scholar] [CrossRef] [PubMed]
  54. Kapur, M.; Monaghan, C.E.; Ackerman, S.L. Regulation of mRNA Translation in Neurons-A Matter of Life and Death. Neuron 2017, 96, 616–637. [Google Scholar] [CrossRef]
  55. Clarke, J.P.; Thibault, P.A.; Salapa, H.E.; Levin, M.C. A Comprehensive Analysis of the Role of hnRNP A1 Function and Dysfunction in the Pathogenesis of Neurodegenerative Disease. Front. Mol. Biosci. 2021, 8, 659610. [Google Scholar] [CrossRef]
  56. Roy, R.; Durie, D.; Li, H.; Liu, B.Q.; Skehel, J.M.; Mauri, F.; Cuorvo, L.V.; Barbareschi, M.; Guo, L.; Holcik, M.; et al. hnRNPA1 couples nuclear export and translation of specific mRNAs downstream of FGF-2/S6K2 signalling. Nucleic Acids Res. 2014, 42, 12483–12497. [Google Scholar] [CrossRef]
  57. Choi, Y.H.; Lim, J.K.; Jeong, M.W.; Kim, K.T. HnRNP A1 phosphorylated by VRK1 stimulates telomerase and its binding to telomeric DNA sequence. Nucleic Acids Res. 2012, 40, 8499–8518. [Google Scholar] [CrossRef]
  58. Koo, J.H.; Lee, H.J.; Kim, W.; Kim, S.G. Endoplasmic Reticulum Stress in Hepatic Stellate Cells Promotes Liver Fibrosis via PERK-Mediated Degradation of HNRNPA1 and Up-regulation of SMAD2. Gastroenterology 2016, 150, 181–193.e8. [Google Scholar] [CrossRef]
  59. Martin, J.; Masri, J.; Cloninger, C.; Holmes, B.; Artinian, N.; Funk, A.; Ruegg, T.; Anderson, L.; Bashir, T.; Bernath, A.; et al. Phosphomimetic substitution of heterogeneous nuclear ribonucleoprotein A1 at serine 199 abolishes AKT-dependent internal ribosome entry site-transacting factor (ITAF) function via effects on strand annealing and results in mammalian target of rapamycin complex 1 (mTORC1) inhibitor sensitivity. J. Biol. Chem. 2011, 286, 16402–16413. [Google Scholar]
  60. Lim, Y.W.; James, D.; Huang, J.; Lee, M. The Emerging Role of the RNA-Binding Protein SFPQ in Neuronal Function and Neurodegeneration. Int. J. Mol. Sci. 2020, 21, 7151. [Google Scholar] [CrossRef]
  61. Sasaki, Y.T.; Ideue, T.; Sano, M.; Mituyama, T.; Hirose, T. MENepsilon/beta noncoding RNAs are essential for structural integrity of nuclear paraspeckles. Proc. Natl. Acad. Sci. USA 2009, 106, 2525–2530. [Google Scholar] [CrossRef]
  62. Ha, K.; Takeda, Y.; Dynan, W.S. Sequences in PSF/SFPQ mediate radioresistance and recruitment of PSF/SFPQ-containing complexes to DNA damage sites in human cells. DNA Repair 2011, 10, 252–259. [Google Scholar] [CrossRef] [PubMed]
  63. Kim, K.K.; Kim, Y.C.; Adelstein, R.S.; Kawamoto, S. Fox-3 and PSF interact to activate neural cell-specific alternative splicing. Nucleic Acids Res. 2011, 39, 3064–3078. [Google Scholar] [CrossRef]
  64. Heyd, F.; Lynch, K.W. Phosphorylation-dependent regulation of PSF by GSK3 controls CD45 alternative splicing. Mol. Cell 2010, 40, 126–137. [Google Scholar] [CrossRef] [PubMed]
  65. Ferguson, R.; Subramanian, V. PA6 Stromal Cell Co-Culture Enhances SH-SY5Y and VSC4.1 Neuroblastoma Differentiation to Mature Phenotypes. PLoS ONE 2016, 11, e0159051. [Google Scholar] [CrossRef] [PubMed]
  66. Livak, K.J.; Schmittgen, T.D. Analysis of relative gene expression data using real-time quantitative PCR and the 2(-Delta Delta C(T)) Method. Methods 2001, 25, 402–408. [Google Scholar] [CrossRef]
  67. Regdon, Z.; Demeny, M.A.; Kovacs, K.; Hajnady, Z.; Nagy-Penzes, M.; Bakondi, E.; Kiss, A.; Hegedus, C.; Virag, L. High-content screening identifies inhibitors of oxidative stress-induced parthanatos: Cytoprotective and anti-inflammatory effects of ciclopirox. Br. J. Pharmacol. 2021, 178, 1095–1113. [Google Scholar] [CrossRef]
Figure 1. Detection of TIMAP–PP1cδ in SH-SY5Y cells. (A) RT-PCR was performed using specific primer pairs that targeted TIMAP, PP1cδ and GAPDH in BPAEC and SH-SY5Y cells. (B) Western blot analysis of BPAEC and SH-SY5Y cells using TIMAP- and PP1cδ-specific antibodies. Actin was utilized as a loading control. (C) TIMAP or PP1cδ was subjected to immunoprecipitation from lysates of SH-SY5Y cells. IP complexes were subjected to Western blot to detect the presence of TIMAP, PP1cδ and PP1cα. The negative control utilized was rabbit IgG. (D) Glutathione S transferase (GST) and GST-TIMAP were immobilized on glutathione Sepharose 4B beads, then the resin samples were incubated with SH-SY5Y cell lysate. Samples were tested for TIMAP, ERM, merlin and RACK1 by Western blot.
Ijms 24 17360 g001
Figure 2. ATRA-mediated differentiation of SH-SY5Y cells. (A) SH-SY5Y cells were cultured with vehicle (DMSO, control) or ATRA for 6 days. Morphological changes related to differentiation were obtained using a Leica Axioscope microscope. Scale bar: 100 µm. (B) Cells were treated with vehicle (DMSO) (undiff) or ATRA for 6 days (diff). The relative mRNA expression of differentiation markers was assessed using qPCR analysis. Data are presented as mean ± SD (n = 3). Statistical differences were examined by unpaired t-test (* p < 0.05; ** p < 0.01, *** p < 0.001, **** p < 0.0001). (C) Western blot analysis of neuronal markers of untreated (ctr) or ATRA-treated cells collected on Day 1 (D1), Day 3 (D3) or Day 6 (D6). Actin was used as loading control. (D) The relative amount of nestin, ID-1 and β3-tubulin was determined by densitometry of Western blot results. Protein level normalization was performed using actin bands. Data are presented as mean ± SD (n = 3). Statistical analysis was performed with one-way ANOVA, Dunnett’s multiple comparisons test (* p < 0.05; ** p < 0.01, *** p < 0.001).
Ijms 24 17360 g002
Figure 3. Expression level of TIMAP decreases during differentiation. (A) Western blot analysis of untreated (ctr) or ATRA-treated cells collected on Day 1 (D1), Day 3 (D3) or Day 6 (D6). Samples were tested using antibodies specific for TIMAP and PP1cδ. (B) The relative amount of TIMAP and PP1c was determined using densitometry of Western blot results, with the utilization of actin bands for protein level normalization. The results are presented as mean ± SD (n = 3). Statistical analysis was performed with one-way ANOVA, Dunnett’s multiple comparisons test (*** p < 0.001). (C) Cells were treated with vehicle (DMSO) or ATRA for 6 days. qPCR analysis shows the relative mRNA expression of PP1 catalytic (PP1cα; PP1cδ) or regulatory subunits (TIMAP, MYPT1, MYPT3). Data are given as mean ± SD (n = 4). Statistical analysis was performed using unpaired t-tests (** p < 0.01).
Ijms 24 17360 g003
Figure 4. Overexpression of TIMAP attenuates differentiation. (A) Differentiated (Day 6) control and pEGFP-C1 TIMAP-expressing cells were analyzed using Opera Phenix HCS. Data are presented as mean ± SD (number of cells analyzed > 1000, from n = 3 experiments). Statistical analysis was performed using unpaired t-test (*** p < 0.001). (B) Control or pEGFP-C1 TIMAP-expressing cells were treated with vehicle (DMSO) (undiff) or ATRA (diff) for 6 days. Samples were tested using GFP-, nestin-, ID-1- and actin (loading control)-specific antibodies.
Ijms 24 17360 g004
Figure 5. Change in the subcellular localization of TIMAP during differentiation. (A) Immunofluorescence staining of undifferentiated and differentiated (D6) cells was performed using anti-TIMAP (green) antibody. Actin filaments were observed utilizing Texas Red-Phalloidin, while the cell nuclei were labeled with DAPI. Scale bars: 50 µm. White arrows indicate TIMAP in the nucleus. (B) Subcellular fractions of control or differentiated (Day 6) cells were analyzed using anti-TIMAP antibody and antibodies specific for membrane (pan-cadherin), cytoplasm (actin) and nucleus (lamin A/C). (C) Normalized expression of TIMAP was determined by quantification of Western blots, and percent distribution ± SE of TIMAP protein in subcellular fraction were determined (n = 3).
Ijms 24 17360 g005
Figure 6. Analysis of nuclear protein interactions of TIMAP. (A) STRING network analysis of TIMAP binding proteins of SH-SY5Y nuclear fraction. Colors correspond to interactions according to the legend on the left. (B,C) Panther gene ontology (GO) term analysis of the nuclear interactome of TIMAP was performed (http://pantherdb.org (accessed on 9 September 2023)). Genes were categorized according to biological processes (B) or ontology was carried out by protein class categorization (C). (D) Purified nuclear fraction of SH-SY5Y cells were used in GST pull-down assay. Bound proteins were eluted and tested for SFPQ and hnRNPA1 by Western blot.
Ijms 24 17360 g006
Table 1. GST–TIMAP binding proteins of SH-SY5Y nuclear fraction.
Protein ID (UniProt)Protein NameNr. of PeptideGene Name
Q15149Plectin290PLEC
Q08211ATP-dependent RNA helicase A61DHX9
Q9H0D65-3 exoribonuclease 247XRN2
P13639Elongation factor 245EEF2
Q9Y2W1Thyroid-hormone-receptor-associated protein 342THRAP3
Q00839Heterogeneous nuclear ribonucleoprotein U37HNRNPU
Q9NYF8Bcl-2-associated transcription factor 135BCLAF1
P23246Splicing factor, proline- and glutamine-rich30SFPQ
Q6IBW4Condensin-2 complex subunit H226NCAPH2
P38159RNA-binding motif protein25RBMX
Q96T49Protein phosphatase 1 regulatory inhibitor subunit 16B24PPP1R16B
Q9BY77Polymerase delta-interacting protein 324POLDIP3
P07355Annexin A223ANXA2
Q5VTE0Elongation factor 1-alpha 121EEF1A1
Q13829BTB/POZ domain-containing adapter for CUL3-mediated RhoA degradation protein 221TNFAIP1
Q14444Caprin-121CAPRIN1
P22626Heterogeneous nuclear ribonucleoproteins A2/B120HNRNPA2B1
P63244Guanine nucleotide-binding protein subunit beta-2-like 120GNB2L1
P05141ADP/ATP translocase 219SLC25A5
P2339640S ribosomal protein S319RPS3
P09651Heterogeneous nuclear ribonucleoprotein A118HNRNPA1
P1588040S ribosomal protein S218RPS2
P31943Heterogeneous nuclear ribonucleoprotein H18HNRNPH1
P16152Carbonyl reductase [NADPH] 117CBR1
P6124740S ribosomal protein S3a17RPS3A
P62140Serine/threonine-protein phosphatase PP1-beta catalytic subunit17PPP1CB
O75828Carbonyl reductase [NADPH] 316CBR3
P6270140S ribosomal protein S4, X isoform16RPS4X
Q96C36Pyrroline-5-carboxylate reductase 216PYCR2
P32322Pyrroline-5-carboxylate reductase 1, mitochondrial15PYCR1
P52597Heterogeneous nuclear ribonucleoprotein F15HNRNPF
O43809Cleavage and polyadenylation specificity factor subunit 514NUDT21
P67809Nuclease-sensitive element-binding protein 113YBX1
Q07955Serine/arginine-rich splicing factor 113SRSF1
Q13151Heterogeneous nuclear ribonucleoprotein A013HNRNPA0
Q86V81THO complex subunit 413ALYREF
P48047ATP synthase subunit O, mitochondrial12ATP5O
Q5HYJ1Trans-2,3-enoyl-CoA reductase-like12TECRL
P4677760S ribosomal protein L511RPL5
P4678140S ribosomal protein S911RPS9
P4678240S ribosomal protein S510RPS5
P6208140S ribosomal protein S710RPS7
P6228040S ribosomal protein S1110RPS11
P6291760S ribosomal protein L810RPL8
P16403Histone H1.29HIST1H1C
P1862160S ribosomal protein L179RPL17
P3296960S ribosomal protein L99RPL9
P2763560S ribosomal protein L108RPL10
P6275340S ribosomal protein S68RPS6
P8373160S ribosomal protein L248RPL24
P84103Serine/arginine-rich splicing factor 37SRSF3
P62987Ubiquitin-60S ribosomal protein L406UBA52
P4677860S ribosomal protein L216RPL21
P6125460S ribosomal protein L26;60S ribosomal protein L26-like 16RPL26
P6275060S ribosomal protein L23a6RPL23A
Q16777Histone H2A type 2-C5HIST2H2AC
P4791460S ribosomal protein L294RPL29
Table 2. Primary and secondary antibodies utilized in Western blot (WB).
AntibodyDilutionVendor (cat. #)
TIMAP1:1000ABGENT (San Diego, CA, USA)(AP17590c)
PP1cδ1:1000Millipore (Burlington, MA, USA) (#07-270)
PP1cα1:1000R&D Systems (Minneapolis, MN, USA) (MAB6105)
actin1:1000Sigma (St. Louis, MO, USA) (A5060)
ERM1:1000Cell Signaling Technologies (Danvers, MA, USA) (#3142)
merlin1:1000Cell Signaling Technologies (#6995)
RACK11:1000BD Transduction Laboratories (Franklin Lakes, NJ, USA) (#610177)
GFP1:1000Millipore (#AB10145; #MAB1083)
Nestin1:2000Cell Signaling Technologies (#4760)
ID-11:500Novus Biologicals (Littleton, CO, USA) (#H00003397-M02)
lamin A/C1:2000Santa Cruz (Dallas, TX, USA) (sc-20681)
pan-cadherin1:1000Cell Signaling Technologies (#4068)
HRP-linked anti-rabbit IgG1:5000Cell Signaling Technologies (#7074)
HRP-linked anti-mouse IgG1:5000Cell Signaling Technologies (#7076)
Table 3. Primer pair nucleotide sequences utilized in real-time PCR experiments.
Gene NamePrimer 1Primer 2
GAPDH (glyceraldehyde-3-phosphate dehydrogenase)5′-GTC TCC TCT GAC TTC AAC AGC G-3′5′-ACC ACC CTG TTG CTG TAG CCA A-3′
NES (nestin)5′-TCA AGA TGT CCC TCA GCC TGG A-3′5′-AAG CTG AGG GAA GTC TTG GAG C-3′
PCNA (proliferating cell nuclear antigen)5′-CAA GTA ATG TCG ATA AAG AGG AGG-3′5′-GTG TCA CCG TTG AAG AGA GTG G-3′
ID1 (Inhibitor of differentiation 1)5′-GTT GGA GCT GAA CTC GGA ATC C-3′5′-ACA CAA GAT GCG ATC GTC CGC A-3′
TUBB3 (β3-tubulin)5′-TCA GCG TCT ACT ACA ACG AGG C-3′5′-GCC TGA AGA GAT GTC CAA AGG C-3′
MAP2 (microtubule-associated protein 2)5′-AGG CTG TAG CAG TCC TGA AAG G-3′5′-CTT CCT CCA CTG TGA CAG TCT G-3′
NeuN (RBFOX3)5′-TAC GCA GCC TAC AGA TAC GCT C-3′5′-TGG TTC CAA TGC TGT AGG TCG C-3′
SYP (synaptophysin)5′-TCG GCT TTG TGA AGG TGC TGC A-3′5′-TCA CTC TCG GTC TTG TTG GCA C-3′
ACTB (b-actin)5′-CAC CAT TGG CAA TGA GCG GTT C-3′5′-AGG TCT TTG CGG ATG TCC ACG T-3′
PPP1CA (PP1c α)5′-GCT GCT GGC CTA TAA GAT CAA-3′5′-GTC TCT TGC ACT CAT CGT AGA A-3′
PPP1CB (PP1c δ)5′-CAG CCA TTG TGG ATG AGA AGA-3′5′-AGG GAC ATC AGT AGG TCT CAT AA-3′
PPP1R16B (TIMAP)5′-TGG AGC TAG TCT CAG TGC AAG G-3′5′-CTC AAG GAT GAC TTG TGC CTC AG-3′
PPP1R12A (MYPT1)5′-CAG GTC AAG CAA CAC CTA CA-3′5′-GCC CGT CTT TCT AAG TCC TAA C-3′
PPP1R16A (MYPT3)5′-TCA ATG CCT GTG ACA GTG AG-3′5′-ATG TTC CCG TCG GTG TTG-3′
Disclaimer/Publisher’s Note: The statements, opinions and data contained in all publications are solely those of the individual author(s) and contributor(s) and not of MDPI and/or the editor(s). MDPI and/or the editor(s) disclaim responsibility for any injury to people or property resulting from any ideas, methods, instructions or products referred to in the content.

