Abstract
Malate dehydrogenase (MDH; EC 1.1.1.37) plays a vital role in plant growth and development as well as abiotic stress responses, and it is widely present in plants. However, the MDH family genes have not been explored in sweet potato. In this study, nine, ten, and ten MDH genes in sweet potato (Ipomoea batatas) and its two diploid wild relatives, Ipomoea trifida and Ipomoea triloba, respectively, were identified. These MDH genes were unevenly distributed on seven different chromosomes among the three species. The gene duplications and nucleotide substitution analysis (Ka/Ks) revealed that the MDH genes went through segmental duplications during their evolution under purifying selection. A phylogenetic and conserved structure divided these MDH genes into five subgroups. An expression analysis indicated that the MDH genes were omni-presently expressed in distinct tissues and responded to various abiotic stresses. A transcription factor prediction analysis proved that Dof, MADS-box, and MYB were the main transcription factors of sweet potato MDH genes. These findings provide molecular features of the MDH family in sweet potato and its two diploid wild relatives, which further supports functional characterizations.
1. Introduction
As it is an oxidoreductase ubiquitous in plants, animals, and microorganisms, malate dehydrogenase (MDH) catalyzes the reversible conversion of malate to oxaloacetate (OAA) with nicotinamide adenine dinucleotide (NAD+) or nicotinamide adenine dinucleotide phosphate (NADP+) as a coenzyme factor [1]. NAD-dependent MDH is distributed in the cytoplasm, chloroplasts, plastids, mitochondria, peroxisomes, and other microsomes, while NADP-dependent MDH is distributed in chloroplasts [2,3]. Based on metabolic pathways and subcellular localizations, MDH is mainly divided into five subtypes: cytoplasmic MDH (cyMDH) plays a key role in the tricarboxylic acid cycle [4,5]; mitochondrial MDH (mMDH) is involved in acid metabolism within plant tissues and carbon dioxide fixation in C4 plants [6]; peroxisome MDH (pMDH) is involved in photorespiration and in fatty acid β-oxidation [7]; plastidial NADP-dependent MDH (pdNADP-MDH) is considered a key enzyme in the malate valve, which outputs excess reducing equivalents in chloroplasts as malate [1,8,9]; and plastidial NAD-dependent MDH (pdNAD-MDH) mainly plays a role in chloroplasts and non-green plastids in the dark [10]. Polymerase MDHs generally exist as stable dimers or tetramers of the same subunit composition [11].
So far, MDHs have been identified in various plants, including 9 MDHs in Arabidopsis [10,12], 12 in rice [13], 13 in cotton [14], 16 in soybean [15], 12 in tomato [16], 8 in common bean [17], 12 in apple [18], 16 in poplar [19], and 12 in Chinese fir [20]. In Arabidopsis, NAD-MDHs and cMDHs have been found to play important roles in embryonic development [12], seed development [21,22], leaf respiration [3], photo respiration [23], energy metabolism [24], and the response to oxidative stress [25,26,27]. Several reports indicate that MDHs are involved in abiotic stress responses. Under a salinity treatment, the overexpression of SbNADP-ME increases the Arabidopsis germination rate and root length, which improves the seedling salt tolerance [28]. The overexpression of ZmNADP-MDH improves photosynthesis and salt tolerance in Arabidopsis [29]. In apples, MdcyMDH overexpression enhances the tolerance to cold and salt stresses by producing more reductive redox states and increasing the salicylic acid level [30,31]. Overexpressing OsMDH12 rice is susceptible to salt stress, but the OsMDH12 mutant exhibits enhanced salt endurance [32]. MDH genes responding to salt stress are also found in tomato [16] and poplar [19]. In addition, MDH genes participate in regulating the nutrient deficiency response. Chinese fir 8 ClMDH genes are upregulated under low-phosphorus stress [20]. The cotton GhmMDH1-overexpressing plants produce significantly longer roots and have higher biomasses and phosphorus contents than WT plants under phosphorus deficiency [33]. MDH genes are involved in aluminum stress response; for example, the overexpression of malate dehydrogenase in alfalfa [34] and tobacco [35] confers tolerance to aluminum.
Being the seventh largest food crop in the world, sweet potato (I. batatas (L.) Lam) is also an important energy crop for its high edible, feed, and medicinal values [36]. Sweet potato is hexaploid (2n = 6x = 90) [37], with complex genomes and hybrid incompatibility. The yield and quality of sweet potato are also seriously threatened by abiotic stresses such as salinity and drought, thus resulting in greater economic losses [38]. Molecular breeding is used to cultivate highly resistant sweet potato varieties, which is of great significance for improving the sweet potato yield. At present, the genome-wide identification of MDH gene families has been carried out in various plants, but there has not been a report about sweet potato MDH genes. In recent years, highly assembled genomes of sweet potato hexaploid [37] and two diploid wild relatives, I. trifida (2n = 2x = 30) and I. triloba (2n = 2x = 30) [39], have been released. Thus, this work aimed to perform an extensive bioinformatics and expression profiling of the MDH gene of sweet potato and its two diploid relatives to reveal their additional biological functions.
In this study, 29 MDH genes from sweet potato and its two diploid wild relatives were identified with high confidence. A collinear analysis showed that segmental duplication was the main driver of the evolution of sweet potatoes and their relatives. An evolutionary analysis was performed for these MDH genes. Moreover, an expression profiling analysis revealed that these MDH genes were expressed in distinct tissues and actively responded to distinct environmental stresses, such as salinity, drought, and low temperatures. Overall, our findings provide a theoretical basis to further investigate the functions of sweet potato MDH genes.
2. Results
2.1. Identification of MDHs in Sweet Potato and Its Two Diploid Wild Relatives
A total of nine, ten, and ten MDHs were identified in I. batatas, I. trifida, and I. triloba, respectively, and they were named IbMDH 1-9, ItfMDH 1-10, and ItbMDH 1-10 according to their locations on the chromosomes. In sweet potato, the CDS length of IbMDHs ranged from 981 bp (IbMDH2) to 1326 bp (IbMDH9), and the genomic length varied from 2040 bp to 4842 bp. The lengths of the protein sequences ranged from 326 aa (IbMDH2) to 441 aa (IbMDH9), with a molecular weight (MW) of 34.59 kDa to 48.18 kDa. The isoelectric points (pI) ranged from 6.10 (IbMDH2) to 8.74 (IbMDH7). Most IbMDHs were stable with an instability index of less than 40. The GRAVY values of IbMDHs varied from −0.182 to 0.211. A subcellular localization prediction showed that most IbMDHs were in the chloroplast, IbMDH1, and IbMAH3 in the cytoplasm, and IbMDH7 in the mitochondria (Table 1).

Table 1.
Characteristics of MDHs in I. batatas, I. trifida, and I. triloba.
In I. trifida, the CDS length ranged from 999 bp to 1329 bp, and the genomic length varied from 2234 bp to 5058 bp. The length of the protein sequences ranged from 332 aa to 442 aa, with an MW of 35.22 kDa to 48.25 kDa and a pI of 6.11 to 8.89. Seven ItfMDHs were stable proteins with an instability index of less than 40. The GRAVY values varied from −0.172 to 0.177, where only ItfNDH5 was a hydrophilic protein. Most of the ItfMDHs were in the chloroplast (Table 1). In I. triloba, the CDS length ranged from 999 bp to 1329 bp, and the genomic length varied from 2307 bp to 5829 bp. The length of the protein sequences ranged from 332 aa to 442 aa, with an MW of 35.21 kDa to 48.28 kDa and a pI of 6.11 to 8.79. Eight ItbMDHs were stable proteins. The GRAVY values varied from −0.172 to 0.177. The ItbMDHs were in the chloroplast, mitochondrion, and cytoplasm, respectively (Table 1).
The chromosomal localizations showed that the MDHs from I. batatas, I. triloba, and I. trifida were unevenly distributed across seven chromosomes, respectively (Figure 1 and Table S1). Some chromosomes contained two MDH genes, such as LG13 and LG15 in I. batatas; Chr02, Chr06, and Chr10 in I. trifida; and Chr02, Chr06, and Chr12 in I. triloba (Figure 1).
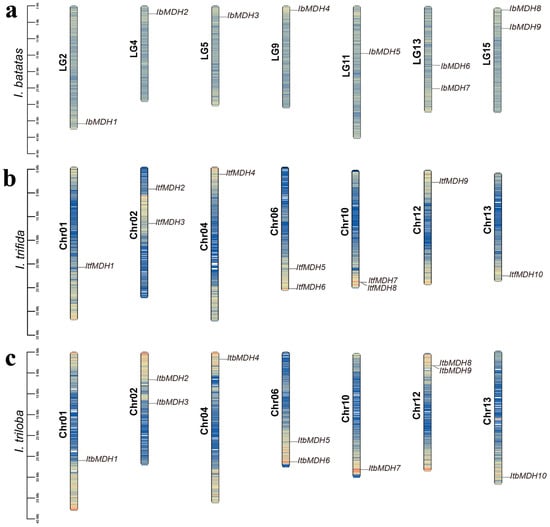
Figure 1.
Chromosomal localization and distribution of MDHs in I. batatas (a), I. trifida (b), and I. triloba (c). The bars on the left margin represent chromosomes. The chromosome numbers are displayed on the left side of the chromosomes, and the gene names are displayed on the right side. The blue, yellow, and red represent the degree of gene density on the chromosome, from small to large, respectively. Detail chromosomal location information is listed in Table S1.
2.2. Collinearity Analysis of MDH Genes and Ka/Ks Analysis
Gene duplications including tandem or segmental duplications greatly contribute to the diversity and evolutionary history of gene families and play crucial roles in understanding the adaptive evolution of species. It was found that I. batatas, I. trifida, and I. triloba generated two, one, and two pairs of segmental duplication events distributed on the corresponding chromosomes, respectively, i.e., IbMDH5 and IbMDH7, IbMDH6 and IbMDH8, ItfMDH1 and ItfMDH3, ItbMDH1 and ItbMDH2, and ItbMDH3 and ItbMDH6 (Figure 2). Additionally, the synteny among three species was investigated. Most IbMDHs possessed one orthologous gene with ItfMDHs and ItbMDHs, except for IbMDH5, IbMDH6, and IbMDH7, which had two (Figure 2d). These orthologous gene pairs were located on different chromosomes, which showed that the duplication in the MDH gene family contributed to the process of evolution from diploid to hexaploid.
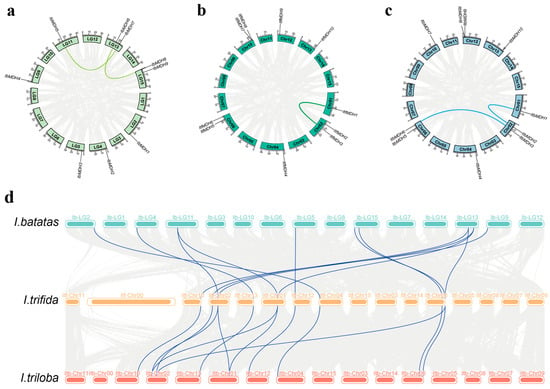
Figure 2.
Gene location and collinearity analysis of the MDH genes in I. batatas (a), I. trifida (b), and I. triloba (c). The genes were located on different chromosomes. Duplicated gene pairs are linked with a colored line. (d) Syntenic analysis of I. batatas, I. trifida, and I. triloba MDHs. Mint green, orange, and red blocks denote chromosomes of I. batatas, I. trifida, and I. triloba, respectively. Foggy blue curves represent the syntenic relationships among the three species.
Furthermore, the Ka/Ks ratios were calculated to estimate the selection pressure and divergence times between the duplicated MDH genes (Table 2 and Table S2). The Ka/Ks ratios showed that the duplicated MDH genes varied from 0 to 0.71, with an average of 0.12, which implied that these MDHs suffered from the influence of purifying selection over the evolution process (Table 2 and Table S2). The Ks values were used to predict the differentiation time of the MDH genes’ duplication events. The doubling time of the MDHs within each species occurred between 45.4 and 57.2 million years ago (Mya) (Table 2), and the divergence time between sweet potato and I. trifida occurred between 0.8 and 57.6 Mya, the divergence time between sweet potato and I. triloba occurred between 1.4 and 57.2 Mya, and the divergence time between I. trifida and I. triloba occurred between 1.5 and 51.1 Mya (Table S2).

Table 2.
Ka/Ks analysis and predicted divergence times in three tested species.
2.3. Phylogenetic Relationship Analysis of MDHs in Sweet Potato and Its Two Diploid Wild Relatives
To analyze the evolutionary relationships of the MDH gene family among I. batatas, I. trifida, I. triloba, Arabidopsis thaliana, Oryza sativa, and Gossypium arboreum, a phylogenetic tree for 63 MDHs of these six species (i.e., 9 in I. batatas, 10 in I. trifida, 10 in I. triloba, 9 in A. thaliana, 12 in O. sativa, and 13 in G. arboreum) was constructed. The results showed that all of the MDHs were divided into five groups (Figure 3). The specific distributions of the MDHs were as follows (total: I. batatas, I. trifida, I. triloba, A.thaliana, O. sativa, and G. arboreum): Group 1 (15: 2, 2, 2, 3, 2, 4), Group 2 (6: 1, 1, 1, 1, 1, 1), Group 3 (14: 2, 2, 2, 2, 3, 3), Group 4 (13: 2, 2, 2, 1, 3, 3), and Group 5 (15: 2, 3, 3, 2, 3, 2) (Figure 3). These results indicated that all sweet potato MDH genes were clustered with their corresponding orthologs in I. triloba and I. trifida.
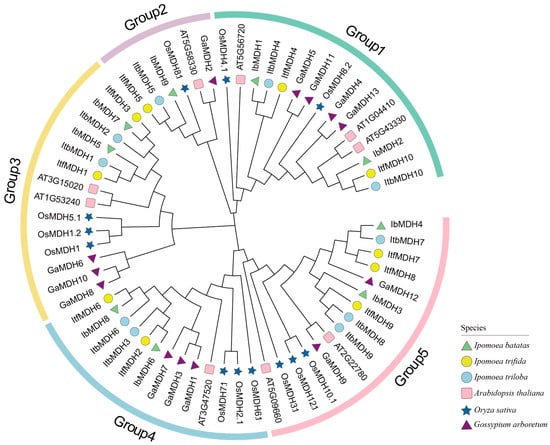
Figure 3.
Phylogenetic analysis of MDHs in I. batatas, I. triloba, I. trifida, A. thaliana, O. sativa, and G. arboretum. Based on the evolutionary distance, a total of 63 MDHs were divided into five groups (Groups 1, 2, 3, 4, and 5 filled with green, purple, yellow, blue, and pink, respectively). The green triangles represent nine IbMDHs in I. batatas. The yellow circles represent ten ItfMDHs in I. trifida. The blue circles represent ten ItbMDHs in I. triloba. The pink squares represent nine AtMDHs in A. thaliana. The dark blue stars represent 12 OsMDHs in O. sativa. The purple triangles represent 13 GaMDHs in G. arboretum.
2.4. Conserved Motif and Exon-Intron Structure Analysis of MDHs in Sweet Potato and Its Two Diploid Wild Relatives
The distribution of the conserved motifs prediction using the MEME website found that ten conserved motifs were identified containing 15 to 50 amino acids (Figure 4a and Figure S1). Most of the MDHs contained these ten conserved motifs but varied within different subgroups. The MDH genes in Group 1 missed five motifs (i.e., motifs 3, -4, -5, -6, and -7); in Group 2, the MDHs missed motif 3, motif 4, and motif 6, where IbMDH9 in Group 2 also missed motif 8; in Group 3, the MDHs missed motif 9; in Group 4 and Group 5, the MDHs lacked motif 9, where IbMDH5 in Group 4 missed motif 6 and IbMDH3 in Group 5 missed motif 4. Therefore, the MDH genes showed some differences throughout their evolutions.
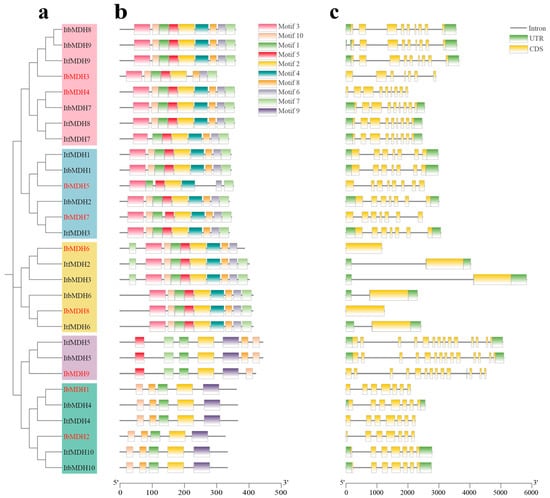
Figure 4.
Conserved motifs and exon–intron structure analysis of MDHs in I. batatas, I. trifida, and I. triloba. (a) The phylogenetic tree of IbMDHs, ItfMDHs, and ItbMDHs. (b) The ten conserved motifs were shown in different colors. (c) Exon–intron structures of MDHs. The green boxes, yellow boxes, and black lines represent UTRs, exons, and introns, respectively.
According to the exon-intron distributions, the quantities of exons and introns in the MDHs showed some variations (Figure 4b). The number of introns in the MDH genes ranged from 0 to 13, where IbMDH7 had no introns. The number of exons in the MDHs ranged from 1 to 14. The MDHs in Group 1 and Group 4 possessed 7 exons, Group 2 contained 14 exons, Group 3 contained 1 exon, and Group 5 contained 9 exons, apart from IbMDH3, which contained 7 (Figure 4b). These results indicated that the differences in the evolution and function between the MDH members were related to their motifs and the exon and intron differences.
2.5. Putative Cis-Regulatory Element Analysis in the Promoter of MDHs in Sweet Potato and Its Two Diploid Wild Relatives
Promoter cis-elements in plants initiate the gene functions related to plant development, hormone regulation, and stress response. Therefore, a cis-element analysis was performed using the 2 kb promoter region of IbMDHs (Figure 5 and Table S3). All of the MDH genes possessed several hormone-responsive elements, including a CGTCA, TGACG motif, ABRE, TGA-element, and TATC-box (Figure 5). In addition, some abiotic stress-responsive elements, such as the essential anaerobic induction element, ARE; the drought-responsive element and salt-responsive elements, MBS, MYB, and MYC; and the stress response promoter element, STRE, were found to be abundant in the promoters of the MDH genes. In addition, the biotic stress-responsive elements were identified in most MDH genes, such as WRE3 and the WUN motif (Figure 5 and Table S3). These results suggested that MDH genes may be involved in the regulation of hormonal crosstalk and abiotic stress resistance.
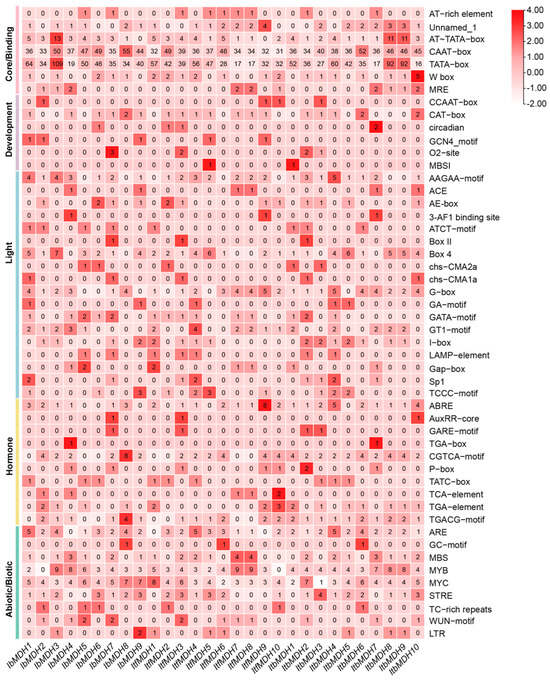
Figure 5.
Cis-element analysis in the promoters of MDHs from I. batatas, I. trifida, and I. triloba. The cis elements were divided into six broad categories. The degree of red color represents the number of cis elements in the promoters of MDHs.
2.6. Expression Analysis of MDHs in Sweet Potato and Its Two Diploid Wild Relatives
2.6.1. Expression Analysis in Various Tissues
The transcript levels of these IbMDHs in sweet potato, the flowers, the leaves, stems, primary roots, firewood roots, and tuberous roots were examined by using qPCR (Figure 6a). The results revealed that six IbMDHs (i.e., IbMDH1, -2, -3, -5, -6, and -8) were higher in the primary roots than in other tissues. Additionally, the tissue-specific expression pattern was observed. For instance, the IbMDH4 and IbMDH8 genes were expressed only in the leaves, and the IbMDH9 transcript was abundant in the leaves and stems.
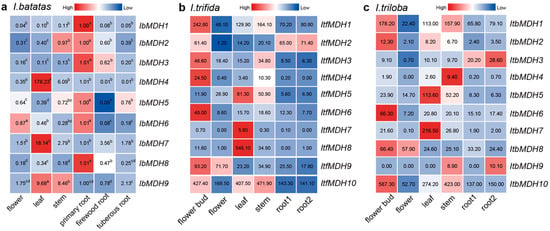
Figure 6.
Expression analysis of MDHs in different tissues of I. batatas, I. trifida, and I. triloba using RNA-seq. (a) Expression analysis of IbMDHs in different tissues. The values were determined via qRT-PCR from three biological replicates consisting of pools of three plants, and the results were analyzed using the comparative CT method. The expression level of each IbMDH gene in primary root is set as control. Different lowercase letters indicate a significant difference in each IbMDH at p < 0.05 based on one-way ANOVA followed by Tukey’s post hoc test. (b) Expression patterns of ItfMDHs in the flower bud, flower, leaf, stem, root 1, and root 2 of I. trifida. (c) Expression patterns of ItbMDHs in the flower bud, flower, leaf, stem, root 1, and root 2 of I. triloba. The fragments per kilobase per million (FPKM) values are shown in the color blocks.
The expression profiles of MDHs in six tissues (i.e., flower bud, flower, stem, leaf, root 1, and root 2) of I. trifida and I. triloba were analyzed (Figure 6b,c). In I. trifida, seven ItfMDHs genes were highly expressed in the flower buds, such as ItfMDH1 and ItfMDH6. Meanwhile, ItfMDH7 and ItfMDH8 appeared to be tissue-specific and were expressed only in the leaves. In addition, the ItfMDH10 transcript accumulated in the flower buds and leaves as well as the stems (Figure 6b). Similarly, in I. triloba, the five ItbMDHs were more highly expressed in the flower buds; ItbMDH3 and ItbMDH9 were highly expressed in root 2; and the transcripts of ItbMDH5 and ItbMDH7 accumulated mainly in the leaves. Furthermore, one gene, ItbMDH4, was specifically expressed only in the stems (Figure 6c).
2.6.2. Expression Analysis under Potassium Deficiency in Sweet Potato
As shown in Figure 7, the expression profiles of the nine sweet potato MDH genes were detected using the transcriptome data of low-k-tolerant “Xushu 32” and low-k-sensitive “Ningzishu 1” under potassium deficiency from the NCBI database (PRJNA1013090). Under a low-potassium treatment, except for IbMDH1, which was upregulated in “Xushu 32” and downregulated in “Ningzishu 1”, the transcript levels of eight sweet potato MDH genes were significantly upregulated in both varieties (Figure 7).
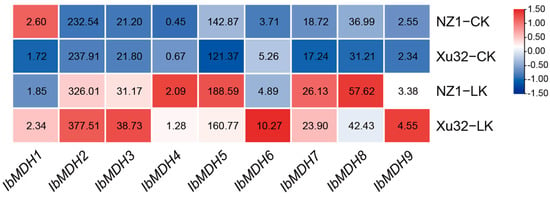
Figure 7.
Expression analysis of sweet potato MDH genes under potassium deficiency as determined via RNA-seq. NZ1: “Ningzishu 1”; Xu32: “Xushu 32”. The FPKM values are shown in the color blocks.
2.6.3. Expression Analysis under Hormone Stress
The expression profiles of nine sweet potato MDH genes were identified in three distinct tissues under ABA, SA, and MeJA treatments using the “Xushu 18” RNA-seq data obtained from the NCBI database (PRJNA511028) (Figure 8). In fibrous roots, IbMDH1 and IbMDH3 were upregulated after the ABA treatment, and IbMDH5 and IbMDH8 were upregulated after the MeJA treatment, whereas the others were downregulated. The IbMDHs in stems exhibited varied differential expressions during the hormone treatments. For example, the transcript of IbMDH6 was downregulated under all three hormone treatments, IbMDH2 was upregulated only under the ABA treatment, and IbMDH1 was downregulated only under the MeJA treatment. In the leaves, except for IbMDH3, all eight IbMDHs were downregulated under the ABA treatment; four IbMDHs were upregulated and four IbMDHs were downregulated upon the SA treatment; and IbMDH5 was significantly induced under the MeJA treatment, whereas IbMDH4, IbMDH7, and IbMDH9 were downregulated (Figure 8).
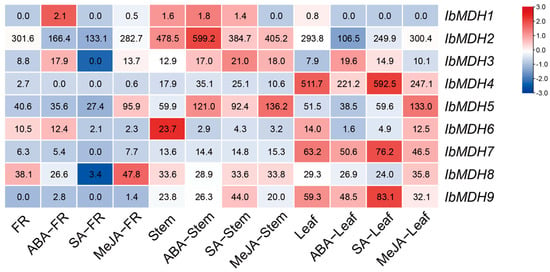
Figure 8.
Expression analysis of sweet potato MDH genes in fibrous roots (FR), stems, and leaves of sweet potato under hormone treatments as determined via RNA-seq. The FPKM values are shown in the color blocks.
The expression patterns of ItfMDHs and ItbMDHs were also analyzed using the RNA-seq data of I. trifida and I. triloba under the ABA, GA3, and IAA treatments [39] (Figure S2). After the ABA treatment, the transcripts of five ItfMDHs (ItfMDH1, -5, -6, -9, and -10) were strongly induced, and only ItfMDH8 was downregulated, and the others did not show significant changes. Under the GA3 treatment, ItfMDH4 and ItfMDH7 were upregulated. Under the IAA treatment, ItfMDH3 was upregulated. In I. triloba, under the ABA treatment, ItbMDH4 and ItbMDH8 were upregulated, and the others were downregulated. Under the GA3 treatment, ItbMDH3 was upregulated, and ItbMDH9 was downregulated. Under the IAA treatment, ItbMDH7 was upregulated, and ItbMDH1, ItbMDH4, and ItbMDH10 were downregulated (Figure S2).
2.6.4. Expression Analysis under Cold Stress
As shown in Figure 9, the expression profiles of the nine IbMDHs were detected using the transcriptome data of cold-tolerant “Liaohanshu 21” and cold-sensitive “Shenshu 28” after cold stress [40]. IbMDH2 and IbMDH4 were upregulated in “Liaohanshu 21” under cold stress, whereas IbMDH3 was upregulated in “Shenshu 28”, and other IbMDHs were downregulated or did not exhibit significant changes in both sweet potato cultivars (Figure 9).
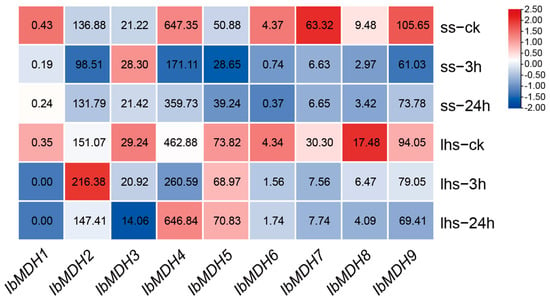
Figure 9.
Gene expression patterns of sweet potato MDH genes under cold stress as determined via RNA-seq. ss: cold-sensitive “Shenshu 28”; lhs: cold-tolerant “Liaohanshu 21”. The FPKM values are shown in the color blocks.
Additionally, the expression patterns of ItfMDHs and ItbMDHs were analyzed under cold stress (Figure S3). Except for ItfMDH1, ItfMDH2, ItfMDH4, and ItfMDH6, which were upregulated at low temperatures, the other six ItfMDHs genes were downregulated. After a cold treatment, ItbMDH3, ItbMDH4, ItbMDH6, and ItbMDH8 were induced, whereas the others were downregulated.
2.6.5. Expression Analysis under Heat Stress
The expression profiles of the nine sweet potato MDH genes were detected using the transcriptome data of heat-tolerant “Guangshu 87” and heat-sensitive “Ziluolan” after heat stress (Figure 10). After a heat treatment, the MDH gene transcripts of fibrous roots and tuberous roots were downregulated in the “Ziluolan” cultivar, but in the “Guangshu 87” cultivar, only IbMDH1, IbMDH4, and IbMDH6 in fibrous roots were upregulated, while the other IbMDHs were downregulated.
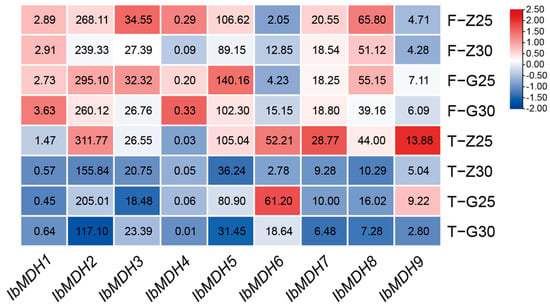
Figure 10.
Gene expression patterns of sweet potato MDH genes under heat stress as determined via RNA-seq. F: fibrous roots; T: tuberous roots; Z: heat-sensitive “Ziluolan”; G: heat-tolerant “Guangshu 87”. The FPKM values are shown in the color blocks.
The expression patterns of ItfMDHs and ItbMDHs were also analyzed under heat stress (Figure S4). After a heat treatment, except for ItfMDH3 and ItfMDH6, eight ItfMDHs were upregulated. Six ItbMDHs were upregulated in I. triloba, while ItbMDH2, ItbMDH4, ItbMDH5, and ItbMDH9 were downregulated.
2.6.6. Expression Analysis under Salt and Drought Stresses
The qPCR was performed to analyze the expression levels of nine IbMDHs after salt and drought treatments in the primary roots, stems, and leaves for 8 h, 16 h, and 24 h, respectively (Figure 11). The results showed significant changes in the expressions of IbMDHs in different tissues after both stresses. In the primary roots, compared to the control, all IbMDHs except for IbMDH8 were upregulated upon drought stress, and the transcript levels of eight IbMDH genes were downregulated under both stresses (Figure 11a). In the stems, six IbMDHs (i.e., IbMDH1, -2, -3, -4, -5, and -9) were upregulated upon both stresses, showing similar expression patterns (Figure 11b). Additionally, in the leaves, five IbMDHs (i.e., IbMDH1, -2, -3, -5, and -9) were upregulated after both stresses, and IbMDH4, IbMDH7, and IbMDH8 were upregulated only under drought stress (Figure 11c). Notably, the expression of IbMDH1 was increased by 55-fold at 16 h of salt stress and by 168-fold at 24 h of drought stress, and IbMDH3 was significantly upregulated by 7-fold at 8 h of salt stress and by 12-fold at 16 h under drought stress compared to the control (Figure 11c). These results indicated that IbMDH1 and IbMDH3 could be important candidate genes involved in salt and drought stress responses.
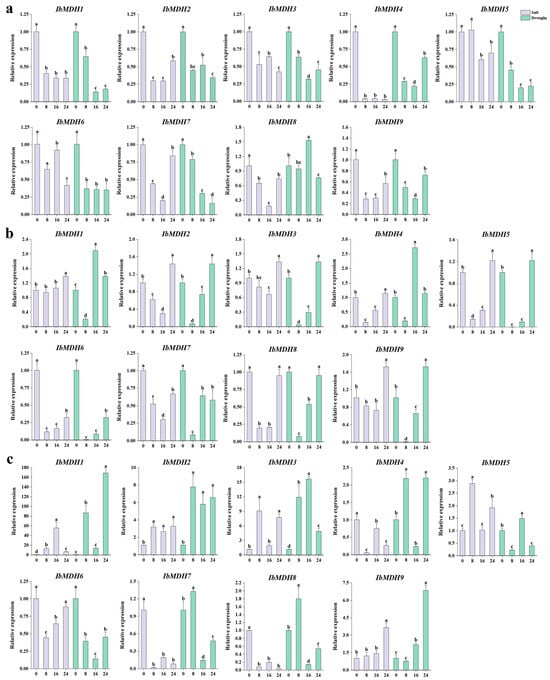
Figure 11.
Expression analysis of IbMDHs in different tissues under salt and drought treatments. (a) Root. (b) Stem. (c) Leaf. The values were determined via qRT-PCR from three biological replicates consisting of pools of three plants, and the results were analyzed using the comparative CT method. The expression at 0 h in each treatment was determined as control. Different lowercase letters indicate a significant difference in each IbMDH at p < 0.05 based on one-way ANOVA followed by Tukey’s post hoc test.
To understand the possible roles of ItfMDHs and ItbMDHs, the expression patterns of I. triloba and I. trifida were examined under drought and salt stresses [39]. In I. trifida, ItfMDH5 and ItfMDH9 were upregulated under both stresses. In I. triloba, ItbMDH5 and ItbMDH6 were upregulated, and ItMDH7 was downregulated under both stresses (Figure S5).
2.7. Protein Interactions Network of MDHs in Sweet Potato
A sweet potato MDH protein interactions network was constructed based on the Arabidopsis protein interactions model (Figure 12 and Table S4). The protein interaction predictions indicated that all nine IbMDHs were orthologous with the Arabidopsis proteins. For example, IbMDH1 and IbMDH2 were homologous with MDH2, IbMDH3 and IbMDH4 were homologous with PMDH2, IbMDH5 and IbMDH7 were homologous with mMDH1, IbMDH6 and IbMDH8 were homologous with MDH, and IbMDH9 were homologous with MDHNP_ARATH. Interestingly, these IbMDHs interacted with each other. In addition, these IbMDHs also interacted with other functional proteins, such as Citrate synthases CSY2, CSY3, and CSY4, Phosphoenolpyruvate carboxylases PPC1, PPC2, PPC3, and PPC4, and Malate synthase MLS. These results indicated that IbMDHs played key roles in the regulation of the TCA cycle pathway in the sweet potato.
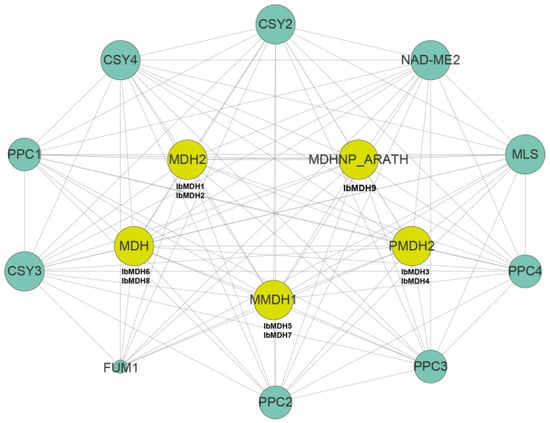
Figure 12.
Protein-protein interaction network of sweet potato MDH proteins; the size and color of the circle represent interaction degree.
2.8. Transcript Factors Network of Sweet Potato MDH Genes
The potential TF analysis revealed that among the IbMDHs, a total of 275 TFs were identified, distributing in 25 different TF families (i.e., AP2, ARF, B3, BBR-BPC, bHLH, bZIP, C2H2, C3H, CPP, Dof, E2F/DP, ERF, LBD, MADS-box, MYB, NAC, Nin-like, RAV, SBP, TCP, Trihelix, WOX, WRKY, YABBY, and ZF-HD) (Figure 13 and Table S5). Among them, Dof, with 84 members, was the most highly enriched, followed by MADS-box (35), MYB (29), AP2 (23), and B3 (21). Among all nine IbMDHs, IbMDH4 was the most targeted by 63 TFs, followed by IbMDH7 (53), IbMDH9 (34), and IbMDH2 (32), while IbMDH3 was targeted least, by only 14 TFs (Figure 13 and Table S5).
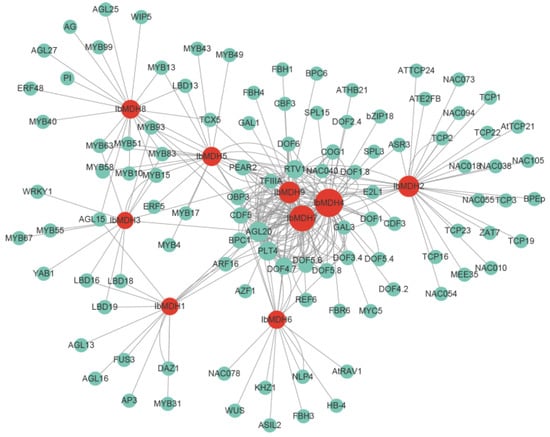
Figure 13.
The putative transcription factor regulatory network analysis of sweet potato MDH genes. Turquoise circular nodes represent transcription factors; red circular nodes represent IbMDHs; and node size represents the degree of interaction between nodes based on degree value.
3. Discussion
3.1. Evolution of MDH Genes in Sweet Potato and Its Two Diploid Wild Relatives
Malate dehydrogenase participates in the TCA cycling pathway and plays an important regulatory role in plant growth and development and stress protection, but it has not been reported in sweet potatoes. Due to the complexity of the genome of hexaploid sweet potatoes, its two diploid relatives, I. trifida and I. triloba, have often been studied [41,42]. In our study, nine, ten, and ten MDH genes were identified in I. batatas, I. trifida, and I. triloba, respectively, which is less than rice [13], cotton [14], and tomato [16]. These MDH genes were scattered on seven chromosomes, several of which contained two MDH genes, such as LG13 and LG15 in sweet potatoes, and Chr02 and Chr06 in I. trifida and I. triloba (Figure 1), which supported that they might possess different biological regulator functions. Gene replication is one of the main drivers of gene family expansion and genome evolution [43]. Both tandem and segmental repetitions took place in the MDH families [13,20]. However, only three, two, and three segmental duplication gene pairs were identified from I. batatas, I. trifida, and I. triloba, respectively (Figure 4a), with Ka/Ks ratios < 1 (Table 2). These results suggest that the expansion of the MDH gene family may have been derived from genome polyploidy events to diversify gene function at a purification pressure. During its long-time evolution, sweet potato had a similar number of collinear MDHs with I. trifida as with I. triloba (Figure 4b and Table S2), which is consistent with the previous study [42]. All MDH genes had distinct subcellular localizations (chloroplasts, cytoplasm, and mitochondria), which could lead to functional differences. Based on the phylogenetic tree, the MDH gene family was divided into five subgroups (Figure 3), concordant with the previous study [16,19,20]. In this phylogenetic tree, each IbMDH always showed one orthologous gene in I. trifida and I. triloba, respectively (Figure 3), implying that the MDHs of sweet potato originated from those of its diploid ancestors [37]. The MDH subgroup contained the same types and numbers of motifs, introns, and exons (Figure 4b,c), suggesting that the MDH members in each subfamily may have similar functions [44].
3.2. Distinct Roles of MDH Genes in Biological Processes
The expression profiling of MDH genes in different tissues, developmental stages, and under abiotic stresses provides new data that could help in understanding potential biological functions. In general, 67% (6/9) of the sweet potato MDH genes showed high expression patterns in the primary roots, and some MDH genes exhibited tissue-specific expressions; for instance, IbMDH4 and IbMDH8 were expressed only in the leaves, and IbMDH9 was expressed in the leaves and stems (Figure 6a). Previous studies found that inhibiting the expression of SlmMDHs reduced the activity of malate dehydrogenase in plants, reduced the biomass of the root system, and changed the root growth structure [9], so it was speculated that sweet potato MDH genes were mainly involved in the growth and development of primary roots. Interestingly, the transcripts of 70% (7/10) ItfMDHs and 50% (5/10) ItbMDHs were highly expressed in the flower buds, and other MDH genes were also expressed in the roots, stems, and leaves (Figure 6b,c), which showed some differences from the MDHs in sweet potato. It might be that the MDH gene functions changed during the evolution from diploid to hexaploid.
The MDH genes in some plants also respond to nutrient deficiency. The overexpression of the mMDH gene improved the tobacco phosphorus access [45]. Under low-phosphorus stress, the overexpression of cotton GhmMDH1 significantly increased the content of malic acid in the plant roots, leaves, and root exudates [33]. Twelve ClMDH genes were identified in Chinese fir to participate in the low-phosphorus stress response [20]. Additionally, phosphorus deficiency triggered the induction of the AtPPC1 transcript, which was responsible for the phosphorus metabolic adaptations [46] and predicted to interact with the sweet potato MDH proteins (Figure 11). This suggests that sweet potato MDH genes may participate in the phosphorus deficiency response, which is consistent with previous studies [20,33]. In our study, under potassium deficiency, 89% (8/9) of the sweet potato MDH genes were significantly upregulated in both low-potassium-sensitive “Ningzishu 1” and low-potassium-resistant “Xushu 32”. Additionally, only IbMDH1 had a different expression with an upregulation in “Xushu 32” but a downregulation in “Ningzishu 1” (Figure 7). These results suggest that sweet potato MDH genes strongly respond to potassium deficiency.
In apples, the suppression of MdcyMDH altered SA signaling, indicating their possible roles in the regulation of improving cold and salt tolerance [30]. However, there is no research on MDHs regulating other hormones. In this study, the CGTCA and TGACG motifs (MeJA-responsive element) and ABRE (ABA-responsive element) were abundant in the MDH gene promoters (Figure 5). Interestingly, most of the IbMDHs were induced under the ABA, MeJA, and SA treatments in fibrous roots, stems, and leaves (Figure 8). Most of the ItfMDHs and ItbMDHs were also induced by the ABA, GA3, and IAA treatments (Figure S2). Particularly, IbMDH1 and its homologous ItfMDH4 and ItbMDH4, and IbMDH3 and its homologous ItfMDH9 and ItbMDH8 were upregulated after the ABA treatment (Figure S2). These results suggest that the MDHs may engage in the hormone crosstalk in sweet potato and its relatives.
In this study, rich ARE, MBS, MYB, MYC, and STRE were identified in the sweet potato MDH promoters (Figure 5), implying that sweet potato MDH genes responded to various abiotic stresses [47]. The expression profiles showed that the transcripts of all six MDH genes were inhibited under cold stress, and only IbMDH2 and IbMDH4 were upregulated in the cold-tolerant “Liaohanshu 21”, and IbMDH3 was upregulated in the cold-sensitive “Shenshu 28” (Figure 9). Similarly, the transcript levels of the pea NADP-MDH gene increased under cryogenic duress [48]. Additionally, in the heat-tolerant “Guangshu 87”, IbMDH1, IbMDH4, and IbMDH6 in fibrous roots were upregulated under heat stress, while all of the MDH genes in heat-sensitive “Ziluolan” were downregulated (Figure 10), similar with the tomato MDH genes [16]. The rice plastidial NAD-MDH1 negatively regulated salt treatment by reducing the vitamin B6 content [49]. The functional characterizations indicated that the MDH genes were linked to plant salt tolerance [28,29,32]. The sweet potato MDH genes in the stems and leaves may play important roles in regulating salt and drought stresses, as shown in Figure 10. Only one transcript of the IbMDH8 gene in the primary roots was induced by drought stress, whereas 67% (6/9) of the IbMDHs in the stems and 56% (5/9) in the leaves were upregulated under both stresses. Notably, sweet potato MDH transcripts responded more to drought stress than salt stress. For example, the transcript levels of IbMDH1 and IbMDH3 were increased by 168-fold and 12-fold upon drought stress, but increased by 55-fold and 7-fold under salt stress, and IbMDH4, IbMDH7, and IbMDH8 in the leaves were upregulated only after drought stress (Figure 11). Interestingly, the protein interaction prediction analysis revealed that the sweet potato MDH proteins interacted with the PEPC proteins (PPC1, PPC2, PPC3, and PPC4) (Figure 12), which were inducted under salt and drought stresses. Particularly, AtPPC4 showed the highest induction in response to both stresses [50], and the AtPPC3 mutant showed a stressed phenotype in control circumstances but was unaffected by high salinity [51]. These results indicate that sweet potato MDH genes are responses to distinct abiotic stresses.
The MDH genes in I. trifida and I. triloba actively responded to abiotic stress (Figures S2–S5). For example, ItfMDH5 and ItbMDH5, the closest homologs of IbMDH9, were strongly upregulated by salinity and drought stress. Similar expression patterns were observed in the IbMDH8 homologs ItfMDH6 and ItbMDH6 and in the IbMDH6 homologs ItfMDH2 and ItbMDH3 in response to cold stress, and similar expression patterns were observed in the IbMDH4 homologs ItfMDH7 and ItbMDH7 and in the IbMDH2 homologs ItfMDH10 and ItbMDH10 in response to heat stress.
Epigenetic mechanisms play significant roles in the responses of plants to abiotic stresses [52,53]. The MDH genes in plants are regulated by epigenetic mechanisms such as DNA methylation. For instance, the high methyl status of the promoters of the light regulation MDH genes suppressed their transcription [54]. The regulation of Zea mays malate dehydrogenase under hypoxic conditions took place at the epigenetic level by changing the methyl status of the promoters of their genes [55]. This suggests that the MDH genes of sweet potato and its relatives may also be regulated by epigenetic mechanisms in response to abiotic stresses.
4. Materials and Methods
4.1. Identification and Physicochemical Properties of MDH Family Members
The protein sequences and GFF gene annotation files of sweet potato, I. trifida, and I. triloba were obtained from the Sweet Potato Genomics Resource (http://sweetpotato.plantbiology.msu.edu/, accessed on 17 July 2023) and Ipomoea Genome Hub (https://ipomoea-genome.org/, accessed on 17 July 2023). The Arabidopsis MDH proteins were downloaded from the TAIR database (https://www.arabidopsis.org/, accessed on 17 July 2023), and Oryza sativa and Gossypium arboreum MDH proteins were from Phytozome v13 (https://phytozome-next.jgi.doe.gov/, accessed on 17 July 2023) [56]. To identify the MDH genes, two methods were utilized. First, HMMsearch (ver. 3.1b2) with default settings was used to search the protein sequences of the three species for the MDH domain (Pfam accession numbers: PF00056 and PF02866) [57]. Second, Arabidopsis MDH protein sequences were used as queries in a BLASTP (ver. 2.10.0+) search against the protein database of each species with an E-value threshold of 1 × 10⁻¹⁰ [58]. Then, all the MDH proteins were subjected to search against the NCBI-CDD search tool (https://www.ncbi.nlm.nih.gov/Structure/bwrpsb/bwrpsb.cgi, accessed on 19 July 2023) [59] and the Simple Modular Architecture Research Tool (SMART) (http://smart.embl-heidelberg.de/, accessed on 19 July 2023) [60]. Finally, with the full-length transcriptome of third-generation sequenced “Guangshu 87” as a reference, the candidate sweet potato MDH family members were manually corrected using SnapGene software 6.0.2. ExPASy ProtParam instrument (http://web.expasy.org/protparam/, accessed on 20 July 2023) was used to calculate protein physicochemical parameters [61]. WoLF PSORT (https://wolfpsort.hgc.jp/, accessed on 20 July 2023) was used to create subcellular localization predictions [62].
4.2. Chromosome Distribution and Collinearity Analysis of MDH Genes
TBtools software (v.2.001) [63] was used to visualize the distribution of IbMDHs, ItfMDHs, and ItbMDHs on the chromosomes. The collinearity relationships of MDH genes within species were constructed using MCScanX [64] and visualized using TBtools software 1.098.
4.3. Synteny Analysis and Calculation of Ka/Ks Values of MDH Gene Homologous Pair
The synteny analysis of MDHs among the whole genomes of I. batatas, I. trifida, and I. triloba was performed using MCScanX [64] and visualized using TBtools software. The nucleotide substitution rates (Ka and Ks) and Ka/Ks ratios of duplicated MDH genes were estimated using the TBtools software’s Ka/Ks calculation package. The estimated time of detergence (T, Mya: million years ago) was calculated as described previously [65].
4.4. Phylogenetic Analysis of MDH Genes
The phylogenetic analysis of MDHs from I. batatas, I. trifida, I. triloba, Arabidopsis, O. sativa, and G. arboreum was performed using ClustalW in MEGA 7 [66] with default parameters, the neighbor-joining (NJ) method, and the Poisson correction model, and bootstrapping was performed with 1000 replicates. Finally, the online tool Evolview (http://www.evolgenius.info/evolview/, accessed on 28 August 2023) [67] was used to beautify the phylogenetic tree.
4.5. Conserved Motifs and Gene Structure Analysis of MDH Genes
The MEME tool (https://meme-suite.org/meme/, accessed on 28 August 2023) analyzed conserved motifs of MDH proteins, and the maximum number of motifs parameter was set to 10 [68]. The MDHs phylogenetic tree, gene structure, and conserved motifs were shown using the TBtools software 1.098 [63].
4.6. Cis-Regulatory Element Analysis of MDH Genes
The upstream promoter region (2000 bp) of the MDH genes was extracted using TBtools software and submitted to PlantCARE (https://bioinformatics.psb.ugent.be/webtools/plantcare/html/, accessed on 12 September 2023) website [69], which identified the cis-regulatory elements in the MDH genes. Then, the TBtools software was used to visualize the cis-regulatory element figure.
4.7. Protein–Protein Interactions Analysis of Sweet Potato MDH Proteins
Using the default parameters, the online STRING database (https://string-db.org/, accessed on 12 September 2023) was utilized to predict and execute potential protein–protein interaction networks using sweet potato MDH proteins based on known Arabidopsis homologs.
4.8. Transcription Factors Regulatory Network Analysis of Sweet Potato MDH Genes
The online tool Plant Transcriptional Regulatory Map (PTRM)23 [70] was used to predict TFs in the upstream (1000 bp) regions of sweet potato MDH genes with p ≤ 1 × 10⁻⁵. The potential TF regulatory networks were visualized by the Cytoscape software version 3.8 [71].
4.9. Transcriptome Analysis
Four transcriptome bio project datasets were chosen for the sweet potato MDH gene expression profile analysis. Three bio project datasets (PRJNA1013090 for low potassium, PRJNA511028 for hormone, and PRJNA987163 for cold) were downloaded from the NCBI database. Another one was our in-house (unpublished) sweet potato heat treatment. Among them, “Xushu 18” was used for hormonal treatment, cold-tolerant “Liaohanshu 21” and cold-sensitive “Shenshu 28” were used for cold treatment, low-k-tolerant “Xushu 32” and low-k-sensitive “Ningzishu 1” were usedfor low-potassium treatment, and heat-tolerant “Guangshu 87” and heat-sensitive “Ziluolan” were used for heat treatment. Additionally, the gene expression data in I. trifida and I. triloba were downloaded from the Sweet Potato Genomics Resource (http://sweetpotato.plantbiology.msu.edu/, accessed on 17 July 2023). The MDH expression was measured in fragments per kilobase of exon per million fragments mapped (FPKM) [72]. The heat maps of expression were constructed using TBtools software 1.098.
4.10. qRT-PCR Analysis of Sweet Potato MDH Genes
The sweet potato (I. batatas) cultivar “Jishu 26” was used for qRT-PCR analysis in this study. Sweet potato plants were cultivated in a field at the experimental field of Guangdong Ocean University, Guangdong, China. For tissue expression, the flower, leaf, stem, primary root, firewood root, and tuberous root tissues were sampled from 3-month-old “Jishu 26” planted in the field. For the abiotic stress treatments, twigs about 30 cm in length from 3-month-old field-grown “Jishu 26” were cultured in the Hoagland solution for 14 days to treat them: for salt stress treatment, the twigs were cultured in the Hoagland solution with 0 and 200 mM NaCl, and for drought stress treatments, the twigs were cultured in Hoagland solution with 0 and 300 mM mannitol. The primary root, stem, and leaf samples were collected at 0, 8, 16, and 24 h after the treatments.
Total RNA was extracted using the TRIzol method (Invitrogen, Carlsbad, CA, USA). The qRT-PCR experiments were carried out based on previous studies [73]. Three biological replicates were established for each sample. Primers used in the study are listed in Supplemental Table S6, where the IbARF gene is an internal reference [74].
5. Conclusions
In this study, 29 MDH genes were identified in sweet potato and its two diploid relatives. A conserved motif and gene structure analysis showed the conservation and dispersion of MDHs during evolution. The expression profiles indicated that the MDHs showed tissue specificity and various expression patterns in sweet potato and its two diploid relatives. MDH genes may be involved in various hormone and abiotic stress responses to regulate plant growth and development. The findings in this study will help us better understand the biological functions of MDHs in coping with climate change and identify possible candidate genes for enhancing field and abiotic stress tolerance in sweet potato and its two diploid relatives.
Supplementary Materials
The following supporting information can be downloaded at: https://zenodo.org/record/8375626 (accessed on 27 September 2023).
Author Contributions
Z.L. designed and performed the experiments and wrote the paper. L.S., X.L. and B.T. performed some experiments and analyzed the data. B.T. and M.X. analyzed the data. Z.L. and H.Z. revised the paper. All authors have read and agreed to the published version of the manuscript.
Funding
This research was funded by the Innovation Team Project of ordinary colleges of Educational Commission of Guangdong Province (2021KCXTD011) and the “Ling Hang” Program of Zhanjiang Innovation and Entrepreneurship Team Introduction (2020LHJH01).
Institutional Review Board Statement
Not applicable.
Informed Consent Statement
Not applicable.
Data Availability Statement
The data and materials that support the findings of this study are available from the corresponding authors upon reasonable request.
Conflicts of Interest
The authors declare no conflict of interest.
References
- Heber, U. Metabolite exchange between chloroplasts and cytoplasm. Annu. Rev. Plant Physiol. 1974, 25, 393–421. [Google Scholar] [CrossRef]
- Carr, P.D.; Verger, D.; Ashton, A.R.; Ollis, D.L. Chloroplast NADP-malate dehydrogenase: Structural basis of light-dependent regulation of activity by thiol oxidation and reduction. Structure 1999, 7, 461–475. [Google Scholar] [CrossRef]
- Tomaz, T.; Bagard, M.; Pracharoenwattana, I.; Lindén, P.; Lee, C.P.; Carroll, A.J.; Ströher, E.; Smith, S.M.; Gardeström, P.; Millar, A.H. Mitochondrial Malate Dehydrogenase Lowers Leaf Respiration and Alters Photorespiration and Plant Growth in Arabidopsis. Plant Physiol. 2010, 154, 1143–1157. [Google Scholar] [CrossRef] [PubMed]
- Chen, Y.; Fu, Z.; Zhang, H.; Tian, R.; Yang, H.; Sun, C.; Wang, L.; Zhang, W.; Guo, Z.; Zhang, X.; et al. Cytosolic malate dehydrogenase 4 modulates cellular energetics and storage reserve accumulation in maize endosperm. Plant Biotechnol. J. 2020, 18, 2420–2435. [Google Scholar] [CrossRef] [PubMed]
- Zhang, L.; Wang, C.; Jia, R.; Yang, N.; Jin, L.; Zhu, L.; Ma, B.; Yao, Y.; Ma, F.; Li, M. Malate metabolism mediated by the cytoplasmic malate dehydrogenase gene MdcyMDH affects sucrose synthesis in apple fruit. Hortic. Res. 2022, 9, uhac194. [Google Scholar] [CrossRef]
- Lindén, P.; Keech, O.; Stenlund, H.; Gardeström, P.; Moritz, T. Reduced mitochondrial malate dehydrogenase activity has a strong effect on photorespiratory metabolism as revealed by 13 C labelling. J. Exp. Bot. 2016, 67, 3123–3135. [Google Scholar] [CrossRef]
- Selinski, J.; Scheibe, R. Malate valves: Old shuttles with new perspectives. Plant Biol. 2018, 21 (Suppl. S1), 21–30. [Google Scholar] [CrossRef]
- Scheibe, R. Malate valves to balance cellular energy supply. Physiol. Plant. 2004, 120, 21–26. [Google Scholar] [CrossRef]
- Taniguchi, M.; Miyake, H. Redox-shuttling between chloroplast and cytosol: Integration of intra-chloroplast and extra-chloroplast metabolism. Curr. Opin. Plant Biol. 2012, 15, 252–260. [Google Scholar] [CrossRef]
- Schreier, T.B.; Cléry, A.; Schläfli, M.; Galbier, F.; Stadler, M.; Demarsy, E.; Albertini, D.; Maier, B.A.; Kessler, F.; Hörtensteiner, S.; et al. Plastidial NAD-Dependent Malate Dehydrogenase: A Moonlighting Protein Involved in Early Chloroplast Development through Its Interaction with an FtsH12-FtsHi Protease Complex. Plant Cell 2018, 30, 1745–1769. [Google Scholar] [CrossRef]
- Goward, C.R.; Nicholls, D.J. Malate dehydrogenase: A model for structure, evolution, and catalysis. Protein Sci. 1994, 3, 1883–1888. [Google Scholar] [CrossRef]
- Beeler, S.; Liu, H.; Stadler, M.; Schreier, T.; Eicke, S.; Lue, W.; Truernit, E.; Zeeman, S.C.; Chen, J.; Kötting, O. Plastidial NAD-Dependent Malate Dehydrogenase Is Critical for Embryo Development and Heterotrophic Metabolism in Arabidopsis. Plant Physiol. 2014, 164, 1175–1190. [Google Scholar] [CrossRef]
- Zhang, Y.; Wang, Y.; Sun, X.; Yuan, J.; Zhao, Z.; Gao, J.; Wen, X.; Tang, F.; Kang, M.; Abliz, B.; et al. Genome-Wide Identification of MDH Family Genes and Their Association with Salt Tolerance in Rice. Plants 2022, 11, 1498. [Google Scholar] [CrossRef] [PubMed]
- Imran, M.; Tang, K.; Liu, J. Comparative Genome-Wide Analysis of the Malate Dehydrogenase Gene Families in Cotton. PLoS ONE 2016, 11, e0166341. [Google Scholar] [CrossRef] [PubMed][Green Version]
- Zhu, S.; Chen, Z.; Xie, B.; Guo, Q.; Chen, M.; Liang, C.; Bai, Z.; Wang, X.; Wang, H.; Liao, H.; et al. A phosphate starvation responsive malate dehydrogenase, GmMDH12 mediates malate synthesis and nodule size in soybean (Glycine max). Environ. Exp. Bot. 2021, 189, 104560. [Google Scholar] [CrossRef]
- Imran, M.; Munir, M.Z.; Ialhi, S.; Abbas, F.; Younus, M.; Ahmad, S.; Naeem, M.K.; Waseem, M.; Iqbal, A.; Gul, S.; et al. Identification and Characterization of Malate Dehydrogenases in Tomato (Solanum lycopersicum L.). Int. J. Mol. Sci. 2022, 23, 10028. [Google Scholar] [CrossRef] [PubMed]
- Yıldız, S.; Okay, A.; Büyük, İ. Defining the roles of PvMDH genes in response to salt stress and detailed characterization of the gene family. J. Plant Biochem. Biotechnol. 2022, 31, 380–393. [Google Scholar] [CrossRef]
- Ma, B.; Yuan, Y.; Gao, M.; Xing, L.; Li, C.; Li, M.; Ma, F. Genome-wide Identification, Classification, Molecular Evolution and Expression Analysis of Malate Dehydrogenases in Apple. Int. J. Mol. Sci. 2018, 19, 3312. [Google Scholar] [CrossRef]
- Chen, X.; Zhang, J.; Zhang, C.; Wang, S.; Yang, M. Genome-wide investigation of malate dehydrogenase gene family in poplar (Populus trichocarpa) and their expression analysis under salt stress. Acta Physiol. Plant. 2021, 43, 28. [Google Scholar] [CrossRef]
- Lin, Y.; Chen, W.; Yang, Q.; Zhang, Y.; Ma, X.; Li, M. Genome-Wide Characterization and Gene Expression Analyses of Malate Dehydrogenase (MDH) Genes in Low-Phosphorus Stress Tolerance of Chinese Fir (Cunninghamia lanceolata). Int. J. Mol. Sci. 2023, 24, 4414. [Google Scholar] [CrossRef]
- Sew, Y.S.; Ströher, E.; Fenske, R.; Millar, A.H. Loss of Mitochondrial Malate Dehydrogenase Activity Alters Seed Metabolism Impairing Seed Maturation and Post-Germination Growth in Arabidopsis. Plant Physiol. 2016, 171, 849–863. [Google Scholar] [CrossRef]
- Selinski, J.; König, N.; Wellmeyer, B.; Hanke, G.T.; Linke, V.; Neuhaus, H.E.; Scheibe, R. The Plastid-Localized NAD-Dependent Malate Dehydrogenase Is Crucial for Energy Homeostasis in Developing Arabidopsis thaliana Seeds. Mol. Plant 2014, 7, 170–186. [Google Scholar] [CrossRef]
- Cousins, A.B.; Pracharoenwattana, I.; Zhou, W.; Smith, S.M.; Badger, M.R. Peroxisomal Malate Dehydrogenase Is Not Essential for Photorespiration in Arabidopsis but Its Absence Causes an Increase in the Stoichiometry of Photorespiratory CO2 Release. Plant Physiol. 2008, 148, 786–795. [Google Scholar] [CrossRef] [PubMed]
- Liszka, A.; Schimpf, R.; Cartuche Zaruma, K.I.; Buhr, A.; Seidel, T.; Walter, S.; Knuesting, J.; Dreyer, A.; Dietz, K.; Scheibe, R.; et al. Three cytosolic NAD-malate dehydrogenase isoforms of Arabidopsis thaliana: On the crossroad between energy fluxes and redox signaling. Biochem. J. 2020, 477, 3673–3693. [Google Scholar] [CrossRef] [PubMed]
- Heyno, E.; Innocenti, G.; Lemaire, S.D.; Issakidis-Bourguet, E.; Krieger-Liszkay, A. Putative role of the malate valve enzyme NADP–malate dehydrogenase in H2O2 signalling in Arabidopsis. Philos. Trans. R. Soc. B.-Biol. Sci. 2014, 369, 20130228. [Google Scholar] [CrossRef] [PubMed]
- Hebbelmann, I.; Selinski, J.; Wehmeyer, C.; Goss, T.; Voss, I.; Mulo, P.; Kangasjärvi, S.; Aro, E.; Oelze, M.; Dietz, K.; et al. Multiple strategies to prevent oxidative stress in Arabidopsis plants lacking the malate valve enzyme NADP-malate dehydrogenase. J. Exp. Bot. 2012, 63, 1445–1459. [Google Scholar] [CrossRef]
- Huang, J.; Niazi, A.K.; Young, D.; Rosado, L.A.; Vertommen, D.; Bodra, N.; Abdelgawwad, M.R.; Vignols, F.; Wei, B.; Wahni, K.; et al. Self-protection of cytosolic malate dehydrogenase against oxidative stress in Arabidopsis. J. Exp. Bot. 2018, 69, 3491–3505. [Google Scholar] [CrossRef]
- Guo, Y.; Song, Y.; Zheng, H.; Zhang, Y.; Guo, J.; Sui, N. NADP-Malate Dehydrogenase of Sweet Sorghum Improves Salt Tolerance of Arabidopsis thaliana. J. Agric. Food Chem. 2018, 66, 5992–6002. [Google Scholar] [CrossRef]
- Kandoi, D.; Mohanty, S.; Tripathy, B.C. Overexpression of plastidic maize NADP-malate dehydrogenase (ZmNADP-MDH) in Arabidopsis thaliana confers tolerance to salt stress. Protoplasma 2018, 255, 547–563. [Google Scholar] [CrossRef]
- Wang, Q.J.; Sun, H.; Dong, Q.L.; Sun, T.Y.; Jin, Z.X.; Hao, Y.J.; Yao, Y.X. The enhancement of tolerance to salt and cold stresses by modifying the redox state and salicylic acid content via the cytosolic malate dehydrogenase gene in transgenic apple plants. Plant Biotechnol. J. 2016, 14, 1986–1997. [Google Scholar] [CrossRef]
- Yao, Y.; Dong, Q.; Zhai, H.; You, C.; Hao, Y. The functions of an apple cytosolic malate dehydrogenase gene in growth and tolerance to cold and salt stresses. Plant Physiol. Biochem. 2011, 49, 257–264. [Google Scholar] [CrossRef]
- Shi, Y.; Feng, J.; Wang, L.; Liu, Y.; He, D.; Sun, Y.; Luo, Y.; Jin, C.; Zhang, Y. OsMDH12: A Peroxisomal Malate Dehydrogenase Regulating Tiller Number and Salt Tolerance in Rice. Plants 2023, 12, 3558. [Google Scholar] [CrossRef] [PubMed]
- Wang, Z.A.; Li, Q.; Ge, X.Y.; Yang, C.L.; Luo, X.L.; Zhang, A.H.; Xiao, J.L.; Tian, Y.C.; Xia, G.X.; Chen, X.Y.; et al. The mitochondrial malate dehydrogenase 1 gene GhmMDH1 is involved in plant and root growth under phosphorus deficiency conditions in cotton. Sci. Rep. 2015, 5, 10343. [Google Scholar] [CrossRef] [PubMed]
- Tesfaye, M.; Temple, S.J.; Allan, D.L.; Vance, C.P.; Samac, D.A. Overexpression of Malate Dehydrogenase in Transgenic Alfalfa Enhances Organic Acid Synthesis and Confers Tolerance to Aluminum. Plant Physiol. 2001, 127, 1836–1844. [Google Scholar] [CrossRef]
- Wang, Q.; Zhao, Y.; Yi, Q.; Li, K.; Yu, Y.; Chen, L. Overexpression of malate dehydrogenase in transgenic tobacco leaves: Enhanced malate synthesis and augmented Al-resistance. Acta Physiol. Plant. 2010, 32, 1209–1220. [Google Scholar] [CrossRef]
- Wang, S.; Nie, S.; Zhu, F. Chemical constituents and health effects of sweet potato. Food Res. Int. 2016, 89, 90–116. [Google Scholar] [CrossRef]
- Yang, J.; Moeinzadeh, M.; Kuhl, H.; Helmuth, J.; Xiao, P.; Haas, S.; Liu, G.; Zheng, J.; Sun, Z.; Fan, W.; et al. Haplotype-resolved sweet potato genome traces back its hexaploidization history. Nat. Plants 2017, 3, 696–703. [Google Scholar] [CrossRef]
- Liu, Q. Improvement for agronomically important traits by gene engineering in sweetpotato. Breed. Sci. 2017, 67, 15–26. [Google Scholar] [CrossRef]
- Wu, S.; Lau, K.H.; Cao, Q.; Hamilton, J.P.; Sun, H.; Zhou, C.; Eserman, L.; Gemenet, D.C.; Olukolu, B.A.; Wang, H.; et al. Genome sequences of two diploid wild relatives of cultivated sweetpotato reveal targets for genetic improvement. Nat. Commun. 2018, 9, 4580. [Google Scholar] [CrossRef]
- Pan, J.; Zhang, Q.; Liu, S.; Liu, Z.; Bian, X.; Yu, T. De novo transcriptome sequencing and gene expression profiling of sweetpotato leaves during low temperature stress. Plant Biotechnol. Rep. 2023, 1–14. [Google Scholar] [CrossRef]
- Dai, Z.; Yan, P.; He, S.; Jia, L.; Wang, Y.; Liu, Q.; Zhai, H.; Zhao, N.; Gao, S.; Zhang, H. Genome-Wide Identification and Expression Analysis of SWEET Family Genes in Sweet Potato and Its Two Diploid Relatives. Int. J. Mol. Sci. 2022, 23, 15848. [Google Scholar] [CrossRef] [PubMed]
- Jiang, Z.; Zhang, H.; Gao, S.; Zhai, H.; He, S.; Zhao, N.; Liu, Q. Genome-Wide Identification and Expression Analysis of the Sucrose Synthase Gene Family in Sweet Potato and Its Two Diploid Relatives. Int. J. Mol. Sci. 2023, 24, 12493. [Google Scholar] [CrossRef]
- Conant, G.C.; Wolfe, K.H. Turning a hobby into a job: How duplicated genes find new functions. Nat. Rev. Genet. 2008, 9, 938–950. [Google Scholar] [CrossRef] [PubMed]
- Xu, G.; Guo, C.; Shan, H.; Kong, H. Divergence of duplicate genes in exon-intron structure. Proc. Natl. Acad. Sci. USA 2012, 109, 1187–1192. [Google Scholar] [CrossRef] [PubMed]
- Lu, J.; Gao, X.; Dong, Z.; Yi, J.; An, L. Improved phosphorus acquisition by tobacco through transgenic expression of mitochondrial malate dehydrogenase from Penicillium oxalicum. Plant Cell Rep. 2012, 31, 49–56. [Google Scholar] [CrossRef]
- Gregory, A.L.; Hurley, B.A.; Tran, H.T.; Valentine, A.J.; She, Y.; Knowles, V.L.; Plaxton, W.C. In vivo regulatory phosphorylation of the phosphoenolpyruvate carboxylase AtPPC1 in phosphate-starved Arabidopsis thaliana. Biochem. J. 2009, 420, 57–65. [Google Scholar] [CrossRef]
- Hernandez-Garcia, C.M.; Finer, J.J. Identification and validation of promoters and cis-acting regulatory elements. Plant Sci. 2014, 217–218, 109–119. [Google Scholar] [CrossRef]
- Pagano, E.A.; Chueca, A.; López-Gorgé, J. Expression of thioredoxins f and m, and of their targets fructose-1,6-bisphosphatase and NADP-malate dehydrogenase, in pea plants grown under normal and light/temperature stress conditions. J. Exp. Bot. 2000, 51, 1299–1307. [Google Scholar] [CrossRef][Green Version]
- Nan, N.; Wang, J.; Shi, Y.; Qian, Y.; Jiang, L.; Huang, S.; Liu, Y.; Wu, Y.; Liu, B.; Xu, Z.Y. Rice plastidial NAD-dependent malate dehydrogenase 1 negatively regulates salt stress response by reducing the vitamin B6 content. Plant Biotechnol. J. 2019, 18, 172–184. [Google Scholar] [CrossRef]
- Sánchez, R.; Flores, A.; Cejudo, F.J. Arabidopsis phosphoenolpyruvate carboxylase genes encode immunologically unrelated polypeptides and are differentially expressed in response to drought and salt stress. Planta 2006, 223, 901–909. [Google Scholar] [CrossRef]
- Feria, A.B.; Bosch, N.; Sánchez, A.; Nieto-Ingelmo, A.I.; de la Osa, C.; Echevarría, C.; García-Mauriño, S.; Monreal, J.A. Phosphoenolpyruvate carboxylase (PEPC) and PEPC-kinase (PEPC-k) isoenzymes in Arabidopsis thaliana: Role in control and abiotic stress conditions. Planta 2016, 244, 901–913. [Google Scholar] [CrossRef]
- Chang, Y.; Zhu, C.; Jiang, J.; Zhang, H.; Zhu, J.; Duan, C. Epigenetic regulation in plant abiotic stress responses. J. Integr. Plant Biol. 2020, 62, 563–580. [Google Scholar] [CrossRef]
- Sere, D.; Martin, A. Epigenetic regulation: Another layer in plant nutrition. Plant Signal. Behav. 2020, 15, 1686236. [Google Scholar] [CrossRef] [PubMed]
- Fedorin, D.N.; Eprintsev, A.T.; Igamberdiev, A.U. Light Regulation of Tricarboxylic Acid Cycle Isoenzymes in Plants. Russ. J. Plant Physiol. 2022, 69, 589–596. [Google Scholar] [CrossRef]
- Eprintsev, A.T.; Fedorin, D.N.; Anokhina, G.B.; Gataullina, M.O. Role of Epigenetic Mechanisms in Regulating the Activity of 2-OGDH and MDH in Maize Leaves (Zea mays L.) during Hypoxia. Russ. J. Plant Physiol. 2021, 68, 331–336. [Google Scholar] [CrossRef]
- Goodstein, D.M.; Shu, S.; Howson, R.; Neupane, R.; Hayes, R.D.; Fazo, J.; Mitros, T.; Dirks, W.; Hellsten, U.; Putnam, N.; et al. Phytozome: A comparative platform for green plant genomics. Nucleic Acids Res. 2012, 40, D1178–D1186. [Google Scholar] [CrossRef]
- Krejci, A.; Hupp, T.R.; Lexa, M.; Vojtesek, B.; Muller, P. Hammock: A hidden Markov model-based peptide clustering algorithm to identify protein-interaction consensus motifs in large datasets. Bioinformatics 2016, 32, 9–16. [Google Scholar] [CrossRef]
- Altschul, S.F.; Gish, W.; Miller, W.; Myers, E.W.; Lipman, D.J. Basic local alignment search tool. J. Mol. Biol. 1990, 215, 403–410. [Google Scholar] [CrossRef]
- Lu, S.; Wang, J.; Chitsaz, F.; Derbyshire, M.K.; Geer, R.C.; Gonzales, N.R.; Gwadz, M.; Hurwitz, D.I.; Marchler, G.H.; Song, J.S.; et al. CDD/SPARCLE: The conserved domain database in 2020. Nucleic Acids Res. 2020, 48, D265–D268. [Google Scholar] [CrossRef]
- Schultz, J.; Copley, R.R.; Doerks, T.; Ponting, C.P.; Bork, P. SMART: A web-based tool for the study of genetically mobile domains. Nucleic Acids Res. 2000, 28, 231–234. [Google Scholar] [CrossRef]
- Wilkins, M.R.; Gasteiger, E.; Bairoch, A.; Sanchez, J.C.; Williams, K.L.; Appel, R.D.; Hochstrasser, D.F. Protein identification and analysis tools in the ExPASy server. Methods Mol. Biol. 1999, 112, 531–552. [Google Scholar]
- Horton, P.; Park, K.J.; Obayashi, T.; Fujita, N.; Harada, H.; Adams-Collier, C.J.; Nakai, K. WoLF PSORT: Protein localization predictor. Nucleic Acids Res. 2007, 35, W585–W587. [Google Scholar] [CrossRef]
- Chen, C.; Chen, H.; Zhang, Y.; Thomas, H.R.; Frank, M.H.; He, Y.; Xia, R. TBtools: An Integrative Toolkit Developed for Interactive Analyses of Big Biological Data. Mol. Plant 2020, 13, 1194–1202. [Google Scholar] [CrossRef] [PubMed]
- Wang, Y.; Tang, H.; DeBarry, J.D.; Tan, X.; Li, J.; Wang, X.; Lee, T.H.; Jin, H.; Marler, B.; Guo, H.; et al. MCScanX: A toolkit for detection and evolutionary analysis of gene synteny and collinearity. Nucleic Acids Res. 2012, 40, e49. [Google Scholar] [CrossRef] [PubMed]
- Yan, H.; Ma, G.; Teixeira Da Silva, J.A.; Qiu, L.; Xu, J.; Zhou, H.; Wei, M.; Xiong, J.; Li, M.; Zhou, S.; et al. Genome-Wide Identification and Analysis of NAC Transcription Factor Family in Two Diploid Wild Relatives of Cultivated Sweet Potato Uncovers Potential NAC Genes Related to Drought Tolerance. Front. Genet. 2021, 12, 744220. [Google Scholar] [CrossRef] [PubMed]
- Kumar, S.; Stecher, G.; Tamura, K. MEGA7: Molecular Evolutionary Genetics Analysis Version 7.0 for Bigger Datasets. Mol. Biol. Evol. 2016, 33, 1870–1874. [Google Scholar] [CrossRef]
- Zhang, H.; Gao, S.; Lercher, M.J.; Hu, S.; Chen, W. EvolView, an online tool for visualizing, annotating and managing phylogenetic trees. Nucleic Acids Res. 2012, 40, W569–W572. [Google Scholar] [CrossRef]
- Bailey, T.L.; Boden, M.; Buske, F.A.; Frith, M.; Grant, C.E.; Clementi, L.; Ren, J.; Li, W.W.; Noble, W.S. MEME SUITE: Tools for motif discovery and searching. Nucleic Acids Res. 2009, 37, W202–W208. [Google Scholar] [CrossRef]
- Lescot, M.; Déhais, P.; Thijs, G.; Marchal, K.; Moreau, Y.; Van de Peer, Y.; Rouzé, P.; Rombauts, S. PlantCARE, a database of plant cis-acting regulatory elements and a portal to tools for in silico analysis of promoter sequences. Nucleic Acids Res. 2002, 30, 325–327. [Google Scholar] [CrossRef]
- Tian, F.; Yang, D.; Meng, Y.; Jin, J.; Gao, G. PlantRegMap: Charting functional regulatory maps in plants. Nucleic Acids Res. 2019, 48, D1104–D1113. [Google Scholar] [CrossRef]
- Shannon, P.; Markiel, A.; Ozier, O.; Baliga, N.S.; Wang, J.T.; Ramage, D.; Amin, N.; Schwikowski, B.; Ideker, T. Cytoscape: A software environment for integrated models of biomolecular interaction networks. Genome Res. 2003, 13, 2498–2504. [Google Scholar] [CrossRef] [PubMed]
- Howe, E.A.; Sinha, R.; Schlauch, D.; Quackenbush, J. RNA-Seq analysis in MeV. Bioinformatics 2011, 27, 3209–3210. [Google Scholar] [CrossRef] [PubMed]
- Shao, Z.; He, M.; Zeng, Z.; Chen, Y.; Hanna, A.; Zhu, H. Genome-Wide Identification and Expression Analysis of the MADS-Box Gene Family in Sweet Potato [Ipomoea batatas (L.) Lam]. Front. Genet. 2021, 12, 750137. [Google Scholar] [CrossRef] [PubMed]
- Zhang, C.; Dong, T.; Yu, J.; Hong, H.; Liu, S.; Guo, F.; Ma, H.; Zhang, J.; Zhu, M.; Meng, X. Genome-wide survey and expression analysis of Dof transcription factor family in sweetpotato shed light on their promising functions in stress tolerance. Front. Plant Sci. 2023, 14, 1140727. [Google Scholar] [CrossRef]
Disclaimer/Publisher’s Note: The statements, opinions and data contained in all publications are solely those of the individual author(s) and contributor(s) and not of MDPI and/or the editor(s). MDPI and/or the editor(s) disclaim responsibility for any injury to people or property resulting from any ideas, methods, instructions or products referred to in the content. |
© 2023 by the authors. Licensee MDPI, Basel, Switzerland. This article is an open access article distributed under the terms and conditions of the Creative Commons Attribution (CC BY) license (https://creativecommons.org/licenses/by/4.0/).