Article

The Improvement of Fluorescence In Situ Hybridization Technique Based on Explorations of Symbionts in Cicadas

1
Key Laboratory of Plant Protection Resources and Pest Management of the Ministry of Education, College of Plant Protection, Northwest A&F University, Yangling 712100, China
2
College of Forestry, Northwest A&F University, Yangling 712100, China
*
Authors to whom correspondence should be addressed.
Int. J. Mol. Sci. 2023, 24(21), 15838; https://doi.org/10.3390/ijms242115838
Submission received: 27 September 2023 / Revised: 28 October 2023 / Accepted: 30 October 2023 / Published: 31 October 2023
(This article belongs to the Section Molecular Microbiology)

Abstract

:
Fluorescence in situ hybridization (FISH) with rRNA-targeted oligonucleotide probes is widely used for the identification of microbes in complex samples, but it suffers from some limitations resulting in the weak or even absence of fluorescence signals of microbe(s), which may lead to the underestimation or misunderstanding of a microbial community. Herein, we explored symbionts in the bacteriomes and fat bodies of cicadas using modified FISH, aiming to improve this technique. We initially revealed that the probes of Candidatus Sulcia muelleri (Sulcia) and the yeast-like fungal symbiont (YLS) are suitable for detection of these symbionts in all cicadas and some other species of Auchenorrhyncha, whereas the probe of Candidatus Hodgkinia cicadicola (Hodgkinia) is only suitable for detection of Hodgkinia in a few cicada species. The fluorescence signal of Sulcia, Hodgkinia and YLS exhibited weak intensity without the addition of unlabeled oligonucleotides (helpers) and heat shock in some cicadas; however, it can be significantly improved by the addition of both helpers and heat shock. Results of this study suggest that heat shock denaturing rRNA and proteins of related microbe(s) together with helpers binding to the adjacent region of the probe’s target sites prevent the re-establishment of the native secondary structure of rRNA; therefore, suitable probe(s) can more easily access to the probe’s target sites of rRNA. Our results provide new information for the significant improvement of hybridization signal intensities of microbes in the FISH experiment, making it possible to achieve a more precise understanding of the microbial distribution, community and density in complex samples.

1. Introduction

Traditional methods of microorganism identification were mainly based on morphological, biochemical and metabolic characteristics of the individual microbe(s), which could be successfully isolated using culture-based methods [1]. One of the major limitations of culture-based methods is that they are quite time-consuming for microbe identification and, therefore, it is not an ideal method for the rapid identification of microbes in complex environmental samples [2,3]. Additionally, cultured microorganisms only account for <1% of the total environmental microbes, and the majority of microbes (e.g., most animal symbionts) are currently uncultivable under laboratory conditions [1,3,4,5,6]. However, the accurate identification of these uncultivable microbes still remains a challenging task according to their morphological characteristics under histological and/or ultrastructural microscopy. Over the past three decades, fluorescence in situ hybridization (FISH) with rRNA-targeted oligonucleotide probes has become a cultivation-independent method for the in situ analysis of the composition and dynamics of microbial communities in complex samples, such as animal tissues and clinical specimens [2].
The small subunit ribosomal RNA (rRNA) is the most commonly used target molecule for FISH experiments, which include the 16S rRNA of prokaryotes and 18S rRNA of eukaryotes [1,2,3]. One of the beneficial properties of using rRNA molecules for FISH is their genetic stability and the high copy number of them. Microbial cells require a lot of ribosomes for translation, and thus, these rRNA molecules of ribosomes are usually amplified to numbers ranging from a few hundred to 100,000 in each cell [2,7]. Additionally, the evolutionary conservation of rRNA genes is patchy but is generally much higher than that of most protein-encoding genes [2]. Therefore, rRNA genes are more suitable than other genes for the rapid and accurate identification of microbe(s) by FISH with rRNA-targeted oligonucleotide probes [1,2,3]. A systematic study of the secondary structure of rRNA revealed that a stem refers to consecutive base pairs with no unpaired bases separating them, and a hairpin loop refers to consecutive unpaired bases that are closed by one base pair [8]. The fluorescent probe is 15–25 nucleotides in length, and it is usually labeled at the 5′ end with a fluorescence dye such as Cy3 and Cy5 [1,2,3]. Oligonucleotide probes can be designed based on the rRNA gene sequences of target species using several primer design software (e.g., Primer 5.0) and web-based services according to the guidelines [1,9,10,11]. It is also feasible to search for the rRNA-targeted oligonucleotide probes in publically available probe databases (e.g., probeBase) or published articles [1,9,10,11].
To date, the FISH technique has become an extremely valuable tool for the detection of microbes in complex environmental samples, particularly for invertebrate animal tissues. The FISH technique has been widely used to explore the distribution and transmission process of symbionts in insects, especially for sap-feeding insects in the suborder Auchenorrhyncha of Hemiptera [12,13,14]. The Auchenorrhyncha, which includes spittlebugs, treehoppers, leafhoppers, planthoppers and cicadas, has been referred to as the ‘fairyland of symbiosis’ [15,16]. It is generally thought that the auchenorrhynchan ancestor developed an intimate symbiosis with a Bacteroidetes currently known as “Candidatus Sulcia muelleri” (referred to as Sulcia) and a coresident betaproteobacterium, which can supplement their nutritionally unbalanced diet with essential nutrients including essential amino acids, vitamins and cobalamin [14,16,17]. Fluorescence microscopy revealed that some cicadas harbored Sulcia and Candidatus Hodgkinia cicadicola (referred to as Hodgkinia) in the peripheral bacteriocytes and central bacteriocytes of the bacteriomes, respectively [12,18,19,20]. However, in many cicada species, Hodgkinia has been replaced by a yeast-like fungal symbiont (YLS) [21,22,23]. Fluorescence and histological microscopy showed that YLS cells are only harbored in the fat bodies among the majority of Hodgkinia-free cicada species (e.g., Cryptotympana atrata), whereas they are harbored in both the fat bodies and bacteriome sheath in a few Hodgkinia-free cicada species, such as Hyalessa maculaticollis and Graptopsaltria tienta [21,22,23].
However, the FISH technique still suffers from some limitations, including limited cell membrane permeability, low cellular ribosome content and inaccessibility of the probe binding sites, which can result in the weak or even absence of fluorescence signal intensity of targeted microbe(s). Therefore, it may eventually lead to the underestimation or misunderstanding of the density and distribution of related microbe(s) in the complex samples. For example, the distribution of YLS was not determined in leafhoppers Ledropsis discolor, Ledra auditura and Tituria angulata by fluorescently labeled oligonucleotide probe under the fluorescence microscopy, although it can be identified in the fat bodies of the above three leafhoppers under histological microscopy [24]. Fluorescence microscopy revealed that YLS exhibited low hybridization signals in the bacteriome sheath but no hybridization signals in the fat bodies of Graptopsaltria nigrofuscata, and concluded that YLS cells were only harbored in the bacteriome sheath of this cicada [21]. Another example is that YLS cells exhibited weak hybridization signals in the bacteriome sheath and fat bodies of G. tienta, leading to the underestimation of the YLS density in these two types of tissues [22]. It has been shown that a modified FISH technique through the addition of both unlabeled oligonucleotides (helpers) and heat shock can greatly enhance FISH signal intensities of YLS in cicadas Karenia caelatata and Tanna sp. [23] Whether YLS is distributed in the fat bodies of G. nigrofuscata and its density (if present) remains questionable. The distribution of facultative symbionts Arsenophonus and Rickettsia in cicadas Eopycna repanda and Platypleura kaempferi have been clearly clarified based on fluorescence microscopy, whereas previous studies using the FISH technique failed to visualize the fluorescence signals of other facultative symbionts including Spiroplasma and Sodalis that could be detected by other methods, such as diagnostic PCR amplification. Therefore, a modified FISH technique may contribute to the improvement of the hybridization signal intensity of microbes, which provides more precise information about the distribution patterns, microbe density and transmission process of symbionts in insects.
In this study, we initially explored the similarity between rRNA-targeted oligonucleotide probes and 16S rRNA/18S rRNA gene sequences of targeted microbes in cicadas and other representative auchenorrhynchan insects. Then, we compared the FISH signal intensities of Sulcia, Hodgkinia and YLS under the control group and three different treatment groups using seven representative cicada species, K. caelatata, C. atrata, Macrosemia insignis, H. maculaticollis, E. repanda, Eopycna coelestia and P. kaempferi. We explored whether the addition of heat shock and helpers can contribute to the enhancement of FISH signal intensities of Sulcia, Hodgkinia and YLS in these cicadas. We further predicted the secondary structure of the 16S rRNA/18S rRNA gene sequence of related symbionts in these cicada species, which may be responsible for the FISH signal intensity of symbiont(s). The results may provide new information for the improvement of hybridization signal intensities of microbes in the FISH experiments.

2. Results

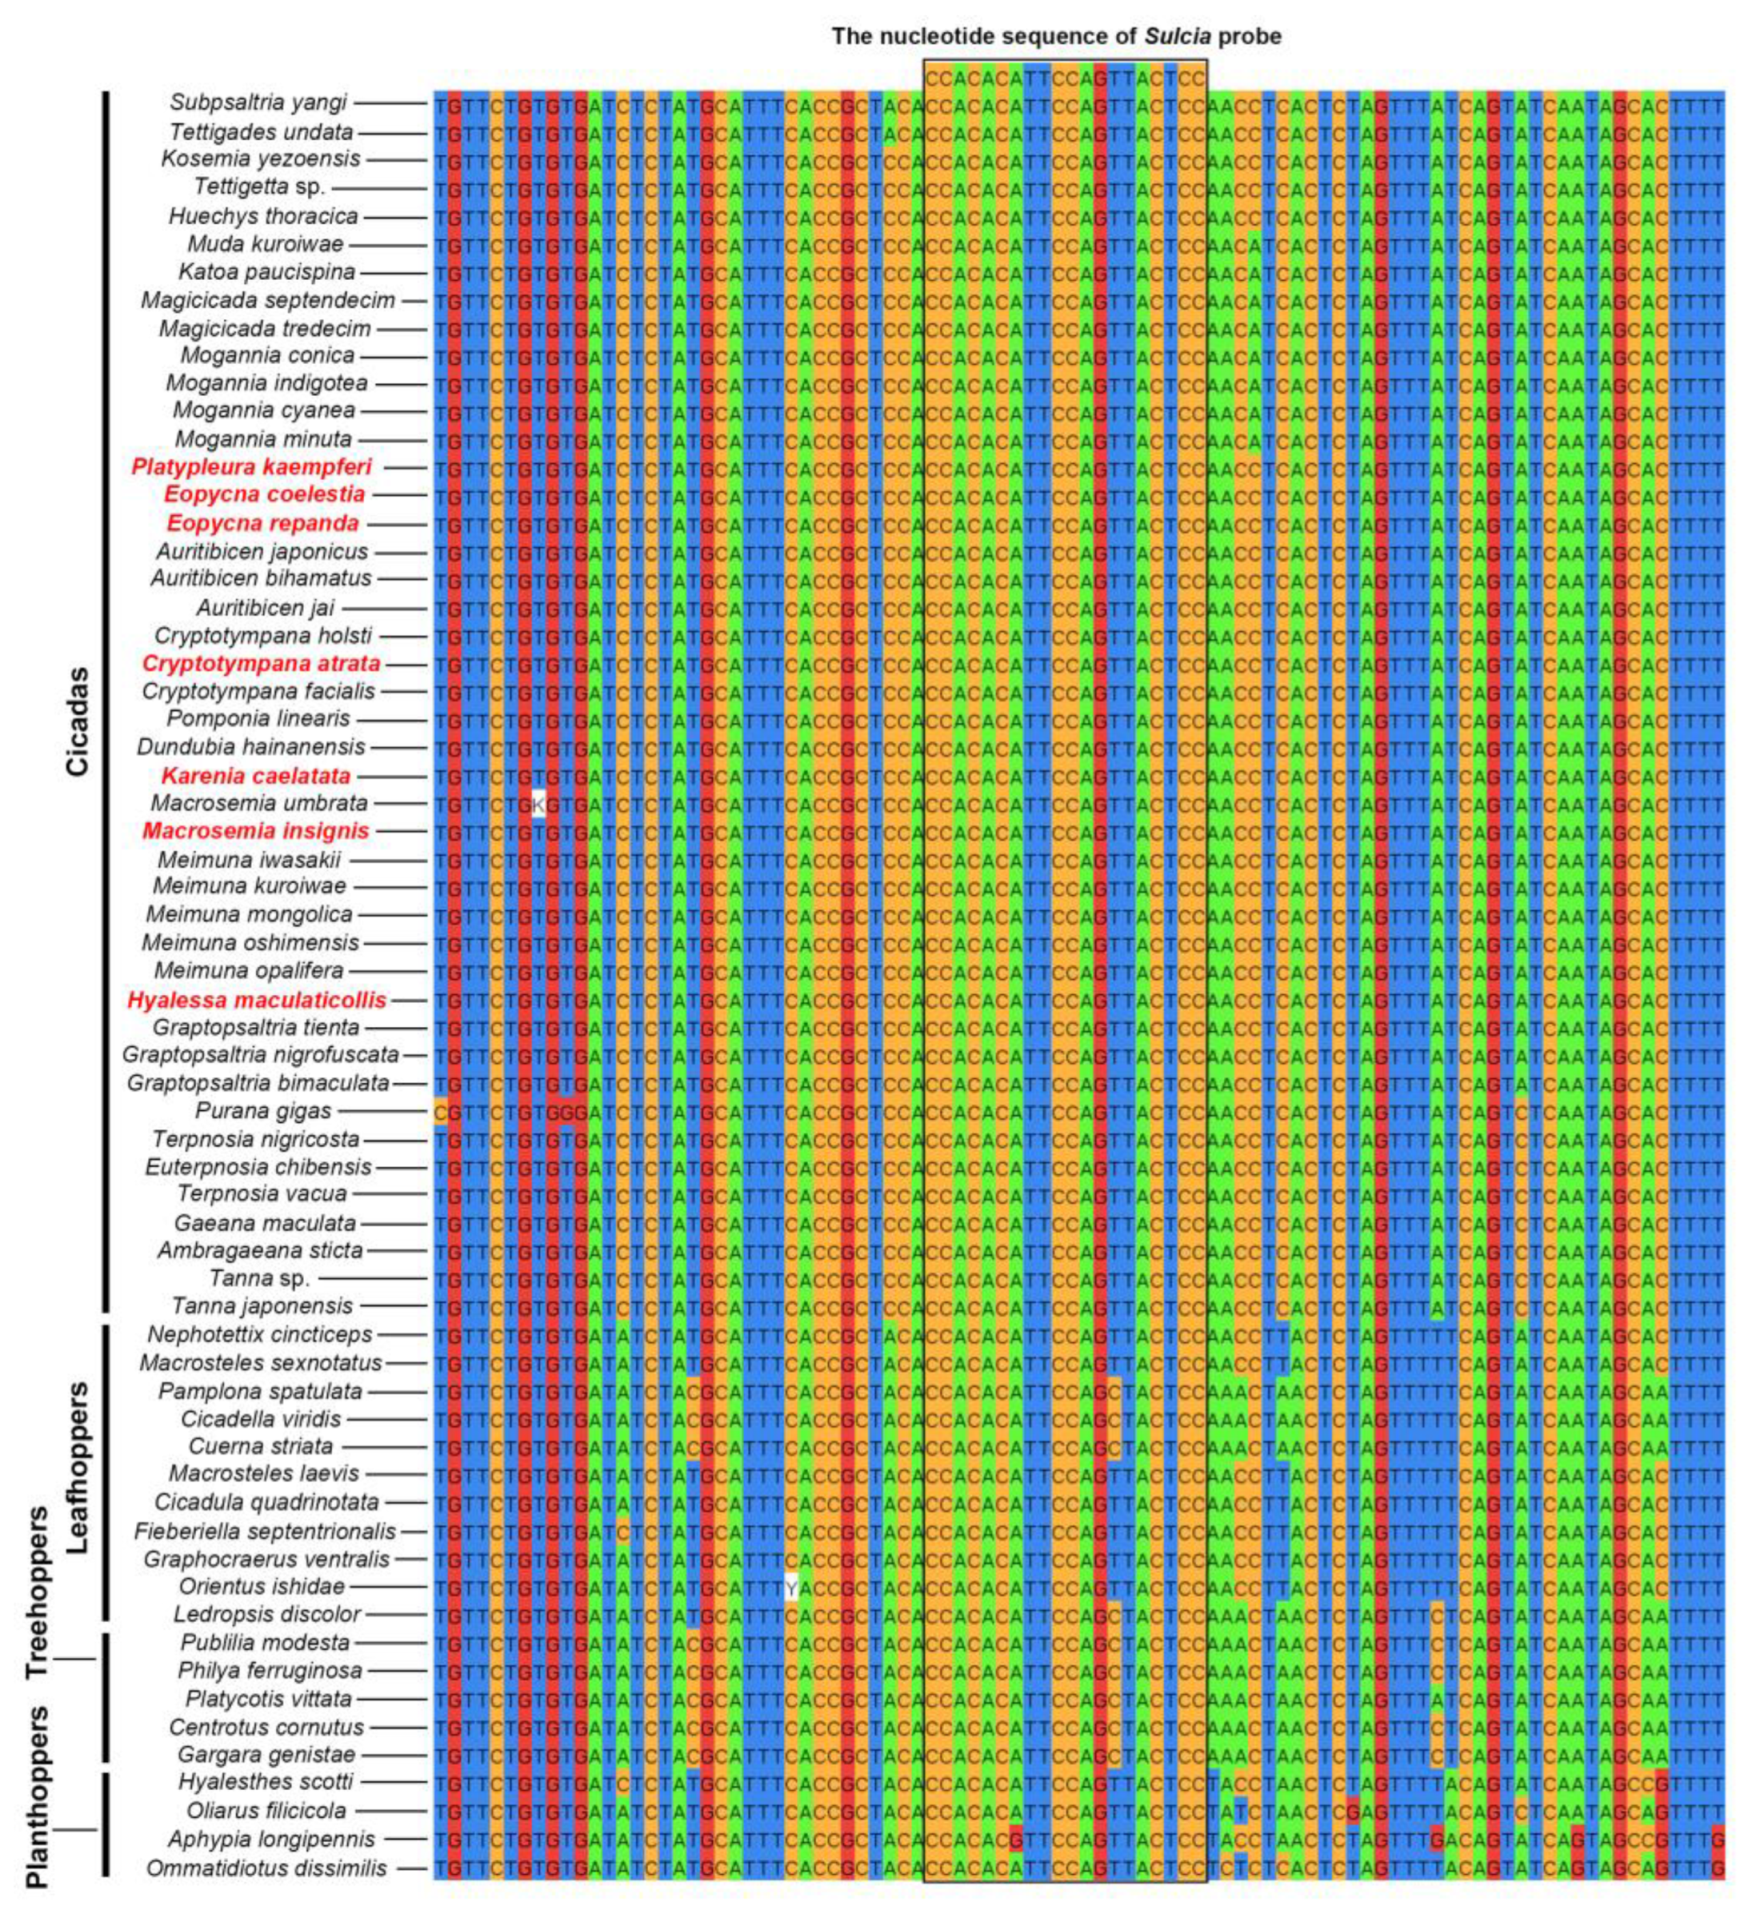
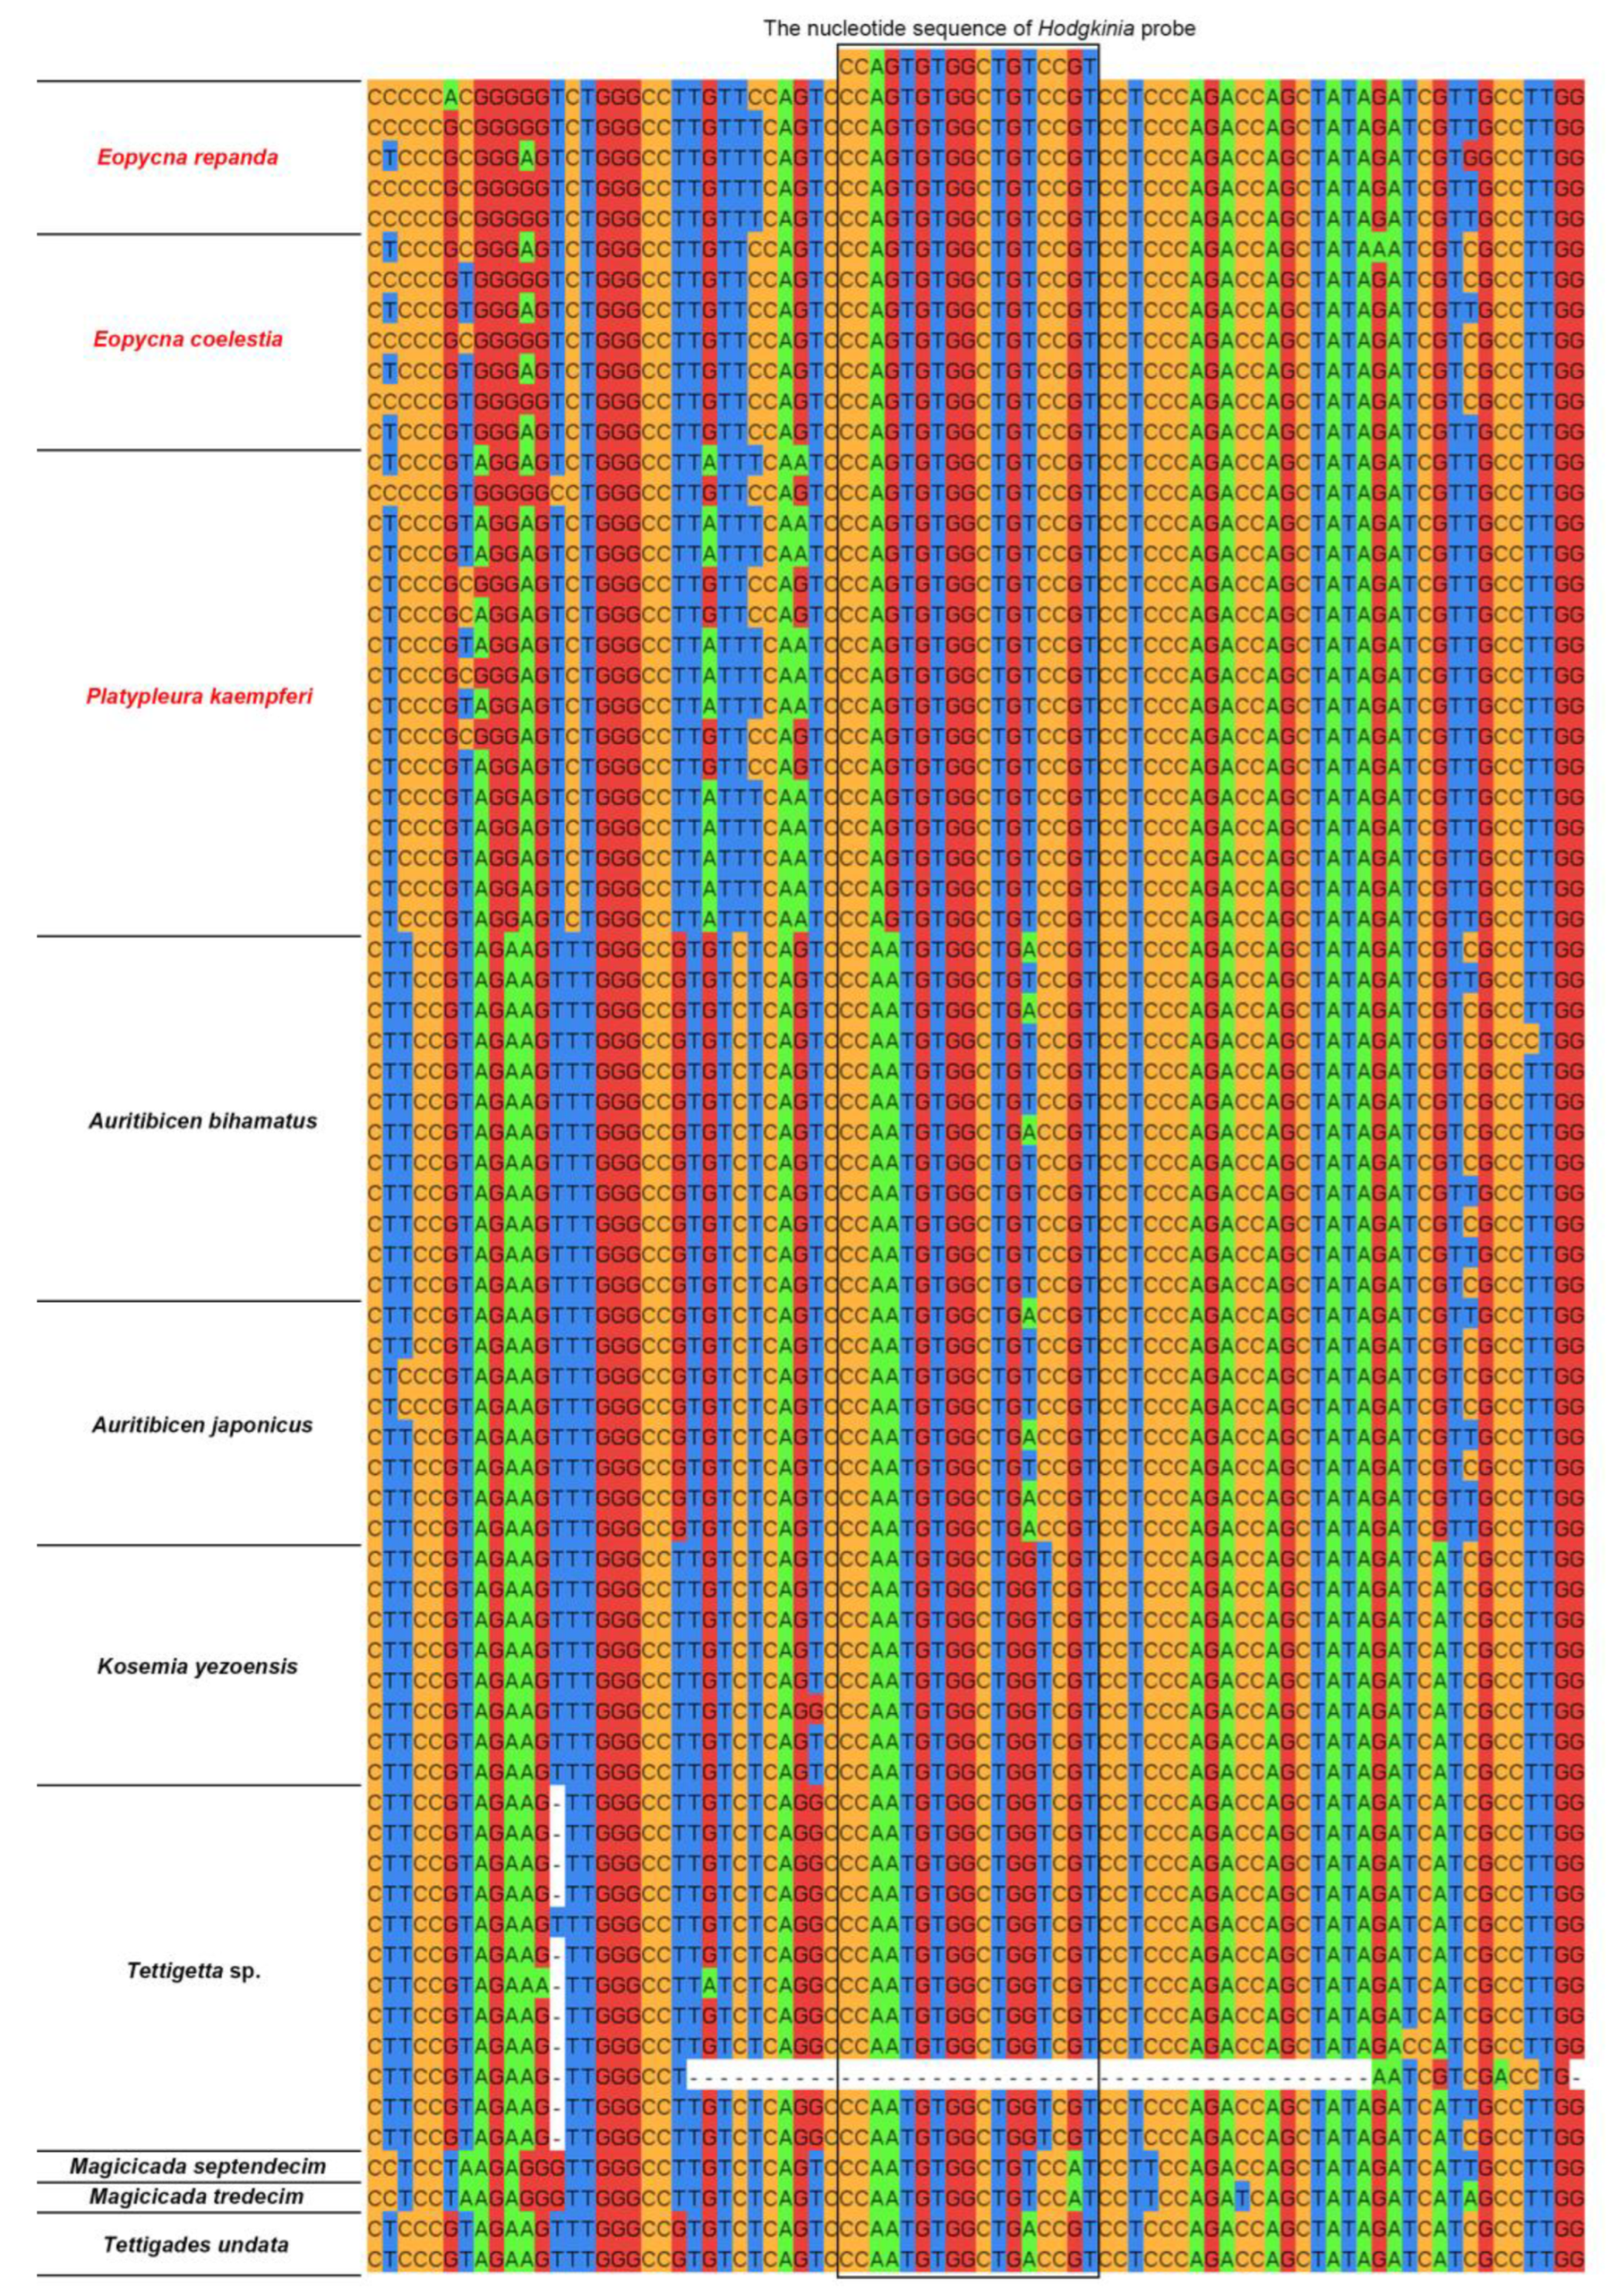
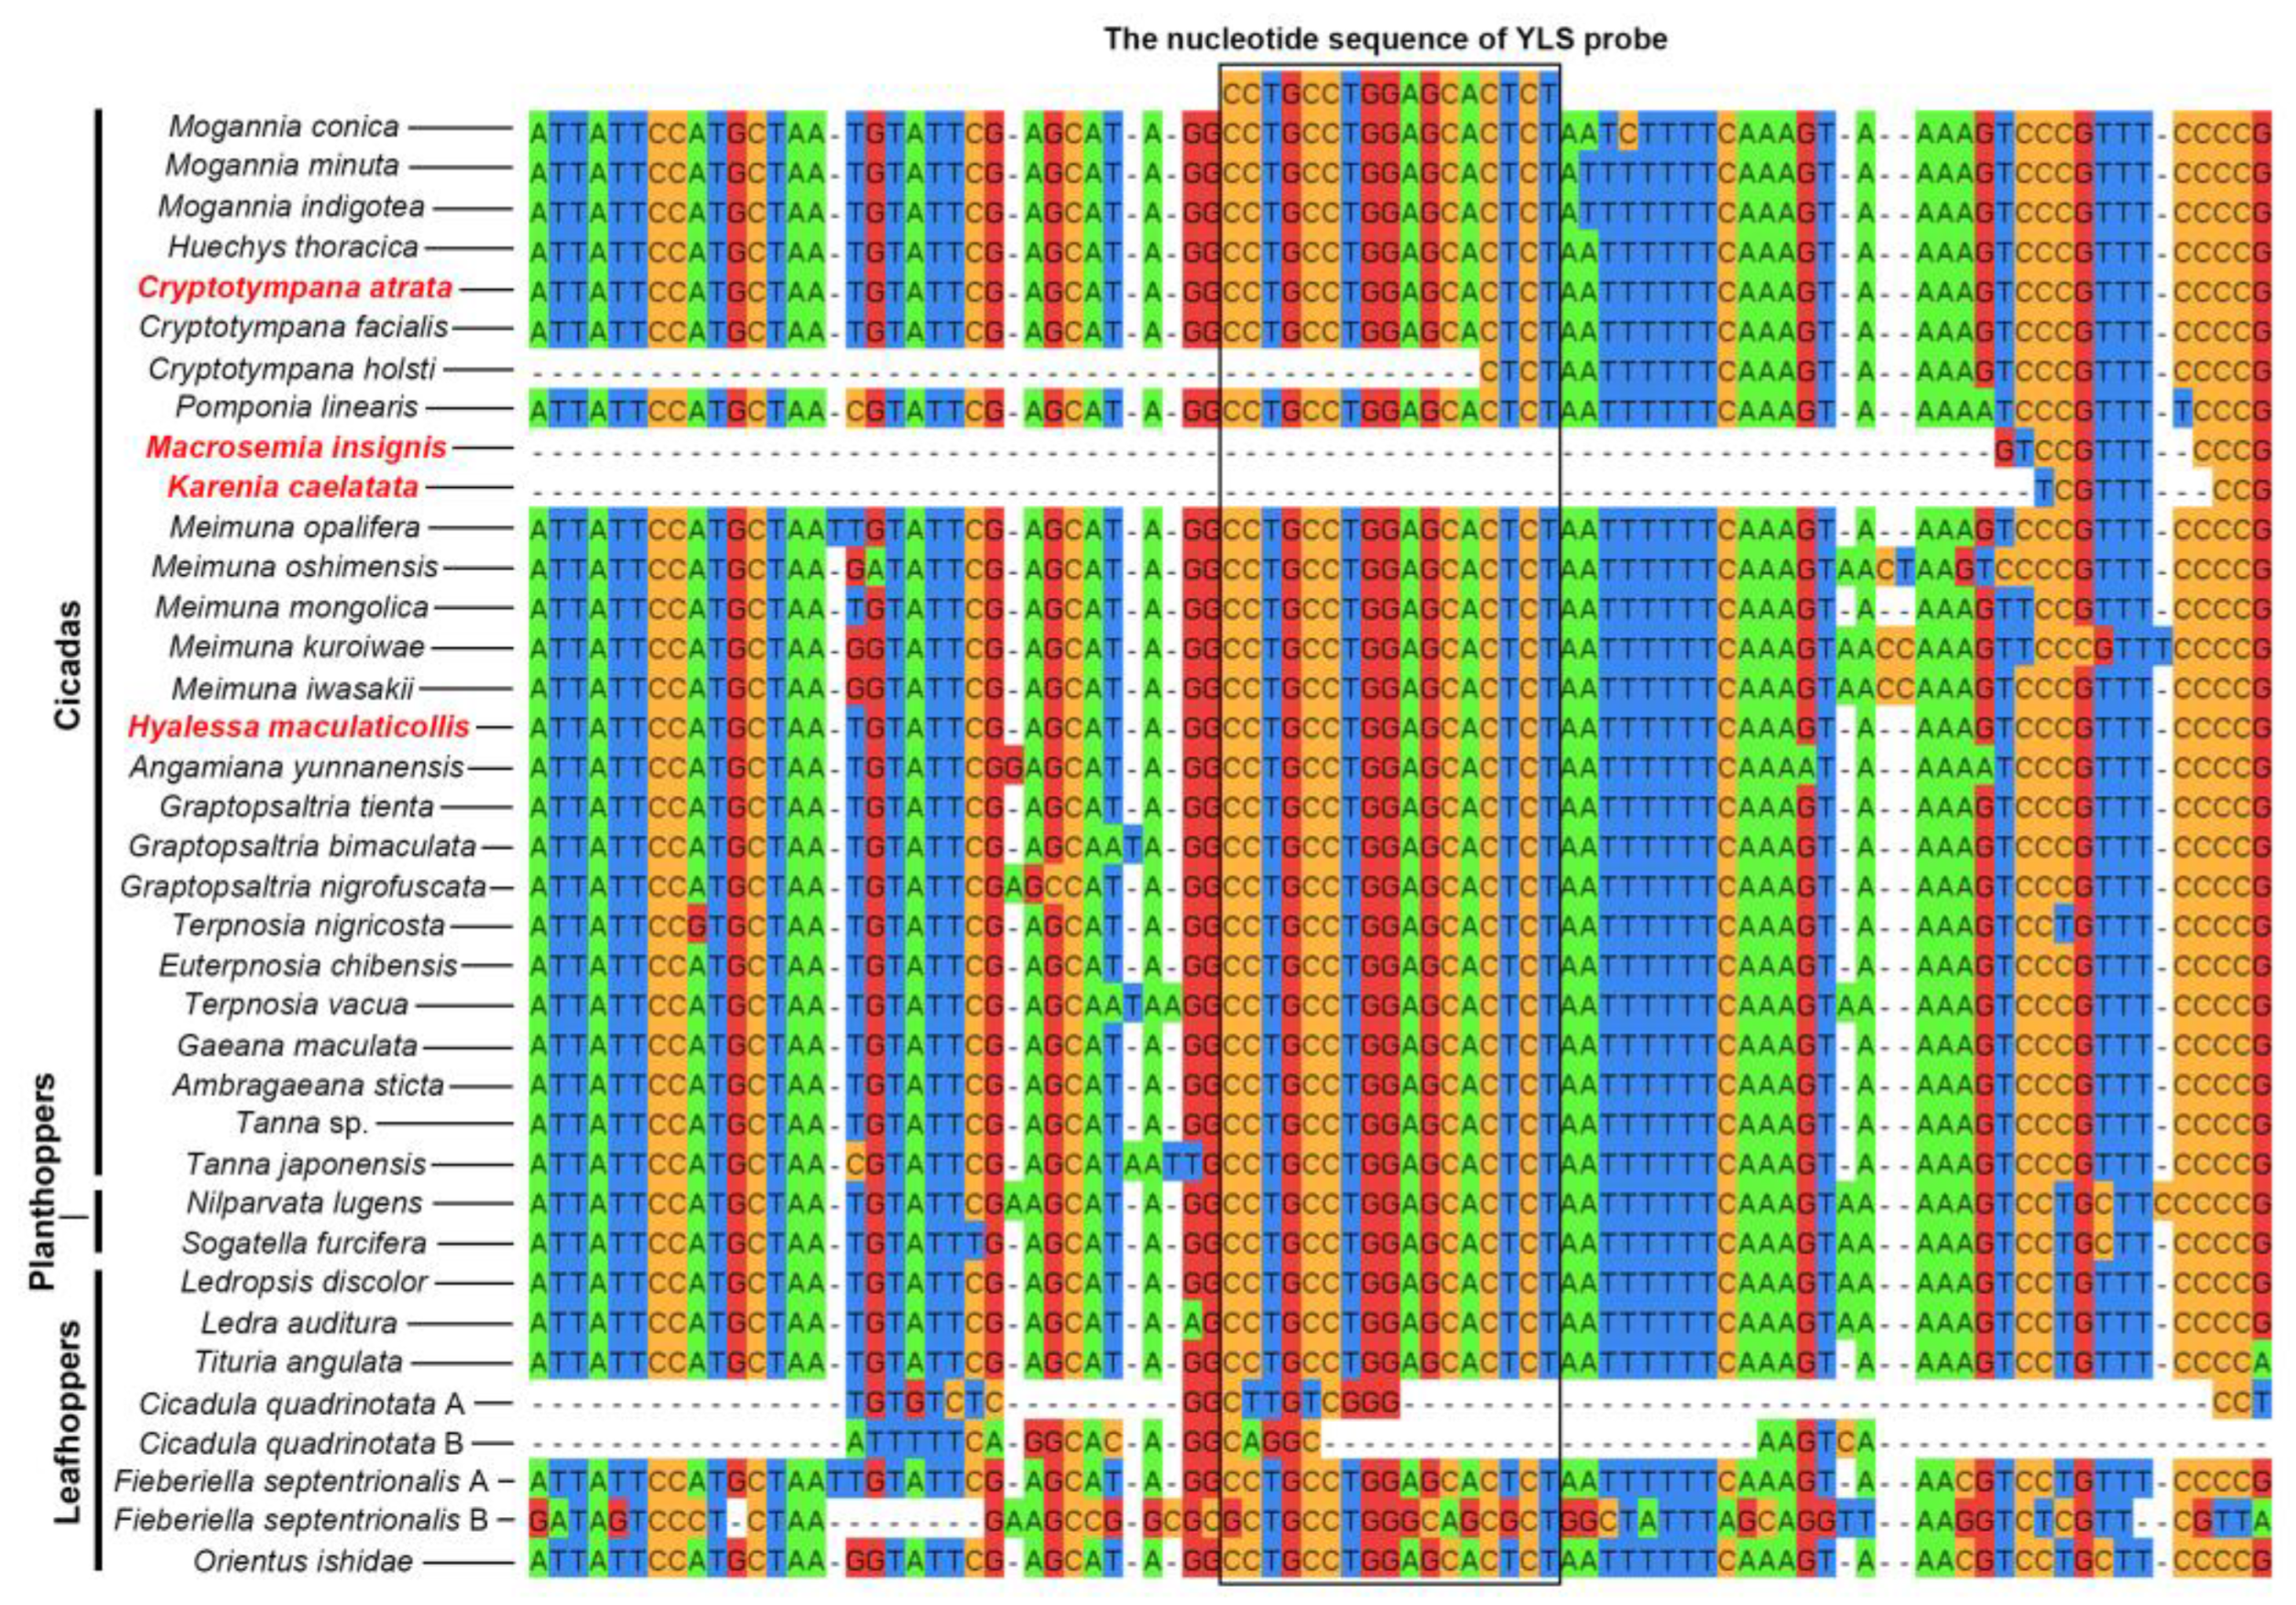
2.1. Similarity between rRNA-Targeted Oligonucleotide Probes and 16S rRNA/18S rRNA Gene Sequence of Targeted Microbes in Cicadas and Other Auchenorrhynchan Insects

The results of sequence similarity revealed that the nucleotide sequence of Sulcia probe used in this study shows 100% similarity with the 16S rRNA gene sequences of Sulcia symbionts in all cicadas (Figure 1, Table 1 and Table S1). The nucleotide sequence of Sulcia probe exhibits 100% similarity with the 16S rRNA gene sequences of Sulcia symbionts in some leafhoppers and planthoppers (e.g., Macrosteles sexnotatus), whereas it shows 95% similarity with the 16S rRNA gene sequences of Sulcia symbionts in some treehoppers (e.g., Publilia modesta), leafhoppers and planthoppers (Figure 1, Table 1 and Table S2).
The nucleotide sequence of the Hodgkinia-Ple probe exhibits 100% similarity with the 16S rRNA gene sequences of Hodgkinia symbionts in cicadas of the tribe Platypleurini, including P. kaempferi, E. coelestia and E. repanda (Figure 2, Table 1 and Table S1). However, the nucleotide sequence of Hodgkinia-Ple probe shows an extremely low similarity (82.35% or 88.24%) with the 16S rRNA gene sequences of Hodgkinia symbionts in some cicada species, including Tettigades undata, Kosemia yezoensis, Tettigetta sp., Magicicada septendecim and Magicicada tredecim. Additionally, the nucleotide sequence of Hodgkinia-Ple probe exhibits similarities of 88.24% and 94.12% with the 16S rRNA gene sequences of Hodgkinia symbionts in Auritibicen japonicus and Auritibicen bihamatus, which is related to that 16S rRNA gene sequences of Hodgkinia lineages were dissimilar in the probe target sites of these two cicada species (Figure 2, Table 1 and Table S1). We have listed the two other Hodgkinia probes (i.e., Hodgkinia-Tet and Hodgkinia-Mag) in Table 1, which exhibit 100% similarity with the 16S rRNA gene sequences of Hodgkinia lineages in related cicadas.
The nucleotide sequence of the YLS probe used in this study shows 100% similarity with the 18S rRNA gene sequences of YLS symbionts in cicadas (Figure 3, Table 1 and Table S1). The nucleotide sequence of YLS probe exhibits 100% similarity with the 18S rRNA gene sequences of YLS in almost all planthoppers and leafhoppers except for Fieberiella septentrionalis, but it shows similarities of 64.71% and 100% with the 18S rRNA gene sequences of YLS in the leafhopper F. septentrionalis in which YLS has split into two different lineages (Figure 3, Table 1 and Table S2).

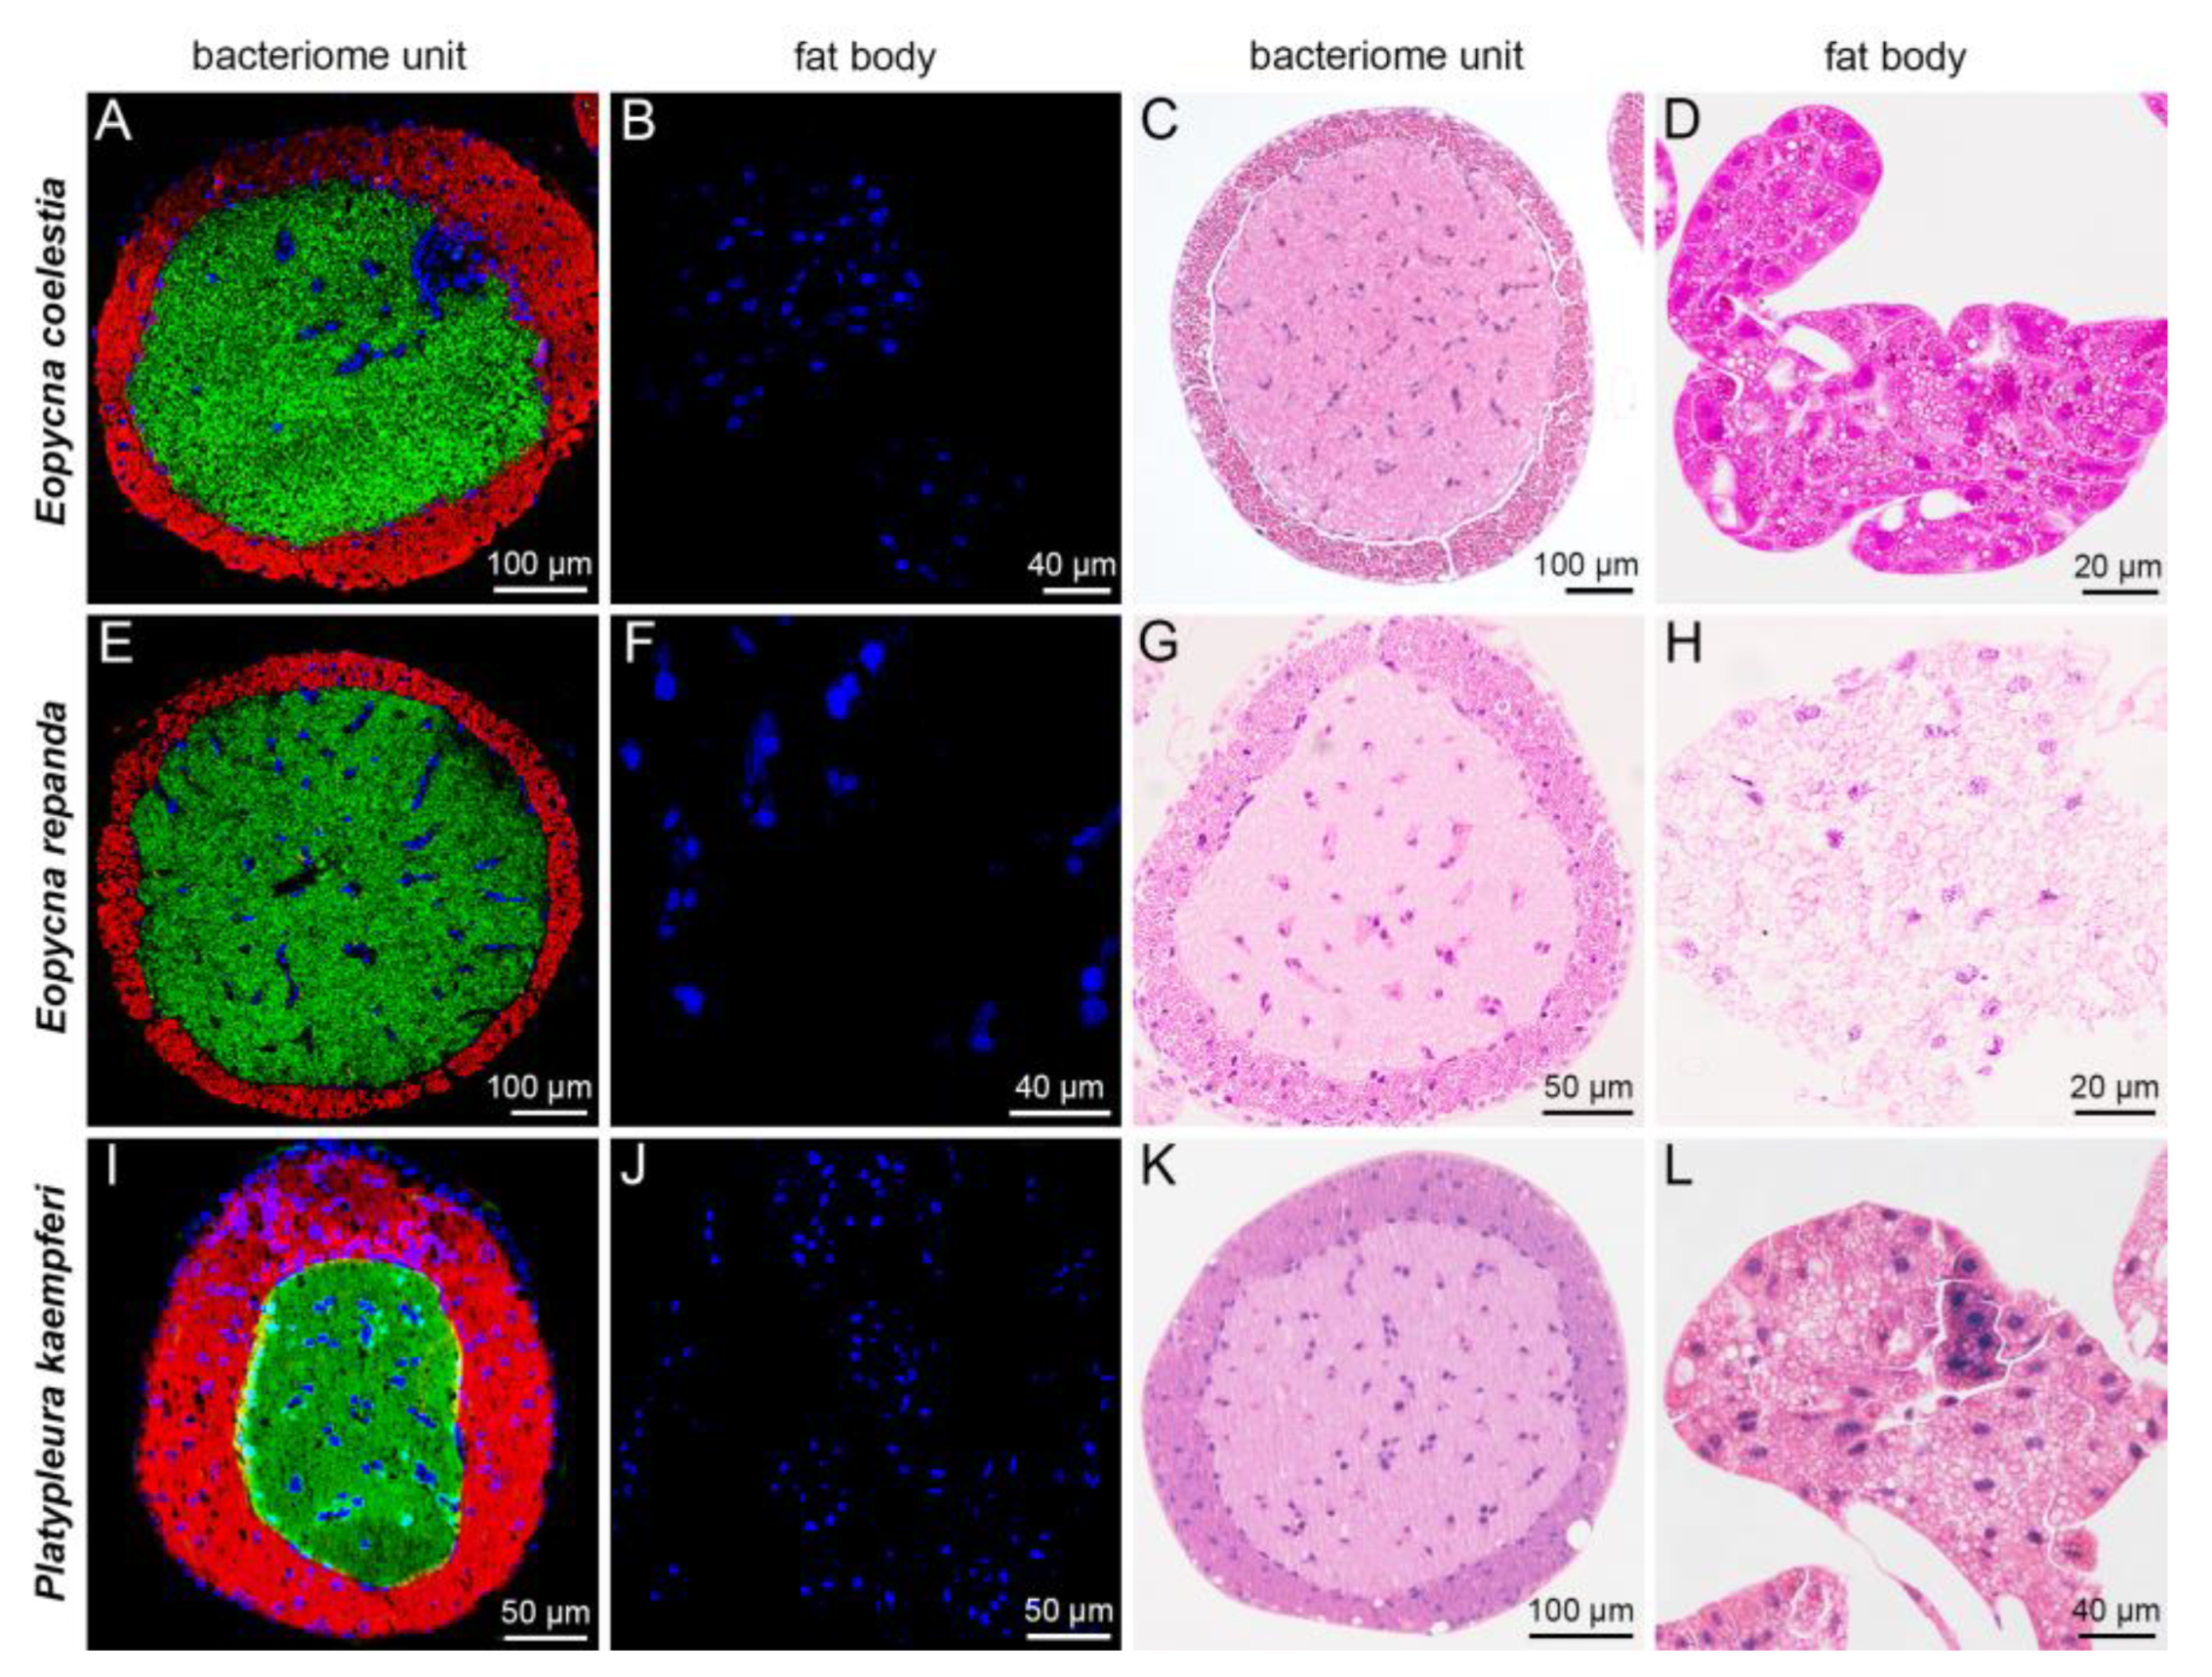
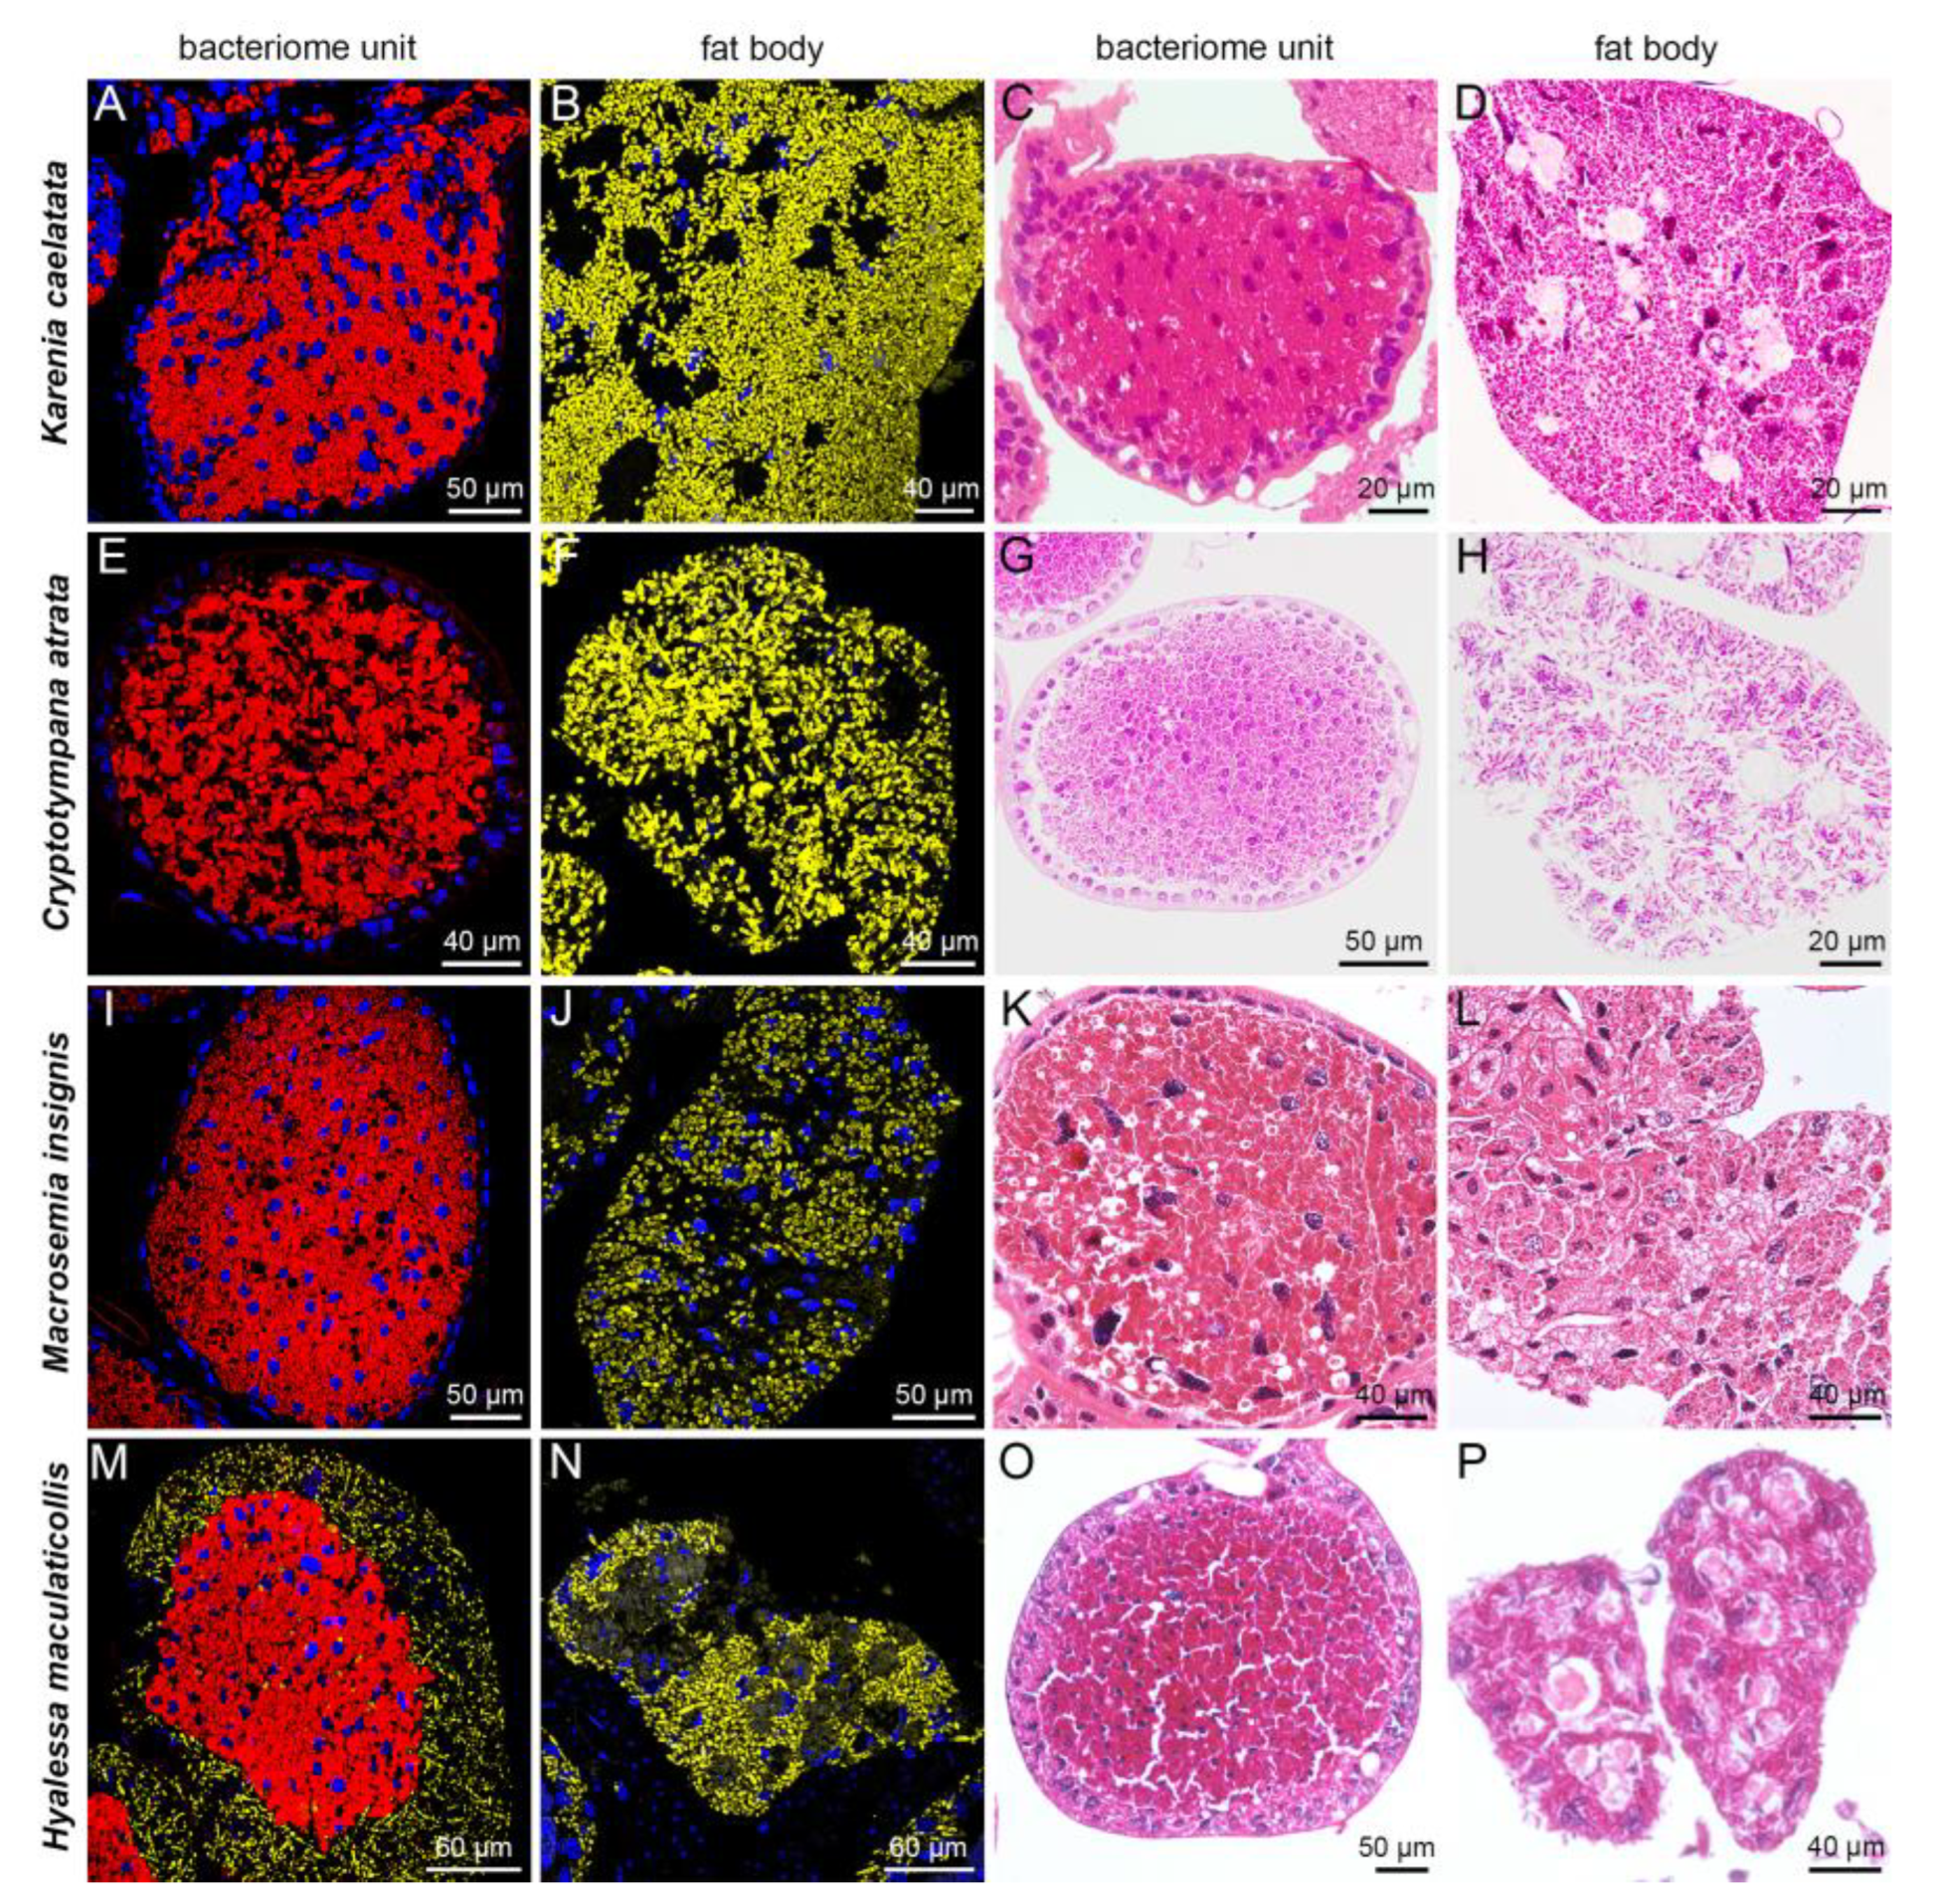
2.2. Distribution of Sulcia, Hodgkinia and YLS in Bacteriomes and Fat Bodies of Seven Representative Cicada Species

For E. coelestia, E. repanda and P. kaempferi that harbored Hodgkinia and Sulcia in the bacteriomes, Sulcia was harbored in the peripheral bacteriocytes, whereas Hodgkinia occupied the central bacteriocytes of bacteriome units (Figure 4A–L). Sulcia was harbored in the bacteriomes of K. caelatata, C. atrata and M. insignis, whereas YLS was only present in the fat bodies of these three species (Figure 5A–L). In contrast, Sulcia was harbored in the bacteriomes of H. maculaticollis, and YLS was harbored in both the bacteriome sheath and fat bodies (Figure 5M–P).
The composition of symbionts harbored in the seven cicada species can be divided into three categories according to the distribution of YLS, Hodgkinia and Sulcia in the bacteriomes and/or fat bodies. The categories are schematically illustrated (Figure S1) and described as follows. Category 1: Sulcia only harbored in the bacteriocytes of bacteriomes, with YLS only harbored in the fat bodies (K. caelatata, C. atrata and M. insignis). Category 2: Sulcia harbored in the bacteriocytes of bacteriomes, and YLS harbored in both the bacteriome sheath and fat bodies (H. maculaticollis). Category 3: Hodgkinia and Sulcia harbored in the bacteriocytes of bacteriomes, with no obligate symbiont harbored in the fat bodies (E. coelestia, E. repanda and P. kaempferi).

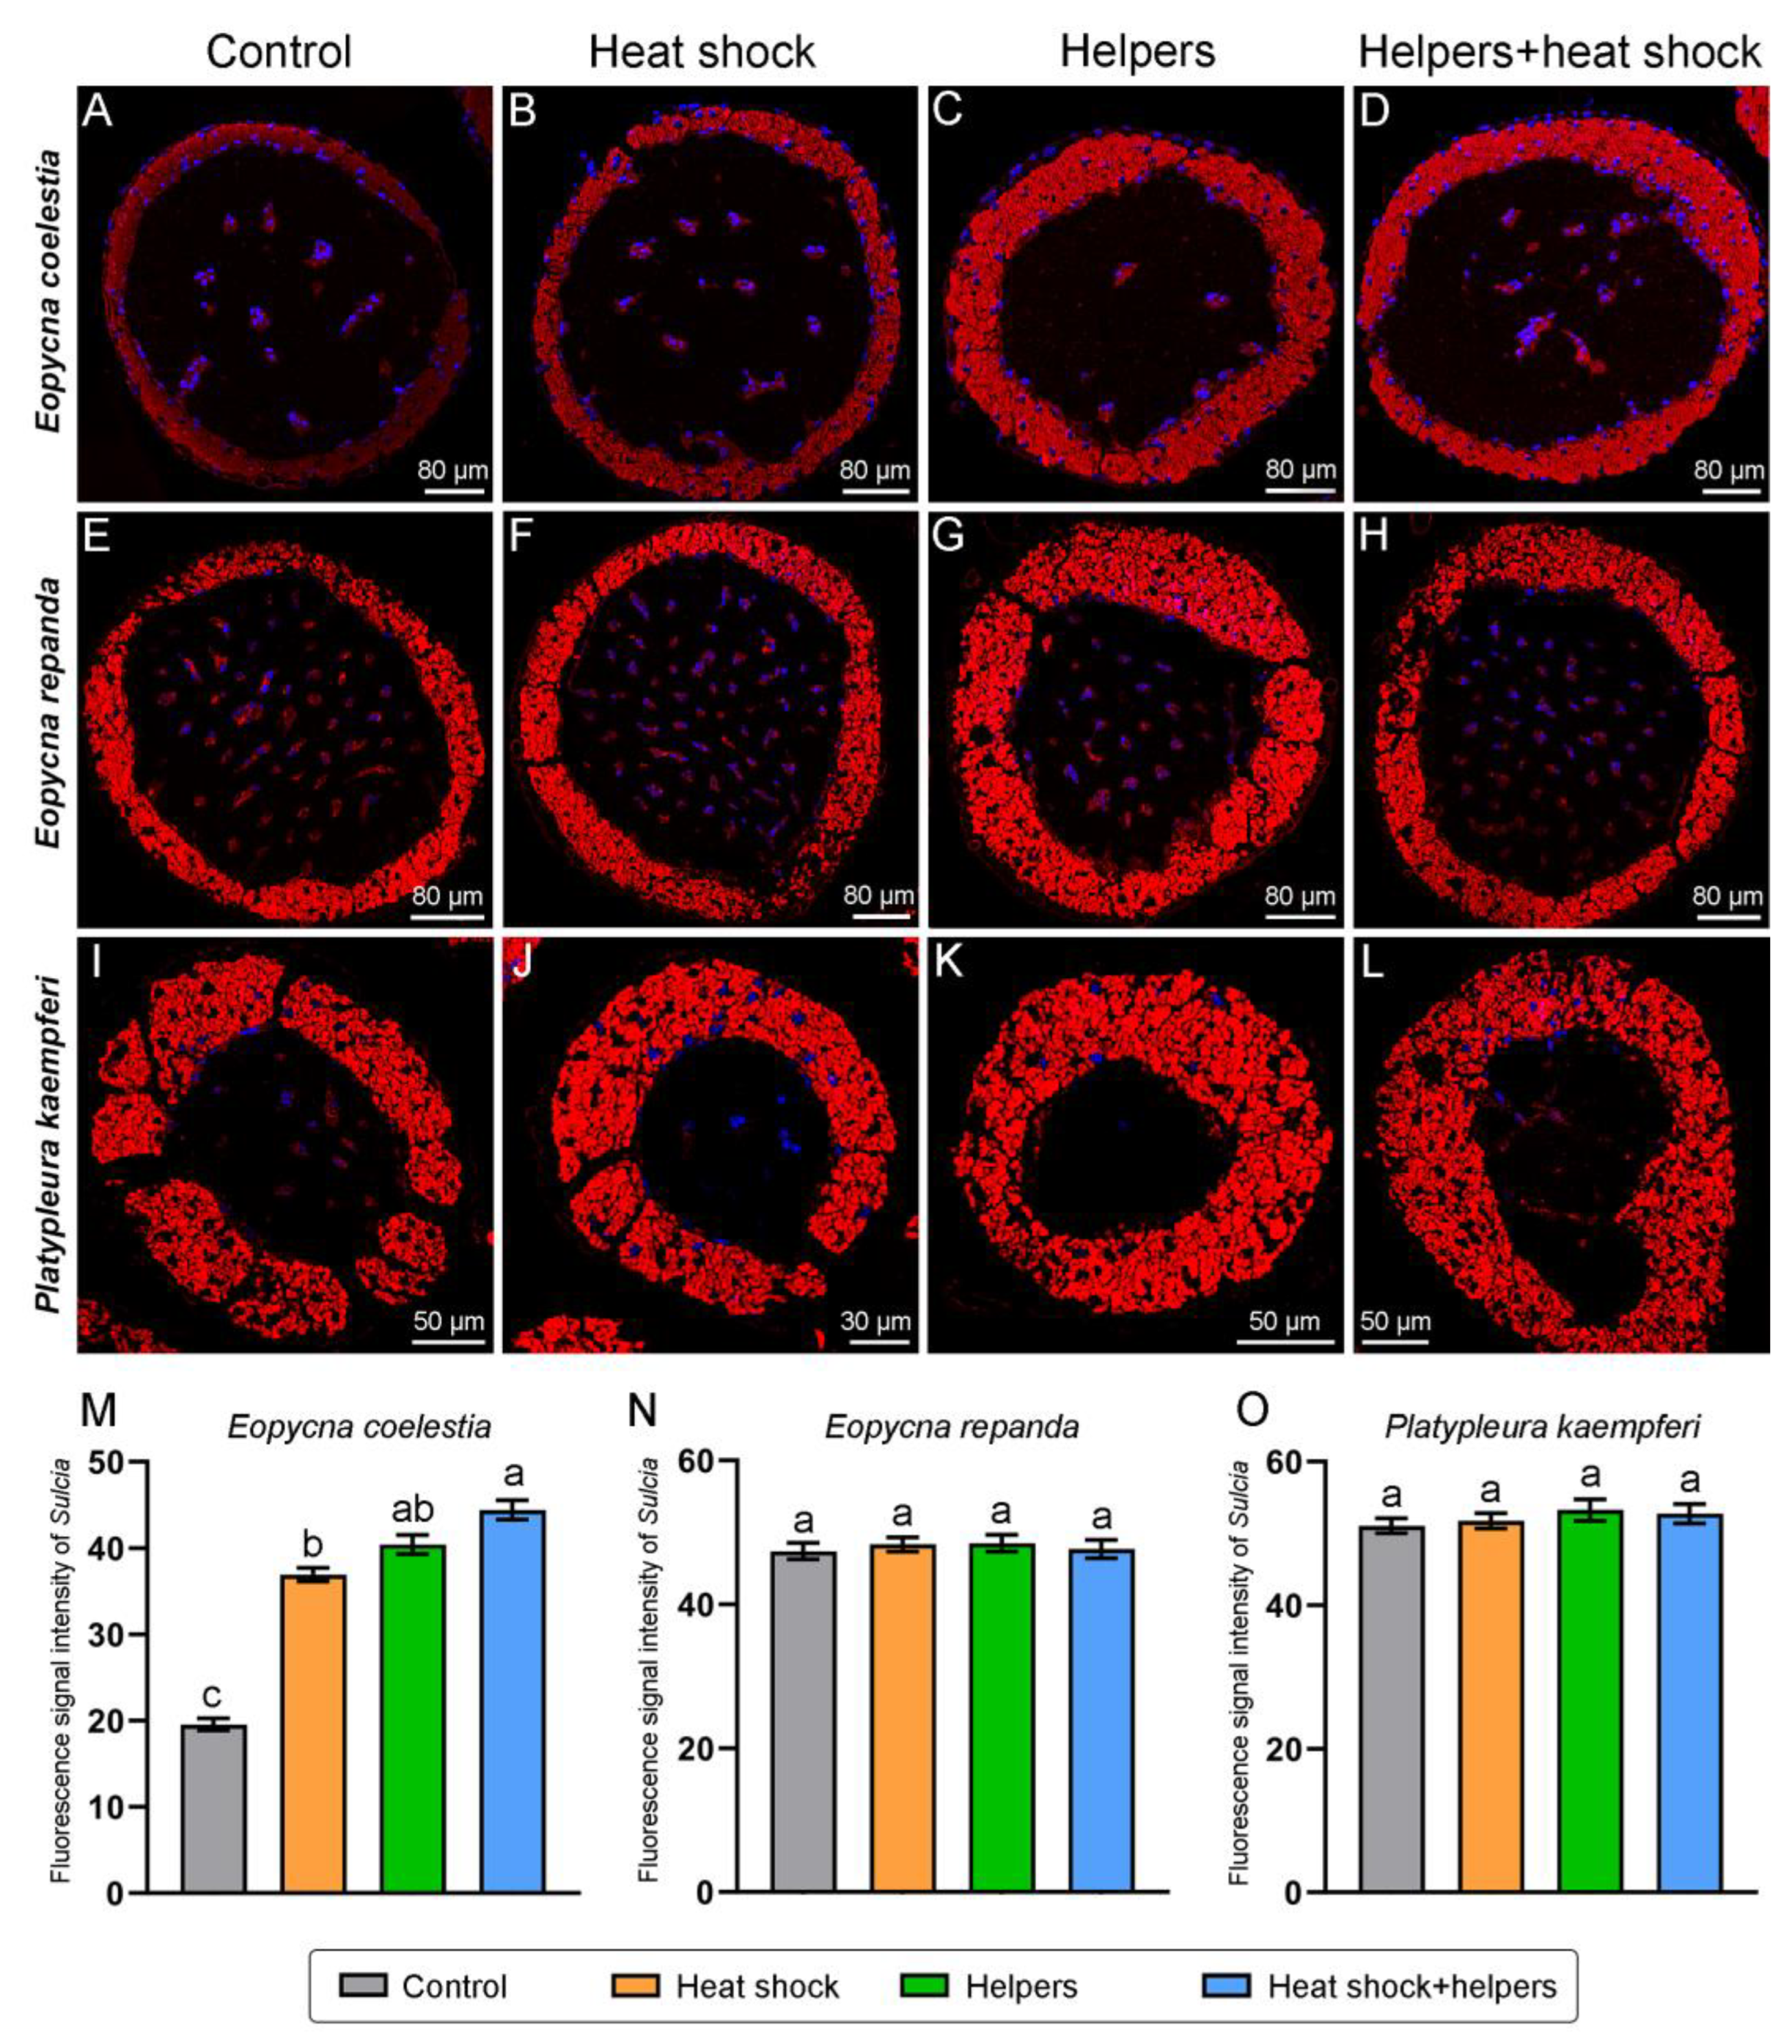
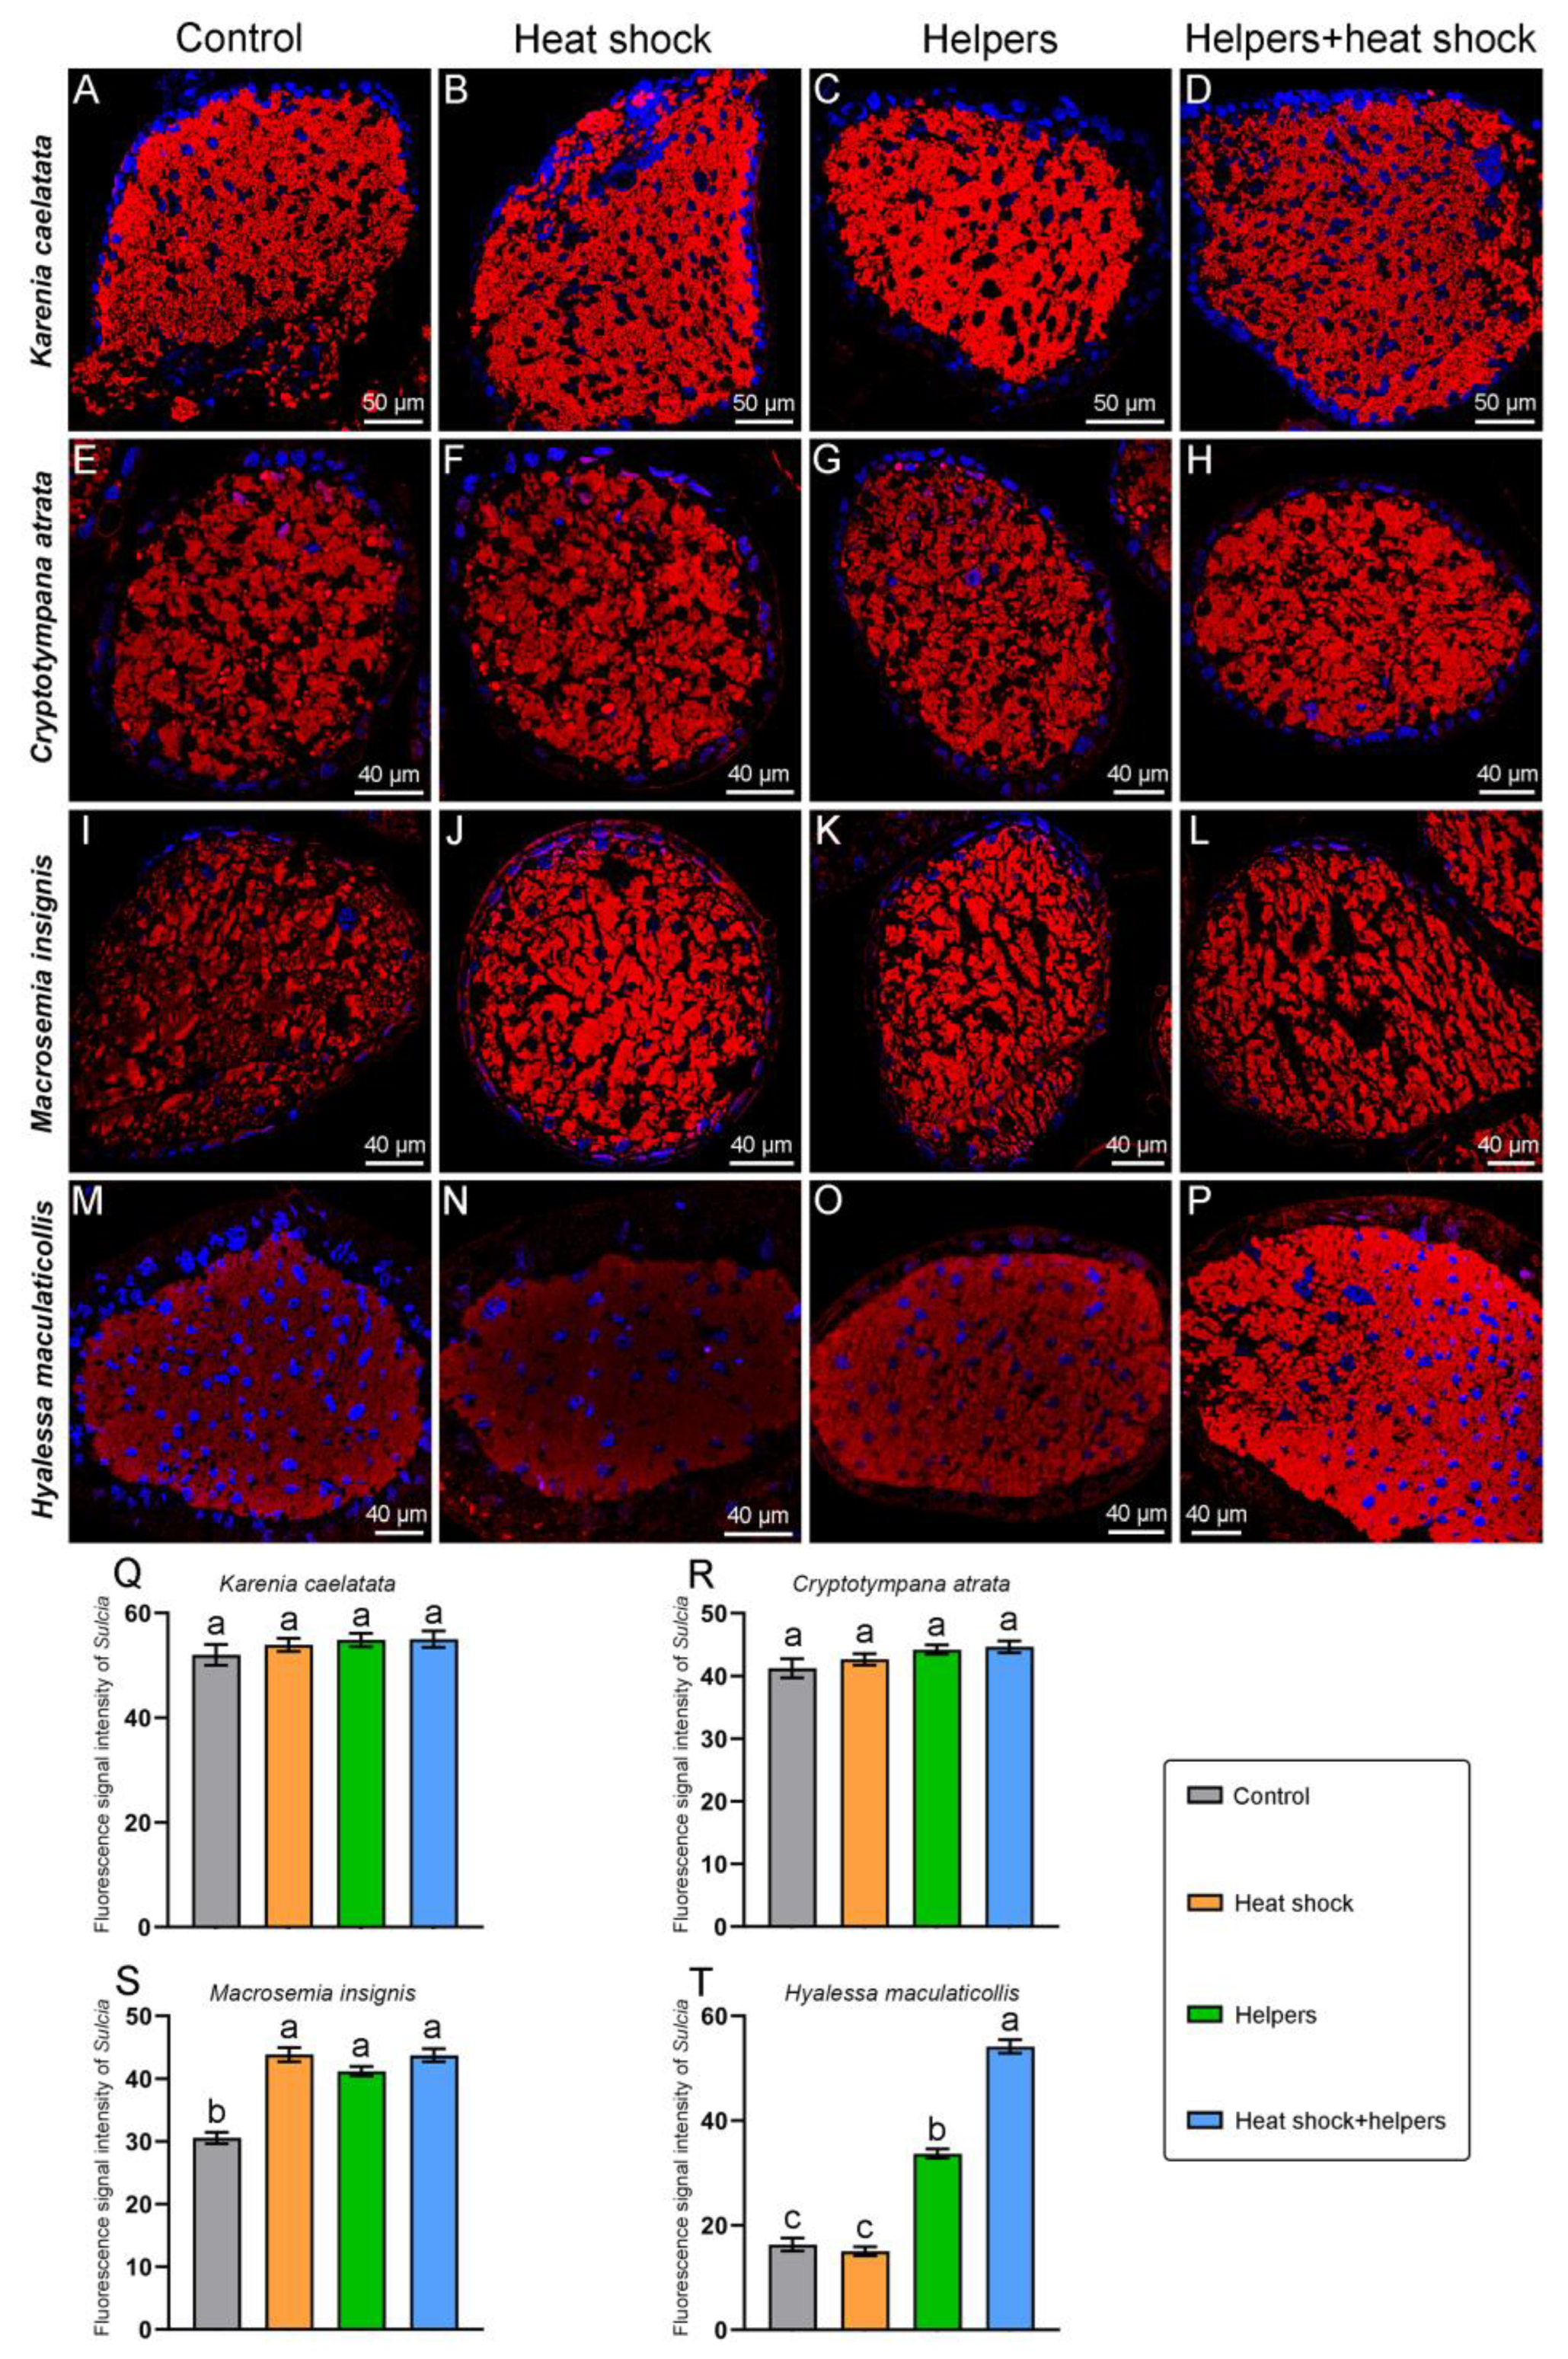
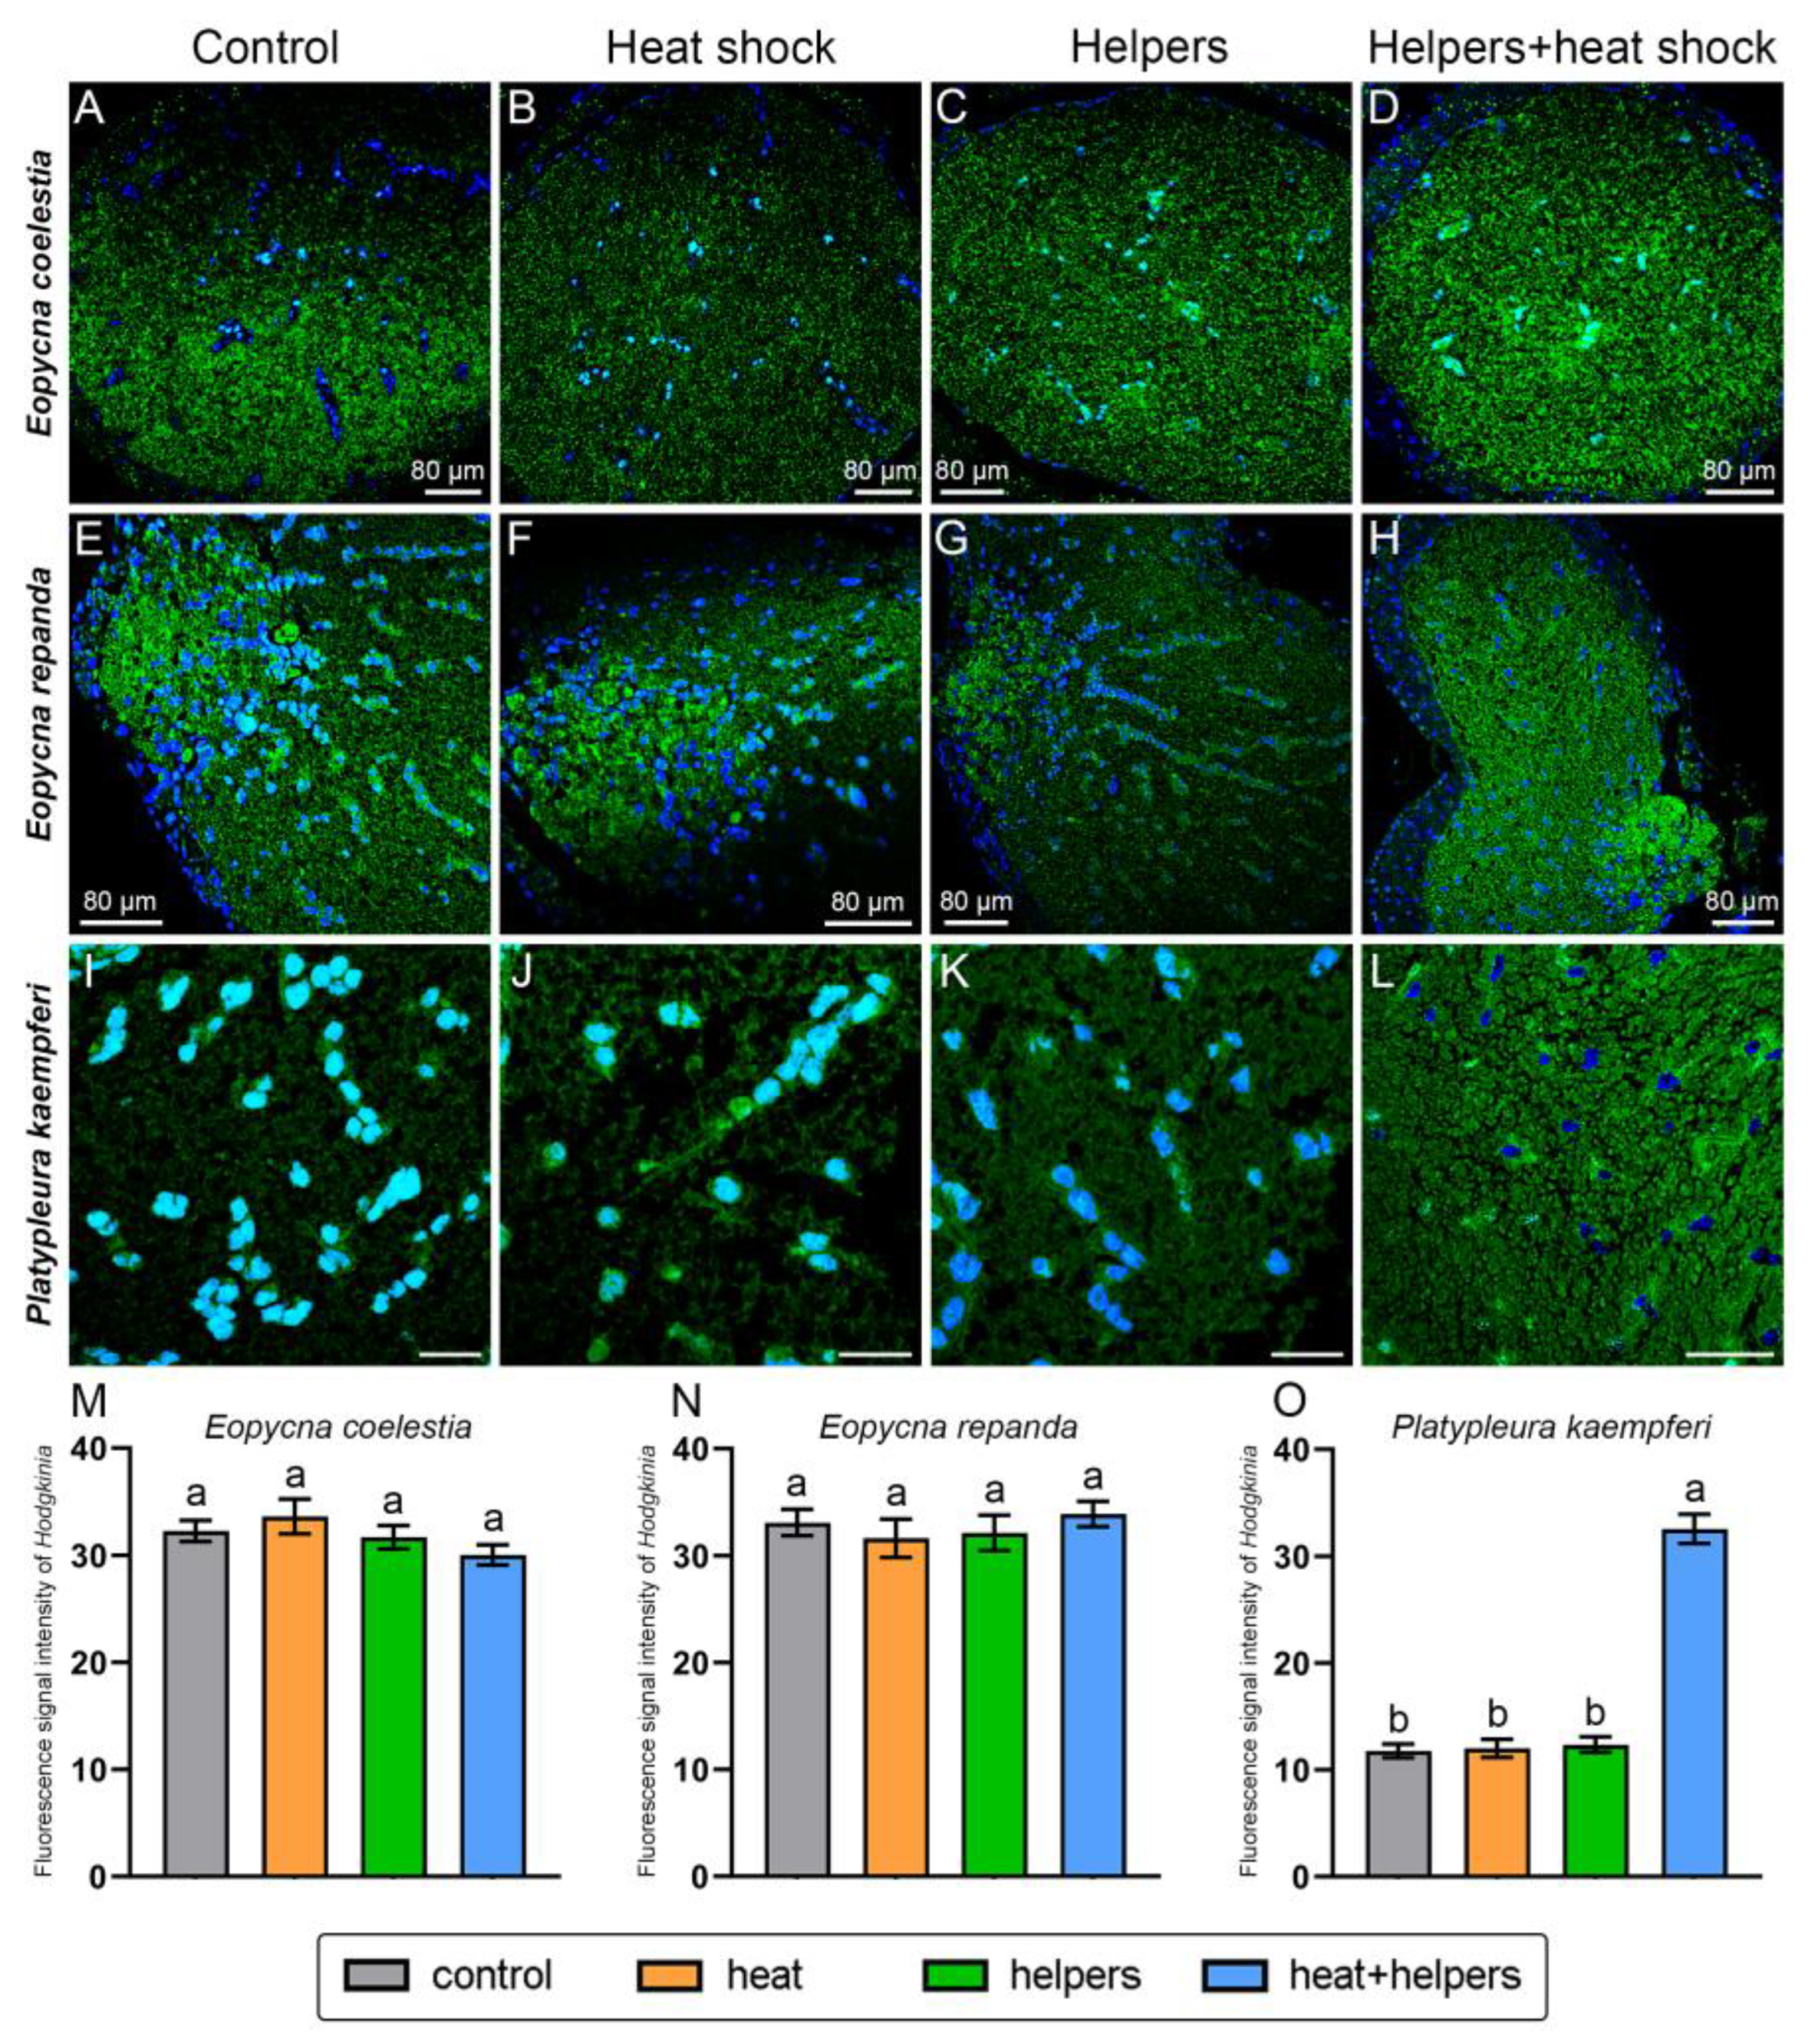
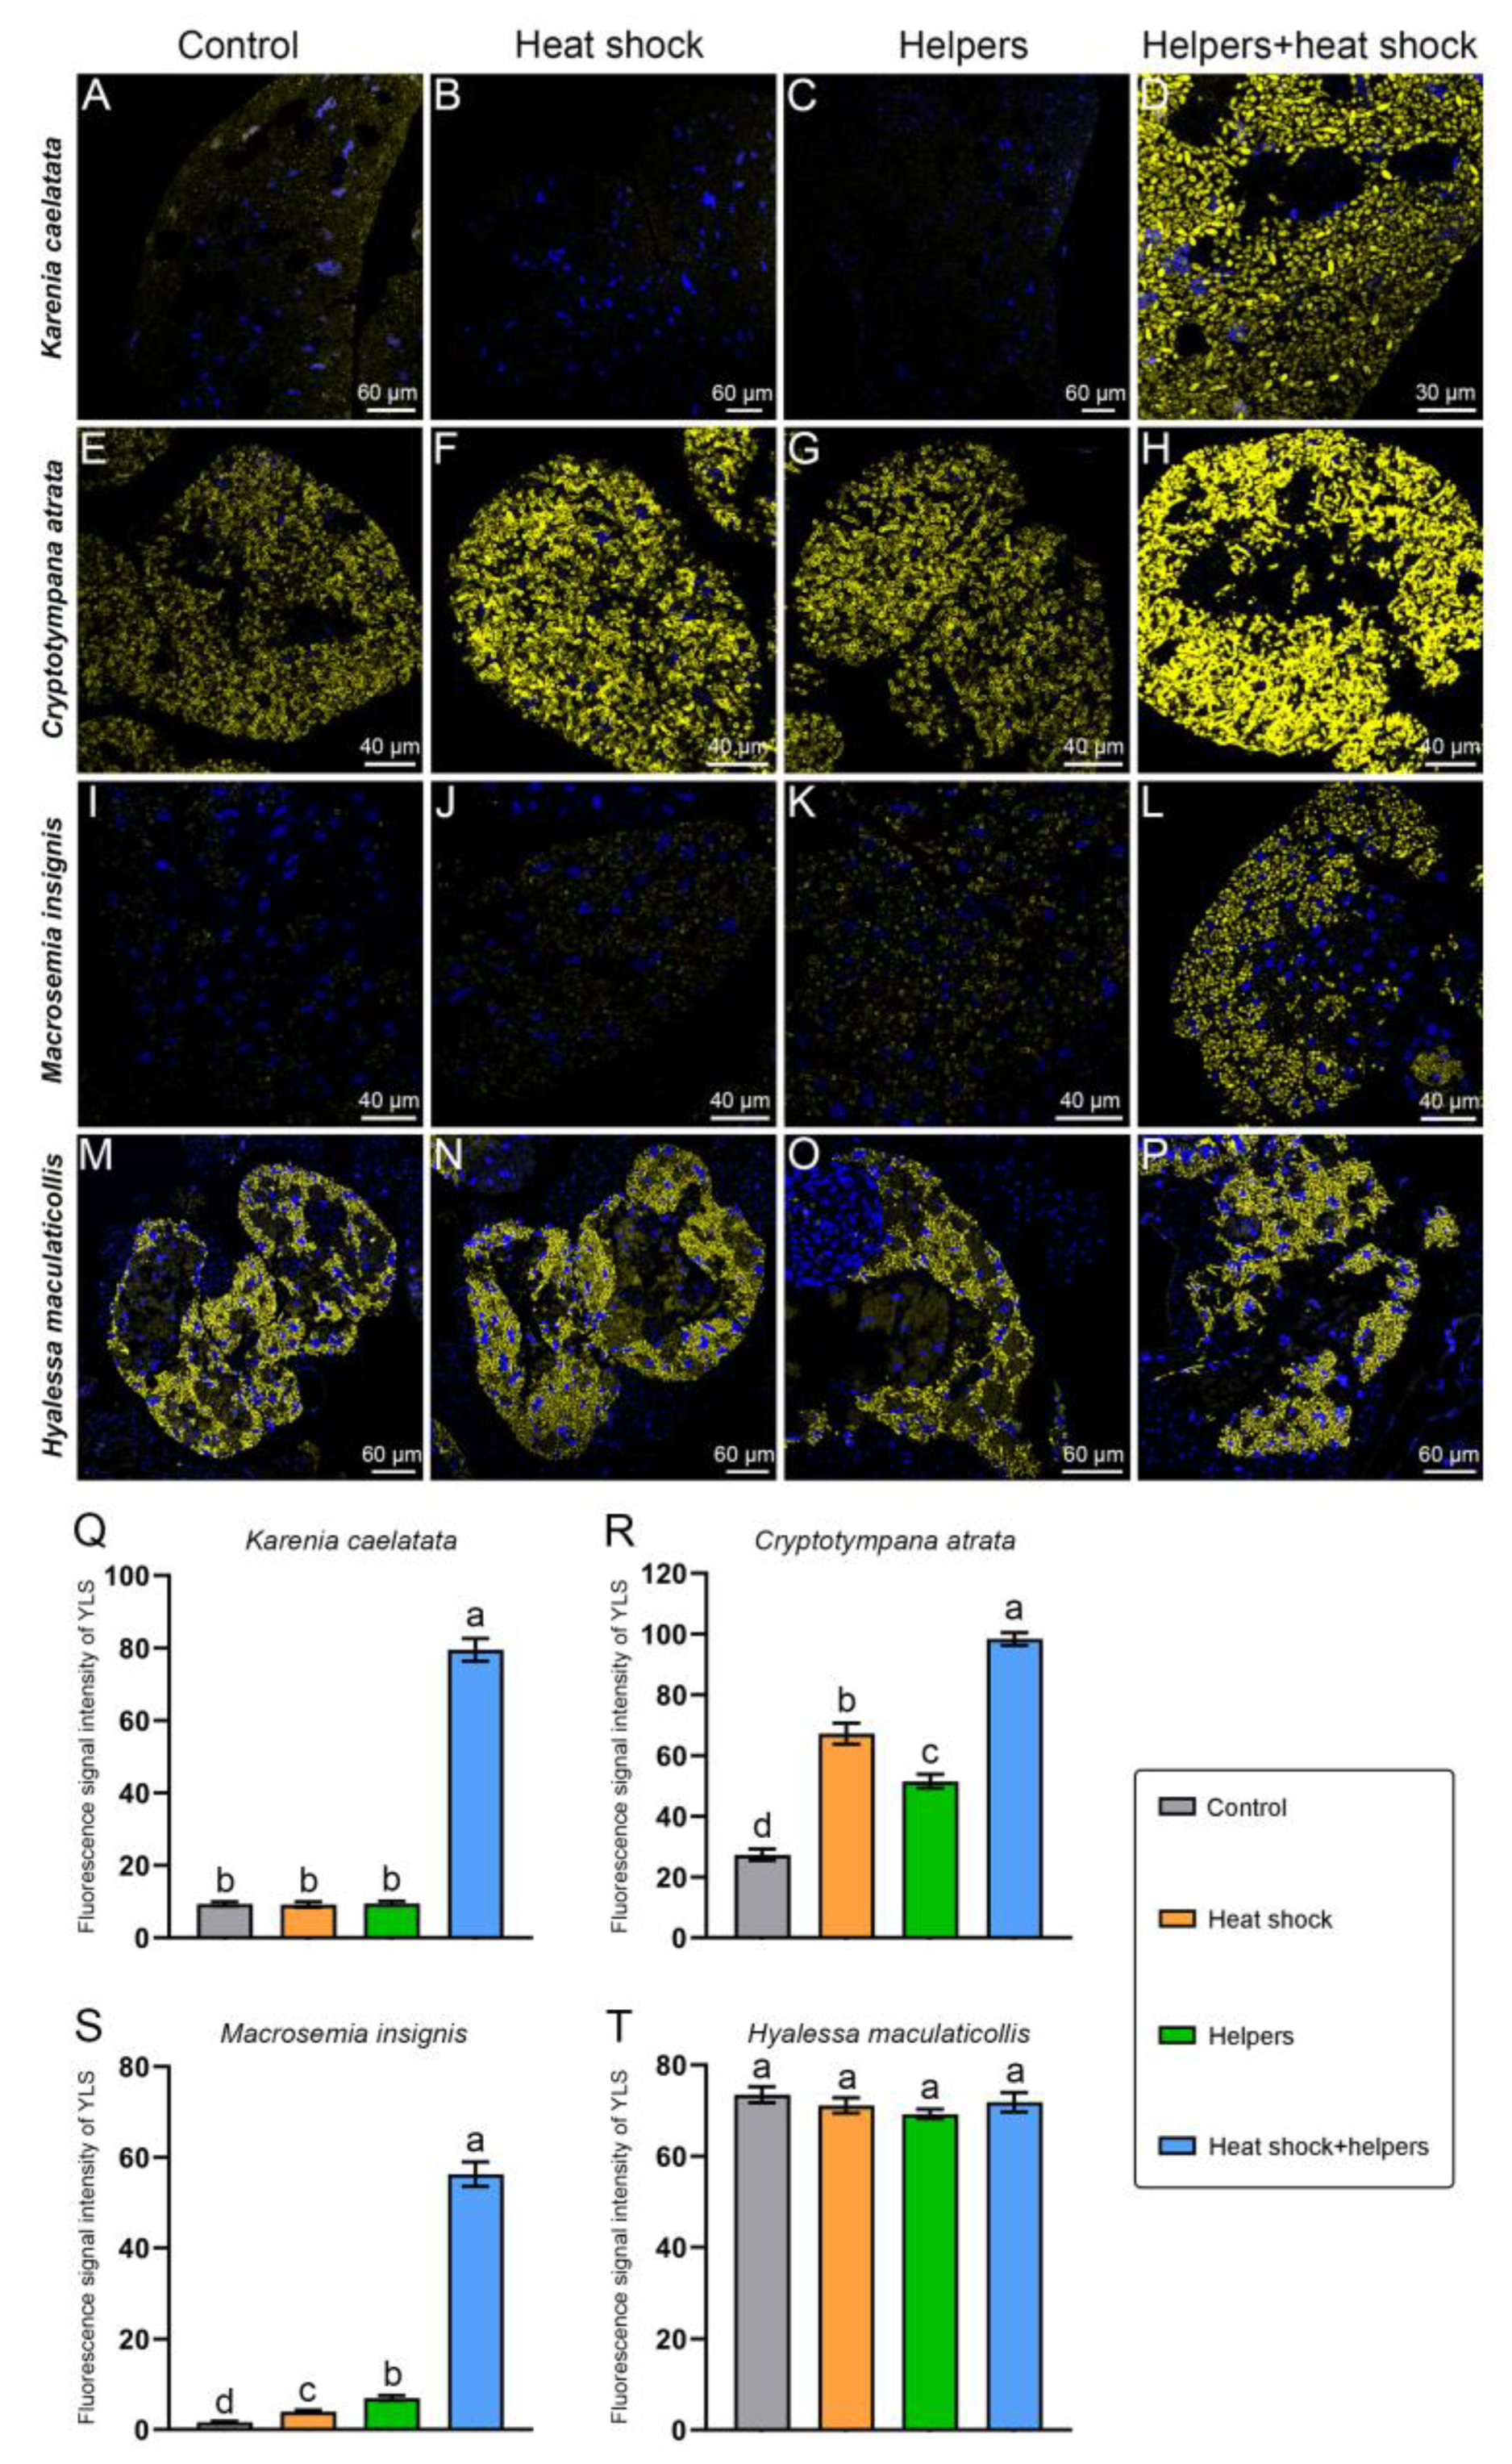
2.3. The Improvement of the FISH Signal Intensity of Symbionts by Addition of Unlabeled Helper Sequences and Heat Shock

The fluorescence signal intensity of Sulcia in E. repanda, P. kaempferi, K. caelatata and C. atrata is generally similar under the control group and three treatment groups (Figure 6 and Figure 7). Sulcia of these four cicada species exhibit bright fluorescence signals under the control group, and it also shows strong hybridization signals under the other three treatment groups (viz., the addition of helpers and/or heat shock). The Sulcia fluorescence signal intensities of the control group/heat shock group/helpers group/helpers + heat shock group in E. repanda, P. kaempferi, K. caelatata and C. atrata are approximately 1:1.02:1.02:1.01, 1:1.01:1.04:1.03, 1:1.04:1.05:1.06, and 1:1.03:1.07:1.08, respectively. For E. coelestia and M. insignis, the fluorescence signal intensity of Sulcia can be enhanced by the addition of helpers and/or heat shock when compared with that of the control group (Figure 6 and Figure 7). Although the fluorescence signal of Sulcia in H. maculaticollis can be significantly enhanced by the addition of helpers, Sulcia still exhibited quite a weak fluorescence signal under this treatment group (Figure 7). However, Sulcia of H. maculaticollis exhibits the brightest fluorescence signals by the addition of both heat shock and helpers when compared with that of the control group and the other two treatment groups (viz., the addition of only helpers or heat shock) (Figure 7). The Sulcia fluorescence signal intensities of the control group/heat shock group/helpers group/helpers + heat shock group in M. insignis, H. maculaticollis and E. coelestia are approximately 1:1.43:1.35:1.43, 1:0.92:2.07:3.32 and 1:1.89:2.07:2.27, respectively. Therefore, the addition of helpers or heat shock can enhance the fluorescence signal of Sulcia in H. maculaticollis, E. coelestia and M. insignis, but Sulcia exhibited the brightest signals by addition of both heat shock and helpers in these three species (Figure 6 and Figure 7).
The fluorescence signal intensity of Hodgkinia is generally similar under the control group and three treatment groups in E. coelestia and E. repanda (Figure 8). Hodgkinia of E. coelestia and E. repanda show bright fluorescence signals under the control group and also the three treatment groups (viz., the addition of helpers and/or heat shock). The addition of helpers or heat shock cannot significantly enhance the fluorescence signal of Hodgkinia in P. kaempferi when compared with that of the control group, but the fluorescence signal of Hodgkinia can be significantly improved by the addition of both heat shock and helpers (Figure 8). The Hodgkinia fluorescence signal intensities of the control group/heat shock group/helpers group/helpers + heat shock group in E. coelestia, E. repanda and P. kaempferi are approximately 1:1.04:0.98:0.93, 1:0.96:0.97:0.99 and 1:1.02:1.05:2.77, respectively.
The YLS of K. caelatata and M. insignis exhibited weak fluorescence signals without the addition of heat shock and helpers, whereas it still showed weak hybridization signals by the addition of helpers or heat shock in these two species (Figure 9). The fluorescence signal intensity of YLS can be significantly enhanced by the addition of both heat shock and helpers in K. caelatata and M. insignis when compared with that of the control group and other two treatment groups (viz., the addition of helpers or heat shock) (Figure 9). The fluorescence signal intensity of YLS in C. atrata can be significantly enhanced by the addition of heat shock and/or helpers when compared with that of the control group (Figure 9). Notably, YLS of K. caelatata, C. atrata and M. insignis exhibited the brightest fluorescence signal by the addition of both helpers and heat shock when compared with that of the control group and the other two treatment groups (viz., the addition of helpers or heat shock). YLS of H. maculaticollis exhibited a bright fluorescence signal under the control groups, which also showed quite a bright fluorescence signal under the three treatment groups (viz., the addition of helpers and/or heat shock). The YLS fluorescence signal intensities of the control group/heat shock group/helpers group/helpers + heat shock group in K. caelatata, C. atrata, M. insignis and H. maculaticollis were approximately 1:0.98:1.01:8.50, 1:2.46:1.88:3.60, 1:2.37:4.20:33.89 and 1:0.97:0.94:0.98, respectively.

2.4. The Predicted Secondary Structure of 16S rRNA/18S rRNA Gene Sequence of Symbionts in Seven Cicadas

For the secondary structure of 16S rRNA/18S rRNA gene sequences, a stem refers to consecutive base pairs with no unpaired bases separating them, and a hairpin loop refers to consecutive unpaired bases that are closed by one base pair (Figures S2–S5). The secondary structure of Sulcia 16S rRNA gene sequences is morphologically distinct among these seven cicada species, and the secondary structure of the Sulcia probe target region is also dissimilar in these cicadas (Figures S2 and S3). Three stems and three hairpin loops were shown in the secondary structure of the Sulcia probe target region in H. maculaticollis, E. coelestia, E. repanda and P. kaempferi (Figures S2 and S3). A stem and two hairpin loops were shown in the secondary structure of the Sulcia probe target region in K. caelatata and M. insignis (Figure S3). Three stems and four hairpin loops were shown in the Sulcia probe target region in C. atrata (Figure S3). The secondary structure of the Sulcia probe target region was generally similar among E. coelestia, E. repanda and P. kaempferi, which was also generally similar between K. caelatata and M. insignis (Figures S2 and S3). However, the secondary structure of the Sulcia probe target region was unique in C. atrata and H. maculaticollis (Figure S3).
The secondary structure of Hodgkinia 16S rRNA gene sequences is morphologically distinct among E. coelestia, E. repanda and P. kaempferi (Figure S4). Two stems and two hairpin loops were shown in the secondary structure of the Hodgkinia probe target region in two representative Hodgkinia lineages of E. coelestia. In contrast, four stems and four hairpin loops were shown in the secondary structure of Hodgkinia probe target region in a Hodgkinia lineage of E. repanda, whereas three stems and three hairpin loops were shown in the secondary structure of Hodgkinia probe target region in another Hodgkinia lineage of this cicada species. Two stems and two hairpin loops were shown in the secondary structure of the Hodgkinia probe target region in the two Hodgkinia lineages of P. kaempferi. Furthermore, the secondary structure of the Hodgkinia probe target site was dissimilar among E. coelestia, E. repanda and P. kaempferi, which was significantly distinct in different Hodgkinia lineages within a cicada species (Figure S4).
The secondary structure of YLS 18S rRNA gene sequences is morphologically distinct between C. atrata and H. maculaticollis (Figure S5). Four stems and four hairpin loops were illustrated in the secondary structure of the YLS probe target region in C. atrata. In contrast, four stems and three hairpin loops were shown in the secondary structure of the YLS probe target region in H. maculaticollis (Figure S5). The secondary structure of the YLS probe target region was dissimilar between these two species.

3. Discussion

3.1. Sample Preservation and Paraffin Section

The quality of preserved samples is quite important for the success of FISH experiments. Fresh animal samples should be immediately dissected and then preserved in the fixatives, which are closely related to the quality of FISH images. Sample fixation can preserve the integral morphology of the tissue samples and prevent cell lysis from enzymatic digestion. Sample fixation permeabilizes the cell membrane to make the rRNA-targeted oligonucleotide probe more easily diffuse to the intracellular rRNA-targeted site, thereby increasing the accessibility of the probe’s target region [2]. In certain cases, additional permeabilization steps, such as lysozyme treatment, may improve the permeability of cell walls of target microbes (e.g., some fungi) in order to enhance the accessibility of oligonucleotide probes [1]. The commonly used fixatives are ethanol, Carnoy solution and 4% paraformaldehyde for the fixation of animal samples, but there is still no standard protocol for sample fixation [1]. It is recommended to use the 100% ethanol or Carnoy solution for the fixation of fungi, including YLS, which contains an incrassate cell wall [21,23]. We recommend that samples be preserved in the freshly prepared fixatives, and the total volume of samples should be less than 10% of the volume of the fixative.
Paraffin sections are especially crucial for the quality of FISH images. It is important to optimize conditions for the paraffin infiltration, embedding and section. For example, the exposure time for dehydrating the animal tissues by soaking in absolute ethanol mainly depended on the type of specimens. Paraffin block was generally cut into 4 μm thick sections, which can be used for histological and fluorescence microscopy. We recommend consulting a technician who has rich experience in the paraffin sections when cutting tissue sections with a microtome for the first time. Future studies are required to explore whether other methods, including whole-mount in situ hybridization of dissected tissues, can improve the fluorescence signal intensities of related symbionts.

3.2. The Selection of rRNA-Targeted Probes for Hybridization Experiments

In contrast to polynucleotide probes, oligonucleotide probes can improve the precision in discriminating similar target sequences of microbes at the genus or species level, and they also easily access the probe target site of rRNA molecules [2]. Currently, the oligonucleotide probe is the most suitable probe used for FISH experiments. A fluorescently labeled oligonucleotide probe is generally 15–25 bp in length, which can be generated on an automated synthesizer [1]. We recommend using the published oligonucleotide probes, which have been successfully used to detect related microorganisms and obtain high-quality FISH images under confocal laser scanning microscopy. Furthermore, it is extremely important to check the identities of nucleotide sequence between oligonucleotide probe and 16S rRNA/18S rRNA gene sequence of microbe(s) with the Nucleotide-BLAST algorithm, aiming to determine whether there are some mismatches between probe sequence and probe target sequence.
In the present study, we revealed that the nucleotide sequence of the Sulcia probe shows 100% similarity with the 16S rRNA gene sequences of Sulcia symbionts in all cicadas (Figure 1 and Table S1). The Sulcia probe sequence exhibits 100% similarity with the 16S rRNA gene sequences of Sulcia symbionts in some leafhoppers and planthoppers, whereas it shows 95% similarity with the 16S rRNA gene sequences of Sulcia in some leafhoppers, planthoppers and treehoppers (Figure 1 and Table S2). We conclude that the Sulcia probe used in this study is suitable for all cicadas and some species of Auchenorrhyncha, but the similarity between the nucleotide sequence of the Sulcia probe with the 16S rRNA gene sequences of Sulcia symbionts in some other auchenorrhychans can be increased if a more suitable probe of Sulcia was selected.
We also revealed that the nucleotide sequence of the Hodgkinia-Ple probe shows 100% similarity with the 16S rRNA gene sequences of Hodgkinia symbionts in cicadas of the tribe Platypleurini, including P. kaempferi, E. coelestia and E. repanda, whereas it shows a relatively low similarity with the 16S rRNA gene sequences of Hodgkinia symbionts in some other cicada species such as T. undata (Figure 2 and Table S1). These results suggest that some oligonucleotide probes can be successfully used to obtain bright FISH images in some species (e.g., E. coelestia), but they may not be the most suitable probes in other species (e.g., T. undata). We conclude that the Hodgkinia-Ple probe is the most suitable probe for the detection of Hodgkinia symbionts in species of Platypleurini (e.g., P. kaempferi, E. coelestia and E. repanda), but it may be unsuitable for other species such as species of Auritibicen, Magicicada, Tettigetta, Kosemia and Tettigades.
We revealed that the nucleotide sequence of YLS probe shows 100% similarity with the 18S rRNA gene sequences of YLS symbionts in cicadas (Figure 3 and Table S1), and the nucleotide sequence of YLS probe exhibits 100% similarity with the 18S rRNA gene sequences of YLS symbionts in almost all planthoppers and leafhoppers, but it shows 64.71% and 100% similarity in the leafhopper F. septentrionalis in which YLS split into two lineages (Figure 3 and Table S2). These results indicate that the YLS probe used in this study is suitable for the detection of YLS in almost all cicadas, planthoppers and leafhoppers, but it is unsuitable for the detection of YLS in some auchenorrhynchan insects that harbor complex YLS lineages.
An oligonucleotide probe is generally labeled at the 5′ end of the probe sequence with fluorochromes such as CY3 and CY5. Several types of fluorochromes that have different excitation and emission parameters are commercially available, thereby simultaneously detecting two or more microbes using oligonucleotide probes labeled with different fluorochromes under a confocal laser scanning microscopy. These oligonucleotide probes could be stored in the dark for several months at −20 °C or −80 °C, and the success of FISH experiments is closely related to the storage conditions of probes. We recommend increasing the final concentration of probes used in the hybridization buffer when oligonucleotide probes have been stored for more than one year. Alternatively, it would be better to use a newly synthesized probe in FISH experiments. Microscopy observations should be performed as soon as possible after mounting the hybridization slides with the microscope glass coverslips. Additionally, we can search for some published oligonucleotide probes or design new probes under the publically available probe database (e.g., probeBase) following the guidelines [9]. Probes should be designed as previously described, including the 15–25 bases in length, 50–70% GC content and 50–60 °C Tm [1]. However, it is necessary to examine the specificity of a newly designed probe by conducting diagnostic PCR using an unlabeled oligonucleotide and a universal forward primer such as 16SA1 for the bacterial 16S rRNA gene [1].

3.3. The Enhancement of Fluorescence Signal Intensity in Symbionts by Addition of Unlabeled Helper Sequences and Heat Shock

Over the past three decades, FISH with rRNA-targeted oligonucleotide probe has become a widely used method in the detection of microorganisms in complex samples, including animal tissues and clinical specimens [1,2]. However, the FISH technique still suffers from some limitations, including unavailable probe binding sites of 16 rRNA or 18 rRNA, low cellular ribosome content and inaccessibility of the probe binding sites resulting in the weak or even absence of fluorescence signal intensity of targeted microbes, which may eventually lead to underestimation or misunderstanding of the density and distribution of related microbes [2].
It has been revealed that unlabeled oligonucleotides (helpers) binding to the adjacent probe target sites can open inaccessible rRNA regions for FISH with oligonucleotide probes, thereby increasing the hybridization signal intensities of the targeted microbe(s) [2,26,27]. Previous studies revealed that helpers binding adjacent to the probe target site can increase weak probe hybridization signals in Escherichia coli based on the results of flow cytometric analysis [26,27]. A previous study reported that the addition of helpers and heat shock greatly enhanced the FISH signal intensity of YLS in cicada Tanna sp. and K. caelatata, whereas the FISH signal intensity of Sulcia was generally similar between the control group and treatment group (viz., the addition of both helpers and heat shock) [23]. However, it is still unclear whether the addition of helpers and/or heat shock can improve the FISH signal intensity of YLS, Sulcia and Hodgkinia in other cicada species. In the present study, we revealed that the fluorescence signal intensity of Sulcia can be significantly enhanced by the addition of heat shock and/or helpers in M. insignis, H. maculaticollis and E. coelestia. Sulcia of these three species exhibited the brightest signals by the addition of both heat shock and helpers, although the fluorescence signal of Sulcia can be enhanced by the addition of helpers or heat shock (Figure 6 and Figure 7). The addition of helpers or heat shock cannot enhance the fluorescence signal of Hodgkinia in P. kaempferi when compared with that of the control group, but the fluorescence signal of Hodgkinia can be significantly improved by the addition of both heat shock and helpers (Figure 8). The fluorescence signal intensity of YLS can be significantly enhanced by the addition of heat shock and helpers in K. caelatata, C. atrata and M. insignis. Notably, the YLS of K. caelatata, C. atrata and M. Insignis exhibited the brightest fluorescence signal by the addition of both helpers and heat shock (Figure 9). Our results confirm that the fluorescence signal of Sulcia, Hodgkinia and YLS exhibited weak intensity without the addition of unlabeled oligonucleotides (helpers) and heat shock in some cicadas; however, it can be significantly improved by the addition of both helpers and heat shock. The results support the previous conclusion that modification by the addition of helpers and/or heat shock can enhance the FISH signal intensity of symbionts in insects and other animals [23,28,29]. These results suggest a potential mechanism that heat shock denaturing rRNA and proteins of related microbe(s) together with unlabeled helpers binding to the denatured rRNA prevent the re-establishment of the native secondary structure of rRNA and, therefore, suitable probe(s) can more easily access to the probe’s target sites of rRNA. Generally, the modified FISH technique by addition of both helpers and heat shock can significantly enhance the fluorescence signals of related symbionts, which exhibited quite low hybridization signals without the addition of them. Therefore, we recommend improving the fluorescence signals of related symbionts using a modified FISH technique through the addition of both helpers and heat shock, especially for symbionts that exhibit quite weak or even no hybridization signals using a standard FISH method. However, we cannot rule out the possibility that there may be some tightly closed regions on which the addition of helpers and heat shock fails to open the probe’s target sites.
The Sulcia fluorescence signal intensities of the control group/heat shock group/Helpers group/helpers + heat shock group in M. insignis, H. maculaticollis and E. coelestia were approximately 1:1.43:1.35:1.43, 1:0.92:2.07:3.32 and 1:1.89:2.07:2.27, respectively (Figure 6 and Figure 7). The YLS fluorescence signal intensities of the control group/heat shock group/helpers group/helpers + heat shock group in K. caelatata, C. atrata and M. insignis were approximately 1:0.98:1.01:8.50, 1:2.46:1.88:3.60 and 1:2.37:4.20:33.89, respectively. (Figure 9). We revealed that a stem and two hairpin loops were shown in the secondary structure of the Sulcia probe target region in K. caelatata and M. insignis. Three stems and four hairpin loops were shown in the target region of Sulcia probe in C. atrata. Three stems and three hairpin loops were shown in the secondary structure of Sulcia probe target region in H. maculaticollis, E. coelestia, P. kaempferi and E. repanda (Figures S2 and S3). Additionally, four stems and four hairpin loops were illustrated in the secondary structure of the YLS probe target region in C. atrata. In contrast, four stems and three hairpin loops were shown in the secondary structure of the YLS probe target region in H. maculaticollis. The secondary structure of the YLS probe target region was dissimilar between these two species (Figure S5). Presumably, different efficiencies of FISH signal intensity by the addition of helpers may be closely related to the differences in the secondary structure of the 16 rRNA/18 rRNA of symbionts in cicadas, which includes rRNA–rRNA or rRNA–protein interaction at some specific regions.
In summary, we revealed that Sulcia of K. caelatata, C. atrata, P. kaempferi and E. repanda exhibited bright fluorescence signals under the control group, and it also showed strong hybridization signals under the other three treatment groups (viz., the addition of helpers and/or heat shock) (Figure 6 and Figure 7). Similarly, Sulcia/Hodgkinia of E. coelestia and E. repanda showed bright fluorescence signals under the control groups and other three treatment groups (viz., the addition of helpers and/or heat shock) (Figure 6 and Figure 8). We hypothesize that the accessibility of the probe’s target region in some cicadas (e.g., E. coelestia and E. repanda) keep open even if without the addition of helpers and heat shock, and the oligonucleotide probe can easily access the probe’s target region of 16 rRNA/18 rRNA of symbionts. However, it is still necessary to search for the optimal conditions of each microbe, and the combination of these seems to be a good choice for the detection of two or more microbes under confocal microscopy in a FISH experiment.

4. Materials and Methods

4.1. Sample Collection and Dissection

The adults of seven cicada species were collected in the field during the cicada emergence period between 2019 and 2022. Detailed information on the seven cicadas has been listed in Table S3. The dissection of bacteriomes and fat bodies was performed as previously described [12]. Briefly, the bacteriomes and fat bodies were immediately preserved in 100% ethanol at a 4 °C refrigerator for histological and fluorescence microscopy.

4.2. Compared the Similarity between rRNA-Targeted Oligonucleotide Probe and 16S rRNA/18S rRNA Gene Sequence of Targeted Microbes

We checked the identities of the rRNA-targeted oligonucleotide probe and 16S rRNA/18S rRNA gene sequences of targeted microbe(s) (i.e., Sulcia, Hodgkinia and YLS) by the alignment of probe sequence and rRNA-targeted gene sequence(s) in the BLAST searches under the Nucleotide-BLAST program. The NCBI accession numbers of the 16S rRNA/18S rRNA gene sequence of symbionts in cicadas and other insects have been listed in the Supplementary Materials (Tables S4 and S5). Multiple alignments of the 16S rRNA/18S rRNA gene sequences of the symbionts (Sulcia, Hodgkinia and YLS) and related probe sequences were conducted using the MEGA version 11.0 as previously described [23]. The multiple alignment of sequences was exported as a FASTA file and then imported into the Jalview version 2.8.2 [30]. Jalview version 2.8.2 provides a choice for each of the color schemes available in the “Colour” menu, and alignment views can be exported in a range of ways via the “Export” submenu [30]. Sequence alignment was exported as Portable Network Graphic (PNG) raster images when preparing figures for publication.

4.3. Fluorescence In Situ Hybridization

The bacteriomes and fat bodies were dehydrated in a graded ethanol series (75% for 4 h, 85% for 2 h, 90% for 2 h, 95% for 1 h and 100% for 30 min twice), cleared four times in xylene for 2 h, and finally embedded with melted paraffin. Paraffin blocks were sectioned to 4 μm. Thin sections were used for fluorescence or histological microscopy. Sections used for histological microscopy were stained with hematoxylin and eosin, and the detailed protocol was the same as previously described [23]. Histological sections were finally mounted with neutral balsam (Sigma, Saint Louis, MI, USA) and photographed under a light microscope BX53M (Olympus, Tokyo, Japan).
The FISH assay was performed as previously described with some modifications [18,19,25]. We provided a schematic representation showing the oligonucleotide probe and unlabeled helpers binding to the rRNA of related symbionts (e.g., YLS, Sulcia and Hodgkinia) in cicadas (Figure S6). The detailed components of the hybridization buffer were listed in Supplementary Materials (Tables S6–S8). The sequences of all probes and helper sequences used in the present study were listed in Table 1 and Table S9, respectively. The detailed protocol for the hybridization was the same as previously described [23].
We compared the fluorescence signal intensities of YLS, Sulcia and Hodgkinia based on different treatments, aiming to explore whether the hybridization signals of these symbionts can be significantly enhanced by the addition of unlabeled helper sequences and/or heat shock (Tables S10–S12). The control group represents a hybridization buffer with no containing helpers (Table S7) and no addition of 95 °C heat shock before hybridization. The heat shock group represents the addition of 95 °C heat shock for 2 min before hybridization, but no addition of helpers in the hybridization buffer (Table S7). The helpers group represents the addition of helpers in the hybridization buffer (Table S8), but no addition of 95 °C heat shock for 2 min before hybridization. The heat shock + helpers group represents the addition of both helpers (Table S8) and heat shock. Briefly, each slide was carried out in a final volume of 50 μL hybridization buffer. Hybridization was conducted in a 37 °C humidified chamber overnight [28,29]. In addition, the negative control was performed using no probe staining to check the specificity of hybridization.
Slides were mounted in a commercially available antifade medium and immediately observed and imaged under an Olympus FV 3000 IX inverted laser scanning confocal microscope with a 20× air lens or 40× oil-immersion lens (Olympus, Tokyo, Japan). The image was acquired using the same parameters for the same type of symbiont of the same cicada species. Fluorescence signal intensities of hybridization sections were measured using the Image J version 1.5.3 software. For each treatment, we generally measured approximately 30 distinctly symbiont-harbored areas of the hybridization sections of related symbionts. The normality of data of different groups was initially examined using the Shapiro–Wilk test using SPSS version 27 and R 3.5.2 software (Tables S13–S15). We performed the nonparametric test (Kruskal–Wallis test) to determine the differences in the fluorescence signal intensities of symbionts under the control group and different treatment groups using SPSS version 27 software. Additionally, fluorescence signal intensities of the control group and three treatment groups were compared using the Kruskal–Wallis test for pairwise comparisons.

4.4. The Prediction of Secondary Structure of 16S rRNA/18S rRNA Gene Sequence of Symbionts in Six Cicadas

The 16 rRNA/18 rRNA gene sequences of symbionts (i.e., YLS, Sulcia and Hodgkinia) were predicted using Geneious Primer 2023.2 software according to the minimum free energy (MFE) methods, which is mainly based on the assumption that a DNA molecule folds into the MFE structure among all possible structures [8]. The predicted secondary structure was illustrated in the planar structure (DNA backbone). A DNA strand comprises four different bases, including guanine (G), adenine (A), thymine (T) and cytosine (C), and one base can connect to another base through the DNA backbone. A stem refers to consecutive base pairs with no unpaired bases separating them. In contrast, a hairpin loop refers to consecutive unpaired bases that are closed by one base pair [8].

5. Conclusions

We initially revealed that the probes of Candidatus Sulcia muelleri (Sulcia) and the yeast-like fungal symbiont (YLS) are suitable for detection of these symbionts in all cicadas and other insects of Auchenorrhyncha, whereas the probe of Candidatus Hodgkinia cicadicola (Hodgkinia) is only suitable for detection of Hodgkinia in a few cicada species. The fluorescence signal of Sulcia, Hodgkinia and YLS exhibited weak intensity without the addition of helpers and heat shock in some cicadas, which can be significantly improved by the addition of both helpers and heat shock. Our results provide new information for the improvement of hybridization signal intensities of microbes in the FISH experiments with modifications.

Supplementary Materials

The following supporting information can be downloaded at: https://www.mdpi.com/article/10.3390/ijms242115838/s1.

Author Contributions

Conceptualization, Z.H.; methodology, Z.H.; software, Z.H.; investigation, Z.H., J.Z. and D.W.; writing—original draft preparation, Z.H.; writing—review and editing, Z.H., H.H. and C.W.; visualization, Z.H.; supervision, H.H. and C.W.; funding acquisition, H.H. and C.W. All authors have read and agreed to the published version of the manuscript.

Funding

This study was supported by the National Natural Science Foundation of China (grant numbers 32270496 and 32070476).

Institutional Review Board Statement

Not applicable.

Informed Consent Statement

Not applicable.

Data Availability Statement

All sequences obtained in this study have been deposited in the NCBI nucleotide database.

Acknowledgments

We thank Guoliang Pei and Mi Huo (State Key Laboratory of Crop Stress Biology for Arid Areas, Northwest A&F University, China) and Zhenzhen Ma and Yan Li (College of Plant Protection, Northwest A&F University, China) for their technical assistance in microscopy observations.

Conflicts of Interest

The authors declare no conflict of interest.

References

  1. Engel, P.; James, R.R.; Koga, R.; Kwong, W.K.; McFrederick, Q.S.; Moran, N.A. Standard methods for research on Apis mellifera gut symbionts. J. Apic. Res. 2013, 52, 1–24. [Google Scholar] [CrossRef]
  2. Amann, R.; Fuchs, B.M. Single-cell identification in microbial communities by improved fluorescence in situ hybridization techniques. Nat. Rev. Microbiol. 2008, 6, 339–348. [Google Scholar] [CrossRef]
  3. Moter, A.; Göbel, U.B. Fluorescence in situ hybridization (FISH) for direct visualization of microorganisms. J. Microbiol. Methods 2000, 41, 85–112. [Google Scholar] [CrossRef]
  4. Masson, F.; Copete, S.C.; Schüpfer, F.; Garcia-Arraez, G.; Lemaitre, B. In vitro culture of the insect endosymbiont Spiroplasma poulsonii highlights bacterial genes involved in host-symbiont interaction. mBio 2018, 9, e00024-18. [Google Scholar] [CrossRef]
  5. Perreau, J.; Moran, N.A. Genetic innovations in animal-microbe symbioses. Nat. Rev. Genet. 2022, 23, 23–39. [Google Scholar] [CrossRef]
  6. Singh, B. Exploring microbial diversity for biotechnology: The way forward. Trends Biotechnol. 2010, 28, 111–116. [Google Scholar] [CrossRef]
  7. Ingolia, N.T.; Brar, G.A.; Rouskin, S.; McGeachy, A.M.; Weissman, J.S. The ribosome profiling strategy for monitoring translation in vivo by deep sequencing of ribosome-protected mRNA fragments. Nat. Protoc. 2012, 7, 1534–1550. [Google Scholar] [CrossRef]
  8. Hollar, A.; Bursey, H.; Jabbari, H. Pseudoknots in RNA structure prediction. Curr. Protoc. 2023, 3, e661. [Google Scholar] [CrossRef]
  9. Greuter, D.; Loy, A.; Horn, M.; Rattei, T. ProbeBase—An online resource for rRNA-targeted oligonucleotide probes and primers: New features 2016. Nucleic Acids Res 2016, 44, D586–D589. [Google Scholar] [CrossRef]
  10. Loy, A.; Horn, M.; Wagner, M. ProbeBase: An online resource for rRNA-targeted oligonucleotide probes. Nucleic Acids Res. 2003, 31, 514–516. [Google Scholar] [CrossRef]
  11. Loy, A.; Arnold, R.; Tischler, P.; Rattei, T.; Wagner, M.; Horn, M. ProbeCheck: A central resource for evaluating oligonucleotide probe coverage and specificity. Environ. Microbiol. 2008, 10, 2894–2898. [Google Scholar] [CrossRef]
  12. Huang, Z.; Wang, D.; Li, J.; Wei, C.; He, H. Transovarial transmission of bacteriome-associated symbionts in the cicada Pycna repanda (Hemiptera: Cicadidae). Appl. Environ. Microbiol. 2020, 86, e02957-19. [Google Scholar] [CrossRef]
  13. Luan, J.B.; Shan, H.W.; Isermann, P.; Huang, J.H.; Lammerding, J.; Liu, S.S.; Douglas, A.E. Cellular and molecular remodelling of a host cell for vertical transmission of bacterial symbionts. Proc. R. Soc. B 2016, 283, 20160580. [Google Scholar] [CrossRef]
  14. Michalik, A.; Franco, D.; Kobiałka, M.; Stroinski, A.; Łukasik, P. Alternative transmission patterns in independently acquired nutritional co-symbionts of Dictyopharidae planthoppers. mBio 2021, 12, e0122821. [Google Scholar] [CrossRef]
  15. Buchner, P. Endosymbiosis of Animals with Plant Microorganisms; Wiley Press: New York, NY, USA, 1965. [Google Scholar]
  16. Moran, N.A.; Tran, P.; Gerardo, N.M. Symbiosis and insect diversification: An ancient symbiont of sap-feeding insects from the bacterial phylum Bacteroidetes. Appl. Environ. Microbiol. 2005, 71, 8802–8810. [Google Scholar] [CrossRef]
  17. McCutcheon, J.P.; McDonald, B.R.; Moran, N.A. Convergent evolution of metabolic roles in bacterial co-symbionts of insects. Proc. Natl. Acad. Sci. USA 2009, 106, 15394–15399. [Google Scholar] [CrossRef]
  18. Łukasik, P.; Nazario, K.; Van Leuven, J.T.; Campbell, M.A.; Meyer, M.; Michalik, A.; Pessacq, P.; Simon, C.; Veloso, C.; McCutcheon, J.P. Multiple origins of interdependent endosymbiotic complexes in a genus of cicadas. Proc. Natl. Acad. Sci. USA 2018, 115, E226–E235. [Google Scholar] [CrossRef]
  19. Campbell, M.A.; Łukasik, P.; Meyer, M.M.; Buckner, M.; Simon, C.; Veloso, C.; Michalik, A.; McCutcheon, J.P. Changes in endosymbiont complexity drive host-level compensatory adaptations in cicadas. mBio 2018, 9, e02104-18. [Google Scholar] [CrossRef]
  20. Wang, D.; Liu, Y.; Su, Y.; Wei, C. Bacterial communities in bacteriomes, ovaries and testes of three geographical populations of a sap-feeding insect, Platypleura kaempferi (Hemiptera: Cicadidae). Curr. Microbiol. 2021, 78, 1778–1791. [Google Scholar] [CrossRef]
  21. Matsuura, Y.; Moriyama, M.; Łukasik, P.; Vanderpool, D.; Tanahashi, M.; Meng, X.Y.; McCutcheon, J.P.; Fukatsu, T. Recurrent symbiont recruitment from fungal parasites in cicadas. Proc. Natl. Acad. Sci. USA 2018, 115, E5970–E5979. [Google Scholar] [CrossRef]
  22. Wang, D.; Huang, Z.; Billen, J.; Zhang, G.; He, H.; Wei, C. Structural diversity of symbionts and related cellular mechanisms underlying vertical symbiont transmission in cicadas. Environ. Microbiol. 2021, 23, 6603–6621. [Google Scholar] [CrossRef]
  23. Huang, Z.; Zhou, J.; Zhang, Z.; He, H.; Wei, C. A study on symbiotic systems of cicadas provides new insights into distribution of microbial symbionts and improves fluorescence in situ hybridization technique. Int. J. Mol. Sci. 2023, 24, 2434. [Google Scholar] [CrossRef]
  24. Nishino, T.; Tanahashi, M.; Lin, C.P.; Koga, R.; Fukatsu, T. Fungal and bacterial endosymbionts of eared leafhoppers of the subfamily Ledrinae (Hemiptera: Cicadellidae). Appl. Entomol. Zool. 2016, 51, 465–477. [Google Scholar] [CrossRef]
  25. Van Leuven, J.T.; Meister, R.C.; Simon, C.; McCutcheon, J.P. Sympatric speciation in a bacterial endosymbiont results in two genomes with the functionality of one. Cell 2014, 158, 1270–1280. [Google Scholar] [CrossRef]
  26. Fuchs, B.M.; Wallner, G.; Beisker, W.; Schwippl, I.; Ludwig, W.; Amann, R. Flow cytometric analysis of the in situ accessibility of Escherichia coli 16S rRNA for fluorescently labeled oligonucleotide probes. Appl. Environ. Microbiol. 1998, 64, 4973–4982. [Google Scholar] [CrossRef]
  27. Fuchs, B.M.; Glöckner, F.O.; Wulf, J.; Amann, R. Unlabeled helper oligonucleotides increase the in situ accessibility to 16S rRNA of fluorescently labeled oligonucleotide probes. Appl. Environ. Microbiol. 2000, 66, 3603–3607. [Google Scholar] [CrossRef]
  28. Timoshevskiy, V.A.; Sharma, A.; Sharakhov, I.V.; Sharakhova, M.V. Fluorescent in situ hybridization on mitotic chromosomes of mosquitoes. J. Vis. Exp. 2012, 67, e4215. [Google Scholar]
  29. Sharma, A.; Kinney, N.A.; Timoshevskiy, V.A.; Sharakhova, M.V.; Sharakhov, I.V. Structural variation of the X chromosome heterochromatin in the Anopheles gambiae complex. Genes 2020, 11, 327. [Google Scholar] [CrossRef]
  30. Procter, J.B.; Carstairs, G.M.; Soares, B.; Mourão, K.; Ofoegbu, T.C.; Barton, D.; Lui, L.; Menard, A.; Sherstnev, N.; Roldan-Martinez, D.; et al. Alignment of biological sequences with Jalview. Methods Mol. Biol. 2021, 2231, C1. [Google Scholar]
Figure 1. Similarity between the nucleotide sequence of Sulcia probe and 16S rRNA gene sequences of Sulcia in cicadas and other representative auchenorrhynchan insects. Different color represents distinct DNA bases. Red font represents the cicada species used in this study.
Ijms 24 15838 g001
Figure 2. Similarity between the nucleotide sequence of Hodgkinia-Ple probe and 16S rRNA gene sequences of Hodgkinia in cicadas. Different color represents distinct DNA bases. Red font represents the cicada species used in this study.
Ijms 24 15838 g002
Figure 3. Similarity between the nucleotide sequence of YLS probe and 18S rRNA gene sequences of YLS in cicadas and other representative auchenorrhynchan insects. Different color represents distinct DNA bases. Red font represents the cicada species used in this study.
Ijms 24 15838 g003
Figure 4. Distribution of Sulcia and Hodgkinia in the bacteriomes and fat bodies of Eopycna coelestia, Eopycna repanda and Platypleura kaempferi. (AD) Sulcia in peripheral bacteriocytes and Hodgkinia in central bacteriocytes of bacteriomes in E. coelestia. (EH) Sulcia in peripheral bacteriocytes and Hodgkinia in central bacteriocytes of bacteriomes in E. repanda. (IL) Sulcia in peripheral bacteriocytes and Hodgkinia in central bacteriocytes of bacteriomes in P. kaempferi. For fluorescence microscopy, blue, red and green represent nucleus, Sulcia and Hodgkinia, respectively.
Ijms 24 15838 g004
Figure 5. Distribution of Sulcia and YLS in the bacteriomes and fat bodies of Karenia caelatata, Cryptotympana atrata, Macrosemia insignis and Hyalessa maculaticollis. (AD) Sulcia in bacteriocytes of bacteriomes and YLS in fat bodies of K. caelatata. (EH) Sulcia in bacteriocytes of bacteriomes and YLS in fat bodies of C. atrata. (IL) Sulcia in bacteriocytes of bacteriomes and YLS in fat bodies of M. insignis. (MP) Sulcia in bacteriocytes of bacteriomes, while YLS in fat bodies and bacteriome sheath of H. maculaticollis. For fluorescence microscopy, blue, yellow and red represent nucleus, YLS and Sulcia, respectively.
Ijms 24 15838 g005
Figure 6. Fluorescent microscopy showing the distribution and FISH signal intensities of Sulcia under different treatment groups and the control group in Eopycna coelestia, Eopycna repanda and Platypleura kaempferi. Fluorescent microscopy revealing the distribution and hybridization signal of Sulcia in bacteriomes of E. coelestia (AD), E. repanda (EH) and P. kaempferi (IL). Statistical analysis revealing the difference in the hybridization signal intensities of Sulcia in E. coelestia (M), E. repanda (N) and P. kaempferi (O), and different letters represent significant differences at the 0.05 level. For fluorescence microscopy, blue and red represent nucleus and Sulcia, respectively. Abbreviations: control, without addition of helpers and heat shock; helpers, hybridization buffer containing unlabeled oligonucleotides binding to the adjacent probe target sites; heat shock, addition of 95 °C heat shock for 2 min before hybridization; helpers + heat shock, addition of helpers and heat shock. Error bars represent the standard error in the column graph.
Ijms 24 15838 g006
Figure 7. Fluorescent microscopy showing the distribution and FISH signal intensities of Sulcia under different treatment groups and the control group in Karenia caelatata, Cryptotympana atrata, Macrosemia insignis and Hyalessa maculaticollis. Fluorescent microscopy revealing the distribution and hybridization signal of Sulcia in the bacteriomes of K. caelatata (AD), C. atrata (EH), M. insignis (IL) and H. maculaticollis (MP). Statistical analysis revealing the difference in the hybridization signal intensities of Sulcia in K. caelatata (Q), C. atrata (R), M. insignis (S) and H. maculaticollis (T), and different letters represent significant differences at the 0.05 level. For fluorescence microscopy, blue and red represent nucleus and Sulcia, respectively. Abbreviations: control, without addition of helpers and heat shock; helpers, hybridization buffer containing unlabeled oligonucleotides binding to the adjacent probe target sites; heat shock, addition of 95 °C heat shock for 2 min before hybridization; helpers + heat shock, addition of helpers and heat shock. Error bars represent the standard error in the column graph.
Ijms 24 15838 g007
Figure 8. Fluorescent microscopy showing the distribution and FISH signal intensities of Hodgkinia under different treatment groups and control group in Eopycna coelestia, Eopycna repanda and Platypleura kaempferi. Fluorescent microscopy revealing the distribution and hybridization signal of Hodgkinia in the bacteriomes of E. coelestia (AD), E. repanda (EH) and P. kaempferi (IL). Statistical analysis revealing the difference in the hybridization signal intensities of Hodgkinia under three treatment groups and control group in E. coelestia (M), E. repanda (N), and P. kaempferi (O), and different letters represent significant differences at the 0.05 level. For fluorescence microscopy, blue and green represent nucleus and Hodgkinia, respectively. Abbreviations: control, without addition of helpers and heat shock; helpers, hybridization buffer containing unlabeled oligonucleotides binding to the adjacent probe target sites; heat shock, addition of 95 °C heat shock for 2 min before hybridization; helpers + heat shock, addition of helpers and heat shock. Error bars represent the standard error in the column graph.
Ijms 24 15838 g008
Figure 9. Fluorescent microscopy showing the distribution and FISH signal intensities of YLS under different treatment groups and control group in Karenia caelatata, Cryptotympana atrata, Macrosemia insignis and Hyalessa maculaticollis. Fluorescent microscopy revealing the distribution and hybridization signal of YLS in fat bodies of K. caelatata (AD), C. atrata (EH), M. insignis (IL) and H. maculaticollis (MP). Statistical analysis revealing the difference in the hybridization signal intensities of YLS in K. caelatata (Q), C. atrata (R), M. insignis (S) and H. maculaticollis (T). Different letters represent significant differences at the 0.05 level. For fluorescence microscopy, blue and yellow represent nucleus and YLS, respectively. Abbreviations: control, without addition of helpers and heat shock; helpers, hybridization buffer containing unlabeled oligonucleotides binding to the adjacent probe target sites; heat shock, addition of 95 °C heat shock for 2 min before hybridization; helpers + heat shock, addition of helpers and heat shock. Error bars represent the standard error in the column graph.
Ijms 24 15838 g009
Table 1. Probes used for fluorescence in situ hybridization of Sulcia and YLS of two cicada species.
Probe NameSuitable for Host CicadasPrimer Sequence (5′–3′)References
SulciaAll speciesCCACACATTCCAGTTACTCC[18]
YLSAll speciesCCTGCCTGGAGCACTCT[21]
Hodgkinia-PleEopycna repanda, Eopycna coelestia, Platypleura kaempferiCCAGT GTGGC TGTCC GTThis study
Hodgkinia-Tet Tettigades undata, Diceroprocta semicinctaCCAAT GTGGC TGACC GT[25]
Hodgkinia-Mag Magicicada septendecimCCAAT GTGGC TGTYC RT [19]
Disclaimer/Publisher’s Note: The statements, opinions and data contained in all publications are solely those of the individual author(s) and contributor(s) and not of MDPI and/or the editor(s). MDPI and/or the editor(s) disclaim responsibility for any injury to people or property resulting from any ideas, methods, instructions or products referred to in the content.

